abstracts from the 9th dach+ conference on energy informatics
TRANSCRIPT
Energy InformaticsEnergy Informatics 2020, 3(Suppl 2):27https://doi.org/10.1186/s42162-020-00113-9
MEETING ABSTRACTS Open Access
Abstracts from the 9th DACH+ Conference
on Energy Informatics Sierre, Switzerland 29-30 October 2020Published: 30 October 2020
IntroductionWelcome message from the organizersRené Schumann1*, Michael Brand2 and Khoa Nguyen11 HES-SO Valais Wallis, SiLab, Rue de Technpole 3, 3960 Sierre, 3960Sierre, Switzerland; 2 OFFIS - Institut für Informatik, Escherweg 2, 26121Oldenburg, Switzerland.Correspondence: René Schumann ([email protected])Energy Informatics 2020, 3(Suppl 2):Introduction
Dear readers,In this supplemen of the proceedings of the DACH+ Energy Informat-ics 2020, we present the poster abstracts, including 10 from the mainconference submission and 6 from the co-located Energy InformaticsDoctoral Workshop. It is an important aspect to provide a space forthe debate about the most recent developments in the field and alsoits transfer to the real world, making an impact on our community.Therefore we are happy to share with you, the reader, the most re-cent developments, which we could discuss at the conference, andwhich gives us confidence that also in the following years we willhave interesting and relevant insights to be presented in future edi-tions of the DACH+ Energy Informatics. The innovative ideas comefrom a variety of topics within the field, such as network security,electric mobility, load forecast, etc.We hope you find the poster abstracts informative and inspiring forfuture collaboration.Sincerely,René SchumannGeneral ChairMichael BrandPoster ChairKhoa NguyenPublication Chair
AcknowledgementsNot applicable.
FundingPublication costs were covered by the DACH+ Energy InformaticsConference Organizers, supported by the SwissFederal Office of Energy.
Availability of data and materialsNot applicable.
Author’s contributionsThe authors read and approved the final manuscript.
© The Author(s). 2020 Open Access This articlewhich permits use, sharing, adaptation, distribuappropriate credit to the original author(s) andchanges were made. The images or other thirdlicence, unless indicated otherwise in a credit llicence and your intended use is not permittedpermission directly from the copyright holder.
Competing interestsThe authors declare that they have no competing interests.
P1Fuzzing of SCADA Protocols used in Smart GridsEugen Winter* and Michael RademacherFraunhofer FKIE, Cyber Analysis and Defense, Zanderstraße 5, 53117Bonn, GermanyCorrespondence: Eugen Winter ([email protected])Energy Informatics 2020, 3(Suppl 2):P1
SummaryA successful deployment and operation of smart grids depends onthe reliability and security of the protocols used to gather data fromthe various components. This work evaluates a technique called fuzz-ing to investigate the security of smart grid communication proto-cols. Based on a structured process for fuzzing in this specificdomain we develop a fuzzer that has been made publicly availableto ensure repeatability of the results and ease further security assess-ments of protocols and implementations. By applying this process toa well-known implementation of the IEC 61850 protocol, several bugshave been found and reported to the developers.Keywords: computer network security; IEC standards; industrialpower systems; power system control; fuzzingIntroductionToday’s energy grids are on the verge to become smart. The maindifference between a common grid widely used today and a smartgrid, aimed at in the near future, is the high level of digitizationwhich helps to handle more complex tasks in an efficient and effect-ive way [1]. The gathering of information from diverse componentsin the smart grid using well-defined communication protocols is im-perative. Consequently, several protocols have been proposed suchas IEC 61850, IEC 60870–5–104 or Modbus.A long-lasting blackout can have a severe impact on our daily lives.Therefore, a reliable operation of an energy grid is crucial. However,the increasing digitization of smart grids imposes a new threat — at-tacks on the digital infrastructure. Thus, information technology se-curity for smart grids is becoming an important factor.This work explores the security of the IEC 61850 protocol standardusing a technique called fuzzing. So called fuzzers provide unex-pected (i.e. random) data to a program and monitor its behavior. De-pending on the state of the input parser of that program, undesiredevents may be triggered such as crashes, built-in assertions ormemory-leaks. Such bugs are often used as a commencement for at-tacks and should be reported and fixed quickly.There are several studies that deal with fuzzing of the IEC 61850standard [2, 3, 4, 5, 6]. However, to the best of our knowledge, the
is licensed under a Creative Commons Attribution 4.0 International License,tion and reproduction in any medium or format, as long as you givethe source, provide a link to the Creative Commons licence, and indicate ifparty material in this article are included in the article's Creative Commons
ine to the material. If material is not included in the article's Creative Commonsby statutory regulation or exceeds the permitted use, you will need to obtain
To view a copy of this licence, visit http://creativecommons.org/licenses/by/4.0/.

Energy Informatics 2020, 3(Suppl 2):27 Page 2 of 29
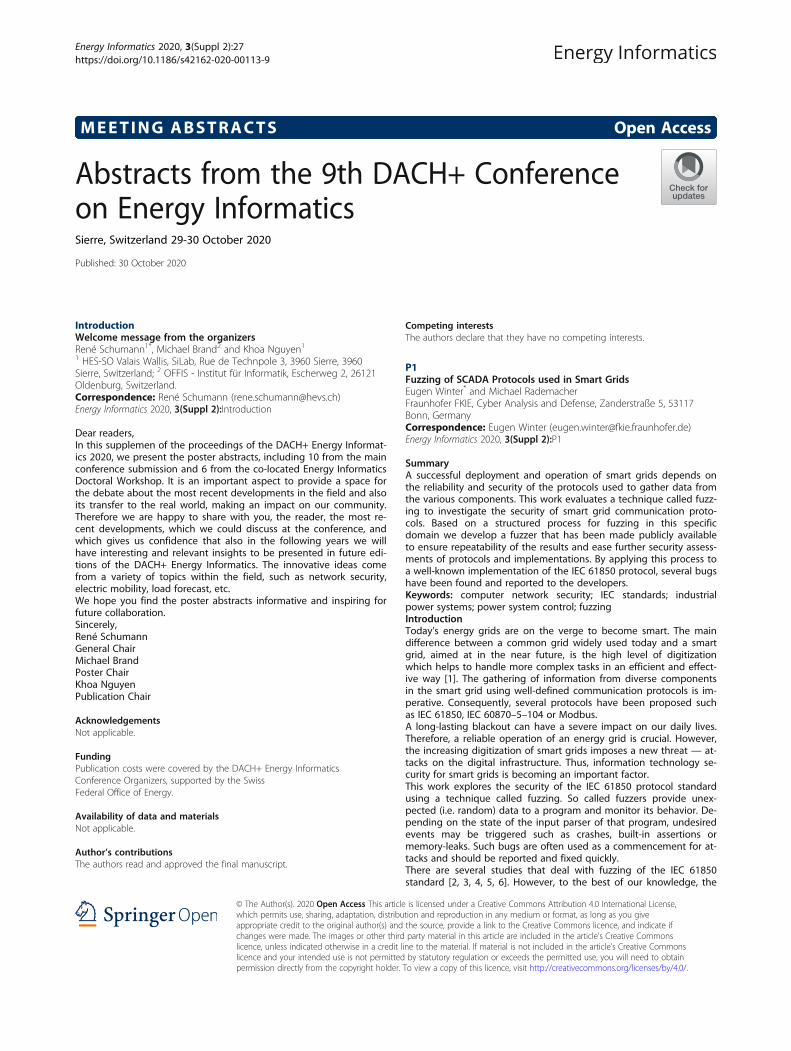
fuzzing tools of these studies were not published. Therefore, we orother researchers are unable to reproduce or build-upon the previ-ous results.In this work, we use fuzzing to reveal further unknown weaknessesin a frequently used implementation of the IEC 61850 protocol stand-ard. The fuzzer we developed will be made publicly available to im-prove future security analysis of communication protocols used inthe digital energy sector. In addition, we provide a description of ourmethodology to facilitate further experimentation.MethodologyThe generative fuzzing approach we propose is applied to an exist-ing open-source library of the IEC 61850 standard [7]. This library of-fers implementations of a Manufacturing Messaging Specification(MMS) server and Generic Object Oriented Substation Events(GOOSE) and Sampled Values (SV) subscribers. Since the library ispublicly accessible, regularly maintained, and a commercial licensewith support is offered, we assume that it is used in real hardwareand commercial projects.As fuzzing only reveals errors that cause the program to crash orhang, it would not detect internal software errors that might occurwithout resulting in a crash. To find such memory specific bugs wecompile the library with AddressSanitizer (ASan) [8, 9]. ASan is amemory error detector for C/C++ projects. By using it, the programunder test will crash whenever a memory bug is triggered. However,a certain trade-off exists. By using ASan the execution of the programis slowed down, which therefore also impacts the fuzzingperformance.Procedure for protocol fuzzingA protocol fuzzing procedure can be divided into several steps as il-lustrated in Figure 1. These steps can be used as a simple guidelineto lower the entry barrier for other researchers outside the securitydomain.Obtain Message Specifications When fuzzing protocol implementa-tions, the fuzzer must generate packets that comply with the proto-col specifications. To determine these specifications there are twogeneral possibilities. Study the official documentation of the protocol,or read and analyze packets using a network protocol analyzer likeWireshark [10]. Wireshark sniffs packets directly from a network inter-face and displays a detailed analysis of the packet using variousbuild-in dissectors. We use Wireshark to analyze the structure, fieldsand contents of IEC 61850 packets and to check whether the packetsgenerated by our fuzzer match this format.Create own packets Having captured and analyzed packets of the re-spective protocols, the next step is to create artificial packets. For thistask we use Boofuzz, which is a well-known open-source networkprotocol fuzzing framework [11, 12]. It simplifies the creation of a fuz-zer by taking care of crash detection, target reset after failure, record-ing of test data and also simplifies the definition of packets. Tocreate messages, we copy the message in hex representation fromWireshark as an escaped string and paste it into the fuzzing script.Afterwards, the message is divided into any desired level of detail ac-cording to the individual fields. Dividing the message into blocks hasthe advantage that the code is more legible and that single blocksmay be directly addressed by their corresponding name. This allowsfor example calculating a checksum for a certain block, if this is ex-pected by the protocol.Decide what should be mutated To realize the mutation we use the srandom function of Boofuzz. This function creates a random datachunk using a byte-wise mutation while keeping a copy of the ori-ginal data [12]. The function parameter num mutations specifies theamount of mutations. In addition, a random length range can bespecified by altering min length and max length. The decision whichfields of the message should be mutated is incumbent to the re-searcher. In this work, we mutate almost every field, set the randomlength range to 0–100 and set the number of mutations to 100000per data chunk. Only essential attributes like destination, source orethertype remain unchanged.
Start fuzzing Before starting the actual fuzzing, it has to be ensuredthat the program being fuzzed is observed and checked for crashes.For this purpose, Boofuzz offers a process monitor which must bestarted before the fuzzing process. We analyzed all three imple-mented sub-protocols and fuzzed the MMS server as well as theGOOSE and SV subscribers. The fuzzing processes terminated whenthe number of defined mutations was reached.Found Crash? To determine whether a crash was found, the outputof the fuzzer or process monitor can be examined and searched formessages that report a crash. Alternatively, the fuzzing logs stored inSQLite databases created by Boofuzz can be used. If the fuzzing doesnot lead to any crashes, it should be double-checked if the packetssent by the fuzzer correspond to the required format. In addition, itis advisable to mutate other fields or to create additional types ofmessages.Analyze Crash Having found a crash, it has to be analyzed manually.Not every crash is equal to a new software bug, because often onebug is triggered multiple times during fuzzing. To determine whetherthe crash is unique and what caused it, the source code must be an-alyzed. A first aspect that should be checked is whether the crashcan be reproduced without fuzzing. If this is the case, the next checkis whether it occurs without ASan. This would indicate that the pro-gram crashes with a standard compilation when it receives the inputand that the fuzzer would have detected it without further help. Tounderstand and possibly fix the bug, a deeper analysis of the in-volved code is necessary. A first indication to find the source of erroris to see which part of the packet has been mutated. An additionalstarting point, if available, is the crash documentation of ASan. Ittraces the crash through all instructed files and also presents the linenumber of the file where the error is located. At this point, it is pref-erable to investigate and navigate through the code and to under-stand the exact procedure that causes the error using a debugger.Report Bug If a crash has been found and a security researcher is ableto reproduce and explain the bug, it should be reported to the soft-ware developer or maintainer. This ensures that the bug can be fixedbefore attackers can find and exploit it.Results and Future WorkUsing the simple process illustrated in this work, we fuzzed an open-source project implementing the IEC 61850 standard. Thereby wefound crashes that could be traced back to four different errors —one in the MMS server, one in the GOOSE subscriber and two in theSV subscriber. All four errors could be reproduced without the usageof ASan and led to segmentation faults in form of illegal read mem-ory access where the program tries to read from the zero page. Theycould be exploited by an attacker to conduct a Denial-of-Service at-tack and thus, should be fixed urgently.All bugs found during our research were reported to the projectmaintainer via GitHub issues and will hopefully be fixed in the nearfuture.Future WorkIn addition to the server/subscriber implementations of the protocolsused in the IEC 61850 standard, we plan to analyze the client/pub-lisher side in future work.Furthermore, we want to extend the spectrum of protocols andanalyze for example the IEC 60870–5–101 and IEC 60870–5–104 pro-tocols. Since there are only few open-source implementations ofsuch protocols, we plan to apply fuzzing on real hardware. Thiswould ensure an analysis of software that is used in a realenvironment.Another goal for the future is to work towards a smarter fuzzer,which could possibly take into account a feedback based on codecoverage.
FundingPublication costs were covered by the DACH+ Energy InformaticsConference Organizers, supported by the Swiss Federal Office of Energy. The

Energy Informatics 2020, 3(Suppl 2):27 Page 3 of 29
authors acknowledge the financial support by the Federal Ministry forEconomic Affairs and Energy of Germany in the project FlexHub.
Availability of data and materialsAdditional material including the developed fuzzer is available at https://github.com/fkie-cad/61850-fuzzing.
Author’s contributionsEW implemented the fuzzing framework and did the experiments. MRdiscussed the results and edited the article.
Competing interestsThe authors declare that they have no competing interests.
References1. EU Commission Task Force for Smart Grids: Expert Group 1:
Functionalities of smart grids and smart meters (2010)2. Yang, Y., Jiang, H., McLaughlin, K., Gao, L., Yuan, Y., Huang, W., Sezer, S.:
Cybersecurity test-bed for iec 61850 based smart substations. In: IEEEPower & Energy Society General Meeting, pp. 1–5 (2015). IEEE
3. Jiwen, C., Shanmei, L.: Cyber security vulnerability assessment for smartsubstations. In: IEEE PES Asia-Pacific Power and Energy Engineering Con-ference, pp. 1368–1373 (2016). IEEE
4. Tilaro, F., Berges, M.G.: Iec 61850 industrial communication standardsunder test. In: Proceedings of the 14th International Conference onAccelerator & Large Experimental Physics Control Systems (2014)
5. Tu, T., Zhang, H., Qin, B., Chen, Z.: A vulnerability mining system based onfuzzing for iec 61850 protocol. In: 5th International Conference onFrontiers of Manufacturing Science and Measuring Technology (2017).Atlantis Press
6. Kim, S., Jo, W., Shon, T.: A novel vulnerability analysis approach togenerate fuzzing test case in industrial control systems. In: IEEEInformation Technology, Networking, Electronic and Automation ControlConference, pp. 566–570 (2016). IEEE
7. mz-automation: libiec61850. GitHub (2020)8. Serebryany, K., Bruening, D., Potapenko, A., Vyukov, D.: Addresssanitizer: A
fast address sanity checker. In: Presented as Part of the USENIX AnnualTechnical Conference, pp. 309–318 (2012)
9. google: AddressSanitizer. GitHub (2019)10. Orebaugh, A., Ramirez, G., Beale, J.: Wireshark & Ethereal Network
Protocol Analyzer Toolkit, 1st edn. Elsevier Science, Amsterdam (2006)11. Pereyda, J.: boofuzz: Network Protocol Fuzzing for Humans. GitHub
(2020)12. Pereyda, J.: boofuzz Documentation (2019)
Fig. 1 (abstract P1). General Procedure for Protocol Fuzzing.
P2Improving Microgrid Autonomy with Reinforcement LearningElectric Vehicle (Dis) Charging AlgorithmsKevin Shimotakahara1*, Arne Surmann2, Robert Kohrs3, Melike Erol-Kantarci4 and Karin Hinzer51MASc Candidate, University of Ottawa; 2Researcher, Group Smart GridICT, Department Smart Grids, Fraunhofer ISE; 3Head, Department SmartGrids of Fraunhofer ISE; 4Associate Professor, School of ElectricalEngineering and Computer Science, University of Ottawa; 5Professor,School of Electrical Engineering and Computer Science, University ofOttawaCorrespondence: Kevin Shimotakahara ([email protected])Energy Informatics 2020, 3(Suppl 2):P2
SummaryOur research investigates the usage of multi agent reinforcementlearning (RL) based electric vehicle (EV) charging strategies to im-prove the photovoltaic (PV) energy self consumption share of a smallenergy community. Our RL agents were faced with the task of balan-cing local energy demand and supply with their minute-by-minutecharging set point decisions. To test the two different versions of ouralgorithm, we simulated a year’s worth of energy community activitywith high fidelity stochastic models of residential energy consump-tion and EV usage habits. A local PV generation source was alsomodeled using real PV data measurements. The results suggest thatRL methods can improve an energy’s self consumption share relativeto a “business as usual” charging strategy. The version of our algo-rithm that was only permitted to perform charging actions improvedthe self consumption share by 6.4%, while our charging-dischargingalgorithm improved the self consumption share by 16.7%.Keywords: electric vehicle; charging; expected SARSA; reinforcementlearningIntroduction and Related WorkA self sufficient local energy community (micro grid) benefits from el-evated energy security [1]; autonomy in deciding the generationsource of their energy; and having an economic alternative to pur-chasing energy from their local distribution company [2]. Nonethe-less, balancing local generation and demand is challenging in anenergy community that contains non-controllable energy generation,e.g. photovoltaic power sources. A promising solution to improvingthe flexibility of local energy dispatch is the use of the energy com-munity’s EVs as storage devices that can consume intermittent localrenewable energy generation surpluses and then re-inject this en-ergy at a later time when needed by the community [3].We are currently studying the application of RL based methods tothis distributed, EV-enabled load balancing problem by investigatingthe performance of RL-based controllers that decide EV charging/dis-charging power flow set-points on a minute time scale.In recent years, RL based approaches to EV charging have begun tobe investigated. However, the time resolution of the decision makingprocesses characterized by most works are usually very coarse, i.e. onthe order of hours or days [4, 5, 6, 7], or rely on tabular methods thathave inherently low scalability [8, 9, 10, 11]. Shin et al. [12] is perhapsthe first to attempt using RL to control the charging/discharging ac-tions of multiple battery storage system agents on a minute-resolution time scale.Because of this, the problem Shin et al. is trying to solve is similar toours. However, our agents attempt to leverage the intermittentlyavailable energy storage potential of EVs while they are parked for acharging session. Also, our approach relies on less information ex-change between the agents present in the system; the simplest ver-sion of our algorithm does not require any communication beyondthe use of smart meters. Moreover, we use a simpler action value ap-proximation approach, and leverage action preference functions inour policy to inject hard operation constraints into the decision mak-ing process of the RL agent.System Model and Problem StatementThe energy community model we use for our experiment consists offive apartments, four electric vehicles, and one communal PV plant.The consumption of both the non-controllable loads of the apart-ment dwellings and the controllable loads of the EVs are influencedby realistic behaviour models (see [13, 14] for model details) of eachapartment’s tenants. Moreover, a local PV generation source basedon the 2013 generation output of a real PV plant in Freiburg is in-cluded in this energy community; is assumed that the cost of con-suming its energy is significantly lower than consuming energy fromthe power grid. The energy consumers also have access to an exter-nal power grid.Two different scenarios for our energy community are considered,which differ in the availability of smart grid technology. In the firstscenario, infrastructure is such that it prohibits EVs from dischargingenergy into the community. In the second scenario, we postulate in-frastructure capable of facilitating EV energy discharging.The self consumption share of an energy community is the percent-age of energy consumed sourced from their own energy generation
Energy Informatics 2020, 3(Suppl 2):27 Page 4 of 29
sources relative to their overall consumption, which includes bothlocal and grid sourced energy. The only controllable parameters thatcan influence the self consumption share in the modeled energycommunity are the charging/discharging set point values of each EVchosen at each time step. Thus, we can formulate our problem asthe maximization of the average self-consumption share experiencedover some period of time via the optimization of EV charging/dis-charging set-points.Reinforcement Learning Enabled EV (Dis)ChargingThe EV charging agents must maximize the energy community’s selfconsumption share while meeting the charging requirements of EVsbefore they depart. Every minute, the EV charger must decide a newrate of charge (i.e. the charging “set point”) for the EV in a mannerthat provides a feasible solution to this problem. From a Markov De-cision Process (MDP) perspective, the environment is the EV andpower system, while the agent is the charging controller. The agent’saction space is characterized by the finite charging set point deci-sions that can be made at each time step. The state of the environ-ment has been characterized with four state dimensions based ontime remaining in the charging session, past PV consumption,current EV energy demand, and the time of day. Reward is character-ized as the net amount of local energy that the agent consumes as aconsequence for the past minute’s charging set point decision. Thus,if the agent consumes more grid energy than local energy, it receivesnegative reward, and vice versa.The agent uses Expected SARSA as its RL method, which is an off-policy, model free, temporal difference (TD) based method [15]. Tohandle the moderately large dimensionality and continuous statevariables present in this MDP, the action values for a state are beingapproximated by a four-dimensional tile coder. Tile coders are acomputationally efficient means to representing continuous states asa binary vector with a size equal to the number of “tilings” times thenumber of “tiles” per tiling used to partition a continuous state space[15].To avoid needing to design a reward that can incentivize the agentto meet the charging needs of the EV, an action preference function[15] was designed to limit actions that are guaranteed to result in afailed charging objective given the current state. Moreover to en-force the operational constraints of the battery, the action preferencefunction was also designed to restrict actions that would either satur-ate the battery when its SOC is high, or reduce the SOC to a criticallylow level. We have defined the policy of our agent (the probabilitydistribution used by the agent to decide which action to take) usinga soft-max function that transforms action preference values into avalid probability distribution.ResultsFor both smart grid scenarios, we trained EV charging agents overone year’s worth of simulated energy community activity, and thentested the agents’ ability to operate over a year’s worth of previouslyunseen activity. For the charge only scenario, the self consumptionshare of the energy community increased from 28.4% to 34.8%.When considering the EV activity only, their collective self consump-tion share increased from 21.5% to 43.0%.For the charging-discharging experiment, the community self con-sumption share increased from 28.4% to 45.1% when the RL algo-rithm was used instead of the baseline “business as usual” approach.As with the charge-only experiment, this figure of merit was calcu-lated over the course of the simulated activity where at least one EVagent was connected to the micro grid.Interestingly, the self consumption share of the EVs only increasedfrom 21.5% to 37.1%, which is less than the charge-only experimentdespite the overall self consumption share of the charging-discharging experiment being higher. This is caused by EVs dischar-ging energy into the non-controllable loads, and increasing their selfconsumption share at the expense of making the EVs have to chargemore often to meet their own needs. It appears that the resultant de-mand increase of the EVs reduced their self consumption share, butthe overall respective increases and decreases in PV consumptionand grid consumption in the energy community made up for it.Currently, neither the reward function nor action preference functionof our algorithm enforce grid operation constraints such as rapid
charging/discharging cycles and demand fluctuations. Nonetheless,now that promising self-consumption share metrics have beenachieved, we can focus on incorporating these technical constraintsinto our algorithm in future work.
FundingPublication costs were covered by the DACH+ Energy InformaticsConference Organizers, supported by the Swiss Federal Office of Energy.The work presented has been conducted in the EnStadt:Pfaff project. Theresearch leading to these results has received funding from the GermanMinistry of Education and Research (BMBF) and the Ministry for Economicsand Energy (BMWi).This work was supported by the Natural Sciences and Engineering ResearchCouncil of Canada (NSERC) under Grant 201703995; NSERC CGS-M and CGS-MSFSS scholarships; and the Collaborative Research and Training ExperienceProgram (CREATE) under Grant 497981. This work was also supported by theUniversity of Ottawa International Experience Scholarship.
Availability of data and materialsFor the data used in producing the simulated energy community’sconsumption habits, consult Arne Surmann [email protected]. Dissemination of information will bepermitted on a case-by-case basis.
Author’s contributions
� Kevin Shimotakahara: Primary researcher, created abstract,characterized problem, formulated and programmed reinforcementlearning based solution, produced results
� Arne Surmann: Project supervisor, produced experiment scenarios,identified figures of merit, synPRO developer, reviewed abstract
� Robert Kohrs: Organized and hosted Fraunhofer-University ofOttawa collaboration, consulted regularly during project meetings
� Karin Hinzer and Melike Erol-Kantarci: Thesis Co-supervisors ofKevin Shimotakahara, organized University of Ottawa-Fraunhofercollaboration, consulted regularly during project meetings
Competing interestsThe authors declare that they have no competing interests.
References1. Chen, C., Wang, J., Qiu, F., Zhao, D.: Resilient distribution system by
microgrids formation after natural disasters. IEEE Transactions on SmartGrid 7(2), 958–966 (2016)
2. Hernandez, D.: Las vegas casinos seek to power their bright lights withrenewable energy. The Guardian (2016). Accessed 2020-08-08
3. Braam, F., Gross, A., Mierau, M., Kohrs, R., Wittwer, C.: Coordinated chargemanagement for battery electric vehicles. Comput. Sci. 32(1–2), 183–193(2017)
4. Chi¸s, A., Lundén, J., Koivunen, V.: Reinforcement learning-based plug-inelectric vehicle charging with forecasted price. IEEE Transactions on Ve-hicular Technology 66(5), 3674–3684 (2017)
5. Chi¸s, A., Lundén, J., Koivunen, V.: Optimization of plug-in electric vehiclecharging with forecasted price. In: 2015 IEEE International Conference onAcoustics, Speech and Signal Processing (ICASSP), pp. 2086–2089 (2015)
6. Wan, Z., Li, H., He, H., Prokhorov, D.: Model-free real-time ev chargingscheduling based on deep reinforcement learning. IEEE Transactions onSmart Grid 10(5), 5246–5257 (2019)
7. Sadeghianpourhamami, N., Deleu, J., Develder, C.: Definition andevaluation of model-free coordination of electrical vehicle charging withreinforcement learning. IEEE Transactions on Smart Grid 11(1), 203–214(2020)
8. Chang, F., Chen, T., Su, W., Alsafasfeh, Q.: Charging control of an electricvehicle battery based on reinforcement learning. In: 2019 10thInternational Renewable Energy Congress (IREC), pp. 1–63 (2019)
9. Ye, X.Z., Ji, T.Y., Li, M.S., Wu, Q.H.: Optimal control strategy for plug-in elec-tric vehicles based on reinforcement learning in distribution networks. In:2018 International Conference on Power System Technology (POWER-CON), pp. 1706–1711 (2018)
10. Shaarbaf, M.R., Ghayeni, M.: Identification of the best charging time ofelectric vehicles in fast charging stations connected to smart grid based

Energy Informatics 2020, 3(Suppl 2):27 Page 5 of 29
on q-learning. In: 2018 Electrical Power Distribution Conference (EPDC),pp. 78–83 (2018)
11. Dang, Q., Wu, D., Boulet, B.: A q-learning based charging schedulingscheme for electric vehicles. In: 2019 IEEE Transportation ElectrificationConference and Expo (ITEC), pp. 1–5 (2019)
12. Shin, M., Choi, D., Kim, J.: Cooperative management for pv/ess-enabledelectric vehicle charging stations: A multiagent deep reinforcementlearning approach. IEEE Transactions on Industrial Informatics 16(5),3493–3503 (2020)
13. Fischer, D., Härtl, A., Wille-Haussmann, B.: Model for electric load profileswith high time resolution for German households. Energy and Buildings92, 170–179 (2015)
14. Fischer, D., Harbrecht, A., Surmann, A., Mckenna, R.: Electric vehicles‘impacts on residential electric local profiles – A stochastic modellingapproach considering socio-economic, behavioural and spatial factors.Applied Energy 233-234 (2019)
15. Sutton, R.S., Barto, A.G.: Reinforcement Learning: An Introduction. ABradford Book, Cambridge, MA, USA (2018)
P3The impacts of propulsion technologies on a sector-coupledenergy storage system with 100 % renewable energiesTobias Riedel1* and Martin Zimmerlin21FZI Research Center of Information Technology, Haid-und-Neu-Str. 14a,76131 Karlsruhe, DE; 2Karlsruhe Institute of Technology, Engesserstr. 11,76131 Karlsruhe, DECorrespondence: Tobias Riedel ([email protected])Energy Informatics 2020, 3(Suppl 2):P3
SummaryTo ensure a safe energy supply with fluctuating renewable energies,large storage systems for all sectors - electricity, transportation, andheating - are essential. In this work, a possible sector-coupled long-term storage system for Germany as a whole is modeled on an ab-stract level. The energy demand of the transportation sector is calcu-lated in three scenarios, considering propulsions that are run mainlyon batteries, hydrogen, or synthetic fuels. The need of storage sys-tems is calculated by an optimized operation with scaled historicdata of PV and wind power feed-in and energy demand at the sametime (2015-2017). As a result of the optimization, the most efficientand economic scenario is the one with a focus on battery-electrictransport, which also leads to a large capacity of second-life batteries.Hydrogen and methane are by far the largest storages in allscenarios.Keywords: transportation; electric mobility; storage; hydrogen; sectorcoupling; power-to-X; second-life batteries; energy system analysisIntroductionCurrently, nearly the whole energy demand for transportation isbased on fossil fuels. In order to shift the whole energy system to-wards renewable energies, all means of transport somehow need topowered by renewable energies as well. To achieve that, mainlythree propulsion technologies are discussed: Battery-electric propul-sions (BEV), electric propulsions powered by fuel cells (FC) and con-ventional internal combustion engines (ICE) which are run bysynthetic fuels. Each of those options has basically two impacts onthe energy system: Firstly, because of different efficiencies, the totalenergy demand for transportation changes significantly and sec-ondly, the storage medium - batteries, hydrogen and methane - canbe used to balance fluctuating renewable feed-in. There are a lot ofscientific estimations about how a renewable energy system couldlook like in the future, based on assumptions on efficiency improve-ments and cost development of storage technologies. For example,[1] models a possible energy system in the year 2050 in detail, butthe authors assume the transportation sector to be run to 30 % byBEV in 2050 and don’t discuss it further. [2] discusses different pro-pulsion technologies for 2040, including assumed efficiency improve-ments and energy imports, but doesn’t examine the impacts on thestorage system. In this work, we didn’t try to make a future progno-sis, but examined the variation of propulsion technologies given to-day’s end energy demand of Germany, which is completely met byrenewables in our model.
Energy demandElectricity demand today (that is not used for residential heating andtransportation) makes up only 19 % of the end energy demand ofGermany which had an average annual value of 2495.4 TWh in theyears 2015 - 2017 [3]. The highest share of 51 % accounts for heat-ing, followed by the transportation sector which sums up to 30 % ofthe energy demand. We assume that most of the thermal energy de-mand can be stored in thermal storage systems, e.g. hot water tanks.In the model, we distinguish between low-temperature demand,which is warm water and space heating (except district heating) thatcan also be provided by heat pumps, and high-temperature demand,which is district heating and industrial process heat. Heat power de-mand for industrial heat is assumed to be constant while residentiallow and high temperature heat depend on the daily temperature.Therefore, daily temperature data [4] in the examined years is usedtogether with the standard load profile (P0) to generate the residen-tial load profile. The electricity demand and PV and wind supply istaken from [5] whereby latter is scaled to meet the total energydemand.To calculate the end energy demand for transportation, current en-ergy demand for transportation is changed by efficiencies of fuelproduction found in [6] and [7], including hydrogen compression orliquefaction where necessary. Based on [8] and [7], energy demandof different modes of transport is reduced by efficiency factors com-pared to ICEs today. We set up three scenarios with different sharesof propulsion technologies, based on discussions about the potentialof each technology. For each scenario, the total energy demand forthe transportation sector can be calculated. Furthermore, the totalcapacity of all BEVs is calculated based on assumed capacities ofeach vehicle. According to [9], it is assumed that 80 % of that cap-acity can be used as second-life batteries.In the model, the electrical power demand for charging battery-electric cars follows a standardized 15-minute load curve that con-siders the weekday, supplied by the institute KIT-IEH. Dynamic char-ging is not considered here. The time-dependent fuel demand andthe charging power for all other BEVs are assumed to be distributedequally over the year.Storage and conversion technologiesStorage and conversion technologies are modeled by their currentlystored energy et and their current power pt at a certain time-step t.Second-life batteries, pumped storage hydro power, hydrogen (eH2)
and methane and low and high temperature heat storages are takeninto account as storage technologies. To convert energy betweenthose storages, battery periphery, pumps/turbines, electrolysis (pEly),
metha-nation, fuel cells (pFC), combined heat and power plants(CHPP), heat pumps and heating resistors for low (RLT) and hightemperature (RHT) applications are considered. To describe the rela-tionship, the efficiencies of all conversion technologies (ηEly, ηFC),coefficient of performance of heat pumps, and cooling losses of ther-mal storages are needed. Except batteries and pumped hydro stor-age, all storages also reduce their energy by the current demand forfuels (dH2trans), and heating applications. Equation 1 shows the model-ing of all storages exemplary for hydrogen.
eH2; t þ 1 ¼ eH2; t
þ Δt ηEly � pEly; t − 1ηFC
� pFC; t� �
− dH2trans; t
ð1ÞOptimizationThe optimization problem minimizes the quadratic investment costsfor the storage and conversion technologies in all time-steps. Thequadratic form is chosen to avoid high peaks if power and capacitiesover time, since actually only the extreme values have to beminimized.
min x!TH x!þ f
!Tx!
� �: ð2Þ
The vector x~ contains the stored energy and conversion power forall time-steps. The Hessian H is a sparse diagonal Matrix that contains

Table 1 (abstract P3). Shares of propulsion systems in 3 scenarios
Scenario 1 Scenario 2 Scenario 3
Cars 100 % BEV 50 % BEV, 50 %FCEV
50 % ICE, 40 % FCEV, 10 %BEV
Trucks 100 % BEV 10 % BEV, 90 %FCEV
70 % ICE, 30 % FCEV
Busses 100 % BEV 10 % BEV, 90 %FCEV
70 % ICE, 30 % FCEV
Airplanes 10 % BEV, 90 %H2
100 % H2 100 % synfuel
Inland vessels 100 % FCEV 100 % FCEV 100 % ICE
Trains (nowire)
100 % BEV 100 % FCEV 100 % ICE
Table 2 (abstract P3). Results
Scenario1
Scenario2
Scenario3
Energy demand for transportation [TWh]Second-life batteries [TWh]
488.32.469
614.01.437
965.10.283
Storage capacity
Batteries [TWh] 1.3 1.4 0.3
Hydrogen [TWh] 25.3 29.8 30.3
Methane [TWh] 58.2 54.3 57.1
High temp. heat [TWh] 23.7 18.4 22.8
Low temp. heat [TWh] 5.1 5.3 6.1
Conversion power
Batteries [GW] 193 139 148
Electrolysis [GW] 226 238 255
Methanation [GW] 220 195 276
Fuel Cells [GW] 26 29 66
CHPP [GW] 135 131 84
RHT [GW] 354 335 420
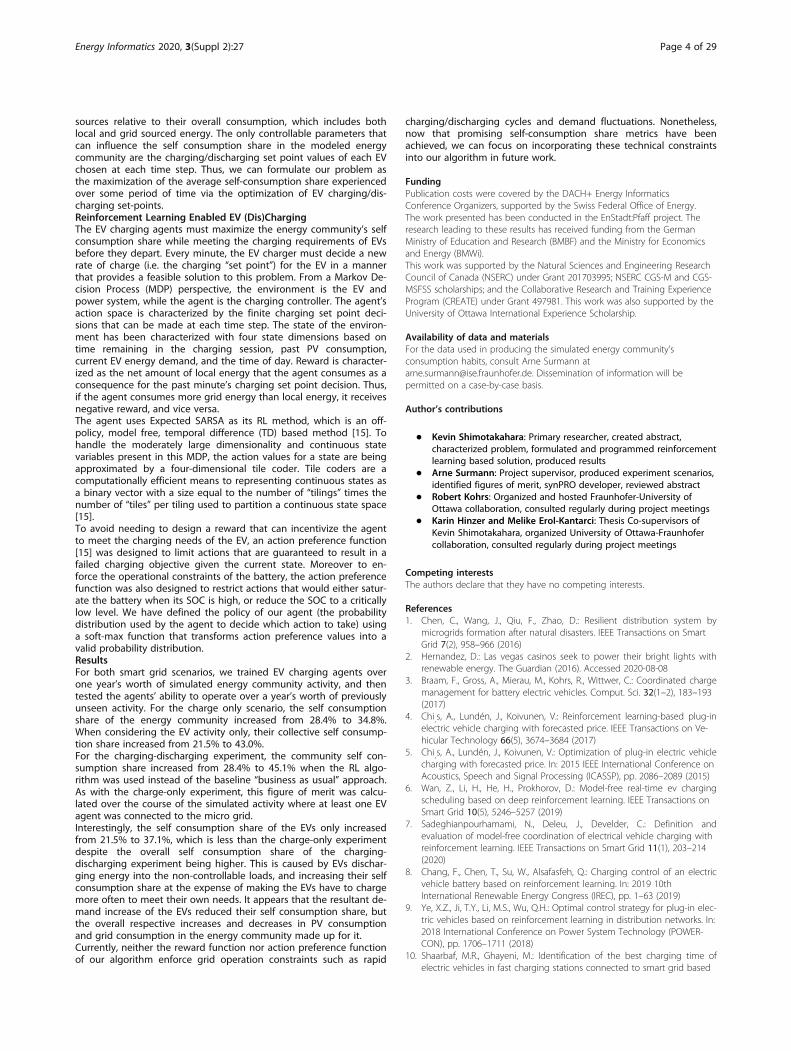
Energy Informatics 2020, 3(Suppl 2):27 Page 6 of 29
the investment prices per MWh of every storage technology and in-vestment prices per MW for every conversion technology. Vector fcontains the loss of every conversion technology calculated by (1−η). The value of the objective function is not of interest and must notbe understood as the costs of the storage system. The goal of theoptimization is only to find a cost- and energy efficient usage of thestorage system to find out the demand for the investigated tech-nologies. Energy in storages can become negative in theoptimization, since we don’t know their starting levels and set themto zero. After the optimization, the highest delta between the lowestand the highest storage state is the used storage capacity that wouldbe necessary in the examined years. Pumped storage is limited to 10GW/60 GWh due to ecological limits and heat pumps and RLT arelimited to 44 GW to respect distribution grid limits which is com-pletely used in all scenarios.ResultsConclusionIt can be seen that the energy storage system becomes very large inthe given approach that assumes neither efficiency improvementsnor energy imports. That distinguishes this work to the studies men-tioned in the introduction. Regarding the transportation sector, en-ergy demand in Scenario 1 is by far the lowest. Storage demand isnot significantly higher than in the other scenarios, so the usage ofchemical fuels seems not to lower the demand for stationary storage.That can be explained by the higher energy demand. On the otherhand, in Scenario 1, the availability of second-life batteries could behigher than the demand for stationary battery storages if the givenassumptions will turn out to be correct, which. Therefore, battery-electric transport is likely to have the most beneficial impacts on asector-coupled energy storage system.
FundingPublication costs were covered by the DACH+ Energy InformaticsConference Organizers, supported by the Swiss Federal Office of Energy.
Availability of data and materialsSources of data and further materials are available in [10].
Author’s contributionsThis work is based on the master thesis of Tobias Riedel which wassupervised by Martin Zimmerlin.
Competing interestsThe authors declare that they have no competing interests.
References1. Henning, H.-M., Palzer, A.: Energiesystem Deutschland 2050. Technical
report, Fraunhofer Institut fu¨r Solare Energiesysteme ISE. https://www.ise.fraunhofer.de/content/dam/ise/de/documents/publications/studies/Fraunhofer-ISE_Energiesystem-Deutschland-2050.pdf
2.. Quaschning, V.: Sektorkopplung durch die Energiewende. Technicalreport, Hochschule für Technik und Wirtschaft HTW Berlin (2016). https://www.volker-quaschning.de/publis/studien/sektorkopplung/Sektorkopplungsstudie.pdf
3. BMWi: Energiedaten: Gesamtausgabe. Technical report, Bundesministeriumfür Wirtschaft und Energie. https://www.bmwi.de/Redaktion/DE/Artikel/Energie/energiedaten-gesamtausgabe.html. Accessed 2019-04-15
4. Deutscher Wetterdienst: Climate Data Center (2019). https://cdc.dwd.de/portal/. Accessed 2019-02-08
5. Bundesnetzagentur: Smard - Strommarktdaten. https://www.smard.de/home/46. Accessed 2019-07-18
6. Perner, J., Unteutsch, M., Lovenich, A.: Die zukünftigen Kosten strombasiertersynthetischer Brennstoffe. Technical report, Agora Verkehrswende, AgoraEnergiewende und Frontier Economics. https://www.agora-verkehrswende.de/fileadmin/Projekte/2017/Die_Kosten_synthetischer_Brenn-_und_Kraftstoffe_bis_2050/Agora_SynCost-Studie_WEB.pdf
7. Wietschel, M., Bünger, U.: Vergleich von Strom und Wasserstoff als CO2-freie Endenergieträger. Technical report, Fraunhofer ISI, Ludwig-Bolkow-Systemtechnik GmbH. http://publica.fraunhofer.de/dokumente/N-133130.html
8. Schmied, M., Wüthrich, P., Zah, R., Althaus, H.-J., Friedl, C.: PostfossileEnergieversorgungsoptionen für einen treibhausgasneutralen Verkehr imJahr 2050: Eine verkehrsträgerübergreifende Bewertung. Technical report,Umweltbundesamt. https://www.umweltbundesamt.de/publikationen/postfossile-energieversorgungsoptionen-fuer-einen
9. Fischhaber, S., Regett, A., Schuster, S., Hesse, H.: Second-life-Konzepte fürLithium-Ionen-Batterien aus Elektrofahrzeugen. Technical report, For-schungsstelle für Energiewirtschaft (2016). https://www.ffe.de/download/article/620/StudieSecondLifeKonzepte.pdf
10. Riedel, T.: Optimierung eines sektorengekoppelten Energiespeichersystemsund die Auswirkungen des Verkehrs. Master thesis, Karlsruher Institut fürTechnologie, Institut für Elektroenergiesysteme und Hochspannungstechnik,Karlsruhe (2019)
P4Design of an Ultra-Low Power Sensor Platform for the Detection ofActivities of Daily Living in Residential and CommercialEnvironmentsMartin Camenzind*, Patrick Huber, Andreas Rumsch and Andrew PaiceLucerne School of Engineering and Architecture: iHomeLabCorrespondence: Martin Camenzind ([email protected])Energy Informatics 2020, 3(Suppl 2):P4

Energy Informatics 2020, 3(Suppl 2):27 Page 7 of 29
SummaryActivities of daily living (ADL) are activities of individuals performedon a daily basis which are necessary for independent living at home.ADLs are often used as a reliable indicator of the health of a personbut manual assessment of ADLs is time consuming and labor inten-sive. That’s why the field of automatic ADL detection has seen an in-crease in popularity in recent years. Here, we report on a developedultra-low power sensor platform for ADL detection. We performedfield trials in the residential setting to validate the sensor system andtranslated the knowledge to the domain of office buildings to enableuser-centric building control. To that end, we tested the capability ofthe sensor platform to estimate the number of people present dur-ing meetings. The results show that our sensor platform is able esti-mate the number of people with a mean absolute error of 1.3.Keywords: activities of daily living; ADL; sensor platform; user centriccontrolIntroductionActivities of daily living (ADL) refer to all activities related to self-careand independent living of an individual. Since the first publicationsof a standardized assessment protocol for ADLs by Katz et al. [1] in1963, many health professionals use ADLs to assess a person’s abilityto care for themselves. Since then, many more scales have emergedwhich have found application ranging from general geriatric assess-ments, dementia, stroke, development disorders and rehabilitationand provide reliable indicator for a persons health [2, 3].Celler et al. [4] introduced one of the first systems for tele-monitoringof ADLs in 1995. Since then, the field of automatic detection ofADSs has gained significant traction. One reason lies in the simplefact that the manual assessment of ADLs is time consuming andlabor intensive. Another reason for this trend lies in the advancesand miniaturization of sensors and the emergence of IoT [5, 6]. Amajor benefit of automatic ADL detection systems is their abilityfor constant monitoring. Tracking a patients behaviour patternsover long periods of time increases the chance for early detectionof emergency situations [7].A literature review by Peetoom et al. [8] showed that most systemsfor ADL detection use simple passive infrared (PIR) motion sensors tomeasure activity levels at different locations. The assumption herebyis, that there is a simple mapping from room activity to ADL. For ex-ample, PIR motion activity in the kitchen is mapped to cooking, activ-ity in the bathroom to showering, bathing or personal hygiene. Inour project we translate the knowledge in the field of ADL detectionto the commercial sector. We make the following contributions: 1)We built a ultra-low power sensor platform to measure the most im-portant physical variables related to the most important activities. 2)We tested the reliability of the system in residential and office envi-ronments. 3) We built a machine learning model to estimate thenumber of people present in a meeting rooms.Sensor platformIn order to decide, which ADLs provide the most relevant informa-tion, we analyzed the frequency of occurrence of activities in themost used ADL assessment scales. In total, we analyzed 16 Scales(Katz ADL Index, Barthel, DS, Lawton IADL, Lawton PSMS, RLT, FAQ,FIM, DAFS, NOSGER, CSADL, FAM, BADLS, ADCS-ADL, DAD and W-ADL). Based on this evaluation, we decided to focus on the activitiescooking, eating, toileting and showering because those are among themost frequent. Additionally, we decided to include sleeping becauserecent research suggests that sleep is a good predictor for cognitiveimpairment [9, 10, 11]. For the office environment, we decided tofocus on the activities meeting, opening / closing of windows, use ofelectrical appliances and desk work because they are most closelyconnected to Heating, Ventilation and Air Conditioning (HAVC) sys-tems. We then analyzed which physical parameter we have to meas-ure to detect those activities. Table 1 provides the resulting mappingbetween physical parameters and activity.The final sensor platform is shown in Figure 1. It included 9 ambientsensors which measure variables such as Temperature, Humidity,Light intensity, VOC (Volatile Organic Components), Sound pressure,3D Acceleration, Magnetic field strength, Motion and Distance (viaTime of Flight). Additionally, the sensor platform includes a multipur-pose IO connector which provides standard communication
interfaces such as I2C, SPI as well as GPIOs, ADCs and Power. Theconnector enables the sensor platform to be expandable with add-itional, highly specialized daugh-terboards. One such daughterboardwas built to estimate the power consumption of appliances by meas-uring the residual magnetic AC field at the surface of power cords.As the main goal of our sensor platform is to provide an easy and re-liable tool for detecting and tracking daily activities in the residentialand office environment, we optimized the sensor platform accordingto the following constrains:Power consumption: The sensor platform was optimized for ultra-low power. The mean current consumption was measured to bearound 90μA which provides a battery life of about 2 years. Unobtru-siveness: The sensor platform was designed to be small, lightweightand unobtrusive. The final dimensions are 80x40x25mm. Simplicity:The sensor platform uses Bluetooth 5.0 (Low Energy) to transmit sen-sor data to a base station. We use non-connectable advertisementpackets to simplify the setup process. No pairing is required and mul-tiple sensors can be installed in a short amount of time. Reliability:Sensor data are transmitted via Bluetooth 5.0 (Low Energy) with a re-pletion rate of 4 every 30s. Events from PIR and accelerometer aretransmitted immediately when they occur. Security: Sensor data isencrypted via 128-bit AES before transmission.ValidationTo validate the ability to detect ADLs in a residential environment,we installed a set of 13 sensor units in two apartments of twohealthy participants. During a period of 6 and 8 weeks the partici-pants were instructed to keep a journal of their daily activities. A sim-ple random forest classifier was trained on the dataset using a 7-foldCross Validation methodology. The resulting classifier achieved amean precision and recall over all tested activities of 0.97 and 0.96respective.To validate the sensor platform in an office environment, we con-ducted another two field trials in two meeting rooms where weanalyzed the reliability of the system and its performance detect-ing the number of people. Room-1 had a floor space of 3.5m x6m (21m2) and a height of 3.5m (73.5m3) and was used to testthe data logging system and to develop machine learningmodels. Room-2 had floor space of 4.2m x 6.4m (26.9m2) and aheight of 3.5m (94m3) and was used to test the transferability ofthe machine learning models to unseen locations. We comparedmultiple neural network architectures such as GRU, LSTM andDeep separable 1D Conv-Nets. For model selection, we monitoredthe mean absolute error (MAE) for the estimated number ofpeople on the validation data. We found good agreement withfew people in the room and high deviation where several peopleoccupied the room. The MAE of room-1 was 0.069±0.045 over alldata. The MAE calculated only for time frames with presenceamounted to 1.31 ± 0.75. To test the transferability of the modelwe used it to predict the number of people using date of room-2 where we got a MAE for time-frames where people werepresent of 1.4.Conclusion and OutlookIn this poster abstract, we report on the design of an ultra-low powersensor platform for the detection of daily activities in residential andcommercial sector. The sensor platfrom has proven to be a reliabletool for collecting sensor date in resi-dential and commercial set-tings. The developed model for people count estimation suggestsome ability to generalize to similar rooms. Never the less, the vari-ability in the predictions is high which poses some limitations on theapplicability of the predictions as an input to building control sys-tems. Further improvements are required.
FundingThis research project is financially supported by the Swiss Innovation AgencyInnosuisse and is part of the Swiss Competence Center for Energy ResearchSCCER FEEB&D. Publication costs were covered by the DACH+ EnergyInformatics Conference Organizers, supported by the Swiss Federal Office ofEnergy.
Availability of data and materialsData and code used for the analysis is available upon request.

Fig. 1 (abstract P4). Developed sensor platform. Front PCB (center)and backside (right) show the location of the most importantsensors and controllers. For adequate protection of the sensors, acustom 3D printed case (left) was designed
Energy Informatics 2020, 3(Suppl 2):27 Page 8 of 29
Author’s contributionsM.C is the main author. P. H assisted and refined text and content. P.H., A.R.and A.P. advised throughout the project and publication writing.
Competing interestsThe authors declare that they have no competing interests.
References1. Katz, S.: Assessing self-maintenance: activities of daily living, mobility, and
instrumental activities of daily living. Journal of the American GeriatricsSociety (1983)
2. Juva, K., MÄKELÄ, M., Erkinjuntti, T., Sulkava, R., YUKOSKI, R., Valvanne, J.,TILVIS, R.: Functional assessment scales in detecting dementia. Age andageing 26(5), 393–400 (1997)
3. Sikkes, S., De Lange-de Klerk, E., Pijnenburg, Y., Scheltens, P.: A systematicreview of instrumental activities of daily living scales in dementia: roomfor improvement. Journal of Neurology, Neurosurgery & Psychiatry 80(1),7–12 (2009)
4. Celler, B., Earnshaw, W., Ilsar, E., Betbeder-Matibet, L., Harris, M., Clark, R.,Hesketh, T., Lovell, N.: Remote monitoring of health status of the elderlyat home. a multidisciplinary project on aging at the university of newsouth wales. International journal of bio-medical computing 40(2), 147–155 (1995)
5. Alwan, M., Dalal, S., Mack, D., Kell, S., Turner, B., Leachtenauer, J., Felder, R.:Impact of monitoring technology in assisted living: outcome pilot. IEEETransactions on Information Technology in Biomedicine 10(1), 192–198(2006)
6. Alemdar, H., Ersoy, C.: Wireless sensor networks for healthcare: A survey.Computer networks 54(15), 2688–2710 (2010)
7. Stankovic, J.A., Cao, Q., Doan, T., Fang, L., He, Z., Kiran, R., Lin, S., Son, S.,Stoleru, R., Wood, A.: Wireless sensor networks for in-home healthcare:Potential and challenges. In: High Confidence Medical Device Softwareand Systems (HCMDSS) Workshop, vol. 2005 (2005)
8. Peetoom, K.K., Lexis, M.A., Joore, M., Dirksen, C.D., De Witte, L.P.: Literaturereview on monitoring technologies and their outcomes in independentlyliving elderly people. Disability and Rehabilitation: Assistive Technology10(4), 271–294 (2015)
9. Jelicic, M., Bosma, H., Ponds, R.W., Van Boxtel, M.P., Houx, P.J., Jolles, J.:Subjective sleep problems in later life as predictors of cognitive decline.report from the maastricht ageing study (maas). International journal ofgeriatric psychiatry 17(1), 73–77 (2002)
10. Schmutte, T., Harris, S., Levin, R., Zweig, R., Katz, M., Lipton, R.: The relationbetween cognitive functioning and self-reported sleep complaints innondemented older adults: results from the bronx aging study. Behav-ioral sleep medicine 5(1), 39–56 (2007)
11. Eeles, E.: Sleep and its management in dementia. Reviews in ClinicalGerontology 16(1), 59 (2006)
Table 1 (abstract P4). Summary of our mapping of measurementparameters to activities we wish to detect. Sl=Sleeping, To=Toiletting,Sh=Showering, Co=Cooking, Ea=Eating, Me=Meeting, Wi=Windows, El=Electrical Appliances, De=Desk work
Activity
Measurement parameter Sl To Sh Co Ea Me Wi El De
Motion x x x x x x x
Temperature x x x x
Humidity x x x x
Light intensity x x x x
Sound pressure x x
Door state x x
Vibration x x x x
Power x x x x
P5Impact of prosumers on the accuracy of load forecast with neuralnetworksRoswitha Muff and Holger Wache*
School of Business, University of Applied Sciences and ArtsNorthwestern Switzerland. Riggenbachstrasse 16, 4600, Olten,SwitzerlandCorrespondence: Holger Wache ([email protected])Energy Informatics 2020, 3(Suppl 2):P5
SummaryMore and more prosumers will penetrate the power grid. But howdo prosumers affect the accuracy of the day-ahead load forecast? Incontrast to related research on prosumers and load forecast, thispaper addresses the impact of different shares of prosumers on theload forecast for areas with several households. In order to answerthis research question, the load forecast accuracies for a datasetwithout prosumers is compared to the ones of datasets with differ-ent shares of prosumers in an experimental setup using neural net-works. A sliding window approach with lagged values up to sevendays is applied. Apart from electricity consumption data weather anddate data are considered. The conducted tests show, that the meanabsolute percentage error increases from about 8% for a datasetwithout prosumers up to about 39% for a dataset with a share ofprosumers of 80%. It can therefore be concluded that prosumers de-crease the accuracy of the day-ahead load forecast with neuralnetworks.Keywords: load forecast; neural network; prosumer; sliding windowapproachProsumers are households, which consume their self-produced elec-tricity [1]. A normal household’s load is driven by various factors likefor example socioeconomic factors as the daily, weekly or yearlyrhythms or physical factors like the temperature [2]. A prosumer’selectricity requirement could be assumed in general the same as theone of normal households, in case of similar behaviour. But inaddition, pro-sumers produce electricity on their own1. A main prob-lem of electricity produced from renewable sources is the intermit-tency [3]. In general, renewable energies have been regarded asnon-controllable and unpredictable electricity sources [4]. This causesadditional costs as operating reserves need to be planned andbackup capacity for short term electricity production need to beavailable. For prosumers the electricity production from renewablesources and their electricity consumption from the grid are linked.They combine the uncertainty of the electricity production from re-newable energy sources and the uncertainty of the behaviour ofhouseholds with respect to their electricity consumption. This leadsto the hypothesis that it is more difficult to forecast the load forareas with a higher share of prosumers.
1The produced energy may be used “internally”; the grid may not see theproduced energy.

Energy Informatics 2020, 3(Suppl 2):27 Page 9 of 29
This paper aims to answer the research question how much the day-ahead load forecast accuracy with neural networks is deteriorated orimproved with an increasing share of prosumers. To simplify the loadis predicted for a period of 24 hours.This paper distinguishes two ways to analyze. On the one hand, loadforecast for prosumers can be done with neural networks, whichhave been trained on a dataset without prosumers. This assumesthat current load forecaster based on neural networks are used toforecast also in future when more and more prosumers may appearin the grid. On the other hand, neural networks can be trained spe-cifically for the load forecast for prosumers. This simulation answersthe question if grids with a higher share of prosumers are in generalmore difficult to forecast.DatasetsThe non-prosumer dataset was provided by a power utility of a cityin Switzerland.2 The dataset contains 15 minutes measurements of469 households from the whole year 2015 with an overall consump-tion of 1’325’267 kWh.3 The prosumer dataset was provided by an-other power utility of another city in Switzerland2. It contains 15minutes measurements in kWh of the net electricity consumptionand production of 146 objects from the year 2017. After a data selec-tion process, 100 objects were left. They have a yearly electricity con-sumption of 712’330 kWh.Further inputs are the timestamp consisting of date and time, theweather including temperature, global radiation and precipitationdownloaded from IDAweb from MeteoSwiss. Additional inputs arethe weekday, calendar week, month and the holidays. The paper isfollowing a sliding window approach as it is proposed by [5, 6, 7].The train label and further input variables are derived from the ori-ginal dataset. The train label comprises the current kWh value of apoint in time and the previous 95 15-minutes kWh values in order topredict the kWh values of 24 hours. Further input variables arelagged. The best combinations of lagged variables are shown Table1.For having different shares of prosumers, the electricity consumptionof prosumer and non-prosumer households are merged resulting infive new datasets with shares of prosumers of 0%, 20%, 40%, 60%and 80%. The shares are calculated based on the annual electricityconsumption in kWh of the households, not the number of house-holds. Further, measurements of two different locations and yearsare combined. Because weekday impacts the load [8, 9], the datafrom the two dataset are not merged based on the date but basedon the weekday. The weather data is always taken from the locationof the prosumers, as their electricity production depends stronger onweather data, especially the global radiation, than the electricity con-sumption. The holiday is taken from the dataset with the highershare in the merged dataset (e.g. for the dataset with 60% prosumersload and 40% non-prosumer load, the holidays of the city of the pro-sumers were considered).Neural networkFeedforward neural networks consist of an input layer, one or severalhidden layers and one output layer [10]. The input shape or numberof neurons of the input layer is given by the number of input vari-ables. The number of input variables can vary according to thechosen size of the sliding window. The output shape of all the neuralnetworks of this paper is 96 as this is the number of 15-minutes kWhvalues within 24 hours (corresponding to day-ahead load forecast).The definition of the number of neurons in the hidden layers is sub-ject of the various tests performed to parametrize the neural net-works. The number of hidden layers varied between three and tenand the number of neurons per hidden layer varied between 300and 1’000. In the network, the various layers of the model are fullyconnected [11].Further the two related optimizers RMSprop and Adam algorithm areused. The loss function is either mean squared error (MSE), mean ab-solute error (MAE) and mean absolute precentage error (MAPE).These three performance measures are also used to measure the
2City not mentioned for reason of confidentiality.3Missing values have been completed using the average of the values ofthe same time the previous day/hours and the following day/hour.
accuracy of the load forecast, i.e. for having meaningful optimizationgoals (especially MSE and MAE) and results that are on a comparablescale (MAPE). The used network parameterisation is shown in Table2.EvaluationComparing the load forecast accuracy for datasets with differentshares of pro-sumers, there are two ways how the load forecast wasperformed on these datasets. In the first experimental setup thedatasets with different shares of prosumers are used to perform theload forecast with the neural network that has an optimalparameterization to perform load forecast for non-prosumer datasets.Afterwards, the trained neural network was tested with the data ofthe whole year of the four datasets with different shares ofprosumers.In the second experimental setup, the neural networks have beentrained and tested on the datasets with different shares of prosu-mers. Thereby, once the neural network parameterization withthe best results for the prosumer dataset and once theparameterization with the best results for the non-prosumer data-set were used.It can also be observed that the load forecast accuracy is betterwhen the neural network is trained and tested on the datasets withdifferent shares of prosumers (second and third row in Table of Fig-ure 1) compared to the first setup, where the neural network wastrained on non-prosumer data (first row in Table of Figure 1).Figure 1 illustrates the MAPE. The blue graph (A) represents the firstsetup. It can be observed that with this setup MAPE increases dispro-portionally fast with an increasing share of prosumers compared tothe other two tests where the neural networks were trained andtested on datasets with different shares of prosumers (orange (B)and grey graphs (C)).The comparison of datasets with different shares of prosumers hasshown that the load forecast accuracy decreases with an increasedshare of prosumers. Independent from the experiments the loadforecast accuracy for prosumer datasets is lower than for non-prosumer datasets. The lowest forecast accuracy was achieved whenthe datasets with different shares of prosumers were tested on theneural network trained on a dataset without prosumers. The resultimproved when the neural networks were trained and tested on theneural networks with different shares of prosumers. For a share ofprosumers of 60% or higher it is recommended to use theparameterization of the neural network, which achieved the best re-sults for the prosumer dataset.
FundingPublication costs were covered by the DACH+ Energy InformaticsConference Organizers, supported by the Swiss Federal Office of Energy.
Availability of data and materialsWeather data from Switzerland are retrieved from MeteoSwiss at June 14,2019, from https://gate.meteoswiss.ch/idaweb. The consumption andproduction data are confidential.
References1. Bundesnetzagentur: Prosumer. Retrieved October 26, 2018, from. https://
www.bundesnetzagentur.de/SharedDocs/FAQs/DE/Sachgebiete/Energie/Verbraucher/NetzanschlussUndMessung/MsBG/FAQ_Prosumer.html
2. Kronig, P., Höckel, M., Wälchli, U., Zürcher, S.: ELBE. Schlussbericht, Teil 1.Validierung und Verbesserung Von Lastprognosen (Projektphase 1).Bundesamt für Energie BFE, Bern, Switzerland
3. Gowrisankaran, G., Reynolds, S.S., Samano, M.: Intermittency and thevalue of renewable energy. Journal of Political Economy 124(4), 1187–1234
4. Masa-Bote, D., Castillo-Cagigal, M., Matallanas, E., Caaman˜o-Martı´n, E.,Gutiérrez, A., Monasterio-Huelı´n, F., Jiménez-Leube, J.: Improving photo-voltaics grid integration through short time forecasting and self-consumption. Applied Energy 125, 103–113
5. Khuntia, S.R., Rueda, J.L., Meijden, M.A.: Neural network-based load fore-casting and error implication for short-term horizon. In: 2016 Inter-national Joint Conference on Neural Networks (IJCNN), pp. 4970–4975.IEEE

Energy Informatics 2020, 3(Suppl 2):27 Page 10 of 29
6. Rana, M., Koprinska, I.: Forecasting electricity load with advanced waveletneural networks. Neurocomputing 182, 118–132
7. Veit, A., Goebel, C., Tidke, R., Doblander, C., Jacobsen, H.A.: Householdelectricity demand forecasting: benchmarking state-of-the-art methods.In: Proceedings of the 5th International Conference on Future EnergySystems, pp. 233–234. ACM
8. Humeau, S., Wijaya, T.K., Vasirani, M., Aberer, K.: Electricity load forecastingfor residential customers: Exploiting aggregation and correlationbetween households. In: 2013 Sustainable Internet and ICT forSustainability (SustainIT), pp. 1–6. IEEE
9. Kronig, P., Höckel, M., Wa¨lchli, U., Zürcher, S.: ELBE. Schlussbericht, Teil 2.Analyse und Auswertung von Last- und Wetterdaten (Projektphase 2).Bundesamt für Energie BFE, Bern, Switzerland
10. Goodfellow, I., Bengio, Y., Courville, A.: Deep Learning. MassachusettsInstitute of Technology, Cambridge, USA
11. Ayyadevara, V.K.: Neural Networks with Keras Cookbook: Over 70 RecipesLeveraging Deep Learning Techniques Across Image, Text, Audio, andGame Bots. Packt Publishing Ltd, Brimingham
Table 1 (abstract P5). Best Combination of lagged input values
N kWh Weekday CalendarWeek
Month Holidays Time GlobalRadiation
Temp.
4 96-479φh
1xlag95 1xlag95 1xlag95 1xlag95 1-9515'
1-95 φh 1-95φh
7 96-671φh
1xlag95 1xlag95 1xlag95 1xlag95 1-9515'
1-95 φh 1-95φh
15' = 15 minutes; φh = hourly average
Table 2 (abstract P5). Best neural network parameterization forprosumers and non-prosumers
Non-Prosumer Prosumer
Optimizer Adam Adam
Learning rate 0.001 0.001
Loss function MAE MSE
Number of hidden layers 3 5
Number of neurons per hidden layer 1000 500
Activation function ReLu ReLu
Early stopping algorithm patience 20 20
Validation split 0.1 0.1
Combination of lagged input variables 7 4
Fig. 1 (abstract P5). Percentage change of MAPE for the threeneural networks setups tested with datasets with different shares ofprosumers
P6Implementing Local Energy Markets – An IT-Architecture DesignBent Richter1*, Armin Golla1, Klaus Welle2, Philipp Staudt1 and ChristofWeinhardt11Karlsruhe Institute of Technology; 2Selfbits GmbH.Correspondence: Bent Richter ([email protected])Energy Informatics 2020, 3(Suppl 2):P6
SummaryIn recent years, the academic community intensified research onlocal energy markets. Implementations in pilot projects provide firstinsights into different hypotheses and approaches. This work pre-sents a tested IT-architecture for local energy markets, which coversall necessary processes and basic functionality, namely the hardware,the market implementation, the database, and the application forthe user. It consists of four modules and eight essential processes.The IT-architecture can serve as a blueprint for future local energymarket projects as it covers the basic processes and is at the sametime extendable.Keywords: Local Energy Market; IT-Architecture; Energy TransitionIntroductionThe expansion of small renewable generation capacities in the distri-bution grid changes the paradigm of top-down electricity grids andcauses the emergence of new microgrid concepts that allow partici-pants to trade their residential generation with their neighbours. Dueto this changing situation, there has been increasing discussion in re-cent years about local energy markets (LEM) [1, 2, 3]. An LEM adds amarket layer to a microgrid that is originally a mere technical con-cept. On these markets, small local producers and prosumers tradewith local customers (e.g. private households) in the immediate vicin-ity [4]. Currently, there are several pilot projects and a vital discussionabout proper market designs and regulatory issues has emerged [5,4]. However, the discussion is currently rather focused on market de-signs and concepts instead of IT-architectures. Therefore, in this work,we present a developed and tested IT-architecture design for localenergy markets in a microgrid. This architecture is implemented inthe Landau Microgrid Project (LAMP), a real-world implementation ofan LEM [6].This pilot project is a cooperation of the Karlsruher Institute of Tech-nology, the software developer Selfbits and the local utility Energie-Su¨dwest. Its objective is to investigate the requirements, challengesand opportunities of an implemented LEM. The project is set up in aselected microgrid in the German city Landau. A local combined heatand power plant (50kW electrical) and a photovoltaic system(23.56kWp) provide local generation. The microgrid is connected tothe public grid via a single link and consists of 118 connectionpoints, most private households. This connection ensures a continu-ous supply and allows excess energy to be fed into the public distri-bution grid. Initially, eight private households decided to participatein the LEM. Based on this case study, we describe the proposed IT-architecture and present an exemplary implementation, includingspecific technology choices.IT-ArchitectureThe architecture consists of four modules. Each takes on functionaltasks within the structure. First, the system has to record the loadvalues of all participants (Smart Meter Hardware). Second, the customerapplication requires an interface to enable interactions with the user.The participants must have access to their individual load data and beable to submit bids into the system (User Application). Third, load andbidding data have to be matched by the market mechanism (Market).Fourth, the recorded and generated data of all former modules mustbe stored and accessible to all applications (Database). Furthermore,specific processes exchange information between the different mod-ules to ensure the operation of the overall information system. A repre-sentation of the architecture with its modules and processes is shownin Figure 1. In the following, the functionality of each module and itsprocesses are presented in detail.Smart Meter Hardware: The task of the Smart Meter Hardware moduleis to record and communicate individual load data. Energy tradingon an LEM requires the current load profiles of all participants. In theproposed architecture, a digi-tal electricity meter records the load

Energy Informatics 2020, 3(Suppl 2):27 Page 11 of 29
data. This meter requires a communication module that allows themeasured load values to be transmitted to the information system,where a database stores it. In Figure 1, process 1 displays this trans-fer of load data from the Smart Meter Hardware to the Databasemodule. In the case study, the Smart Meter Hardware module is im-plemented through a combination of the ’Long-Range Wide-AreaNetwork’ (LoRaWAN) and digital electricity meters with a LoRa-Sensor communication module. Each meter is connected to a LoRaSensor, which sends the recorded data to the network. Then, theLoRaWAN server processes and transmits the recorded data to theDatabase module via a WebSocket connection. The advantages ofthe LoRaWAN technology for this application are the easy installa-tion, scalability due to the cost per sensor, and signal strength. A dis-advantage is the LoRaWAN-Gateway, which represents a possiblesingle point of failure if it is not redundantly installed.User Application: The information system of the LEM needs a human-system interface where each participant is able to place bids on themarket. In the proposed IT-architecture, the module User Applicationaddresses these requirements. The application must be accessible byall participating users over, e.g. mobile devices like smartphones. Fig-ure 1 shows that five different processes originate from this module.Process 2.1 and 2.2 show the registration and authentication processof a new user with her login data. Both are necessary to identify theuser and prevent other participants from viewing the individual loaddata or issue bids in the user’s name. After a successful registration,the system can authenticate the user by its login data. This is neces-sary for the login process (2.2). For security reasons, the login data isstored on a different database (account database) and separatedfrom the market data (market database). The connection betweenthe user authentication data and its individual market data is estab-lished with process 2.3. It links the ID of the smart meter hardwarewith the user login data. Based on this connection, process 2.4 is ableto request individual consumption and market data. Comparably, theuser initiates process 2.5 by entering a bid price in the application. Inthe case study project, the software partner provided a self-developed Android based application for mobile devices. After a suc-cessful login by the user, the application receives a JSON Web Tokenfrom the account database to authenticate the user against the mar-ket database. It allows a stateless session between the applicationand the market database. Since end devices are often not optimizedfor data storage, the application sends live queries against the mar-ket database to receive the requested market data and visualize it.The application illustrates the data in different forms like charts andtables and a graphical controller allows to submit bids within speci-fied limits.Market: An LEM requires a market to match the local supply and de-mand. In the proposed architecture, the Market module consists oftwo components: The Mar-ketWrapper and the market mechanism.The MarketWrapper is the first software component. Its task is toprocess the raw input data from the market database into bids forthe market mechanism. Process 3.1 displays this procedure. The mar-ket mechanism, the second software component, receives the bids,allocates them and generates transactions and market prices as out-puts. These are handed over to the MarketWrapper, which handsthem over to the market database (process 3.2). The market databasetransmits requested data in a JSON file format via a GraphQL API.These files are processed by the MarketWrapper into bids andhanded over to the market mechanism. The market is cleared ex-post in 15-minutes intervals. The implemented market mechanism isdescribed by [7]. The market mechanism creates transactions foreach trading period that include the market price, volume and buyerand seller ID. The MarketWrapper transfers each transaction back tothe market database module over the same API.Database: Each LEM requires the storage of the recorded and gener-ated data. The Database module provides this functionality. Themodule is the central point in the architecture and consists of two
databases: the account and the market database. The account data-base, as mentioned above, manages the authentication data of theusers. The task of the market database is to store all data associatedto generation, consumption and trade and to make it available toother applications. While this module does not initiate processes it-self, each of the other three modules communicates and transfers in-formation exclusively over the database. Therefore, consistency andassignability of the data are important and with it a proper databasedesign. In the case study project, this challenge is addressed by anobject-relational database built with the open-source database man-agement system PostgreSQL. It organizes the data with different ta-bles and each data type (e.g. smart meter readings) is stored in itsown table. A server handles the management of the database andprocesses data requests in a specific programming language. Such aGraphQL server manages and monitors the writing and reading ac-cesses of the other modules.ConclusionThis paper is intended to be the starting point of a discussion on theIT-architecture of LEMs and thus contributes to the maturing of thisconcept. The design of an LEM’s architecture has a central influenceon subsequent functionality and performance and its scalability. Inthis work, we propose an IT-architecture design for LEMs which canserve as a blueprint for future projects. The architecture is dividedinto four modules. Each takes over different tasks within the LEM in-formation system. The Smart Meter Hardware collects load data, theUser Application serves as an interface between user and informationsystem, the Market coordinates the matching, and the Databasestores the data. Processes describe the data exchange between thesemodules. Each process performs a different task to ensure the func-tionality of the LEM. We provide an exemplary technology implemen-tation of each module and its processes in a case study. The choiceof the respective technology or additional modules and processesdepends strongly on the particular project and its requirements.
FundingThis work was supported by the German Research Foundation (DFG) as partof the Research Training Group GRK 2153: Energy Status Data - InformaticsMethods for its Collection, Analysis and Exploitation. Publication costs werecovered by the DACH+ Energy Informatics Conference Organizers, supportedby the Swiss Federal Office of Energy.
References1. Teotia, F., Bhakar, R.: Local energy markets: Concept, design and
operation. In: 2016 National Power Systems Conference (NPSC), pp. 1–62. Cramer, W., Schmitt, C., Nobis, M.: Design premises for local energy
markets. In: Proceedings of the Ninth International Conference on FutureEnergy Systems. e-Energy ’18, pp. 471–473. Association for ComputingMachinery
3. Golla, A., Henni, S., Staudt, P.: Scaling the concept of citizen energycommunities through a platform-based decision support system. Euro-pean Conference on Information Systems (ECIS) (2020)
4. Weinhardt, C., Mengelkamp, E., Cramer, W., Hambridge, S., Hobert, A.,Kremers, E., Otter, W., Pinson, P., Tiefenbeck, V., Zade, M.: How far alongare local energy markets in the DACH+ region?: A comparative marketengineering approach. In: Proceedings of the Tenth ACM InternationalConference on Future Energy Systems, pp. 544–549. ACM
5. Wörner, A., Ableitner, L., Meeuw, A., Wortmann, F., Tiefenbeck, V.: Peer-to-peer energy trading in the real world: Market design and evaluation ofthe user value proposition. 4th International Conference on InformationSystems (ICIS 2019) (2019)
6. Mengelkamp, E., Gärttner, J., Weinhardt, C.: Decentralizing energy systemsthrough local energy markets: The LAMP-Project
7. Richter, B., Mengelkamp, E., Weinhardt, C.: Vote for your energy: a marketmechanism for local energy markets based on the consumers’preferences. In: 2019 16th International Conference on the EuropeanEnergy Market (EEM), pp. 1–6 (2019). IEEE

Fig. 1 (abstract P6). IT-Architecture
Energy Informatics 2020, 3(Suppl 2):27 Page 12 of 29
P7Long-Term Electric Load Forecast for Urban Areas with an EnergyDecomposition ModelXuqian Yan1*, Anselma Wörner1, Philipp Awater2, Julian Monscheidt2,Ben Gemsjäger2 and Verena Tiefenbeck11ETH Zurich, Rämistrasse 101, 8092 Zürich, Switzerland; 2Siemens AG,Freyeslebenstrasse 1, 91058 Erlangen, GermanyCorrespondence: Xuqian Yan ([email protected])Energy Informatics 2020, 3(Suppl 2):P7
SummaryDue to the joint impacts of both demographic changes and techno-logical trends such as electric vehicles, the development of urbanelectric load is increasingly uncertain. While sophisticated machinelearning methods promise to alleviate this issue, practical applicationof these methods is frequently limited by insufficient availability ofdata from distribution system operators. To overcome this challengeand provide a useful tool for network planning in urban areas, wepropose a load decomposition model with minimal data requirementto model the joint impact of demographic and technological devel-opments. The model is composed of a statistical and a deterministicpart. The statistical part uses a constrained elastic net regression todecompose the annual energy consumption into residential andcommercial sectors. Following this, the deterministic part of themodel uses the sector-specific energy consumption forecasts fromthe statistical model, to scale their corresponding standard load pro-files and conduct further modifications on those.Keywords: Load forecast; Machine learning; Energy decomposition;Electrification; Network planningIntroductionWith the energy transition, new technologies such as electric vehicles(EV) or heat pumps (HP), as well as distributed generation, are alter-ing the electricity consumption pattern and challenge the qualityand reliability of electricity supply [1]. These developments are ex-pected to unfold predominantly in urban areas because ofurbanization [2], affordability of new technologies [3], cities’ responsi-bility to compensate their greenhouse gas (GHG) emissions [4], andtheir role as thought leaders to promote new energy technologies [5,6]. At the same time, demographic developments are shaping futureelectricity consumption in urban areas as well [7, 8], but with differ-ent characteristics. Demographic development affects mainly con-ventional electric loads (e.g. residential and commercial load), ofwhich the patterns are relatively well-known and can be describedusing historical data for creating standard load profiles (SLP) [9];while technological development brings new technologies with dif-ferent electric load patterns than the conventional sectors [10].The complexity of urban areas’ development and the differences be-tween the two types of trends call for a novel model to study the fu-ture electric load of urban areas. However, as summarized in [11],most of the previous studies on long-term load forecast are limitedeither by low time resolution [12, 13], or by high data requirements[14, 15]. Ideally, a load forecast model for urban network planningshould have the following characteristics - (1) predicting the
aggregated electricity consumption (E) as well as the peak loads(Pmax) as they are both important references to scale grid compo-nents [16]; (2) using commonly available data sets since high data re-quirements have always been a bottleneck for long-term loadforecasting in practice [17, 18], and the urban system operators areusually short of data collection [16]; (3) quantifying joint impacts ofboth demographic and technological trends that will simultaneouslyarise in urban areas. Requirements (1) and (3) naturally lead to pro-file-based long-term load forecasting since load profiles provide loaddata with a high time resolution and allow simple addition of loadswith different characteristics. However, current profile-based forecastmodels heavily rely on extensive data input, leaving the point (2) un-resolved. Therefore, two research questions that we tackle are:
(a) What is an appropriate model to estimate the long-term im-pacts of both demographic and technological trends on urbanelectric load?
(b) What is the minimal data requirement for a long-term loadforecast model?
MethodologyIn order to model both the demographic and technological trends, ahybrid model composed of statistical modelling and deterministicmodelling parts is developed (Figure 1). The model is able to decom-pose the annual energy consumption into residential and commer-cial sectors (statistical modelling), which enables to localize thetechnological trends into different sectors and to model their im-pacts as a subsequent step (deterministic modelling). Load decom-position is the key of the proposed model. For example, theadoption of household energy efficient appliances will only reshapethe load profile of the residential sector, not the commercial sector.For such cases, it is essential to differentiate the load profiles of dif-ferent sectors as a first step and then model the impact of the newtechnologies on their associated sectors.(1) Statistical model for demographic trendsThe goal of the statistical modelling is to find out the relation(dashed arrows in Figure 1) between the independent variablessuch as population (POP) and the annual energy consumption ofthe residential and commercial sectors. Linear regression is se-lected as the basis for the modelling because of its interpretabil-ity [19] and transparency [20]. Since the energy consumptiondata for each sector is not commonly available for distributionsystem operators (DSO), they cannot be directly used asdependent variables. Instead, two other dependent variables -the measured annual energy consumption E and peak power Pmax
(the yellow boxes in Figure 1) are used. E is used as the primarydependent variable assuming that it has a linear relation with theindependent variables. Pmax is used as the secondary dependentvariable which serves as a reference to decompose the E into thetwo sectors. Together with regularization and bounds on the lin-ear coefficients, the model is formulated as follows:
minimize L βð Þ ¼ E − Xβk k2 Accuracy control inEpredictionþ λc P max − λpfXcβk k2 Accuracy control inP maxpredictionþλridge βk k2 Part of elastic net regularizationþλlasso βk k1 Part of elastic net regularization
s:t:c j;lb≤β j≤c j;ub j ¼ 1; :::; pð Þ Bounds on the linear coefficients
During model training, the hyperparameters (λpf, λc,λridge, and λlasso)
are determined at first with cross-validation (CV) and then the linearcoefficients (β) are determined with bootstrap to overcome hetero-scedasticity [21].(2) Deterministic model for technological trendsAfter the statistical model has been trained, annual energy consump-tion of the residential and commercial sectors can be estimated. As aresult, their scaled SLP can be obtained and used as the basis for thefollowing deterministic model. For example, if households will adoptappliances with higher energy efficiency, an efficiency factor can beused to scale down the residential load profile; if PV-battery systemswill be installed in households, a PV-battery model can be applied ontop of the residential load profile.

Fig. 1 (abstract P7). Overview of the model (blue: data inputs;yellow: dependent variables; green: scenarios for prediction; dashedarrows: unknown relationships)
Energy Informatics 2020, 3(Suppl 2):27 Page 13 of 29
EvaluationData from a German city is used to conduct a first evaluation of themodel’s accuracy in energy decomposition. Results show that themodel performs well in predicting the overall energy consumption.However, its energy decomposition performance is only good for thesuburb network but not for the city center network. The bias in thecity center network prediction can be explained by the heterogeneityof the commercial consumers in the city center. Unlike the residentialsector, the commercial sector is more diverse and it can be furtherdecomposed into 6 subsec-tors whose standard load profile have dif-ferent patterns [9]. In order to improve the forecast accuracy in com-mercial areas, we will further decompose the commercial sector tocapture its heterogeneity in future research. This is enabled by theflexible model structure which allows to conduct decomposition intoany arbitrary number of sectors.ConclusionTo model the joint impacts of demographic and technological trendson electric loads in urban areas, an energy decomposition modelusing a constrained elastic net regression algorithm is established.The model has minimal data requirements from the distribution sys-tem operators - (1) the annual energy consumption measured ateach consumption unit, and (2) the maximum current measured atMV/LV transformers. These two datasets are both used as dependentvariables in the constrained elastic net regression model. This modelextends the standard elastic net regression model by adding twomore constraints - a peak power constraint and bounds on the linearcoefficients. Enabled by the established model structure, future re-search or practical applications can focus on including more variousindependent variables, further decomposing the sectors, and enrich-ing the scenario setups.
FundingThis contribution is submitted within the boundaries of a research projectfunded by the German Federal Ministry for Economic Affairs and Energyfollowing the decision of the German Bundestag. Publication costs werecovered by the DACH+ Energy Informatics Conference Organizers, supportedby the Swiss Federal Office of Energy.
References1. Protopapadaki, C., Saelens, D.: Heat pump and PV impact on residential
low-voltage distribution grids as a function of building and district prop-erties. Applied Energy 192, 268–281 (2017)
2. Kammen, D.M., Sunter, D.A.: City-integrated renewable energy for urbansustainability. Science 352(6288), 922–928 (2016)
3. Shi, L., Chuliang, L.: Re-estimating the income gap between urban andrural households in China. Procedia Social and Behavioral Sciences 2,7151–7163 (2010)
4. United Nations Human Settlements Programme: Cities and ClimateChange: Policy Directions - Abridged Edition, Nairobi, Kenya (2011)
5. Federal Ministry for Economic Affairs and Energy: ICT for Electric MobilityIII - Integration of commercial electric vehicles into logistics, energy andmobility infra-structures. Technical report, Berlin, Germany (2018)
6. Ministry of Finance, Ministry of Science and Technology: Ten Cities, OneThousand Vehicles Program. Technical report, Beijing, China (2009)
7. Bründlinger, T., König, J.E., Frank, O., Gründig, D., Jugel, C., Kraft, P., Krieger,O., Mischinger, S., Prein, P., Seidl, H., Siegemund, S., Stolte, C., Teichmann,M., Willke, J., Wolke, M.: Integrierte Energiewende. Technical report,Deutsche Energie-Agentur GmbH, Berlin, Germany (2018)
8. Münter, A., Osterhage, F.: Trend Reurbanisierung? Analyse der Binnenwanderungenin Deutschland 2006 bis 2015. Technical report, Bertelsmann stiftung,Gütersloh, Germany (2018)
9. Hermann Meier, Fünfgeld, C., Adam, T., Schieferdecker, B.: RepräsentativeVDEW-Lastprofile. VDEW, Frankfurt (Main), Germany (1999)
10. Vergnes, H., Nijhuis, M., Coster, E.: Using Stochastic Modelling for Long-term Network Planning of LV distribution Grids at Dutch DNO. Inter-national Conference on Electricity Distribution, Madrid, Spain (2019)
11. Kuster, C., Rezgui, Y., Mourshed, M.: Electrical load forecasting models: Acritical systematic review. Sustainable Cities and Society 35, 257–270(2017)
12. Ding, Q.: Long-term load forecast using decision tree method. In: 2006IEEE PES Power Systems Conference and Exposition. IEEE, Atlanta, USA(2006)
13. Dilaver, Z., Hunt, L.C.: Modelling and forecasting Turkish residentialelectricity demand. Energy Policy 39, 3117–3127 (2011)
14. Moral-Carcedo, J., Pérez-García, J.: Integrating long-term economic sce-narios into peak load forecasting: An application to Spain. Energy 140,682–695 (2017)
15. Al-Hamadi, H.M., Soliman, S.A.: Long-term/mid-term electric load forecast-ing based on short-term correlation and annual growth. Electric PowerSystems Research 74, 353–361 (2005)
16. Heuck, K., Dettmann, K.-D., Schulz, D.: Grundzüge der Betriebsführungund Planung Von Elektrischen Energieanlagen, pp. 491–533.Vieweg+Teubner, Wiesbaden, Germany (2013)
17. Khuntia, S.R., Rueda, J.L., van der Meijden, M.A.M.M.: Forecasting the loadof electrical power systems in mid- and long-term horizons: a review. IETGeneration, Transmission & Distribution 10(16), 3971–3977 (2016)
18. Hooshmand, A., Sharma, R.: Energy predictive models with limited datausing transfer learning. In: e-Energy ’19: Proceedings of the Tenth ACMInternational Conference on Future Energy Systems, pp. 12–16. ACM,Phoenix, USA (2019)
19. Lou, Y., Caruana, R., Gehrke, J.: Intelligible models for classification andregression. Proceedings of the ACM SIGKDD International Conference onKnowledge Discovery and Data Mining, 150–158 (2012)
20. Lipton, Z.C.: The mythos of model interpretability. ACM Queue - MachineLearning 16(3) (2018)
21. Flachaire, E.: Bootstrapping heteroskedastic regression models : wildbootstrap vs . pairs bootstrap. Computational Statistics and Data Analysis49(2), 361–376 (2005)
ResearchAgent-based Modeling of Consumer Participation in DemandResponse Programs with the Consumat FrameworkJudith Schwarzer* and Dominik EngelCenter for Secure Energy Informatics, Salzburg University of AppliedSciences Urstein Süd 1 5412 Puch bei Hallein, AustriaCorrespondence: Judith Schwarzer ([email protected])Energy Informatics 2020, 3(Suppl 2):Research
SummaryThe success of demand response programs, as one of the key appli-cations of a smart grid architecture, essentially depends on the endconsumers’ decisions and interactions. Technical demand responsemodels mostly require presumptions concerning these parameters.In this paper, an agent-based model of consumer participation in de-mand response programs based on the Consumat framework is de-veloped. It will constitute the basis for an overall model to simulateconsumer decisions in the context of demand response.

Energy Informatics 2020, 3(Suppl 2):27 Page 14 of 29
Keywords: consumat; demand response; agent based simulation;consumerIntroductionOne of the most important measure to address climate change ef-fects is the global establishment of smart grid architectures. As oneof its essential technologies, demand response has to be enabled inthe residential sector to meet the European targets for a reduction ofgreenhouse gas emissions by 2030 (40% compared to 1990) and agreater share of renewable energy of at least 27% [1]. Demand re-sponse in this context refers to “changes in electric usage by end-usecustomers from their normal consumption patterns in response tochanges in the price of electricity over time, or to incentive paymentsdesigned to induce lower electricity use at times of high wholesalemarket prices or when system reliability is jeopardized” [2]. Based ondata from the US energy market (2014) demand response in the resi-dential sector contributes 20% of the total peak demand savings and61% of the overall energy savings [3].As shown in, e.g., [4] and [5] the success of a demand response pro-gram essentially depends on the end consumers’ participation andtheir behavior when configuring and using a DR system. A technicalsimulation model which integrates these soci-ological aspects wouldbe very helpful to support the deployment of a new energy infra-structure. Analyzing such socio-technical systems is a major researchfield. A review on literature has shown that agent-based modelsmight be considered as a preferred simulation tool (see, e.g., [6, 7, 8,9]). There exist several frameworks to model human decision makingprocesses in agent-based systems. An overview and guidelines aboutwhat kind of agent decision making model to be used is given in[10]. One of these frameworks is the so-called “Consumat” model ofJager and Janssen, first published in [11]. Several publications alreadyexist which use this approach to model sustainable behaviors butalso other types of decision making like farmer crop choices (see,e.g., [12, 13]). The aim of this work is to develop an agent-basedmodel of consumer participation in demand response programsbased on Consumat and to prove its suitability for further implemen-tation in an overall socio-technical demand response consumermodel.The Consumat approachThe socio-psychological framework of Consumat allows the agent-based simulation of human decision making in situations related toconsumption of goods or opportunities such as doing a specific ac-tivity, deciding where to live, and others. Details of the model and itsupdates as well as the underlying theoretical background can befound in [11, 14, 15, 16]. Within the Consumat design, the simulatedconsumers (consumats) have needs and they are equipped with abil-ities to satisfy these needs with a certain behavior. The decision onwhich behavior to perform depends on current uncertainty of theagent and its level of need satisfaction (LNS). In an update of theiroriginal framework Jager and Jannsen describe three main needforces [16]:
� existence: availability of economical resources like food,income, housing, etc.
� social: interactions with others, social affiliation� personality: individual tastes and characteristic
Several needs differently influence the overall level of need satis-faction and the outcome of a certain behavior may have contraryconsequences on the corresponding level of satisfaction for eachneed. Which behavioral options (opportunities) a consumat hasdepends on the domain/scenario being modeled. The Consumatapproach integrates uncertainty of an agent as a relevant factorfor decision making. In [14] uncertainty is described as the differ-ence between expectations and the real outcome of an action.The updated version of the Consumat framework [16] directlycouples it to the existence and social needs. With Consumat IIdifferent uncertainties concerning the several needs may havedifferent weights within the overall uncertainty. Depending ontheir uncertainty and LNS agents select specific decision strat-egies, based on the following key rules [16]:
� with decreasing satisfaction, an agent accepts more effort tofind the optimal behavioral option
� with increasing uncertainty, the behavior of other agentsbecomes more relevant
This leads to the four main possible cognitive processes for decisionmaking repetition, imitation, inquiring and optimization. Details aboutthe corresponding strategies can be found in section Demand re-sponse consumers as ‘consumats’: model description.Demand response consumers as ‘consumats’: model descriptionThe model developed within this project aims to represent thedecision-making of consumers to generally participate in demand re-sponse programs based on the Consumat approach. The consumers(agents) are characterized by individual levels of need satisfactionconcerning their financial abilities, perception of comfort and the en-vironmental state. Fig. 1 illustrates the adaption of the underlyingConsumat model (see [14]) on the decision behavior of a demand re-sponse consumer. Based on own results published in [4, 17, 18], thefollowing driving forces on the micro level were identified and inte-grated into the model:
� Needs: financial state, comfort, environmental state� Opportunity: participation in demand response program� Abilities: financial resources, general comfort requirements,
affinity for technology, acceptance� Uncertainty
Based on its level of need satisfaction and uncertainty an agent willselect the underlying cognitive process:
� Optimization: maximization of LNS based on own calculations� Inquiring: compare what similar others did with own
calculations and decide for maximum� Repetition: repeat decision of last tick� Imitation: copy last behavior of similar others
If an agent feels satisfied or uncertain, depends on individual thresh-olds LNSmin and Umax. To check the general suitability and logicalcorrectness of the model, first simulation runs based on an imple-mentation in NetLogo (version 6.0.4) with simplified assumptionsconcerning the model parameter have already been realized. Thepreliminary results indicate that in order for the model to be usedfor practical purposes, further investigation of realistic parameter set-tings will be necessary.Conclusion and OutlookThis work presents the development of an agent-based model ofconsumer participation in demand response programs based on theConsumat approach. At the current state of the project, the modelprovides a basic framework for further research on the variation ofthe agents’ general behavior in time and the influence of varying in-put parameters on participation decision. It may be used to find opti-mal policy options and measures to motivate consumers toparticipate in demand response programs. The model is scalable andcan be extended by an additional logic considering the short-termaspects of consumers’ interactions in the context of demand re-sponse. The underlying NetLogo tool allows interaction with othersimulation frameworks like, e.g., mosaik. Future work will focus ontwo aspects: (1) improve and refine the Consumat approach tomodel consumer participation in demand response programs and (2)integrate it in an overall model of consumer decisions in the demandresponse context.
AcknowledgementsThe authors would like to thank Claudia Binder, Sebastian Lehnhoff andGu¨nther Eibl for some fruitful and constructive discussions and theanonymous reviewers for their valuable feedback.
FundingPublication costs were covered by the DACH+ Energy InformaticsConference Organizers, supported by the Swiss Federal Office of Energy.

Fig. 1 (Research). Conceptual demand response consumer modelbased on Consumat
Energy Informatics 2020, 3(Suppl 2):27 Page 15 of 29
Funding by the Federal State of Salzburg under the WISS2025 program isgratefully acknowledged.
Availability of data and materialsNot applicable.
Author’s contributionsThe idea for this paper was developed by JS (95%) and DE (5%). The paperwas written by Judith Schwarzer.Editorial Work was done by DE. Both authors read and approved the finalmanuscript.
Competing interestsThe authors declare that they have no competing interests.
References1. European Commission: COM(2014) 15 final: A policy framework for
climate and energy in the period from 2020 to 2030 (2014), 1–18 (2012)2. Federal Energy Regulatory Commission: Assessment of Demand
Response & Advanced Metering. Technical report (2006)3. Owen Comstock: Demand response saves electricity during times of high
demand (2016). https://www.eia.gov/todayinenergy/detail.php?id=24872.Accessed 10.06.2020
4. Schwarzer, J., Kiefel, A., Engel, D.: The role of user interaction andacceptance in a cloud-based demand response model. In: IECON Pro-ceedings (Industrial Electronics Conference) (2013)
5. Miller, M.Z., Griendling, K., Mavris, D.N.: Exploring human factors effects inthe Smart Grid system of systems Demand Response. In: 2012 7thInternational Conference on System of Systems Engineering (SoSE), pp.1–6 (2012)
6. Moglia, M., Cook, S., McGregor, J.: A review of Agent-Based Modelling oftechnology diffusion with special reference to residential energy effi-ciency. Sustainable Cities and Society 31, 173–182 (2017)
7. Alonso-Betanzos, A., Sánchez-Maroño, N., Fontenla-Romero, O., Polhill,J.G., Craig, T., Bajo, J., Corchado, J.M. (eds.): Agent-Based Modeling of Sus-tainable Behaviors. Springer, Cham (2017)
8. Bonabeau, E.: Agent-based modeling: Methods and techniques for simu-lating human systems 99, 7280–7287 (2002)
9. Page, C.L., Bazile, D., Becu, N., Bommel, P.: Agent-Based Modelling andSimulation Applied to Environmental Management. In: Edmonds, B.,Meyer, R. (eds.) Simulating Social Complexity. Springer, ??? (2013). http://link.springer.com/10.1007/978-3-540-93813-2
10. Balke, T., Gilbert, N.: How Do Agents Make Decisions? A SurveyIntroduction : Purpose & Goals Dimensions of Comparison ProductionRule Systems 17(2014), 1–30 (2014)
11. Jager, W., Janssen, M.A., Vlek, C.A.J.: Consumats in a Commons Dilemma:Testing the Behavioural Rules of Simulated Consumers, p. 55 (1999)
12. Schaat, S., Jager, W., Dickert, S.: In: Alonso-Betanzos, A., Sánchez-Maroño,N., Fontenla-Romero, O., Polhill, J.G., Craig, T., Bajo, J., Corchado, J.M. (eds.)Psychologically Plausible Models in Agent-Based Simulations of Sustain-able Behavior, pp. 1–25. Springer, Cham (2017). https://doi.org/10.1007/978-3-319-46331-5 1
13. Moglia, M., Podkalicka, A., Mcgregor, J.: An Agent-Based Model of Resi-dential Energy E iciency Adoption
14. Jager, W.: Modelling Consumer Behaviour, p. 240 (2000). http://www.tijdschriftdepsycholoog.nl/assets/sites/6/DePsycholoog_nr10-2001.pdf#page=26
15. Jager, W., Janssen, M.A., De Vries, H.J.M., De Greef, J., Vlek, C.A.J.:Behaviour in commons dilemmas: Homo economicus and Homopsychologicus in an ecological-economic model. Ecological Economics35(3), 357–379 (2000)
16. Jager, W., Janssen, M.: An updated conceptual framework for integratedmodeling of human decision making: The Consumat II. Eccs 2012, 10(2012)
17. Fredersdorf, F., Schwarzer, J., Engel, D.: Die Sicht der Endanwender imSmart Meter Datenschutz. Datenschutz und Datensicherheit - DuD39(10), 682–686 (2015)
18. Schwarzer, J., Engel, D., Lehnhoff, S.: Conceptual Design of an Agent-Based Socio-Technical Demand Response Consumer Model. In: Proceed-ings - IEEE 16th International Conference on Industrial Informatics, INDIN2018 (2018)
P9A comprehensive framework for Smart Grid SimulationFederico Rosato*, Lorenzo Nespoli, Davide Strepparava and Vasco MediciInstitute for Sustainability applied to the built environment, Via Trevano,6952 Canobbio, CHCorrespondence: Federico Rosato ([email protected])Energy Informatics 2020, 3(Suppl 2):P9
SummaryResearch on the practical effects of control algorithms in smart gridsystems is often dependent on simulation, since the full modeling ofall the devices connected to the grid is usually not amenable to apurely theoretical analysis. Many open source core simulation pack-ages exist, but they typically involve only core network simulation,requiring custom scripting without offering advanced functionalityneeded for the full assessment of the solution tested. The OPTISIMpackage was born as an answer to the lack of a smart grid simulationframework offering a modular structure with a clear interface for thealgorithmic part, management of input and output data flows, graph-ing and configurability through JSON files. OPTISIM integrates state-of-the-art, freely available software components for network simula-tion, inter-process communication and time series database to offera comprehensive tool.Keywords: smart-grid; simulation; demand-response; demand-side-managementIntroductionA complete framework for the simulation of smart grids needs toprovide several features: power flow resolution, graphing, manage-ment of inputs and outputs, an interface for plugging in decision al-gorithms for managed flexibilities, integration of physical and controlmodels, et cetera. The OPTISIM framework was created as a tool cap-able of satisfying each of these needs, easing the core research taskof writing realistic models and novel centralized and distributed con-trol algorithms for demand side management and steering grid-connected apparel.Power Flow simulationThe electric simulation engine underlying OPTISIM is OpenDSS [1], afreely available, industry-grade distribution system simulator by EPRI.It is a fast, widely used and powerful simulator, but needs third-partybindings for usage with languages such as Python in order to beinterfaced with modern scientific computing packages. Many Pythonprojects exist offering thin wrappers around the core OpenDSS li-brary [2]. We created the Krangpower package [3] [4] with the aim toprovide several enhancements. Krangpower is built over the Open-DSSdirect.py thin wrapper and offers syntactic sugar such asoperator-based insertion of elements in the circuit and retrieval ofobjects through simple indexing. Furthermore:
� Items that OpenDSS returns as simple lists of floats,representing real and imaginary parts of flattened arrays ofphysical quantities, are returned as a numpy array [5] with thecorrect shape and format.

Energy Informatics 2020, 3(Suppl 2):27 Page 16 of 29
� Structured items such as the admittance matrix are returned asPandas DataFrame [6][7] for easier manipulation and export
� Items come, where appropriate, as Quantities (from the pint [8]package) including information on the measurement unit. Thisenables easy conversions and secures against miscalculations.
� The OpenDSS text interface is checked for errors (normally justreturned as strings without raising a Python error).
Another key additional feature is the ability of returning a graph(Networkx package, [9]) representing the underlying grid and featur-ing the simulation results as node/edge attributes, enabling ad-vanced graphing and analysis.Interaction with modelsMany of the most interesting smart grid studies involve co-simulation with physical models of batteries, heating, houses andother appliances connected to the grid. We will call them, generic-ally, ”agents”. OPTISIM offers the possibility to insert software modelsof these kind of objects directly into the simulation. These modelsare configured in a dedicated structured json file, whose parametersare fed to the constructor of these objects. During the main simula-tion cycle, OPTISIM computes the electrical consumption for everymodel, obtaining active and reactive powers that are then used toconfigure Krangpower for the following step. Often, these modelsneed time-series data streams as input for computing the final power(such as consumption profiles for uncontrolled loads, irradiance pro-files for the models of photovoltaic plants). In vanilla Krangpower, itis possible to use simple delimited files, leveraging the underlyingcapabilities of OpenDSS. In the OPTISIM framework, a more flexiblesolution was chosen, involving a time-series database, InfluxDB [10].The single agents, such as house models, batteries, etc., are aggre-gated under a single ”meter”, representing a commercial point of de-livery that owns the underlying appliances. Each meter with its agentmodels runs asynchronously, in a separate process, to achieve highconcurrency.Interaction with algorithmsThe central feature of OPTISIM is the ability to run separately algo-rithms for governing the behavior of the agents. This is to be distin-guished from the built-in, parametrized models of control circuitrythat are coded in the agents; we refer to computational, decisionalprocesses that govern the agents in order to obtain an individual orcollective goal, such as demand side management [11]. The scope ofthese algorithms is vast [12, 13] and they constitute the central itemof research that OPTISIM aims to aid. Examples of algorithms thatcan be experimented are individual self-consumption optimizers thatuse a forecast of local production and demand to optimally manageflexibility, or more complicated coordination schemes that involvecommunication between the agents and the iterative solution of anoptimization problem for achieving a common goal under certainsets of rules.Overview and message brokerAs we have seen, the OPTISIM framework involves several processesrunning in parallel (the main script with the power flow simulation,the database, the externally interfaced algorithms, the agent models).In figure 1, an overview of the whole modular architecture isdepicted, together with the data flows between the parts.Execution time and test runsThe OPTISIM package is written in Python language. The choice wasnatural, since it is a framework connecting several existing softwarepackages. The wide availability of bindings for all the tools involvedand the scripting nature of the project made the choice natural.Nevertheless, the tool is quite optimized. In Table 1 the performanceobserved with two examples of tests is reported. The two test gridsare the following:
� IEEE EU LV (modified): it is a stripped-down version of the IEEEEuropean Low Voltage test network [14]. The agents includethermal building models with heat pumps and boiler, rooftopPV, pure consumption profiles.
� LIC: it is a network modeled from real data from the LugaggiaInnovation Community [15] pilot project in Lugano (CH). Thedata was supplied by the local DSO, AEM.
In both cases, no algorithm is governing the devices connected to thegrid, but the agent physical models are included. Running control algo-rithms, naturally, can increase the time for taking a simulation step accord-ing to their complexity. Examples of results are shown in Figures 2 and 3.ConclusionIn this article, the OPTISIM framework was presented as a compre-hensive tool for simulating electrical grids interfaced with physicalmodels and management algorithms. The general architecture wasinvestigated and each of the modular components was described.The Python code for the project is under review and will be soonmade available to the community as open source.
AcknowledgementsThe authors would like to thank the Swiss Federal Office of Energy (SFOE),Fondo cantonale per le energie rinnovabili (FER) and Ente Regionale per loSviluppo del Luganese (ERSL) for their support.
FundingPublication costs were covered by the DACH+ Energy InformaticsConference Organizers, supported by the Swiss Federal Office of Energy.
Availability of data and materialsThe data for the Lugaggia Innovation Community were supplied by AEM SA,Switzerland in the context of a pilot project and are not publicly available.The data for the IEEE European Low Voltage test circuit are made availableby IEEE at https://site.ieee.org/pes-testfeeders/resources/.
Author’s contributionsAll the authors were involved in the architectural design, implementationand test of the OPTISIM platform.
References1. Dugan, R.C., McDermott, T.E.: An open source platform for collaborating
on smart grid research. In: IEEE Power and Energy Society GeneralMeeting (2011)
2. DSS Extensions: multi-platform OpenDSS extensions. https://dss-exten-sions.org/. Accessed 2020-06-13
3. Rosato, F., Medici, V., Rudel, R.: Krangpower: a smart grid simulation package.SCCER-FURIES 2018 Annual Conference. SUPSI_Institutional_Repository 10320,(2018). http://repository.supsi.ch/10320/
4. krangpower: Krangpower — krangpower 0.2.3 documentation. https://krangpower.readthedocs.io/en/master/. Accessed 2020-06-13
5. Van Der Walt, S., Colbert, S.C., Varoquaux, G.: The NumPy array: Astructure for efficient numerical computation. Computing in Science andEngineering 13(2), 22–30 (2011). 1102.1523
6. pandas development team, T.: Pandas-dev/pandas: Pandas7. Wes McKinney: Data Structures for Statistical Computing in Python. In:
Stéfan van der Walt, Jarrod Millman (eds.) Proceedings of the 9th Pythonin Science Conference, pp. 56–61 (2010)
8. Pint: a Python units library — pint 0.6 documentation. https://pint.readthedocs.io/en/0.6/. Accessed 2020-06-13
9. Hagberg, A., Swart, P., S Chult, D.: Exploring network structure, dynamics,and function using networkx (2008)
10. Naqvi, S.N.Z., Yfantidou, S., Zima´nyi, E.: Time series databases andinfluxdb. Studienarbeit, Université Libre de Bruxelles (2017)
11. Gelazanskas, L., Gamage, K.A.A.: Demand side management in smart grid:A review and proposals for future direction. Elsevier (2014)
12. Siano, P.: Demand response and smart grids - A survey (2014)13. Vardakas, J.S., Zorba, N., Verikoukis, C.V.: A Survey on Demand Response
Programs in Smart Grids: Pricing Methods and Optimization Algorithms.IEEE Communications Surveys and Tutorials 17(1), 152–178 (2015)
14. Schneider, K.P., Mather, B.A., Pal, B.C., Ten, C.W., Shirek, G.J., Zhu, H., Fuller,J.C., Pereira, J.L.R., Ochoa, L.F., De Araujo, L.R., Dugan, R.C., Matthias, S.,Paudyal, S., McDermott, T.E., Kersting, W.: Analytic Considerations andDesign Basis for the IEEE Distribution Test Feeders. IEEE Transactions onPower Systems 33(3), 3181–3188 (2018)
15. LIC – LIC Project. https://lic.energy/. Accessed 2020-06-13

Fig. 1 (abstract P9). Scheme of the OPTISIM architecture
Table 1 (abstract P9). Simulation performance
Intel® CoreTM i9-7960X @2.80 GHz; 128GB DDR4 @ 3200 MT/s
nr. nodes nr. meters nr. agents wall-clock time perstep
IEEE EU LV (modified) 207 107 447 715 ms
LIC 24 21 120 250 ms
Fig. 2 (abstract P9). Simulation output for a building model
4https://keras.io/about/
Energy Informatics 2020, 3(Suppl 2):27 Page 17 of 29
P10Recognition and prediction of heat pump state of operation fromsmart meter dataBraulio Barahona*, Andreas Melillo , Esther Linder , Jörg Wortlitschek andPhilipp SchuetzCC Thermal Energy Storage, Institute for Mechanical Engineering andEnergy Technology, Department of Engineering and Architecture,Lucerne University of Applied Sciences and Arts, Technikumstrasse 21,6048, Horw, CHCorrespondence: Braulio Barahona ([email protected])Energy Informatics 2020, 3(Suppl 2):P10
SummaryAs the transition to cleaner and more efficient systems for coolingand heating speeds up, it becomes more and more relevant to man-age their electrical consumption to avoid overloading the electricalgrid. The focus of this work is on recognizing the operational state ofheat pump (HP) systems on the basis of smart meter data. For thispurpose, we illustrate the application of time series classificationmethods and deep learning models on a monitoring data set that in-cludes ground truth information of the HP operating state. Poten-tially, the information of HP state of operation can facilitate theirintegration to the grid.
Fig. 3 (abstract P9). Simulation output for a heat pump model
Keywords: Digital meter data; Heat pumps; Data science; Time seriesclassification; Deep learningMotivationAn important share of the heat demand in Switzerland is already pro-vided by heat pumps. However, it is necessary to speed up this tran-sition from non-efficient and polluting heating systems to moresustainable ones. The electrification of these loads can bring thermaland voltage problems in low voltage networks. [1] Thus, besidesplanning and design aspects, an important aspect for the integrationof these highly efficient heating systems into the grid is to controlthem such that bottle necks in the flow of electricity are prevented.[2] Traditional demand side management (DSM) techniques still inuse today, consist of deactivating loads, such as heat pumps, duringpeak consumption times. Novel coordinated control of larger num-bers of loads opens the possibility of new DSM business cases. How-ever, this requires understanding of the operation of the HPcomponents to avoid disrupting their duty cycles and potentiallydamaging the equipment.Methods for recognition of heat pump operating modesAs the roll out of digital-meters continues practically in every utility,numerous research and innovation projects have looked at utilizingthese data to better manage loads (DSM). When it comes to HPswithin those loads behind the meter, aspects studied are relatedtheir control, identification and characterization. [3, 4] Our work con-cerns the identification of the HP state of operation. For this purpose,methods developed in previous work make use of classical machinelearning (i.e. feature engineering, dimensionality reduction, cluster-ing), Bayesian change point detection approaches, and deep learn-ing. The classical approach consists, essentially, of two steps (1) cyclerecognition (i.e. cycles may be of different durations), and (2) classifi-cation of each cycle into one of the possible HP states. The classifica-tion takes places in a feature space corresponding to varioussummary metrics of each cycle. On the other hand, when applyingartificial neural networks (NN), the cycle duration is fixed and the NNis trained to learn the mapping between the HP cycle-power con-sumption time series and the labels indicating the operating state(e.g. off, space heat, or hot water in Figure 1). Other common ap-proaches for time series classification such as dynamic time wrap-ping, longest common subsequece, or clustering have not yet beenapplied.Here, in order to derive a method that is applicable to systems fromany manufacturer, we abstract the different HP operating states intothe most relevant ones: off, hot water (HW), and space heating (SH).Since our focus is on recognizing the operational state of heat pump(HP) systems with algorithms that can potentially by applied near-real time to inform control decisions, we investigate one dimensionalconvolutional NNs. Compared to recurrent NN, which have feedbackloops between output and input, low complexity convolutionalneural networks (CNNs) have been shown better performance on se-quence modelling tasks. [5, 6] A simple model of a NN can serve asgood baseline for more advance deep learning models, recently such1D-CNN type of models have been applied to electricity load fore-casting [7], and prediction of energy efficiency of domestic coolingsystems. [8] For the implementation of the models we use Tensor-Flow [9] (v2.2.0) through its high-level application interface Keras.4
Data sets and modelsIn the context of this work, we explore several datasets, Table 1 de-scribes three of them. The HSLU data is collected for load disaggre-gation research. However it also includes power consumption andspecifications of HPs in operation, along with relevant building infor-mation for thermal analyses. The NTB Buchs and the WP Monitordata concerns dedicated HP research activities aimed at evaluatingthe efficiency of HP systems. Thus, besides the energy consumptiondata typically recorded by digital energy meters; temperature, volu-metric flow, and power consumption are recorded by dedicated sen-sors. Moreover, binary variables indicating the operation of keycomponents such as compressors, pumps, electrical backup heaters,cooling circuits, and storage tanks are provided. Here, we use thosevariables to label data with the corresponding state of operation.

Fig. 1 (abstract P10). Load profile and states of an air source HP(PLZ92242) from WP Monitor data set
Energy Informatics 2020, 3(Suppl 2):27 Page 18 of 29
Figure 1 shows the compressor power consumption and state of op-eration of an air source HP during a winter day.State encodings. From the NTB Buchs and WP monitoring data is pos-sible to derive ground truth information about the state of operation.We apply the following steps: (1) define a set of N components, e.g.compressor, pumps, and electrical backup heater; (2) select binaryvariables b that describe the state of each component i at each timestep; where b = 0 and b = 1 stand for component i off and on re-spectively; (3) given the state of each component i in b , encode theHP state as a concatenation of them; and (4) from the space of states2|N| abstract the states S = {off, space heat, hot water} on the basis ofthe engineering understanding of the heat pump. Table 2 showssummary statistics of the encoded states for a year of operation, asexpected states have distinctive statistical features.Modelling and prediction. Our model takes as input compressorpower consumption X and outputs states S, it consists of stacked 1D-convolutional layers nL with a given number of filters, filter size k8,causal padding, and dilation rate r. The model parameters arelearned with Adam optimizer to minimize mean squared error. Learn-ing rate 0.1, 60 epochs with batch size 120 yield reasonable results,however for some experiments these maybe adjusted to speed upconvergence or avoid overfitting. Evaluation of model prediction isdone calculating the accuracy of the predictions compared to thetrue states. We test different model configurations (nL, k8, r) and looka head horizons (hours to day-ahead) to illustrate their impact onforecast accuracy and on computing resources (training and infer-ence time, and model size).Final remarks and outlookSeveral data sets are available to study the behaviour of heat pumpsas seen from the grid, but dedicated monitoring campaigns are valu-able to observe the behaviour behind the meter. We use these datato encode the heat pump state of operation, and evaluate the per-formance of one dimensional convolutional neural networks (1D-CNNs) with different configurations to predict the time evolution ofthe states. As expected, sudden changes of states are hard to predictcorrectly. However, training these networks with only a couple ofhours of training data, on a laptop takes less than a minute for thedeepest network (4 convolutional layers) we tested. Thus, it seemsfeasible to run them in an online fashion. Training on a full year of 1-minute data, for the deepest network takes up to 20 minutes. Nextsteps in our research involve the evaluation of models to predict en-ergy consumption at different levels of aggregation.
AcknowledgementsWe kindly acknowledge the support from Matthias Berthold from the Institutefor Energy Systems, University of Applied Sciences Buchs, to understand theNTB Buchs data format, and Robert Langner from Fraunhofer Institute for SolarEnergy Systems ISE for facilitating acces to WP Monitor data.
FundingThis research is partly supported by Innosuisse–Swiss Innovation Agencyunder contract 25824.2 PFES-ES. Publication costs were covered by theDACH+ Energy Informatics Conference Organizers, supported by the SwissFederal Office of Energy.
Availability of data and materialsHSLU data is openly available, NTB Buchs and WP Monitor data are availableupon request to the respective parties. Scripts for the models can beavailable upon request.
Competing interestsThe authors declare that they have no competing interests.
References1. Navarro-Espinosa, A., Mancarella, P.: Probabilistic modeling and assess-
ment of the impact of electric heat pumps on low voltage distributionnetworks. Applied Energy 127, 249–266 (2014)
2. Six, D., Desmedt, J., Vahnoudt, D., Bael, J.: Exploring the flexibilitypotential of residential heat pumps combined with thermal energystorage for smart grids. In: 21th International Conference on ElectricityDistribution, Paper, vol. 442 (2011)
3. Fei, H., Kim, Y., Sahu, S., Naphade, M., Mamidipalli, S.K., Hutchinson, J.:Heat pump detection from coarse grained smart meter data withpositive and unlabeled learning. In: Proceedings of the 19th ACM SIGKDD International Conference on Knowledge Discovery and Data Mining,pp. 1330–1338 (2013)
4. Le Ray, G., Christensen, M.H., Pinson, P.: Detection and characterization ofdomestic heat pumps. In: 2019 IEEE Milan PowerTech, pp. 1–6 (2019).IEEE
5. Bai, S., Kolter, J.Z., Koltun, V.: An empirical evaluation of genericconvolutional and recurrent networks for sequence modeling. arXivpreprint arXiv:1803.01271 (2018)
6. Dürr, O., Sick, B., Murina, E.: Probabilistic Deep Learning with Python,Keras and TensorFlow Probability. Manning Publications Co., New York,NY (2020)
7. Lang, C., Steinborn, F., Steffens, O., Lang, E.W.: Electricity load forecasting–an evaluation of simple 1d-cnn network structures. arXiv preprintarXiv:1911.11536 (2019)
8. Kittisarakul, S., Banjerdpongchai, D.: Convolutional neural networks forpredicting energy efficiency of air conditioning systems. In: 2020 17thInternational Conference on Electrical Engineering/Electronics, Computer,Telecommunications and Information Technology (ECTI-CON), pp. 792–795 (2020). IEEE
9. Abadi, M., Agarwal, A., Barham, P., Brevdo, E., Chen, Z., Citro, C., Corrado,G.S., Davis, A., Dean, J., Devin, M., Ghemawat, S., Goodfellow, I., Harp, A.,Irving, G., Isard, M., Jia, Y., Jozefowicz, R., Kaiser, L., Kudlur, M., Levenberg,J., Mane, D., Monga, R., Moore, S., Murray, D., Olah, C., Schuster, M., Shlens,J., Steiner, B., Sutskever, I., Talwar, K., Tucker, P., Vanhoucke, V., Vasudevan,V., Viegas, F., Vinyals, O., Warden, P., Wattenberg, M., Wicke, M., Yu, Y.,Zheng, X.: TensorFlow: Large-Scale Machine Learning on HeterogeneousSystems. Software available from tensorflow.org (2015). https://www.tensorflow.org/
10. Prinzing, M., Berthold, M., Eschmann, M.: Bericht «WP-FeldmessungenJahresbericht 2018» Feldmessungen Warmepumpen-Anlagen 2015-2018(Auswertung verlangert bis Dez. 2019). https://www.ntb.ch/fileadmin/NTB_Institute/IES/pdf/Projekte_WPZ/2018_Jahresbericht_Feldmessungen.pdf. Accessed: 2020-08-18 (2018)
11. Arpagaus, C., Berthold, M., Eschmann, M.: Bericht «Messung der Effizienzder Trinkwasserer-warmung bei Warmepumpenanlagen im Feld». https://www.bfe.admin.ch/bfe/de/home/versorgung/energieeffizienz/umge-bungswaerme.exturl.html/aHR0cHM6Ly9wdWJkYi5iZmUuYWRtaW4uY2gvZGUvcHVibGljYX/Rpb24vZG93bmxvYWQvOTM1NQ==.html. Accessed:2020-08-18 (2019)
12. Günther, D., Miara, M., Langner, R., Helmling, S., Wapler, J.: Wp monitorfeldmessung von wärmepumpenanlagen. Fraunhofer-Institut für SolareEnergiesysteme (ISE): Freiburg, Germany, 104 (2014)
13. Huber, P., Ott, M., Friedli, M., Rumsch, A., Paice, A.: Residential powertraces for five houses: The ihomelab rapt dataset. Data 5(1), 17 (2020)

Table 1 (abstract P10). Three data sets including
Description
NTB Buchs [10,11]
High resolution (10-second) monitoring campaign to investigateHP performance aspects, such as: start-up behaviour, defrosting,and influence of auxiliary equipment on efficiency. Up to 13 HPsystems (air-water, brine-water, variable speed, systems with cool-ing, new and renovated systems) were monitored for up to 3years.
WP Monitor[12]
Monitoring campaign for benchmarking efficiency of different HPtechnologies. A total of 87 HPs (direct evaporation systems,ground source HPs, and variable speed compressor HPs) weremonitored during three years (1-minute resolution). Partiallyanonymized data from three HP that complies to German data-privacy law is accessible.
HSLU [13] Load monitoring open data from digital meters and othersensors in five houses. 1.5 up to 3.5 years at 5-minute resolution.Power consumption data from HPs (air-water, and brine-water) inthree of the houses along with HP specifications and building en-velope information.
Energy Informatics 2020, 3(Suppl 2):27 Page 19 of 29
Table 2 (abstract P10). Compressor power [W] summary statistics perstate of ground source HP during 2011 from WP Monitor data set
count mean std min 25% 50% 75% max
off 425884 0 1 0 0 0 0 180
space heat 81284 1199 169 60 1200 1200 1260 2160
hot water 18432 1841 287 60 1680 1920 2040 2280
PW1Applications of Non intrusive Load Monitoring in smart homesHafsa Bousbiat ([email protected])Alpen-Adria-Universität Klagenfurt, Universitätsstraße 65-67, 9020Klagenfurt,Energy Informatics 2020, 3(Suppl 2):PW1
SummaryThe massive deployment of low-frequency smart meters around theglobe is putting more and more attention on Non Intrusive LoadMonitoring (NILM) approaches and their potential applications insmart homes. NILM techniques are a set of approaches that rely on asingle metering point (the smart meter) to identify individual appli-ances consumption in the household. In this paper, the author pointsout some open research challenges in the field of NILM and their realapplications in smart homes through an overview of the literature,gives the formulation of three research questions related to theseopen challenges and provide an outline of future research through adescription of the methodology and expected outcomes.Keywords: Load disaggregation; Social acceptance; Ambient andAssisted LivingIntroductionThe current century is challenged by the growing rate of the ageingpopulation and the potential lack of energy resources [1]. A newgeneration of intelligent home energy management systems basedon NILM techniques using the data gathered by these meters canhelp tackle both issues. Besides of allowing for more efficient energyconsumption in residential sector, NILM approaches can also enablethe detection of various health care features (e.g. inactivity, sleep dis-orders, memory issues, ...) [2] and offer more independence for theelder population. In this paper, the author highlights the open re-search problems related to NILM approaches and their applicationsin smart homes in relation to the previous two challenges. It particu-larly analyses the problem related to the accuracy of NILM tech-niques, the social acceptance of these systems and their effect onthe two aforementioned applications.Related workA major open research challenge in NILM is the comparability of theproposed algorithms [3, 4] as scholars generally use different
evaluation setups. A recent contribution in this vein was proposed in[5] where 12 NILM benchmarks have been implemented and madeavailable as an open-source project including both traditional and re-cent deep approaches. The same study proposed an experimentalevaluation of the implemented algorithms and demonstrated the su-periority of sequence-to-sequence (Seq2Seq) and sequence-to-pointmodels (Seq2Point) in different scenarios. These models were in-spired machine translation where they achieved very good results [6,7]. The Seq2Seq learning is about training models to convert se-quences from one domain another domain. The Transformer [7]model is so far the best model for Seq2Seq modeling. However, tothe best of our knowledge, there has been no proposition to adaptthis model for NILM. Scholars demonstarted that NILM can improveenergy efficiency by increasing user’s knowledge about their appli-ances [8, 9] which was also pointed as a preference by several socialstudies about SM acceptance [10, 11]. Recent works also proposedactivity monitoring and the detection of abnormal behaviourthrough electrical signatures [12, 13, 2]. The benefit of this approachis its flexibility, low-cost and ubiquity [2]. However, the major chal-lenge is to provide enough accuracy for these applications as it wasrepeatedly pointed out in that the disaggregation accuracy propor-tionally increases as the sampling frequency does [2, 13]. This moni-toring approach has been well accepted by subjects, as well asprofessionals, during experiments due to their low intrusiveness [13].However, concerns like privacy still are present and can prevent suchsolutions from reaching their full potential [2]. Recent studies [14, 15]suggest that the acceptance of systems based on Smart Meters (SM)is governed by many concerns that individuals have, this includesbut is not limited to: effects on health, cost and installation visits.Therefore, considering the end-users beliefs and concerns should betaken into consideration before the design of any services enabledby this technology. Carefully designed services have the potential tochange a user’s attitude toward SM. Matter of fact, several studies onacceptance showed that it usually follows a U-shaped curve fromhigher acceptance in the first beginning to relatively low acceptanceduring real deployment to again gain a higher acceptance when theproject is finished and the user can perceive its concrete benefits[16]. However, to the best of our knowledge, only few studies consid-ered this aspect.Research questionsThe research goals of current and future analysis of the authorare to contribute to the improvement of existing NILM ap-proaches, establish a set of user’s requirements for SM based sys-tems and finally evaluate how such systems can influencedecision making in smart homes. RQ 01: How can deep modelsfor NILM be improved? The author argues that adapting theTransformer model for NILM can enhance the performance andprovide more understandable model through its attention mech-anism. Matter of fact, establishing an understandable model forNILM will allow to establishing a cause-effect relationship be-tween the observed results and the errors made by the model. Itwill, therefore, allow for more accurate models and thus enhancethe user’s trust in the system which will partially contribute toRQ 02. RQ 02: With NILM techniques many services can be en-abled, what is the user attitude towards those services? and howcan the acceptance and engagement of costumers with NILMbased services be improved? Understanding the users’ concernsand key factors influencing their engagement would help in es-tablishing a set of requirements for the design of those services.It would also help utility companies to avoid costly consequencesof rejections by consumers after installations. RQ 03: Taking intoconsideration results of RQ 01 as well as RQ 02, how can NILMservices support decision making in smart homes in the case ofelementary family and the case of elderly people living alone?Advanced home energy management systems based on NILMcan influence human behaviour towards much efficient consump-tion and help make appropriate interventions in the case of eld-erly living alone (e.g. providing warning for carers or familymembers). However, in the first case, more efforts on design ele-ments of those systems should be carried out to assess their po-tential effects on the consumer’s engagement. Besides, in the

Energy Informatics 2020, 3(Suppl 2):27 Page 20 of 29
case of the elderly monitoring, well-thought scenarios should bedesigned to evaluate and assess the applicability of thesesystems.Though the three research questions seem to be divergent, they arehighly linked to each other. Matter of fact, improving the perform-ance of NILM from RQ 01 would lead to higher accuracy and is thusa key factor to improve user’s trust and contribute to address the RQ02. The outcomes of RQ 01 and RQ 02 will theoretically help designa more performant and higher accepted services whose real effectwill be evaluated during the RQ 03.MethodologyAs a first step in evaluating the proposal, the author implemented anenergy measurement system based on open-source solutions in a liv-ing lab environment [12] and conducted a set of experiments thatshowed great potential for NILM approaches in the domain of Ambi-ent And Assisted Living (AAL). In the next step, the author is willingto work towards answering the first research question by extendingthe previous system with an advanced NILM technique. This tech-nique will consist of an adapted version of the Transformer for NILM.This model will be validated using established datasets(e.g UK-dale,REDD) and compared to already available benchmarks. For reproduci-bility purpose, the implementation of this model will be made avail-able as part of the open-source project describe in related work. Thisimplementation will later serve as a back-end for the systems buildin RQ 03. The second research question will be addressed using acase study of consumer’s from an energy utility in Carinthia, Austria.First, the author intends to perform a literature review of recent insti-tutional documents dealing with the acceptance, attitude and en-gagement of customers with energy services. The previous study willhelp select an appropriate model explaining the acceptance whichwill be the core to design a questionnaire study. The questionnairewill be disseminated to real customers from energy utility which willhelp to validate the hypothesis of the previous model. RQ 02 is ex-pected to provide a set of user’s requirements and preferences forenergy services. As for the third research question, an intelligenthome energy management system will be developed based on re-quirements from RQ 02. This system will use the NILM approach fromRQ 01 to provide two components: (1) energy feedback about house-hold consumption, (2) activity monitoring and abnormal behaviourdetection. Thus, the evaluation of the system will be made in two in-dependent steps. In the first step, focus groups of an ordinary con-sumer’s from different ages will be recruited to assess differentdesign elements on their attitude. In the second step, focus groupsof health carers will be recruited to evaluate the real applicability ofthe monitoring system in the case of elderly living alone.ConclusionIn this paper, the author discussed her motivations, research ques-tions as well as the methodology she intends to use during her pro-ject. The overall goal of the author is to evaluate the potential ofNILM based ICT systems to influence decision making in smarthomes (RQ 03) which rely on both accurate data (RQ 01: improvingalready established NILM approaches) and user’s requirements forsuch services (RQ 02: user’s concerns and requirements).AbbreviationsAAL Ambient And Assisted Living. 3NILM Non Intrusive Load Monitoring. 1–3SM Smart Meters. 2
AcknowledgementsThis work was supported by the Digital Age Research Center (D!ARC) via theDECIDE Doctoral College. The author would like to thank Professor DominikEngel for providing detailed and valuable feedback.
FundingPublication costs were covered by the DACH+ Energy InformaticsConference Organizers, supported by the Swiss Federal Office of Energy.
Availability of data and materialsData sharing is not applicable to this article as no datasets were generatedor analysed during the current study.
Author’s contributionsBH analysed related work, identified a set of open challenges and designed aresearch proposal for her PhD project.
Competing interestThe author declares that she has no competing interests.
References1. Surviving and Thriving in the 21st Century. The Commission for the
Human Future (CHF). "https://humanfuture.net/sites/default/files/CHF_Roundtable_Report_March_2020.pdf"
2. Ruano, A., Hernandez, A., Ureña, J., Ruano, M., Garcia, J.: Nilm techniquesfor intelligent home energy management and ambient assisted living: Areview. Energies 12(11), 2203 (2019)
3. Pereira, L., Nunes, N.: Performance evaluation in non-intrusive load moni-toring: Datasets, metrics, and tools—a review. Wiley Interdisciplinary Re-views: data mining and knowledge discovery 8(6), 1265 (2018)
4. Herrero, J.R., Murciego, ´A.L., Barriuso, A.L., de La Iglesia, D.H., González,G.V., Rodríguez, J.M.C., Carreira, R.: Non intrusive load monitoring (nilm): Astate of the art. In: International Conference on Practical Applications ofAgents and Multi-Agent Systems, pp. 125–138 (2017). Springer
5. Batra, N., Kukunuri, R., Pandey, A., Malakar, R., Kumar, R., Krystalakos, O.,Zhong, M., Meira, P., Parson, O.: Towards reproducible state-of-the-art en-ergy disaggregation. In: Proceedings of the 6th ACM International Con-ference on Systems for Energy-Efficient Buildings, Cities, andTransportation, pp. 193–202 (2019)
6. Weiss, R.J., Chorowski, J., Jaitly, N., Wu, Y., Chen, Z.: Sequence-to-sequencemodels can directly translate foreign speech. arXiv preprintarXiv:1703.08581 (2017)
7. Vaswani, A., Shazeer, N., Parmar, N., Uszkoreit, J., Jones, L., Gomez, A.N.,Kaiser, L., Polosukhin, I.: Attention is all you need. In: Advances in NeuralInformation Processing Systems, pp. 5998–6008 (2017)
8. Ehrhardt-Martinez, K., Donnelly, K.A., Laitner, S., et al.: Advanced meteringinitiatives and residential feedback programs: a meta-review for house-hold electricity-saving opportunities. (2010). American Council for anEnergy-Efficient Economy Washington, DC
9. Monacchi, A., Versolatto, F., Herold, M., Egarter, D., Tonello, A.M.,Elmenreich, W.: An open solution to provide personalized feedback forbuilding energy management. Journal of Ambient Intelligence and SmartEnvironments 9(2), 147–162 (2017)
10. Darby, S.: Smart metering: what potential for householder engagement?Building research & information 38(5), 442–457 (2010)
11. Vassileva, I., Campillo, J.: Consumers’ perspective on full-scale adoption ofsmart meters: A case study in västerås, sweden. Resources 5(1), 3 (2016)
12. Bousbiat, H., Klemenjak, C., Leitner, G., Elmenreich, W.: Augmenting anassisted living lab with non-intrusive load monitoring. In: 2020 IEEE Inter-national Instrumentation and Measurement Technology Conference(I2MTC), pp. 1–5 (2020)
13. Alcalá, J.M., Ureña, J., Hernandez, A., Gualda, D.: Sustainable homecaremonitoring system by sensing electricity data. IEEE Sensors Journal17(23), 7741–7749 (2017)
14. Chawla, Y., Kowalska-Pyzalska, A.: Public awareness and consumer accept-ance of smart meters among polish social media users. Energies 12(14),2759 (2019)
15. Bugden, D., Stedman, R.: A synthetic view of acceptance andengagement with smart meters in the united states. Energy Research &Social Science 47, 137–145 (2019)
16. Devine-Wright, P.: Beyond nimbyism: towards an integrated frameworkfor understanding public perceptions of wind energy. Wind Energy: AnInternational Journal for Progress and Applications in Wind Power Con-version Technology 8(2), 125–139 (2005)
PW2Real-Time Capable Optimal Power Flow With Artificial NeuralNetworksThomas Wolgast ([email protected])Leibniz University Hannover, Welfengarten 1, 30167 Hannover, GermanyEnergy Informatics 2020, 3(Suppl 2):PW2

5Over-fitting: The ANN is not able to generalize to new data, but only”memorizes” its training data.6Generalization: The ability of ANNs to achieve good results for data
Energy Informatics 2020, 3(Suppl 2):27 Page 21 of 29
SummaryOptimal power flow algorithms can be used to optimally controlpower systems and to reduce need for grid expansions this way.However, optimization of power systems is a complex problem andstill hardly possible in real-time, which would be necessary for gridcontrol. In this doctoral project, a methodology is proposed to trainartificial neural networks with the results from offline optimizationsin order to speed-up calculation and to ensure feasibility of theoptimization. That is expected to achieve fast and near-optimal re-sults, but also allows for high modularity, which reduces engineeringeffort and makes the approach applicable to diverse use cases.Keywords: Real-Time; Optimal Power Flow; Machine Learning; DeepLearning; Optimal Control; Grid RegulationIntroductionThe transformation of the energy system results in an increasingnumber of small actuators in the distribution grids called distributedenergy resources (DERs). Most of these new actuators have fluctuat-ing active power demand or feed-in, e.g. solar units, wind turbines,or energy storage systems. Not only are those fluctuations difficult topredict, but also may superimpose each other locally, resulting involtage problems, overloading of lines and transformers, and hightransmission losses. This decreases power quality and endangers sys-tem stability.One approach to these problems are massive grid expansions,but these are expensive and undesired by society. To minimizethe need for grid expansions, it is necessary to exploit the exist-ing infrastructure as far as possible. Especially distribution gridsare mostly operated in a passive way still, which means that thedistribution system operators barely perform active interventionsto optimize the state of the grid regarding efficiency or stability.The mentioned new actuators technically provide a lot of activeand reactive power flexibility to make active control operationspossible.Searching the optimal state of an electrical grid is called the optimalpower flow (OPF) problem [1]. However, the OPF is a highly complexoptimization problem that is difficult to solve fast and in real-time,especially considering large-scale systems with complex constraints[2]. Consequently, real-time capable OPF (RT-OPF) approaches arepursued to make it applicable to grid control. Such a RT-OPF wouldenable grid operators to keep their grids in optimal statecontinuously.State of the ArtOPF is an umbrella term for procedures that find the optimal steady-state of a power system considering operational constraints and con-trol limits [1]. Generally, the OPF is a large-scale non-convex non-linar optimization problem that often contains discrete variables anduncertainty, which makes it difficult to solve [2].OPF algorithms are mainly used by transmission system operatorsto plan future grid control operations. That is done in 15 minuteintervals or day-ahead, because of its computational complexity[3]. There is a trend towards corrective control, thus reacting tocontingencies instead of anticipating them beforehand. Thatmeans less constraints and better exploitation of the power sys-tem [4].Lots of RT-OPF approaches emerged in recent years [2]. This workfocuses on artificial neural network (ANN)-based approaches, be-cause they allow for abstraction from the original OPF formula-tion, which makes them applicable to various OPF variants. Theusual approach from literature is visualized in Figure 1. A conven-tional offline OPF is performed thousands of times for differentgrid states to create a training data-set, which consists of a map-ping of grid states to respective optimal set-points of the actua-tors within the grid. The generated training data is then used totrain a multi-layer perceptron (MLP)-ANN so that it can approxi-mate the optimization for a given power system. This way, theoptimzation problem is transformed to a ANN inference – a seriesof simple matrix multiplications. Because of that, calculation timecan be reduced and convergence problems are not possible any-more. MLPs are mainly used in literature because they are thestandard ANN architecture and because they are proven generalfunction approximators [5].
Pan et al. [6] use MLPs to map load values to results of the DC-OPF –a simplified OPF that neglects reactive power flows. They achieved acalculation speed-up of three orders of magnitude. To prevent over-fitting,5 they used multiple ten thousand random sampled trainingdata points. However, for training data generation, they varied loadsonly in the range of ±10%, which is a too small solution space toallow for good generalization.6
Zamzam and Baker [7] as well as Guha et al. [8] use MLPs to approxi-mate the standard AC-OPF, which is more complex than the DC-OPF.They mapped load values to the optimal set-point of actuators again,achieving a precision of more than 99% in relation to the basic OPF.ApproachThe aforementioned publications were mostly published in 2019 or2020 and are in an early proof-of-concept stage. That results in someshortcomings, which are aimed to be resolved with this work. First,all respective works consider a specific variant of the OPF problemfor a given power system and present a handcrafted ANN-OPF forthat problem. However, countless variants of the OPF problem existand design by hand results in lot of engineering effort. Instead, auto-mation of this process is required. Figure 2 sketches the general ideahow a conventional OPF can be transformed to an ANN-OPF in anautomatic or semi-automatic way. Each of the framed boxes isplanned to be interchangeable to achieve high modularity. For ex-ample, exchange of the power system model enables automatic de-sign of control algorithms that are optimal for a given power system.This general idea was proposed in a previous work [9], instead ofusing generic concepts that are not optimized for specific grids. TheOPF itself is highly modular as well, because diverse objective func-tions and system constraints can be chosen. This also applies to theANN training algorithms, which can be chosen from literature. Themodularity results in high generality and little engineering effort, be-cause parts of the total design flow can be exchanged easily to applythe methodology to various kinds of problems.Second, most publications use MLP-ANNs as architecture to learn theOPF. Diverse other architectures were not tested yet. For example, re-current neural networks can be expected to be a useful for themulti-stage OPF problem over a time-frame, instead of a single sta-tionary grid state.Third, the presented approach from literature requires tens or hun-dreds of thousands of offline generated training data samples, whichis computationally expensive, if complex OPF variants have to besolved. An alternate promising approach would be to map the OPFproblem to the training process of the ANN, so that the trainingprocess implicitly solves the optimization problem. Hopfield networkscan be used in such a way to solve optimization problems [10].The listed shortcomings and their respective proposed solutions shallbe pursued in the doctoral project to achieve an ANN-OPF that is us-able for realistic use-cases, considering engineering effort and qualityof solutions. To test the quality of solutions, the resulting ANN-OPFwill be applied to several use cases on benchmark grids like the sim-bench grids [11]. Use cases are OPF applications in grid control, e.g.voltage control, re-dispatch, or clearing of ancillary service markets,which is often done using an OPF [12]. Metrics for evaluation will be1) deviation from the conventionally generated OPF solution asground truth, 2) number and magnitude of constraint violations, 3)robustness against missing or faulty data input and outages withinthe grid, and 4) computation time. The formal definition of the met-rics is still to be done. The appliance of a trained ANN-OPF to mul-tiple close-to-reality use cases is another step that was notsufficiently done in literature yet.Conclusion and OutlookThe presented doctoral project attempts to make the solution of OPFproblems faster and real-time capable by using ANNs to transformthe optimization problem into simple matrix multiplications by train-ing. In this work, it is aimed to advance the methodology to applic-ability in real-world situations by lowering the engineering effort for
points that were not used in training.
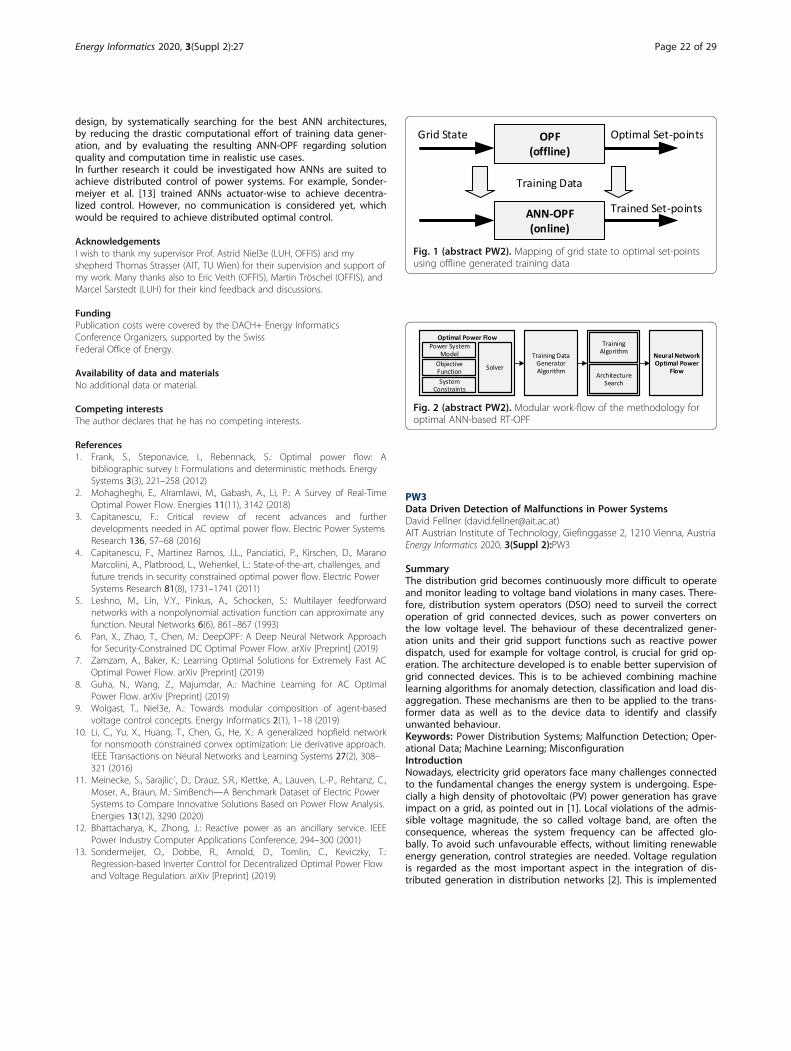
Fig. 1 (abstract PW2). Mapping of grid state to optimal set-pointsusing offline generated training data
Fig. 2 (abstract PW2). Modular work-flow of the methodology foroptimal ANN-based RT-OPF
Energy Informatics 2020, 3(Suppl 2):27 Page 22 of 29
design, by systematically searching for the best ANN architectures,by reducing the drastic computational effort of training data gener-ation, and by evaluating the resulting ANN-OPF regarding solutionquality and computation time in realistic use cases.In further research it could be investigated how ANNs are suited toachieve distributed control of power systems. For example, Sonder-meiyer et al. [13] trained ANNs actuator-wise to achieve decentra-lized control. However, no communication is considered yet, whichwould be required to achieve distributed optimal control.
AcknowledgementsI wish to thank my supervisor Prof. Astrid Niel3e (LUH, OFFIS) and myshepherd Thomas Strasser (AIT, TU Wien) for their supervision and support ofmy work. Many thanks also to Eric Veith (OFFIS), Martin Tröschel (OFFIS), andMarcel Sarstedt (LUH) for their kind feedback and discussions.
FundingPublication costs were covered by the DACH+ Energy InformaticsConference Organizers, supported by the SwissFederal Office of Energy.
Availability of data and materialsNo additional data or material.
Competing interestsThe author declares that he has no competing interests.
References1. Frank, S., Steponavice, I., Rebennack, S.: Optimal power flow: A
bibliographic survey I: Formulations and deterministic methods. EnergySystems 3(3), 221–258 (2012)
2. Mohagheghi, E., Alramlawi, M., Gabash, A., Li, P.: A Survey of Real-TimeOptimal Power Flow. Energies 11(11), 3142 (2018)
3. Capitanescu, F.: Critical review of recent advances and furtherdevelopments needed in AC optimal power flow. Electric Power SystemsResearch 136, 57–68 (2016)
4. Capitanescu, F., Martinez Ramos, J.L., Panciatici, P., Kirschen, D., MaranoMarcolini, A., Platbrood, L., Wehenkel, L.: State-of-the-art, challenges, andfuture trends in security constrained optimal power flow. Electric PowerSystems Research 81(8), 1731–1741 (2011)
5. Leshno, M., Lin, V.Y., Pinkus, A., Schocken, S.: Multilayer feedforwardnetworks with a nonpolynomial activation function can approximate anyfunction. Neural Networks 6(6), 861–867 (1993)
6. Pan, X., Zhao, T., Chen, M.: DeepOPF: A Deep Neural Network Approachfor Security-Constrained DC Optimal Power Flow. arXiv [Preprint] (2019)
7. Zamzam, A., Baker, K.: Learning Optimal Solutions for Extremely Fast ACOptimal Power Flow. arXiv [Preprint] (2019)
8. Guha, N., Wang, Z., Majumdar, A.: Machine Learning for AC OptimalPower Flow. arXiv [Preprint] (2019)
9. Wolgast, T., Niel3e, A.: Towards modular composition of agent-basedvoltage control concepts. Energy Informatics 2(1), 1–18 (2019)
10. Li, C., Yu, X., Huang, T., Chen, G., He, X.: A generalized hopfield networkfor nonsmooth constrained convex optimization: Lie derivative approach.IEEE Transactions on Neural Networks and Learning Systems 27(2), 308–321 (2016)
11. Meinecke, S., Sarajlic´, D., Drauz, S.R., Klettke, A., Lauven, L.-P., Rehtanz, C.,Moser, A., Braun, M.: SimBench—A Benchmark Dataset of Electric PowerSystems to Compare Innovative Solutions Based on Power Flow Analysis.Energies 13(12), 3290 (2020)
12. Bhattacharya, K., Zhong, J.: Reactive power as an ancillary service. IEEEPower Industry Computer Applications Conference, 294–300 (2001)
13. Sondermeijer, O., Dobbe, R., Arnold, D., Tomlin, C., Keviczky, T.:Regression-based Inverter Control for Decentralized Optimal Power Flowand Voltage Regulation. arXiv [Preprint] (2019)
PW3Data Driven Detection of Malfunctions in Power SystemsDavid Fellner ([email protected])AIT Austrian Institute of Technology, Giefinggasse 2, 1210 Vienna, AustriaEnergy Informatics 2020, 3(Suppl 2):PW3
SummaryThe distribution grid becomes continuously more difficult to operateand monitor leading to voltage band violations in many cases. There-fore, distribution system operators (DSO) need to surveil the correctoperation of grid connected devices, such as power converters onthe low voltage level. The behaviour of these decentralized gener-ation units and their grid support functions such as reactive powerdispatch, used for example for voltage control, is crucial for grid op-eration. The architecture developed is to enable better supervision ofgrid connected devices. This is to be achieved combining machinelearning algorithms for anomaly detection, classification and load dis-aggregation. These mechanisms are then to be applied to the trans-former data as well as to the device data to identify and classifyunwanted behaviour.Keywords: Power Distribution Systems; Malfunction Detection; Oper-ational Data; Machine Learning; MisconfigurationIntroductionNowadays, electricity grid operators face many challenges connectedto the fundamental changes the energy system is undergoing. Espe-cially a high density of photovoltaic (PV) power generation has graveimpact on a grid, as pointed out in [1]. Local violations of the admis-sible voltage magnitude, the so called voltage band, are often theconsequence, whereas the system frequency can be affected glo-bally. To avoid such unfavourable effects, without limiting renewableenergy generation, control strategies are needed. Voltage regulationis regarded as the most important aspect in the integration of dis-tributed generation in distribution networks [2]. This is implemented
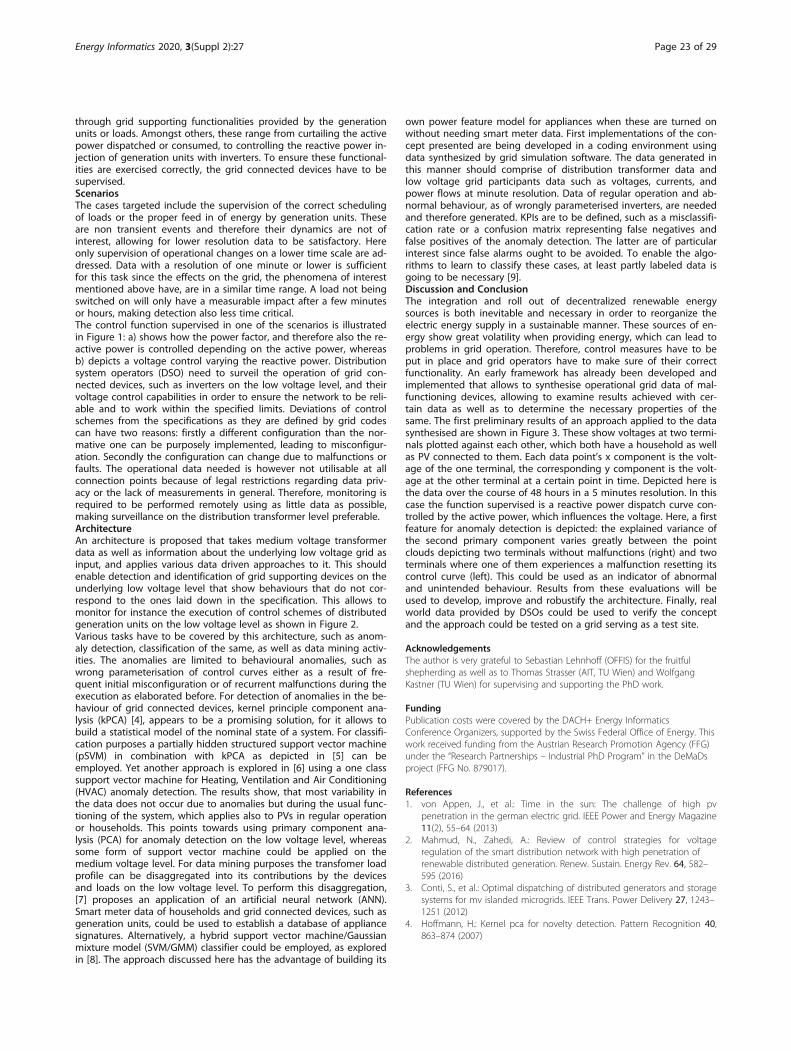
Energy Informatics 2020, 3(Suppl 2):27 Page 23 of 29
through grid supporting functionalities provided by the generationunits or loads. Amongst others, these range from curtailing the activepower dispatched or consumed, to controlling the reactive power in-jection of generation units with inverters. To ensure these functional-ities are exercised correctly, the grid connected devices have to besupervised.ScenariosThe cases targeted include the supervision of the correct schedulingof loads or the proper feed in of energy by generation units. Theseare non transient events and therefore their dynamics are not ofinterest, allowing for lower resolution data to be satisfactory. Hereonly supervision of operational changes on a lower time scale are ad-dressed. Data with a resolution of one minute or lower is sufficientfor this task since the effects on the grid, the phenomena of interestmentioned above have, are in a similar time range. A load not beingswitched on will only have a measurable impact after a few minutesor hours, making detection also less time critical.The control function supervised in one of the scenarios is illustratedin Figure 1: a) shows how the power factor, and therefore also the re-active power is controlled depending on the active power, whereasb) depicts a voltage control varying the reactive power. Distributionsystem operators (DSO) need to surveil the operation of grid con-nected devices, such as inverters on the low voltage level, and theirvoltage control capabilities in order to ensure the network to be reli-able and to work within the specified limits. Deviations of controlschemes from the specifications as they are defined by grid codescan have two reasons: firstly a different configuration than the nor-mative one can be purposely implemented, leading to misconfigur-ation. Secondly the configuration can change due to malfunctions orfaults. The operational data needed is however not utilisable at allconnection points because of legal restrictions regarding data priv-acy or the lack of measurements in general. Therefore, monitoring isrequired to be performed remotely using as little data as possible,making surveillance on the distribution transformer level preferable.ArchitectureAn architecture is proposed that takes medium voltage transformerdata as well as information about the underlying low voltage grid asinput, and applies various data driven approaches to it. This shouldenable detection and identification of grid supporting devices on theunderlying low voltage level that show behaviours that do not cor-respond to the ones laid down in the specification. This allows tomonitor for instance the execution of control schemes of distributedgeneration units on the low voltage level as shown in Figure 2.Various tasks have to be covered by this architecture, such as anom-aly detection, classification of the same, as well as data mining activ-ities. The anomalies are limited to behavioural anomalies, such aswrong parameterisation of control curves either as a result of fre-quent initial misconfiguration or of recurrent malfunctions during theexecution as elaborated before. For detection of anomalies in the be-haviour of grid connected devices, kernel principle component ana-lysis (kPCA) [4], appears to be a promising solution, for it allows tobuild a statistical model of the nominal state of a system. For classifi-cation purposes a partially hidden structured support vector machine(pSVM) in combination with kPCA as depicted in [5] can beemployed. Yet another approach is explored in [6] using a one classsupport vector machine for Heating, Ventilation and Air Conditioning(HVAC) anomaly detection. The results show, that most variability inthe data does not occur due to anomalies but during the usual func-tioning of the system, which applies also to PVs in regular operationor households. This points towards using primary component ana-lysis (PCA) for anomaly detection on the low voltage level, whereassome form of support vector machine could be applied on themedium voltage level. For data mining purposes the transfomer loadprofile can be disaggregated into its contributions by the devicesand loads on the low voltage level. To perform this disaggregation,[7] proposes an application of an artificial neural network (ANN).Smart meter data of households and grid connected devices, such asgeneration units, could be used to establish a database of appliancesignatures. Alternatively, a hybrid support vector machine/Gaussianmixture model (SVM/GMM) classifier could be employed, as exploredin [8]. The approach discussed here has the advantage of building its
own power feature model for appliances when these are turned onwithout needing smart meter data. First implementations of the con-cept presented are being developed in a coding environment usingdata synthesized by grid simulation software. The data generated inthis manner should comprise of distribution transformer data andlow voltage grid participants data such as voltages, currents, andpower flows at minute resolution. Data of regular operation and ab-normal behaviour, as of wrongly parameterised inverters, are neededand therefore generated. KPIs are to be defined, such as a misclassifi-cation rate or a confusion matrix representing false negatives andfalse positives of the anomaly detection. The latter are of particularinterest since false alarms ought to be avoided. To enable the algo-rithms to learn to classify these cases, at least partly labeled data isgoing to be necessary [9].Discussion and ConclusionThe integration and roll out of decentralized renewable energysources is both inevitable and necessary in order to reorganize theelectric energy supply in a sustainable manner. These sources of en-ergy show great volatility when providing energy, which can lead toproblems in grid operation. Therefore, control measures have to beput in place and grid operators have to make sure of their correctfunctionality. An early framework has already been developed andimplemented that allows to synthesise operational grid data of mal-functioning devices, allowing to examine results achieved with cer-tain data as well as to determine the necessary properties of thesame. The first preliminary results of an approach applied to the datasynthesised are shown in Figure 3. These show voltages at two termi-nals plotted against each other, which both have a household as wellas PV connected to them. Each data point’s x component is the volt-age of the one terminal, the corresponding y component is the volt-age at the other terminal at a certain point in time. Depicted here isthe data over the course of 48 hours in a 5 minutes resolution. In thiscase the function supervised is a reactive power dispatch curve con-trolled by the active power, which influences the voltage. Here, a firstfeature for anomaly detection is depicted: the explained variance ofthe second primary component varies greatly between the pointclouds depicting two terminals without malfunctions (right) and twoterminals where one of them experiences a malfunction resetting itscontrol curve (left). This could be used as an indicator of abnormaland unintended behaviour. Results from these evaluations will beused to develop, improve and robustify the architecture. Finally, realworld data provided by DSOs could be used to verify the conceptand the approach could be tested on a grid serving as a test site.
AcknowledgementsThe author is very grateful to Sebastian Lehnhoff (OFFIS) for the fruitfulshepherding as well as to Thomas Strasser (AIT, TU Wien) and WolfgangKastner (TU Wien) for supervising and supporting the PhD work.
FundingPublication costs were covered by the DACH+ Energy InformaticsConference Organizers, supported by the Swiss Federal Office of Energy. Thiswork received funding from the Austrian Research Promotion Agency (FFG)under the “Research Partnerships – Industrial PhD Program” in the DeMaDsproject (FFG No. 879017).
References1. von Appen, J., et al.: Time in the sun: The challenge of high pv
penetration in the german electric grid. IEEE Power and Energy Magazine11(2), 55–64 (2013)
2. Mahmud, N., Zahedi, A.: Review of control strategies for voltageregulation of the smart distribution network with high penetration ofrenewable distributed generation. Renew. Sustain. Energy Rev. 64, 582–595 (2016)
3. Conti, S., et al.: Optimal dispatching of distributed generators and storagesystems for mv islanded microgrids. IEEE Trans. Power Delivery 27, 1243–1251 (2012)
4. Hoffmann, H.: Kernel pca for novelty detection. Pattern Recognition 40,863–874 (2007)

Energy Informatics 2020, 3(Suppl 2):27 Page 24 of 29
5. Zhou, Y., et al.: Abnormal event detection with high resolution micro-pmu data. In: 2016 Power Systems Computation Conference (PSCC), pp.1–7 (2016)
6. Beghi, A., et al.: A one-class svm based tool for machine learning noveltydetection in hvac chiller systems. IFAC Proceedings Volumes (IFAC-Paper-sOnline) 19, 1953–1958 (2014)
7. Ruzzelli, A., et al.: Real-time recognition and profiling of appliancesthrough a single electricity sensor. IEEE SECON, 1–9 (2010)
8. Lai, Y.-H., et al.: Multi-appliance recognition system with hybrid svm/gmm classifier in ubiquitous smart home. Information Sciences 230, 39–55 (2013)
9. Tamilselvan, P., Wang, P.: Failure diagnosis using deep belief learningbased health state classification. Reliability Engineering & System Safety115, 124–135 (2013)
Fig. 1 (abstract PW3). Control schemes: a) Q(P), b) voltagedroop [3]
Fig. 2 (abstract PW3). The concept proposed
Fig. 3 (abstract PW3). Voltages plotted against each other
PW4Impact of ANN Heat Demand Prediction Errors on the FlexibleOperation of CHP SystemsMalte Stienecker ([email protected])Fraunhofer UMSICHT, Fraunhofer Institute for Environmental, Safety, andEnergy Technology, Osterfelder Str. 3, 46047 Oberhausen, GermanyEnergy Informatics 2020, 3(Suppl 2):PW4
SummaryThis project aims to design a prediction model, optimize an oper-ation plan and simulate systems operation. Simulation is necessarydue to mismatches between predicted and actual heat demand. Thegoal is to understand the influence of heat demand prediction errorson a flexible operation of combined heat and power systems (CHPsystems). The simulation additionally reveals what actions could ei-ther be taken to react on prediction errors during operation or toavoid complications beforehand. Based on these results the solutionspace of optimization is going to be limited in order to avoid inter-ventions during operation plan realisation. Thereby the question isaddressed whether prediction errors can be acknowledged duringoperation planning fruitfully for systems operation.Keywords: Prediction Errors; Heat Demand; Time Series Forecasting;Artificial Neural Networks; Operational Optimization; FlexibilityProblem StatementThe growing share of intermittent energy sources increases the likeli-hood of power overproduction at some point in time and power out-ages at others.One idea to deal with these fluctuations is the usage of existingmid-scale CHP devices in decentralized energy systems. With sev-eral hundreds of kilowatts in power generation and usually con-nected to a heat storage system, such CHP devices are able toshift considerable loads and react to market stimuli.Generally speaking, they incorporate the potential to generate powerduring high price hours and avoid generation during low price hoursi.e., the potential to counterbalance power shortage in the market orshut down of renewable power plants respectively.The ability to shift loads to high price hours is limited by device con-straints like storage capacity or feasible power generation. Further-more, since the CHP device generates heat along with power, heatgeneration and therewith power generation is limited to the existingheat demand. Short term imbalances between generation and de-mand can however be compensated by storage systems.In order to generate heat and power when power prices are highand store excess heat for low price hours, system operation needs tobe planned beforehand. Moreover, complying with power deliverycontracts restricts spontaneous changes to plans.A reliable operating plan is crucial to unleash the full potential ofexisting CHP systems for demand side management. An operat-ing plan, however, can only be as reliable as the inputs it isbased upon.These inputs consist of the available energy generation and storagesystem, power price predictions, as well as power and heat demandpredictions. All predictions are subject to uncertainties. If assumedpower prices fail to materialize, the operating plan fails to achievethe promised goals. The impact of deviations between assumed andactual heat demand is different, because it affects system operationdirectly.On the one hand, if heat demand exceeds the expected extent andthus remains unmet, generation needs to be boosted. A compensat-ing heat source, like a district heating grid, is usually not available.On the other hand, if heat demand under-runs the expected extentand generation exceeds the storage capacities, generation needs tobe limited. Overproduction might cause overheating and damages tothe energy system, if excess heat cannot simply be dumped.In such situations, the operating plan needs to be modified accord-ingly, endangering not only promised goals but possibly the con-tracts entered into.

Energy Informatics 2020, 3(Suppl 2):27 Page 25 of 29
Such situations are not unlikely. The operating plan is product of anoptimization algorithm to achieve the greatest possible benefits.Consequently, it tends to push the limits of capacity. Not expectingany deviations, using only 90 % instead of the full storage capacitymakes no sense. Therefore, optimized operating plans are particularlyvulnerable for unexpected heat demand deviations.Heat demand predictions and their errors were studied frequently[1]. Even if predictions based on artificial neural networks (ANN)achieve good performances, a perfect prediction is simplyunachievable.If prediction errors are unavoidable and if such errors affect thepromised goals when operating plans are put into practice, such op-erating plans might perform better if prediction errors are in advanceaccounted for.Stringently, the research hypothesis that needs to be verified is thus:Limiting the solution space in operation planning grants tolerances forheat demand prediction errors and thus avoids interventions duringrealization. In this way, a limited operational optimization does in real-ity tap the flexibility potential of decentralized energy systems to agreater extent than optimizing within the full range of operation.
RQ1:How do prediction errors decrease the real potential of flexibleoperation?
RQ2:How can one limit the solution space of an optimizationalgorithm in a fruitful manner?
RQ3:How do these limitations correlate with the performance ofpredictions?
Related WorkThree different publications dedicated to find the impact of imper-fect energy de-mand forecasts on the flexible operation of CHP sys-tems were found.Bakker et al. [2] predict in the first publication the heat demand offour individual single households. Via Integer Linear Programming anoptimal schedule for the CHP plant is determined. The schedule isoptimal concerning the profit made by the CHP plant on the electri-city market APX. The schedule is then simulated taking real electricityand heat demand as well as the limitations of a local heat buffer intoaccount. As a reference the same procedure is done with a perfectforecast.The achieved average sales price corresponds to 78 % of the theoret-ically achievable price. In other words 22 % of the income is lost dueto forecast errors.Baltputnis et al. [3] investigate in the second publication a CHP plantin Latvia with an electric power of 976 MW. With help of a heat de-mand forecast a heat and power production plan is obtained. Gener-ated power is traded at the Nord Pool Day-ahead Market.Since their prediction is on average underestimating the heat de-mand, also the power production is underestimated, which in turnmeans more power is available than traded on the market the daybefore. Costs of imperfect predictions are therefore estimated as thelost revenue of unexpectedly overproduced power not soldbeforehand.For two different ANN-based forecasts - the prediction qualities ofwhich are measured via the RMSE and given as 8.786 % and 7.819 %respectively, a difference of 11 % - the lost revenue is decreased by26 %. The authors state that ”the consequences of imprecise heatingdemand forecasts cannot be overstated.”.Fang and Lahdelma [4] predict in the third publication the heat de-mand of the city of Espoo in Finland with a yearly heat demand of2.25 TWh.With that prediction they calculate the optimal operation plan forthe existing generation system with regard to the net operatingcosts. The generation system consists of a combined heat and powerplant and a heat storage. The power produced is sold at the Nord-Pool spot market.
In the presented case study 90 % of the theoretically possible sav-ings due to flexible operation are achieved by taking imperfect fore-casts into account.None of the above publications acknowledge prediction errorsbeforehand.MethodologyThe overall methodology can be subdivided into three main tasks.The three tasks are depicted in figure 1.Prediction models are designed to obtain predictions with differentaccuracies. This work focuses on neural network based predictionmodels. As an indication for its ability to learn the underlying pat-terns, its performance is compared with other prediction models. Onthe one hand, a naive prediction model (today is the same as yester-day) will be used. On the other hand, an ARIMA [5] prediction modelwill be used for comparison. The main prediction model is based ona feedforward neural network with historic temperature and heat de-mand data, and a temperature forecast as inputs, a single hiddenlayer and a single output. The target is the measured heat demande.g. 24 hours later.Operational Optimization is realized with help of a given mixed-integer linear programming (MILP) optimization model.The goal is to obtain optimized operation plans either based on his-toric heat demand data as an idealized forecast or based on a imper-fect heat demand predictions. The operation plan obtained with thehistoric heat demand data will not encounter any difficulties whenput into practice. Therefore benefits can directly be determined.The operation plan based on imperfect heat demand prediction,however, is faced with the problem that the assumed heat demandduring optimization does not match the actual heat demand duringrealization. Hence, the latter operation plan has to be simulated tak-ing actual heat demand into account.Simulation of Operation is added to the workflow in order to revealany issues occurring while realizing the operation plan. The mis-match between heat demand prediction and actual heat demand re-sults in some time periods of over- and underproduction.If the connected energy system is not able to cope with the ex-cess heat or the heat deficit the operation plan needs to bemodified. Such modifications might be unexpected shut downsor ramp ups of the CHP plant, which lead to e. g. additional fuelconsumption, higher energy losses, inefficient operation or in-creased wear.
AcknowledgementsThe author would like to thank Prof. Dr.-Ing. Christian Doetsch forsupervision and valuable discussions, and Dr.-Ing. Eric MSP Veith forconstructive criticism and support.
FundingThis work is funded by the German Federal Ministry of Economics andEnergy (BMWi) in scope of the research project EnEff:Wärme – HESKH.Funding reference number: 03ET1591A.
Availability of data and materialsThe data is collected in the research project EnEff:Wärme – HESKH.
Competing interestsThe author declares that he has no competing interests.
References1. Amasyali, K., El-Gohary, N.M.: A review of data-driven building energy
consumption prediction studies. Renewable and Sustainable Energy Re-views 81, 1192–1205 (2018)
2. Bakker, V., Bosman, M.G.C., Molderink, A., Hurink, J.L., Smit, G.J.M.:Improved heat demand prediction of individual households*. IFACProceedings Volumes 43(1), 110–115 (2010)
3. Baltputnis, K., Petrichenko, R., Sauhats, A.: Ann-based city heat demandforecast. In: 2017 IEEE Manchester PowerTech, pp. 1–6. IEEE, ??? (2017)

Energy Informatics 2020, 3(Suppl 2):27 Page 26 of 29
4. Fang, T., Lahdelma, R.: Optimization of combined heat and powerproduction with heat storage based on sliding time window method.Applied Energy 162, 723–732 (2016)
5. Zhang, G.P.: Time series forecasting using a hybrid arima and neuralnetwork model. Neurocomputing 50, 159–175 (2003)
Fig. 1 (abstract PW4). Methodology depicted in comparison withan idealized evaluation of operational optimization. Simulation ofoperation will reveal prediction error induced complicationsindicated with red dots and highlighted by an arrow. Scope of thiswork is to analyse whether reacting on occurrence or avoidingconflicting situations beforehand has a smaller impact on operation
PW5Tracking CO2 emissions from power generation in high spatial andtemporal resolution – Case study for the German electricity systemJan Frederick Unnewehr ([email protected])INATECH - University of Freiburg Emmy-Noether-Str. 2 79110 FreiburgEnergy Informatics 2020, 3(Suppl 2):PW5
SummaryUntil today it is not possible to allocate the CO2 emissions in theGerman electricity system to a specific region and its correspondingelectricity demand that caused them. This paper presents a new en-ergy system model and uses established methods for answering thisquestion. A detailed bottom-up model of the German electricity sys-tem is built to represent a highly spatial and temporal representationof the Germany electricity system in 2019. In combination with a cus-tomized input-output analysis, the individual emissions from the pro-ducer to the caused consumer can be traced. The analysisdemonstrates the importance of considering spatial and temporal ef-fects as well as electricity exchanges between regions in estimatingemissions footprints.Keywords: Electricity System Simulation; Power Flow; Input-OutputModel; Grid Usage; CO2 Emission; CO2 Tracking; Carbon AccountingIntroductionNowadays, tracking of CO2 emissions is of great interest [1]. Thisis not only caused by national regulations [2, 3] but also drivenby public awareness and the interest of industries and individualsto become more environmentally friendly [4, 5]. Tracking of emis-sions refers to the idea to check how much CO2 or other green-house gases are produced by a certain activity at a particularpoint in time. With around 35 %, the energy industry representsthe largest CO2 emitter in Germany [6]. Therefore, the climateimpact (CO2 and other greenhouse gas emissions) associatedwith the production and consumption of electricity should becarefully monitored. It is important to correctly allocate where,when and from what source emissions in the electricity sectorare emitted. In the electricity sector, this is a challenging task, asgeneration and consumption are interconnected via transmissionnetworks. These networks can connect regions located far fromeach other, which results in the fact that production and con-sumption take place in different locations. Therefore, consump-tion based-emissions in a region are not only determined bylocal electricity generation, but also by possible imports fromother regions. This will become even more difficult in the future,since our energy system will become more and more linked todifferent sectors and regions [7, 8]. Due to the spatial and tem-poral distribution of generation and consumption, these importsand the associated electricity flows often represent a critical fac-tor in the emissions associated with local electricity consumption.
Methodologically, these consumption based-emissions can be de-termined using multi-regional input-output models [9]. To obtainuseful results at a local level, load, generation and flow data withhigh spatial and temporal resolution are required. Unfortunately,this data is only available to the public with limited resolution ornot available at all. To compensate this, available data must beextrapolated, and model-based analyses must be used. In thisstudy, a model is developed that allows a highly spatial and tem-poral emission tracking for the German electricity system.Research questionsThe goal of this work is to develop a model that represents the Ger-man electricity sector for the year 2019. The spatial and temporalresolution of power production and consumption is a significant partof this work. In order to track emissions, production and consump-tion data with a high spatial and temporal resolution will be applied.The spatial resolution is determined by the number of networknodes (number of substations). The temporal resolution of the modelis limited by the available load and generation time series data. Asan example, we use power plant generation time series with anhourly resolution published by ENTSO-E [10] where available. Missingpower plant production time series will be modeled using anoptimization approach. The production and consumption data ob-tained will later be used to model the historical load flows in the net-work. Finally, the historical emissions in the system will be tracked byusing a flow based tracing method. Consequently, the following re-search questions shall be the guideline for the model and the ap-proaches presented in this work:· Is it possible to represent the German electricity system in a model,including the high voltage (HV) grid, conventional power plants, re-newable power plants, production and consumption data on sub-station level by using public open data with a sufficient degree ofaccuracy?· Is it possible to backcast power flows for the year 2019, with thepublicly available data?· Based on the built model and the derived power flows, is it possibleto track CO2 emissions and gain reasonable information about theircausation in the German electricity system?MethodologyTo analyse the impact of a specific generator or consumer onto thepower system, Bialek et al. introduced the flow tracing method [11].The method is based on solving linear equations that take the inflowand outflow pattern, as well as the electrical grid topology into ac-count. Tranberg et al. used the flow tracing approach to allocate car-bon emissions in the European electricity trades on the national levelonly. In order to allocate the emissions with higher geographicalresolution, we need flow patterns within a single country.Power flow simulations can be used to calculate the flow patterns ona given network. Combining the economic dispatch with networkconstraints results in optimal power flow (OPF) problem, which isusually done due to missing generation data. Most models rely onthe simplified linear OPF (LOPF) simulations. This means the gener-ation time series is generated by the model (with lowest costs, lineconstraints, and linearization of the full non-linear power flow). Inorder to generate more realistic results, we added the available unit-wise generation data published by the ENTSO-E [10]. The remainingdispatch is then approximated by the model using an LOPF simula-tion. The power flows are modeled in the Python for Power SystemAnalysis (PyPSA) environment [12].The used emission tracing method (real-time carbon accounting)traces flow pattern from generators to consumer and taken into ac-count the underlying network topology [13]. The method followspower flows in electrical networks and draws the path connectingthe location of generation with the location of consumption. It worksin such a way that each technology for each node is assigned a colormathematically. For each hour, nodal production and imported flowsto the node are assumed to mix evenly. The resulting color mix de-termines the mix of the power generation serving the demand ofeach node. The applied carbon emission intensities for each gener-ation technology are derived from the ecoinvent database to providean accurate average intensity per MWh produced during construc-tion and operation [14].

Energy Informatics 2020, 3(Suppl 2):27 Page 27 of 29
Energy system modelThe network model topology is manly based on the online avail-able ENTSO-E Grid Map [15]. The hourly demand time series pub-lished by the ENTSO-E transparency website [16] was processedby using an heuristic allocation method based on gross domesticproduct and population data to assign the national demand datato the respective busses. Power plant data (conventional as wellas renewable) was collected mainly from two sources (1. power-plantmachting [17] 2. Marktstammdatenregister [18]) and added tothe model. The corresponding production time series were ob-tained for some of the conventional power plants from theENTSO-E website [10]. The renewable generation is modeledbased on the re-analysis weather data ERA5 by the EuropeanCentre for Medium-Range Weather Forecasts [19]. The energy sys-tem model is build and simulated by using the PyPSA environ-ment [12].In a first step, the model validation is determined by using the LOPFsimulation of the energy system model for the year 2019. It will bechecked whether the model with all elements (line, busses, gener-ation units as well as the demand) can be solved without overload-ing the lines (line-loading is below 70 % to approximate the N-1criteria). In a second step, the simulation results are compared withreported historical data. For this purpose, the Cross-Border PhysicalFlows [20] and the Actual Generation per Production Type [21] canbe used as reference values.Conclusion and outlookAn approach to create a model that can represent the German elec-tricity system at its current status was presented. The integration ofpublished power plant dispatch data into the model displays aninnovation in the field of energy system modeling. The resultingmodel with 443 lines, 337 buses and a set of generators can be seenas a basis for further investigations by using power flow methods(PF, LPF and LOPF) and allocation methods for emissions tracking. Ina next step, the developed model will be used in combination withthe presented real-time emission allocation method to investigatethe location and pathways of emissions in the German electricitysystem.Currently, the model represents only Germany and the neighboringcountries. As an extension, the geographical coverage of the modelcould be enlarged to the European scale.
AcknowledgementsI would like to thank Mirko Scha¨fer for the constructive and fruitfuldiscussions as well as to the reviewer for their contributions.
FundingPublication costs were covered by the DACH+ Energy InformaticsConference Organizers, supported by the Swiss Federal Office of Energy.
Availability of data and materialsAfter the final publication of the results, the model and the model resultswill be made freely accessible via an online platform.
Competing interestsThe authors declare that they have no competing interests.
References1. Agora Energiewende and Sandbag: The European Power Sector in 2019:
Up-to-Date Analysis on the Electricity Transition. Technical report (2020).https://www.agora-energiewende.de/en/publications/the-european-power-sector-in-2019/
2. Federal Ministry for Economic Affairs and Energy: Sixth ”EnergyTransition” Monitoring Report ”The Energy of the Future”. Technicalreport (2018)
3. Peters, G.P., Andrew, R.M., Canadell, J.G., Fuss, S., Jackson, R.B., Korsbakken,J.I., Le Quéré, C., Nakicenovic, N.: Key indicators to track current progressand future ambition of the Paris Agreement. Nature Climate Change 7(2),118–122 (2017). doi:10.1038/nclimate3202
4. Lin, J., Hu, Y., Cui, S., Kang, J., Ramaswami, A.: Tracking urban carbonfootprints from production and consumption perspectives.
Environmental Research Letters 10(5), 054001 (2015). doi:https://doi.org/10.1088/1748-9326/10/5/054001
5. Lenzen, M., Sun, Y.Y., Faturay, F., Ting, Y.P., Geschke, A., Malik, A.: Thecarbon footprint of global tourism. Nature Climate Change 8(6), 522–528(2018). doi:https://doi.org/10.1038/s41558-018-0141-x
6. Agora Energiewende: Die Energiewende im Stromsektor: Stand derDinge 2019. Rückblick auf die wesentlichen Entwicklungen sowie Aus-blick auf 2020. Technical report (2020)
7. Agora Energiewende: European Energy Transition 2030: The Big Picture.Ten Priorities for the next European Commission to meet the EU’s 2030targets and accelerate towards 2050. Technical report (2019)
8. Brown, T., Schlachtberger, D., Kies, A., Schramm, S., Greiner, M.: Synergiesof sector coupling and transmission reinforcement in a cost-optimised,highly renewable European energy system. Energy 160, 720–739 (2018).doi:https://doi.org/10.1016/j.energy.2018.06.222
9. Wiebe, K.S.: The impact of renewable energy diffusion on Europeanconsumption-based emissions†. Economic Systems Research 28(2), 133–150 (2016). doi:https://doi.org/10.1080/09535314.2015.1113936
10. ENTSO-E Transparency Platform, Actual Generation per Generation Unit(2020). https://transparency.entsoe.eu/generation/r2/actualGenerationPer-GenerationUnit/show
11. Bialek, J.: Tracing the flow of electricity. IEE Proceedings - Generation,Transmission and Distribution 143(4), 313 (1996). doi:https://doi.org/10.1049/ip-gtd:19960461
12. Brown, T., Hörsch, J., Schlachtberger, D.: PyPSA: Python for Power SystemAnalysis. Journal of Open Research Software 6(1) (2017). doi:https://doi.org/10.5334/jors.188
13. Tranberg, B., Corradi, O., Lajoie, B., Gibon, T., Staffell, I., Andresen, G.B.:Real-time carbon accounting method for the European electricity mar-kets. Energy Strategy Reviews 26 (2019). doi:https://doi.org/10.1016/j.esr.2019.100367
14. Wernet, G., Bauer, C., Steubing, B., Reinhard, J., Moreno-Ruiz, E., Weidema,B.: The ecoinvent database version 3 (part I): overview and methodology.The International Journal of Life Cycle Assessment 2016 21:9 21(9), 1218–1230 (2016). doi:https://doi.org/10.1007/S11367-016-1087-8
15. ENTSO-E Transmission System Map (2020). https://www.entsoe.eu/data/map/16. ENTSO-E Transparency Platform, Total Load - Actual (2020). https://trans-
parency.entsoe.eu/load-domain/r2/totalLoadR2/show17. Gotzens, F., Heinrichs, H., Hörsch, J., Hofmann, F.: Performing energy
modelling exercises in a transparent way - The issue of data quality inpower plant databases. Energy Strategy Reviews 23, 1–12 (2019).doi:https://doi.org/10.1016/J.ESR.2018.11.004
18. Marktstammdatenregister - MaStR (2020). https://www.marktstammdatenregister.de/MaStR
19. ECMWF: ERA5 Dataset Copernicus (2019). https://cds.climate.copernicus.eu/20. ENTSO-E Transparency Platform, Cross-Border Physical Flow (2020).
https://transparency.entsoe.eu/transmission-domain/physicalFlow/show21. ENTSO-E Transparency Platform, Actual Generation per Production Type
(2020). https://transparency.entsoe.eu/generation/r2/actualGenerationPer-ProductionType/show
PW6Evaluation of the Impact of Input Data Variations on ElectricalLoad DisaggregationJana Huchtkötter ([email protected])Julius-Albert-Straße 4, 38678 Clausthal-Zellerfeld, GermanyEnergy Informatics 2020, 3(Suppl 2):PW6
SummaryNon-intrusive load monitoring can enable energy savings through theprovision of device consumption information based on whole-buildingdata. However, the highly heterogeneous nature of aggregated consump-tion traces was found to impede the generalisability and comparability ofdisaggregation methods as the input data differences impact disaggrega-tion results. Thus, the presented PhD project proposes a methodology toidentify differing data characteristics, enable adaptation of their values, andevaluate the impact on the disaggregation results. With this methodologythe project not only intends to accumulate so far distributed knowledge,but also provide metrics to measure data characteristic differences and cre-ate generalisable knowledge regarding their impacts.

Energy Informatics 2020, 3(Suppl 2):27 Page 28 of 29
Keywords: NILM; Non-Intrusive Load Monitoring; disaggregation;sampling rate; data characteristics; comparabilityIntroduction / MotivationProviding detailed information on loads in a home can enable en-ergy savings [1]. Load monitoring provides such fine-grained infor-mation. Non-intrusive load monitoring (NILM) methods gain theinformation through the analysis of whole-building consumptiondata and its decomposition into the constituting device consump-tions [2]. With the advancement of digitalisation and rising climateconcerns, the research has seen many advances in recent years.Aggregated consumption traces have been confirmed to be highlyheterogeneous in aspects such as noise, consumption amplitudes,sampling rates, or device classes (compare e.g. [3, 4, 5]). However,knowledge regarding the impact of differences in the input data,which will henceforth be called Data Characteristic Differences (DCDs)is currently shallow and distributed through multiple publications.Nonetheless, DCDs were found impeding to the generalisability andcomparability of current research [3, 4, 6, 7]. A better understandingof DCDs and their impact on disaggregation results could alleviatethe impediments. Therefore, this PhD project is set to answer onecentral question: Which consumption data characteristics can differ be-tween data collections and which impacts to the load disaggregationprocess arise from these differences?After exploring the current knowledge regarding DCDs in the Stateof the Art, this abstract will present the methodological approach asa Proposal to Overcome Current Impediments and conclude with theexpected contributions in Conclusion and Outlook.State of the ArtThe high variety of differences in consumption data has been foundto impede data set interoperability and the comparison of resultsacross data sets in multiple evaluations [3, 4, 6, 7]. The differencescan be categorised into structural differences, concerning file anddata organisation, and specifics of the data characteristics. While anumber of works has considered methods to overcome structural dif-ferences (e.g. [5, 8, 9]), research concerning DCDs and their impacton the disaggregation process is sparse. Surveys have shown a rela-tion between appliance type and disaggregation complexity as earlyas 2012 [2], but many DCDs are identified without further consider-ation during the proposal of NILM algorithms or the evaluation oftheir usage in new environments (compare e.g. [10, 11, 12]).The theoretical evaluation of disaggregation processes has providedbroader sets of DCDs. In [13] the authors consider the impact ofnoise, consumption amplitude and the sampling rate. A complexitymeasure based on device and time sequence characteristics is de-rived in [14]. However, both works consider simplified ideal dis-aggregation processes, making their transfer to real world effectsdifficult.The only data characteristic that has, to the best of our knowledge,been further evaluated is the temporal resolution. While the authorsin [15, 16] evaluated very low sampling frequencies under privacy as-pects, the first work in this project [17] evaluated data collected atfrequencies in the order of kilohertz.Proposal to Overcome Current ImpedimentsTo complement the existing knowledge, this work proposes aprocess akin to a sensitivity analysis: an identification and controlledvariation of input parameters, the DCDs, and evaluation of changesin the output, the disaggregation results. The methodology is out-lined in the following paragraphs, reflecting four main steps:
1. Identification of input data characteristics and their valueranges
2. Determination of adaptation possibilities3. Evaluation of DCD impacts on the disaggregation results4. Verification of the findings
Identification of input data characteristics and their value ranges An ex-tensive literature review will be conducted to compile a comprehen-sive set of DCDs, as even more detailed evaluations include differentcharacteristics (compare [6, 7, 13, 14]). Additionally, the literature re-view should provide a metric to quantify the charac-teristic’s value ina given set of data, and determine a value range for each DCD, both
of which are mandatory for the further process. However, DCDs arenot necessarily methodologically measured in the presenting works.Thus, the compilation of metrics and value ranges will extend be-yond literature review to assess suitable metrics or evaluate valueranges based on data from public data sets when the informationcannot be found in the related work.Determination of adaptation possibilities Based on the created compil-ation of DCDs and their value ranges, a strategy for the value vari-ation of each characteristic can be developed. However, determiningpossibilities to vary DCD values will face the challenge of inter-dependencies. An ideal variation would allow to only influence thecharacteristic under consideration. Interdependencies complicate thevariation and are expected for device-specific characteristics, such asthe consumption amplitude. The development of adaptation strat-egies will identify the interdependencies and acknowledge them inthe developed adaptation processes. Additionally, a sequence ofevaluations will be created in order to evaluate the most independ-ent characteristics first.Evaluation of DCD impacts on the disaggregation results In general,the impact of a DCD’s value will be evaluated based on the incurredchanges on the disaggre-gation results, measured through suitablemetrics. However, the evaluations must enable fair and generalisablecomparisons. While fixing evaluation conditions allows for a fair com-parison, setting or identifying generalisable evaluation conditions isnot trivial. Analysing impacts on highly simplified artificial data allowscomplete control of influences. However, the generalisability of suchan evaluation remains questionable, as complexity and interdepend-encies are reduced or excluded. Additionally, choosing a suitable dis-aggregation method as the model under evaluation is non-trivialbecause so far, no best disaggregation approach is known.To allow the generalisation of the model, the proposed evaluationswill use multiple state-of-the-art disaggregation methods and evalu-ate the results for all of them. To allow for the generalisation to real-istic data, evaluations will be conducted on multiple environments.An environment, in this context, is a set of training and testing data.To enable generalisable findings, each evaluation will include at leasttwo environments, one with either highly simplified or artificially cre-ated data and one including excerpts from multiple publicly availabledata sets, which must previously be analysed regarding the values offurther included DCDs and their possible interdependencies, whichwere noted during the development of adaptation strategies. Incombination, the evaluation will allow to generalise identified trends,specify the impact of the DCD under review, and confirm inter-dependencies between DCDs.Verification of the findings To verify the identified impacts, this workproposes the analysis of unseen data from distinct sources regardingtheir specific data characteristics. Based on this analysis and the col-lected findings, predictions regarding the disaggregation process willbe made and, in the following, compared to the achieved disaggre-gation results. Confirmation of the predictions will serve as verifica-tion for the conclusions drawn during the evaluation and confirmtheir transferability to new consumption traces.Conclusion and OutlookIn conclusion, we intend to extensively evaluate Data CharacteristicDifferences (DCDs) and their impact on the disaggregation processto create generalisable findings. The evaluation will provide threemajor contributions:
� Accumulation of current knowledge regarding DCDs� Provision of metrics and value ranges to characterise each DCD� Empirical evaluation of the DCDs’ impact on disaggregation
results
Additionally, we expect the conducted evaluation and improved un-derstanding of DCDs to improve future research possibilities. Theprovision of a complete set of data characteristics and their impact isexpected to allow for the creation of more meaningful benchmarksand a better model of the disaggregation process, to provide import-ant insights for privacy considerations (e.g. providing informationwhich characteristics are most identifying for devices) and the cre-ation of artificial consumption data, and allow the creation of

Energy Informatics 2020, 3(Suppl 2):27 Page 29 of 29
systems better adapted to their specific environments or require-ments. Furthermore, it will allow a more precise assessment of datasets and current challenges for disaggregation methods.
AcknowledgementsThe author thanks Dr.-Ing. habil. Andreas Reinhardt and Dr. Martin Tröschelfor their valuable inputs as supervisor and shepherd, respectively.
FundingPublication costs were covered by the DACH+ Energy InformaticsConference Organizers, supported by the Swiss Federal Office of Energy. Theresearch is supported by Deutsche Forschungsgemeinschaft (DFG) grant no.RE 3857/2-1 and the Simulationswissenschaftliches Zentrum Clausthal-Göttingen (SWZ).
Availability of data and materialsNo additional data or materials is used for this article.
Competing interestsThe author declares that she has no competing interests.
References1. Carrie Armel, K., Gupta, A., Shrimali, G., Albert, A.: Is Disaggregation the
Holy Grail of Energy Efficiency? the Case of Electricity. Energy Policy 52,213–234 (2013)
2. Zoha, A., Gluhak, A., Imran, M., Rajasegarar, S.: Non-intrusive Load Moni-toring Approaches for Disaggregated Energy Sensing: A Survey. Sensors12(12), 16838–16866 (2012)
3. Pereira, L., Nunes, N.: Performance Evaluation in Non-intrusive Load Moni-toring: Datasets, Metrics, and Tools—a Review. WIREs Data Mining andKnowledge Discovery 8(6), 1265 (2018)
4. Beckel, C., Kleiminger, W., Cicchetti, R., Staake, T., Santini, S.: The ECO DataSet and the Performance of Non-Intrusive Load Monitoring Algorithms.In: BuildSys ’14: Proceedings of the 1st ACM Conference on EmbeddedSystems for Energy-Efficient Buildings, pp. 80–89 (2014)
5. Klemenjak, C., Reinhardt, A., Pereira, L., Makonin, S., Bergés, M.,Elmenreich, W.: Electricity consumption data sets: Pitfalls andopportunities. In: BuildSys ’19: Proceedings of the 6th ACM InternationalConference on Systems for Energy-Efficient Buildings, Cities, and Trans-portation, pp. 159–162 (2019)
6. Reinhardt, A., Klemenjak, C.: How does Load Disaggregation PerformanceDepend on Data Characteristics? Insights from a Benchmarking Study. In:
Proceedings of the 11th ACM International Conference on Future EnergySystems (e-Energy), pp. 167–177 (2020)
7. Nalmpantis, C., Vrakas, D.: Machine Learning Approaches for Non-intrusive Load Monitoring: From Qualitative to Quantitative Comparation.Artificial Intelligence Review 52(1), 217–243 (2019)
8. Kelly, J., Knottenbelt, W.: Metadata for Energy Disaggregation. In: IEEE38th International Computer Software and Applications ConferenceWorkshops, pp. 578–583 (2014)
9. Batra, N., Kukunuri, R., Pandey, A., Malakar, R., Kumar, R., Krystalakos, O.,Zhong, M., Meira, P., Parson, O.: Towards Reproducible State-of-the-art En-ergy Disaggregation. In: BuildSys ’19: Proceedings of the 6th ACM Inter-national Conference on Systems for Energy-Efficient Buildings, Cities, andTransportation. BuildSys ’19, pp. 193–202 (2019)
10. Kelly, J., Knottenbelt, W.: Neural NILM: Deep Neural Networks Applied toEnergy Disaggregation. BuildSys ’15: Proceedings of the 2nd ACMInternational Conference on Embedded Systems for Energy-Efficient BuiltEnvironments, 55–64 (2015)
11. Zhang, C., Zhong, M., Wang, Z., Goddard, N., Sutton, C.: Sequence-to-Point Learning with Neural Networks for Nonintrusive Load Monitoring.In: The Thirty-Second AAAI Conference on Artificial Intelligence (2016)
12. Batra, N., Parson, O., Berges, M., Singh, A., Rogers, A.: A Comparison ofNon-intrusive Load Monitoring Methods for Commercial and ResidentialBuildings. ArXiv (2014). arXiv:1408.6595
13. Dong, R., Ratliff, L., Ohlsson, H., Sastry, S.S.: Fundamental Limits ofNonintrusive Load Monitoring. In: HiCoNS ’14: Proceedings of the 3rdInternational Conference on High Confidence Networked Systems, pp.11–18 (2014)
14. Egarter, D., Pöchacker, M., Elmenreich, W.: Complexity of Power Draws forLoad Disaggregation. ArXiv (2015). arXiv:1501.02954
15. Eibl, G., Engel, D.: Influence of Data Granularity on Smart Meter Privacy.IEEE Transactions on Smart Grid 6(2), 930–939 (2015)
16. Eibl, G., Engel, D.: Influence of Data Granularity on Nonintrusive ApplianceLoad Monitoring. In: Proceedings of the 2nd ACM Workshop onInformation Hiding and Multimedia Security, pp. 147–151 (2014)
17. Huchtkoetter, J., Reinhardt, A.: A Study on the Impact of Data SamplingRates on Load Signature Event Detection. Energy Informatics 2(24) (2019)
Publisher’s NoteSpringer Nature remains neutral with regard to jurisdictional claimsin published maps and institutional affiliations.