abstracts of 5th grene-ei workshop.pdf
TRANSCRIPT

The Fifth International Workshop on Climatic Changes and Evaluation of Their Effects
on Agriculture in Asian Monsoon Region
6-8 March 2016 Fukushima Agricultural Technology Center
Koriyama, Fukushima, JAPAN
PROGRAM AND ABSTRACTS
Supported by


The Fifth International Workshop on
Climatic Changes and Evaluation of Their Effects on
Agriculture in Asian Monsoon Region
PROGRAM AND ABSTRACTS
6-8 March 2016 Fukushima Agricultural Technology Center
Koriyama, Fukushima, JAPAN
Cover picture: Mt. Adatara over Hanamiyama park, Fukushima taken by umetarou
Welcome message by Dr. Mizoguchi
It is my great pleasure to welcome you to the fifth international workshop of “Climatic changes
and their effects on Agriculture in Asia Monsoon region” held from March 6-8, 2016 in Koriyama,
Fukushima, Japan.
Five years have passed since the big earthquake and the nuclear power plant disaster in Japan.
Fukushima is now well-known district that has been suffered from radioactive contamination. Many
people in the world, even in Japan, are still suspicious to Fukushima which is recovering day by day. In
order to let you know the real Fukushima, I am eager to have the workshop here in Fukushima.
As symbolized by this warm winter, climatic change is one of biggest issues in global scale.
On the other hand, a lot of people are living in our Asia monsoon area. It is the important issue for us to
keep food and environment against climatic change. In this background, we have started this project,
“Climatic changes and their effects on Agriculture in Asia Monsoon region (CAAM)” under the research
framework of the Green Network of Excellence (GRENE) for these five years, the Japanese fiscal years
from 2011 to 2015 supported by the Japanese Ministry of Education. This project aimed to improve the
reliability of future climate prediction and to develop the information platform which will be useful to
design adaptation and mitigation strategies in agriculture against the predicted climatic changes in Asian
monsoon region.
We had the workshops in Bangkok, Baguio, Bali and Hanoi for these four years, and finally we
have the final workshop in Japan this year. As I emphasize in every workshops, the major objective of the
workshop is to discuss our research progress and promote our collaboration. I believe this workshop is an
excellent opportunity for all of us to exchange our ideas and professional experiences and will inspire the
sense of solidarity among participants. I would like to express my sincere thanks to Fukushima
Agricultural Technology Center supporting this workshop in Japan.
Welcome all GRENE-CAAM attendants. Let’s enjoy the meeting in Fukushima, Japan.
Masaru Mizoguchi Project Leader of GRENE-CAAM
Professor at University of Tokyo

UT University of Tokyo, JapanJAMSTEC Japan Agency for Marine-Earth Science and Technology
TMU Tokyo Metropolitan University, JapanNARO National Agriculture and Food Research Organization, JapanNIAES National Institute for Agro-Environmenral Sciences, Japan
IPB Bogor Agricultural University, IndonesiaJGSEEKUMTT
Joint Graduate School of Energy and EnvironmentKing Mongkut's University of Technology Thonburi, Thailand
TMD Thai Meteorological DepartmentAMU Ateneo de Manila University, Philippines
MMSU Mariano Marcos State University, PhilippinesNVSU Nueva Vizcaya State University, Philippines
VNU-HUS Vietnam National Universirty-Hanoi University of ScienceBPPT Agency for the Assessment and Application of Technology, Indonesia
Abbreviations for the participating organizations
PROGRAM
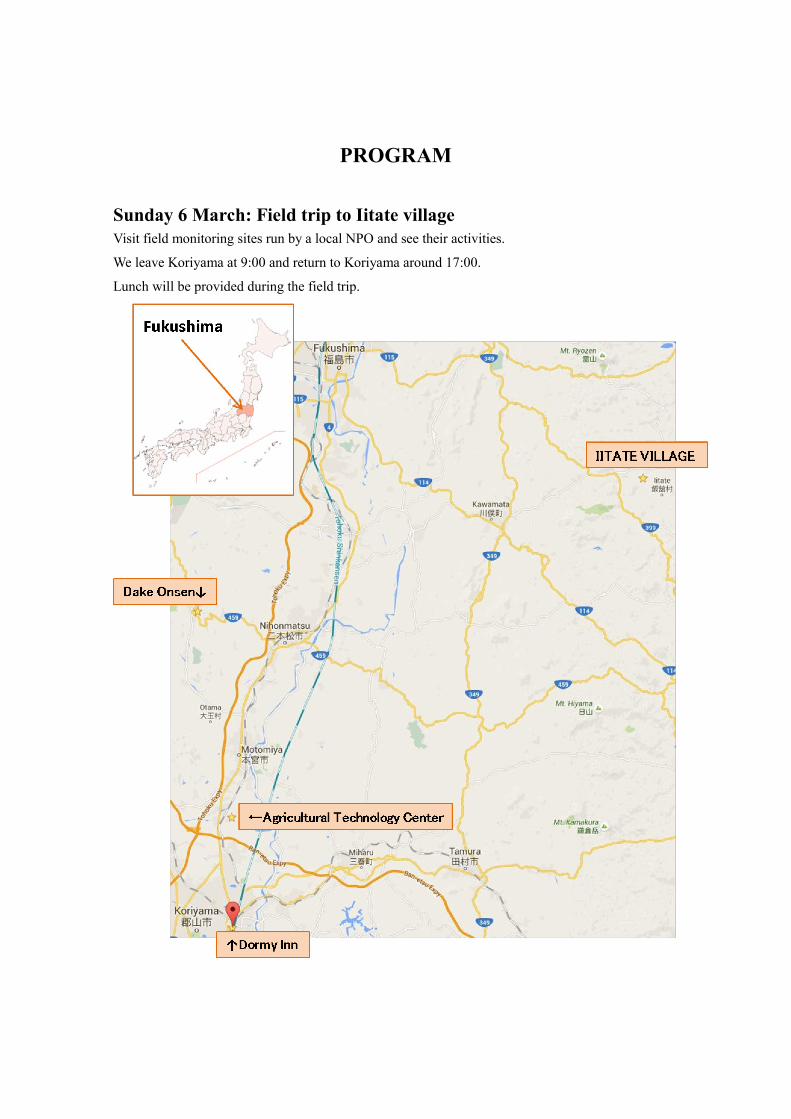
Sunday 6 March: Field trip to Iitate village Visit field monitoring sites run by a local NPO and see their activities.
We leave Koriyama at 9:00 and return to Koriyama around 17:00.
Lunch will be provided during the field trip.

Monday 7 March: Workshop Day 1 At Conference room of Fukushima Agricultural Technology Center
A pickup bus will leave Koriyama at 8:00. Please finish breakfast and packing your luggage by
7:50 for check-out.
Note; the abstract of Mr. Archevarahuprok is placed in the last page.
Page
8:50
9:10
9:50 Jun MatsumotoSeasonal changes over the eastern part of the Indochina Peninsular
1
10:10 Nobuhiko EndoInterannual variation of precipitation characteristics in Vietnam during the 20th century
3
10:30
Session I: Climatic Changes in Asian Monsoon Region (1)
10:50 Thanh Ngo DucA new gridded rainfall dataset for Vietnam: construction and validation
6
11:10Tomoshige InoueCharacteristics of summer monsoon rainfall associated with the 2011 Chao Phraya Riverflood in Thailand
8
11:30 Archevarahuprok BoonlertTBD
na
11:50 Virgilio Julius Manzano Jr.Downscaling Seasonal Climate Forecasts for Risk Management in the Philippines
10
12:10
Coffee break
Taking a group photo and Lunch
Opening SessionChair: Dr. Jun Matsumoto
Chair: Dr. Hiroshi Takahashi
Opening RemarksDr. Masaru Mizoguchi, University of TokyoRepresentative of Fukushima Agricultural Technology Center
Key note speech: Dr. Seishi NinomiyaHigh-throughput phenomics; tools to understand the current status of crop fields efficiently

13:30 Shinya OginoHow much is the precipitation amount over the tropical coastal region?
13
13:50 Junichi HamadaClimatology of rainfall extremes over the Eastern Indonesian Maritime Continent
15
14:10Fadli SyamsudinClimatic Changes Related to Extreme Rainfall and Other Environmental Factors in Jakartaand Surrounding Areas
16
14:30 Budi I SetiawanAnalysis of Water Availability in the Context of Local Climatic and Seasonal Changes
18
14:50Hisayuki KubotaInterdecadal variability of western north Pacific summer monsoon and its correlation to Japanrice yield
20
15:10
15:30Tsuneo KuwagataInfluence of local land cover to the agro-meteorological conditions in farmland- importance of monitoring weather in farmland -
22
15:50 Jianqing XuComparison of the surface downward longwave radiation at the different regions
24
16:10Hiroshi TakahashiA summary of the impact of land-surface conditions on regional climate over the wet tropicsunder GRENE-CAAM
25
16:40
18:30
Chair: Dr. Budi Setiawan
Reception at Hekizantei
Moving to Nihonmatsu city
Session III: Climatic Changes in Asian Monsoon Region (3)
Session II: Climatic Changes in Asian Monsoon Region (2)
Coffee Break
Chair: Dr. Ngo Duc Thanh

Tuesday 8 March: Workshop Day2 A pick up bus leave Hekizantei at 8:20. Please prepare for check out by 8am.
9:00Kei TanakaCollection of Data and Parameters for Major Crop Variety in Thailand to Execute and toValidate DSSAT
26
9:20Mallika SrisuthamCoping with Climate change in Northeast Thailand: Cassava 28
9:40Uday PimpleMapping rice paddy intensities using MODIS, Landsat 8OLI and Field IP camera 29
10:00Kazunori MinamikawaFuture projection of methane emission from irrigated rice paddies in central Thailand underdiff t t t ti
30
10:20Sirintornthep TowprayoonContinuous measurement of GHG emissions and soil organic carbon stocks from managedrice cultivation in Thailand
32
10:40
10:50Shigeto SudoImplication of integrated GHG mitigation in fain-fed paddy field in Thailand 34
11:10Chusnul ArifDetermining Optimal Planting Calendar Based on Field Monitored Data in Saba Watershed,B li I d i
35
11:30Tien Cao HoangLow-Cost Water Level Monitoring System for Paddy Field 37
11:50Wilfredo A. Dumale Jr.FMS-based weather monitoring for local climate change adaptation for agriculture in the 39
12:10Jayson CaranzaSpatial Information Technology-Aided Inspection Chart Mapping and Its Potential asManagement Tool to Climate Change Effects and Evaluation: The Case of NPC Major
41
12:30
13:40
14:10
14:30
15:45
16:30
Coffee Break
Coffee break
Guide tour of Fukushima Agricultural Tehcnology Center
General DiscussionDr. Masaru MizoguchiClosing RemarksDr. Jun Matsumoto, JAMSTECDr. Budi Setiawan, IPB
Moving to Koriyama station and dismiss
Session VI: General Discussion
Chair: Dr. Tsuneo Kuwagata
Chair: Dr. Kei Tanaka
Lunch
Session IV: Climatic Change Effects on Agriculture in Asian Monsoon Region (1)
Session V: Climatic Change Effects on Agriculture in Asian Monsoon Region (2)

ABSTRACTS
1
Seasonal changes over the eastern part of the Indochina Peninsular
Jun Matsumoto1, 2 and Dzung Nguyen–Le1
1Department of Geography, Tokyo Metropolitan University, Hachioji, Tokyo, Japan 2Department of Coupled Ocean-Land-Atmosphere Processes Research, JAMSTEC, Yokosuka, Kanagawa, Japan
Keywords: seasonal changes; rainy season; southwest monsoon; northeast monsoon; ITCZ; ENSO 1. Introduction
Although located in tropical Asian monsoon region, the seasonal changes over the eastern part of the Indochina Peninsular (ICP) are unique with a maximum rainy season in autumn [1]. These characteristics have been neglected by previous studies on Asian monsoon seasonal transitions [2, 3]. The averaged onset of southwest monsoon season in Central Vietnam was examined in [4]. The long-term and interannual variability of the Asian rainy season under global warming has been a critical issue in recent decades because of the region’s high population and rapid economic development. Therefore, this study aims to reveal the onset of both the summer rainy season (SRS) and autumn rainy season (ARS) over the eastern ICP on annual and interannual time scales. The onset dates in individual years during 1958–2007 are objectively determined. Reanalysis and satellite data are utilized to compose the temporal and spatial structures of atmospheric circulation and convection during the onsets. Then, composite analyses are conducted between the early/late SRS or ARS onset categories to investigate the precursory signals in the preceding seasons. 2. Data
The rainfall data used in this study were daily-mean precipitation from the Asian Precipitation–Highly-Resolved Observational Data Integration Towards Evaluation of Water Resources (APHRODITE) dataset for the period 1958-2007 [5]. The National Centers for Environmental Prediction–National Center for Atmospheric Research (NCEP–NCAR) reanalysis data [6] from the same period on 2.5-deg grids were used to analyze atmospheric circulation. Additionally, daily-mean outgoing longwave radiation (OLR) from 1979 to 2007 on 1.0-deg grids were obtained from the National Oceanic and Atmospheric Administration (NOAA) outgoing longwave radiation–daily climate data record [7]. Finally, monthly mean SST and mean sea level pressure (SLP) on 1.08-deg and 5.08-deg grids for the period 1958–2007 were obtained from the Met Office Hadley Centre’s HadISST1 and HadSLP2 datasets, respectively [8, 9] 3. Determination of the rainy season onset date
To objectively determine the onset of the rainy season in the eastern ICP, we proposed a method based on principal components of the first two leading empirical orthogonal functions (EOF1, EOF2) of standardized rainfall data. Prior to standardization, actual daily rainfall is first normalized by cubic-root transformation, making its frequency distribution closer to the normal distribution than that of the original data.
The eigenvector pattern of EOF1, accounting for 48.9% of total variance, is definitely positive over the entire studied region with only low loadings along the ECI. Its principal component (PC1) is observed to generally switch signs from negative (positive) to positive (negative) around April (October), illustrating that EOF1 is associated with wetter conditions during summer–autumn and drier conditions during winter–spring. Meanwhile, EOF2 contributes 10.8% of the total variance, and it has the strongest signal in the ECI, showing that rainfall in the area experiences a maximum in autumn, corresponding to the annual distribution of PC2. Results from EOF analysis capture most of the spatial and temporal characteristics of rainfall in the eastern ICP reasonably well, with EOF1 (EOF2) representing the SRS (ARS) over most locations (along the ECI). The changes in sign from negative to positive of PC1 and PC2 correspond closely to the advent of these rainy seasons. Therefore, we defined the onset for each individual year during 1958–2007 by analyzing the PC using a modification of the definition given by [10]. Specifically, the onset timing of the SRS (ARS) is defined as the day on which PC1 (PC2) satisfies the following conditions: the PC begins to be positive and persists continuously for 7 days; within 20 consecutive days, the number of days with positive PC exceeds 14 days. These thresholds are determined after conducting many sensitivity tests to reflect the apparent seasonal changes in rainfall from dry to wet conditions. As a result, the mean onset of the SRS was determined to occur around 6 May with a standard deviation of 13 days. While, ARS mean onset and standard deviation are 16 September and 12 days, respectively.

2
4. Climatological features of the rainy season onset over the eastern ICP To show the atmospheric circulation and convection related to the SRS and ARS onsets, evolution of composite
OLR, streamlines at 850hPa, and the western Pacific subtropical high (WPSH), denoted by the 500-hPa geopotential high exceeding 5860gpm around the onset, are composed. The relationship with the timing of 10–20 day variation (10–20DV) and 30–60 day variation (30–60DV) is also investigated.
It is generally indicated that the beginning time of the SRS in the eastern ICP is regulated by both remarkable changes in large-scale circulation and ISO. The establishment of the summer monsoon provides fundamental backgrounds. The arrival of strong 10–20DV from the WNP and low latitudes, and a northeastward progression of 30–60DV monsoon trough into the region also trigger an onset of summer rainfall. As for the ARS onset, the southwestward withdrawal of the summer monsoon and westward expansion of the WPSH, which cause the low-level prevailing wind reversal from primarily westerlies to easterlies in the northeastern ICP, play the most vital role in activating the orographic rainfall process in the ECI. Additionally, the associated ISO activities emphasize this seasonal transition, and the ARS onset is in phase with a significant negative zonally extended 10–20DV from the WNP to the eastern ICP. 5. Signals associated with interannual variability of rainy season onset over the eastern ICP
Composite analyses of SST, low-level wind, convection, and ISO activities from the preceding seasons are conducted for early-/late-onset years. An early (late) SRS/ARS onset is defined as one that is more than one week early (late) compared to the mean onset date.
A typical ENSO pattern in the tropical Pacific from the preceding winter, in which early onsets are related to cold phases (La Niña). Meanwhile, although cold SST biases are observed in the IO, particularly in AM during the onset, significant signals are not coherently detected. An early ARS onset is closely associated with El Niño, particularly with its developing phases. In addition, the year-to-year variations of the ARS onset are not only regulated by the SST anomalies in the Pacific but also by those in the IO. 6. Conclusions The climatological summer rainfall outbreak is characterized by an abrupt northward extension of intense tropical convection and the arrival of the westerly monsoon from the equatorial IO. Simultaneously, the WPSH retreats eastward and the midlatitude westerly flow weakens. The timing of the SRS onset is also closely associated with rapidly westward- and northward-propagating 10–20DV from the SCS and low latitudes, particularly Sumatra, respectively, and a northeastward progression of 30–60DV from the equatorial IO. Meanwhile, the southwestward withdrawal of the summer monsoon and the westward expansion of the WPSH in early autumn, which cause a shift in the prevailing winds from westerlies to easterlies and dry conditions over the northeastern ICP and northern SCS, play prime roles in triggering the autumn orographic rainfall along the windward coastal plain of the ECI. More minute descriptions are available in Nguyen-Le et al. (2015). Acknowledgement
This research was conducted as part of the Monsoon Asian Hydro–Atmosphere Scientific Research and Prediction Initiative (MAHASRI), and is supported by the ‘Asian Human Resources Fund’ from the Tokyo Metropolitan Government; the Green Network of Excellence (GRENE) from MEXT and KAKENHI No. 26220202 from JSPS. References [1] Chen T.C., et al., 2012. Interannual variation of the late fall rainfall in Central Vietnam. J. Climate, 25: 392–413. [2] Matsumoto, J. 1997. Seasonal transition of summer rainy season over Indochina and adjacent monsoon region. Adv.
Atmos. Sci., 14: 231–245. [3] Wang, B. and LinHo, 2002. Rainy seasons of the Asian–Pacific monsoon. J. Climate, 15, 386–398. [4] Nguyen-Le D. et al., 2014a. Climatological onset date of summer monsoon in Vietnam. Int. J. Climatol., 34: 3237–3250. [5] Yatagai, A. et al., 2012: APHRODITE: Constructing a long-term daily gridded precipitation dataset for Asia based on a
dense network of rain gauges. Bull. Amer. Meteor. Soc., 93: 1401–1415. [6] Kalnay, E. et al., 1996. The NCEP/NCAR 40-Year Reanalysis Project. Bull. Amer. Meteor. Soc., 77: 437–471. [7] NOAA, 2014. Outgoing longwave radiation–daily climate data record. [Available online at
http://www.ncdc.noaa.gov/news/ new-outgoing-longwave-radiation-climate-data-record.] [8] Rayner, N.A. et al., 2003. Global analyses of sea surface temperature, sea ice, and night marine air temperature since the
late nineteenth century. J. Geophys. Res., 108: 4407. [9] Allan, R. and T. Ansell, 2006. A new globally complete monthly historical gridded mean sea level pressure dataset
(HadSLP2): 1850–2004. J. Climate, 19: 5816–5842. [10] Zhang, Y. et al., 2002. Onset of the summer monsoon over the Indochina Peninsula: Climatology and interannual variations.
J. Climate, 15: 3206–3221. [11] Nguyen-Le D. et al., 2015. Interannual variability of rainy season onset over the eastern Indochina Peninsula. J. Climate,
28: 5645-5666.

3
Interannual Variation of Precipitation Characteristics in Vietnam during the 20th Century
Nobuhiko Endo
Japan Agency for Marine-Earth Science and Technology 2-15 Natsushima-cho, Yokosuka, Japan
Jun Matsumoto Tokyo Metropolitan University
Minami Ohsawa, Hatchioji, Japan and
Japan Agency for Marine-Earth Science and Technology
Keywords: Climate Changes, precipitation, heavy rainfall, data rescue, Vietnam 1. Introduction
Changes in frequency, amount, and intensity of precipitation have been projected for the 21st century in the Coupled Model Inter-comparison Project Phase 5. However, their simulated results for the 20th century have not well validated because there have been enough long-term in-situ observed precipitation data over the world. In the GRENE-ei CAAM workshop at Bali and that at Ha Noi, we stressed importance of data rescue of historical meteorological data which were archived in Southeast Asian countries. We started cooperated digitization work of precipitation data with the Data Center of National Hydro-Meteorological Service of Vietnam (VNHMS). In this paper, we will present some preliminary results of the digitization work. 2. Digitization of Historical Precipitation Data
First meteorological observation results in French Indochina was published in “Annales du Bureau central météorologique de France” in 1894. The first observation was made by a resident in Nam Dinh, Tonkin. In 1897, meteorological observation started in Ha Noi, Nha Trang, Saigon, and Phu Lang Thuong. Observation network expanded year by year. Original observation logbooks before 1910 were archived in the Data Center of VNHMS.
“Service Météorologique” in French Indochina was established in 1907, and rainfall observation was made at 48 stations in Vietnam. “Bulletin Pluviometrique” was published from 1909 to 1930, and daily rainfall data were available from 1910 to 1930. “Bulletin Mensuel des Observations” was published from 1925 to 1941, and from 1949 to 1954. “Annales du Service Météotologique de l’Indochine” was also published from 1928 to 1937. After 1955, annual and monthly reports were published by Direction de la Météorologie of République du Vietnam.
Digital images of logbooks and meteorological data reports mentioned above were prepared at the Japan Meteorological Agency, Meteo-France, and VNHMS.
We selected 15 stations where long-term historical precipitation data were available. Digitization of daily precipitation data and/or monthly precipitation statistics were carried out. Figure 1 shows spatial distribution of the meteorological stations.
Quality control procedures applied to the digitized data. Monthly total precipitation was calculated from the daily precipitation, and compared with monthly total precipitation which was digitized from monthly and/or annual reports. In this step, we found many miss keyed values in the daily precipitation data. Miss keyed daily precipitation were reentered.
Fig. 1. Spatial distribution of digitized meteorological stations.

4
Pentad rainfall and contribution of heavy rainfall to pentad rainfall (R50Contrib) were prepared for the period 1901 to 1930, and 1981 to 2010. It is noted that we define the heavy rainfall event as daily rainfall above 50 mm per day. 30-year climatology of pentad rainfall and R50Contrib were calculated. Five pentad running mean applied three times for preparing 30-year climatology.
3. Difference in Climatological Seasonal Cycle
Figure 2 show climatological pentad rainfall seasonal cycle at
Ha Noi, the capital city of Vietnam, for the first 30 years in the 20th century and for the period 1981 – 2010. The seasonal cycle were almost same until end of June (Pentad 37) in the both periods. However, negative difference observed from July to middle of September. This means that precipitation amount decreased in the period 1981 – 2010 compared to the early 20th century. On the contrary, increase of precipitation was observed after middle of September.
Contribution of heavy rainfall to pentad rainfall (R50Contrib) were shown in Fig. 3. In the first 30 years of the 20th century, R50Contrib shows double peaks. One peak observed in the middle of April, and another peak observed in the middle of July. On the other hand, seasonal cycle of R50Contrib became almost single broad plateau in the recent 30 years. Decrease of R50Contrib were observed in late summer and early fall, while R50Contrib increased in spring and late fall. According to notes in the logbooks and the data reports, thunderstorm tends to reported when the heavy rainfall observed. Therefore, seasonal appearance of local severe storm and tropical disturbance also changed between two 30 years periods.
At Vung Tau (Cap Saint-Jacques), Baria - Vung Tau Province, the southern Vietnam, seasonal cycle of pentad rainfall shows broad plateau with two small peaks in May and September (Figure not shown). Increase of pentad rainfall was evident through the entire rainy season between two 30 years period, and difference of pentad precipitation is about 10 mm per pentad during the rainy season. Figure 4 shows the seasonal cycle of R50Contrib at Vung Tau. R50Contrib increased about 5 % during the rainy season. These results suggest that total amount of heavy precipitation increased equally during the rainy season. Increase of R50Contrib between the two 30 years period was also observed at Soc Trang, located near the mouth of the Mekong River, but the change was small (Figure not shown). 4. Trend in Annual Precipitation
Trends in annual precipitation and that in heavy rainfall indices in Southeast Asian countries during the last half of the 20th century were investigated [1]. The heavy rainfall indices tend to increase in central Vietnam, while decreasing trend in the heavy rainfall indices were observed in northern Vietnam.
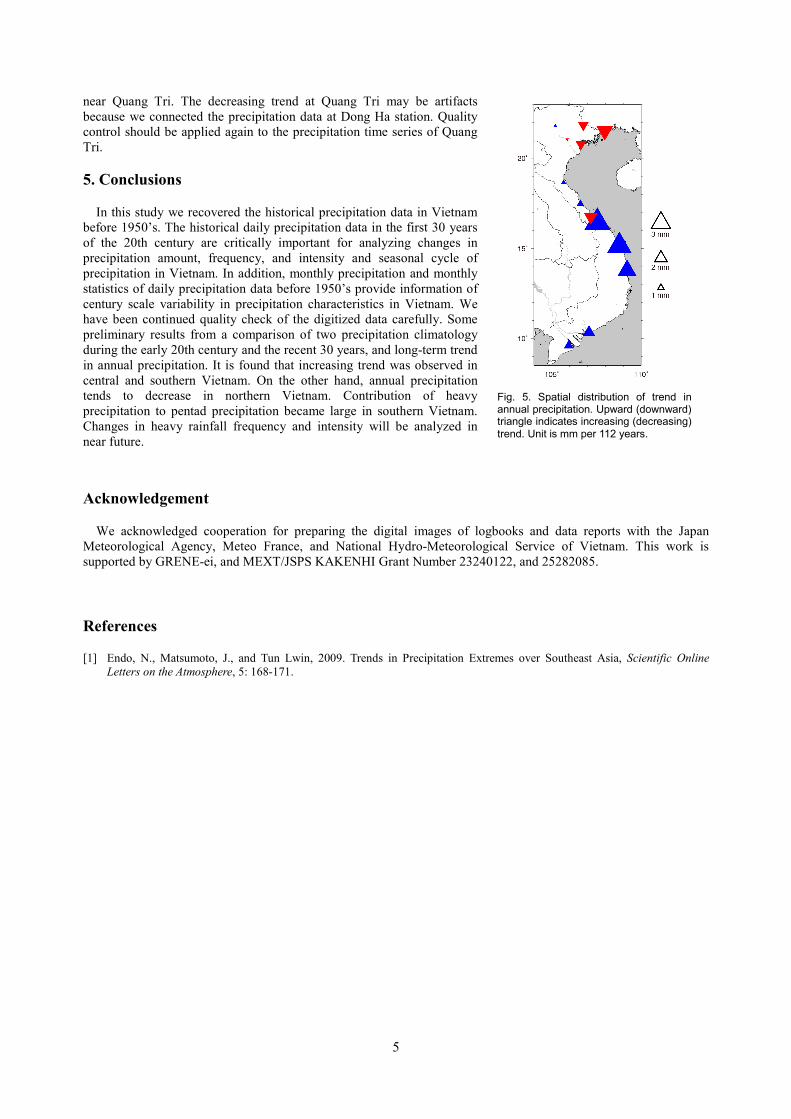
Figure 5 shows spatial distribution of trend in annual precipitation over Vietnam. Annual precipitation tends to largely increase in three stations in middle- and southern- central Vietnam with statistical significance at 10 %. Two stations in southern Vietnam and two stations in northern central Vietnam also indicate slight increase of annual precipitation. In northeastern Vietnam, decreasing trend was observed at three stations. Decreasing trend at Quang Tri is different from stations
Fig. 2. a) Climatological seasonal cycle of pentad rainfall at Ha Noi. Shaded (open) bar indicates climatology in the first 30 years of the 20th century (recent 30 years: 1981-2010). b) Difference between two climatology.
Fig. 3. Same as Fig. 2, but for a) Climatological seasonal cycle of contribution of heavy rainfall to pentad rainfall at Ha Noi. b) Difference between two climatology.
Fig. 4. Same as Fig. 3, but for Vung Tau.
5
near Quang Tri. The decreasing trend at Quang Tri may be artifacts because we connected the precipitation data at Dong Ha station. Quality control should be applied again to the precipitation time series of Quang Tri. 5. Conclusions
In this study we recovered the historical precipitation data in Vietnam before 1950’s. The historical daily precipitation data in the first 30 years of the 20th century are critically important for analyzing changes in precipitation amount, frequency, and intensity and seasonal cycle of precipitation in Vietnam. In addition, monthly precipitation and monthly statistics of daily precipitation data before 1950’s provide information of century scale variability in precipitation characteristics in Vietnam. We have been continued quality check of the digitized data carefully. Some preliminary results from a comparison of two precipitation climatology during the early 20th century and the recent 30 years, and long-term trend in annual precipitation. It is found that increasing trend was observed in central and southern Vietnam. On the other hand, annual precipitation tends to decrease in northern Vietnam. Contribution of heavy precipitation to pentad precipitation became large in southern Vietnam. Changes in heavy rainfall frequency and intensity will be analyzed in near future. Acknowledgement
We acknowledged cooperation for preparing the digital images of logbooks and data reports with the Japan Meteorological Agency, Meteo France, and National Hydro-Meteorological Service of Vietnam. This work is supported by GRENE-ei, and MEXT/JSPS KAKENHI Grant Number 23240122, and 25282085. References [1] Endo, N., Matsumoto, J., and Tun Lwin, 2009. Trends in Precipitation Extremes over Southeast Asia, Scientific Online
Letters on the Atmosphere, 5: 168-171.
Fig. 5. Spatial distribution of trend in annual precipitation. Upward (downward) triangle indicates increasing (decreasing) trend. Unit is mm per 112 years.
6
A new gridded rainfall dataset for Vietnam: construction and validation
1Thanh Nguyen-Xuan, 1*Thanh Ngo-Duc, 1Tan Phan-Van, 2Hideyuki Kamimera
1VNU Hanoi University of Science, Vietnam 2Foundation of River and Basin Integrated Communications, Japan
*Corresponding author’s e-mail address: [email protected]
Keywords: VnGP, gridded rainfall, Vietnam, Spheremap interpolation method 1. Introduction
Understanding rainfall characteristics is very important for monitoring and mitigating water-related disasters around the world. Many countries have so far established a dense rainfall network with the capability of collecting data continuously and automatically. However, several countries, including Vietnam, still have a relatively sparse network with manual collecting procedures.
Besides rainfall data sources at stations, some combined gridded rainfall datasets have also been used, such as Climate Research Unit (CRU) [1], Global Precipitation Climatology Project (GPCP) [2], Asian Precipitation - Highly-Resolved Observational Data Integration Towards Evaluation (APHRODITE) [3]. Each dataset has merits and demerits and was built according to different methods. For example CRU and APHRODITE were only based on ground stations, whereas GPCP was a combination from ~6000 rain gauges, geostationary and low-orbit satellite data, leading to a set of rainfall data on both land and oceans. However, as only few stations over Vietnam were ingested in the available gridded datasets, there is a need to build a new gridded rainfall dataset that could incorporate more data from the available gauging network. 2. Data and Methodology
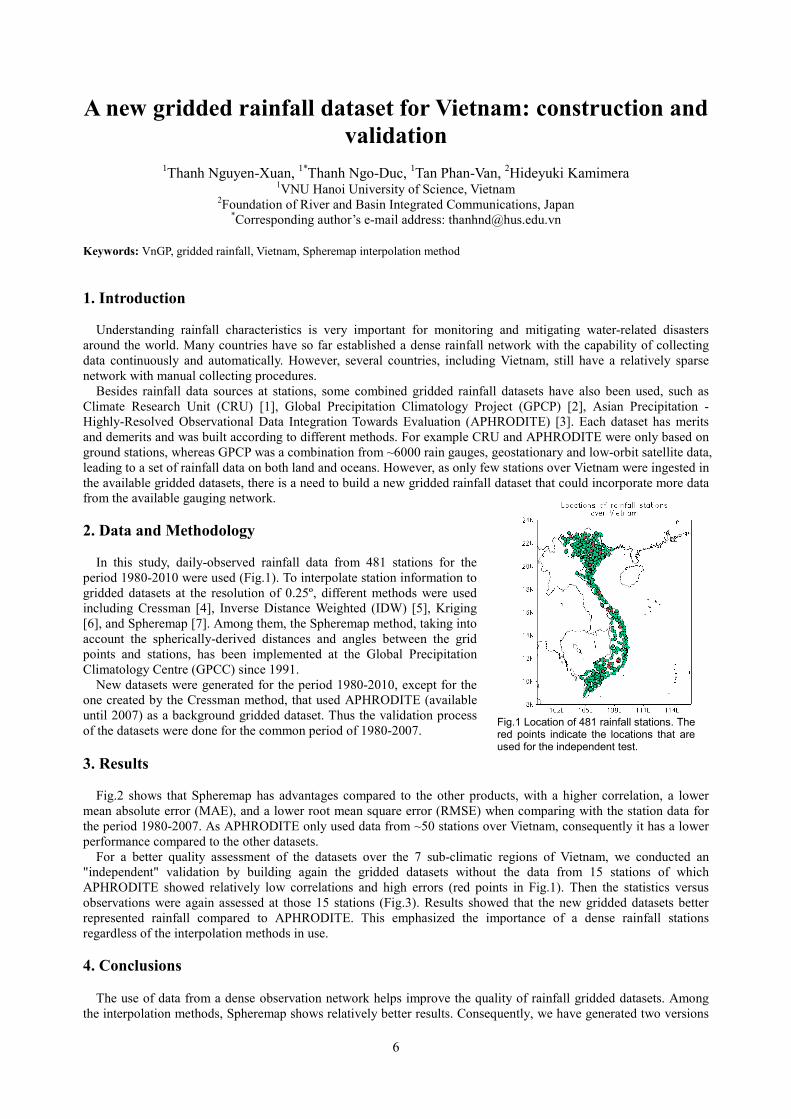
In this study, daily-observed rainfall data from 481 stations for the period 1980-2010 were used (Fig.1). To interpolate station information to gridded datasets at the resolution of 0.25º, different methods were used including Cressman [4], Inverse Distance Weighted (IDW) [5], Kriging [6], and Spheremap [7]. Among them, the Spheremap method, taking into account the spherically-derived distances and angles between the grid points and stations, has been implemented at the Global Precipitation Climatology Centre (GPCC) since 1991.
New datasets were generated for the period 1980-2010, except for the one created by the Cressman method, that used APHRODITE (available until 2007) as a background gridded dataset. Thus the validation process of the datasets were done for the common period of 1980-2007. 3. Results
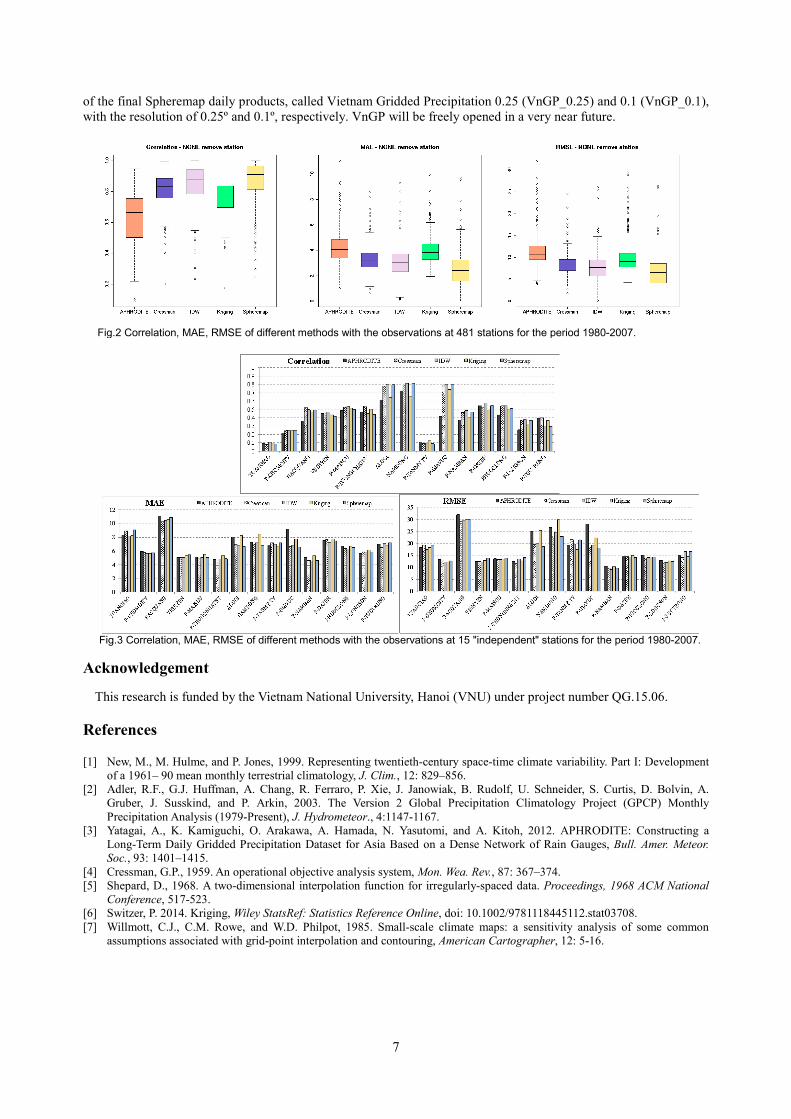
Fig.2 shows that Spheremap has advantages compared to the other products, with a higher correlation, a lower mean absolute error (MAE), and a lower root mean square error (RMSE) when comparing with the station data for the period 1980-2007. As APHRODITE only used data from ~50 stations over Vietnam, consequently it has a lower performance compared to the other datasets.
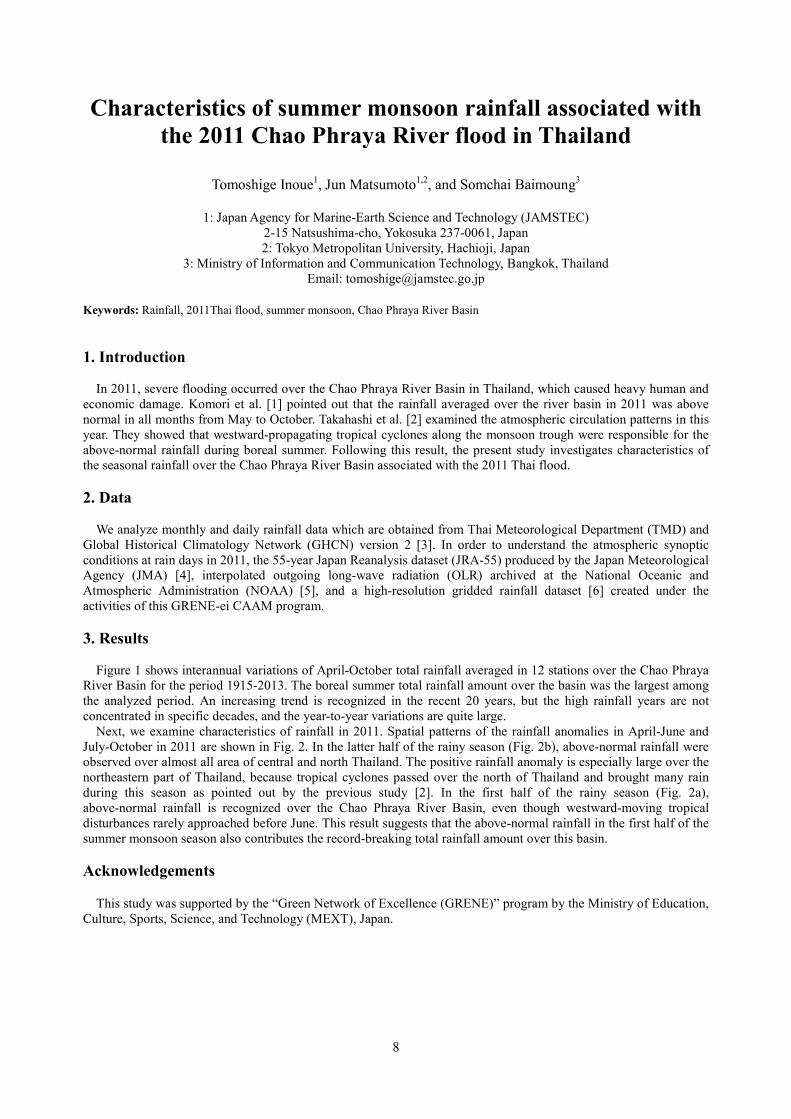
For a better quality assessment of the datasets over the 7 sub-climatic regions of Vietnam, we conducted an "independent" validation by building again the gridded datasets without the data from 15 stations of which APHRODITE showed relatively low correlations and high errors (red points in Fig.1). Then the statistics versus observations were again assessed at those 15 stations (Fig.3). Results showed that the new gridded datasets better represented rainfall compared to APHRODITE. This emphasized the importance of a dense rainfall stations regardless of the interpolation methods in use.
4. Conclusions
The use of data from a dense observation network helps improve the quality of rainfall gridded datasets. Among the interpolation methods, Spheremap shows relatively better results. Consequently, we have generated two versions
Fig.1 Location of 481 rainfall stations. The red points indicate the locations that are used for the independent test.
7
of the final Spheremap daily products, called Vietnam Gridded Precipitation 0.25 (VnGP_0.25) and 0.1 (VnGP_0.1), with the resolution of 0.25º and 0.1º, respectively. VnGP will be freely opened in a very near future.
Fig.2 Correlation, MAE, RMSE of different methods with the observations at 481 stations for the period 1980-2007.
Fig.3 Correlation, MAE, RMSE of different methods with the observations at 15 "independent" stations for the period 1980-2007.
Acknowledgement
This research is funded by the Vietnam National University, Hanoi (VNU) under project number QG.15.06. References [1] New, M., M. Hulme, and P. Jones, 1999. Representing twentieth-century space-time climate variability. Part I: Development
of a 1961– 90 mean monthly terrestrial climatology, J. Clim., 12: 829–856. [2] Adler, R.F., G.J. Huffman, A. Chang, R. Ferraro, P. Xie, J. Janowiak, B. Rudolf, U. Schneider, S. Curtis, D. Bolvin, A.
Gruber, J. Susskind, and P. Arkin, 2003. The Version 2 Global Precipitation Climatology Project (GPCP) Monthly Precipitation Analysis (1979-Present), J. Hydrometeor., 4:1147-1167.
[3] Yatagai, A., K. Kamiguchi, O. Arakawa, A. Hamada, N. Yasutomi, and A. Kitoh, 2012. APHRODITE: Constructing a Long-Term Daily Gridded Precipitation Dataset for Asia Based on a Dense Network of Rain Gauges, Bull. Amer. Meteor. Soc., 93: 1401–1415.
[4] Cressman, G.P., 1959. An operational objective analysis system, Mon. Wea. Rev., 87: 367–374. [5] Shepard, D., 1968. A two-dimensional interpolation function for irregularly-spaced data. Proceedings, 1968 ACM National
Conference, 517-523. [6] Switzer, P. 2014. Kriging, Wiley StatsRef: Statistics Reference Online, doi: 10.1002/9781118445112.stat03708. [7] Willmott, C.J., C.M. Rowe, and W.D. Philpot, 1985. Small-scale climate maps: a sensitivity analysis of some common
assumptions associated with grid-point interpolation and contouring, American Cartographer, 12: 5-16.
8
Characteristics of summer monsoon rainfall associated with the 2011 Chao Phraya River flood in Thailand
Tomoshige Inoue1, Jun Matsumoto1,2, and Somchai Baimoung3
1: Japan Agency for Marine-Earth Science and Technology (JAMSTEC)
2-15 Natsushima-cho, Yokosuka 237-0061, Japan 2: Tokyo Metropolitan University, Hachioji, Japan
3: Ministry of Information and Communication Technology, Bangkok, Thailand Email: [email protected]
Keywords: Rainfall, 2011Thai flood, summer monsoon, Chao Phraya River Basin 1. Introduction
In 2011, severe flooding occurred over the Chao Phraya River Basin in Thailand, which caused heavy human and economic damage. Komori et al. [1] pointed out that the rainfall averaged over the river basin in 2011 was above normal in all months from May to October. Takahashi et al. [2] examined the atmospheric circulation patterns in this year. They showed that westward-propagating tropical cyclones along the monsoon trough were responsible for the above-normal rainfall during boreal summer. Following this result, the present study investigates characteristics of the seasonal rainfall over the Chao Phraya River Basin associated with the 2011 Thai flood. 2. Data
We analyze monthly and daily rainfall data which are obtained from Thai Meteorological Department (TMD) and Global Historical Climatology Network (GHCN) version 2 [3]. In order to understand the atmospheric synoptic conditions at rain days in 2011, the 55-year Japan Reanalysis dataset (JRA-55) produced by the Japan Meteorological Agency (JMA) [4], interpolated outgoing long-wave radiation (OLR) archived at the National Oceanic and Atmospheric Administration (NOAA) [5], and a high-resolution gridded rainfall dataset [6] created under the activities of this GRENE-ei CAAM program. 3. Results
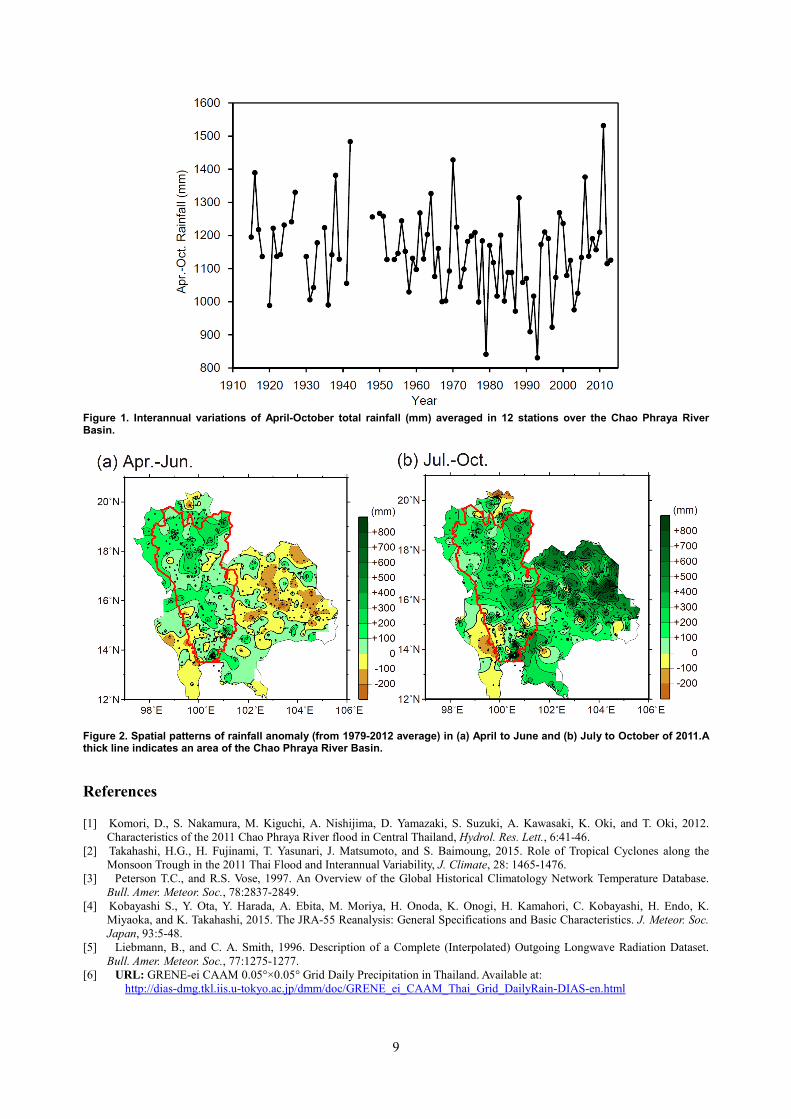
Figure 1 shows interannual variations of April-October total rainfall averaged in 12 stations over the Chao Phraya River Basin for the period 1915-2013. The boreal summer total rainfall amount over the basin was the largest among the analyzed period. An increasing trend is recognized in the recent 20 years, but the high rainfall years are not concentrated in specific decades, and the year-to-year variations are quite large.
Next, we examine characteristics of rainfall in 2011. Spatial patterns of the rainfall anomalies in April-June and July-October in 2011 are shown in Fig. 2. In the latter half of the rainy season (Fig. 2b), above-normal rainfall were observed over almost all area of central and north Thailand. The positive rainfall anomaly is especially large over the northeastern part of Thailand, because tropical cyclones passed over the north of Thailand and brought many rain during this season as pointed out by the previous study [2]. In the first half of the rainy season (Fig. 2a), above-normal rainfall is recognized over the Chao Phraya River Basin, even though westward-moving tropical disturbances rarely approached before June. This result suggests that the above-normal rainfall in the first half of the summer monsoon season also contributes the record-breaking total rainfall amount over this basin. Acknowledgements
This study was supported by the “Green Network of Excellence (GRENE)” program by the Ministry of Education, Culture, Sports, Science, and Technology (MEXT), Japan.
9
Figure 1. Interannual variations of April-October total rainfall (mm) averaged in 12 stations over the Chao Phraya River Basin.
Figure 2. Spatial patterns of rainfall anomaly (from 1979-2012 average) in (a) April to June and (b) July to October of 2011.A thick line indicates an area of the Chao Phraya River Basin. References [1] Komori, D., S. Nakamura, M. Kiguchi, A. Nishijima, D. Yamazaki, S. Suzuki, A. Kawasaki, K. Oki, and T. Oki, 2012.
Characteristics of the 2011 Chao Phraya River flood in Central Thailand, Hydrol. Res. Lett., 6:41-46. [2] Takahashi, H.G., H. Fujinami, T. Yasunari, J. Matsumoto, and S. Baimoung, 2015. Role of Tropical Cyclones along the
Monsoon Trough in the 2011 Thai Flood and Interannual Variability, J. Climate, 28: 1465-1476. [3] Peterson T.C., and R.S. Vose, 1997. An Overview of the Global Historical Climatology Network Temperature Database.
Bull. Amer. Meteor. Soc., 78:2837-2849. [4] Kobayashi S., Y. Ota, Y. Harada, A. Ebita, M. Moriya, H. Onoda, K. Onogi, H. Kamahori, C. Kobayashi, H. Endo, K.
Miyaoka, and K. Takahashi, 2015. The JRA-55 Reanalysis: General Specifications and Basic Characteristics. J. Meteor. Soc. Japan, 93:5-48.
[5] Liebmann, B., and C. A. Smith, 1996. Description of a Complete (Interpolated) Outgoing Longwave Radiation Dataset. Bull. Amer. Meteor. Soc., 77:1275-1277.
[6] URL: GRENE-ei CAAM 0.05°×0.05° Grid Daily Precipitation in Thailand. Available at: http://dias-dmg.tkl.iis.u-tokyo.ac.jp/dmm/doc/GRENE_ei_CAAM_Thai_Grid_DailyRain-DIAS-en.html

10
Downscaling Seasonal Climate Forecasts for Agricultural Risk Management in the Philippines
Virgilio Julius P. Manzano Jr.
Department of Agricultural Engineering, Mariano Marcos State University City of Batac 2906, Ilocos Norte, Philippines
Amor V. M. Ines Departments of Plant, Soil, and Microbial Sciences, and Biosystems and Agricultural Engineering,
Michigan State University, East Lansing, MI, 48824, USA [email protected]
Abstract
Better predictions of crop yields could give farmers and policy makers more leadtime to anticipate and adjust decisions against impending climate risks. Here, we present a study on the use of seasonal climate forecasts for agricultural risk management in the Philippines. Seasonal rainfall forecasts from a coupled GCM (global climate model), CFSv2 (Climate Forecasting System version 2), were used to evaluate the utility of MJJA (May-June-July-August) rainfall forecasts in the Ilocos region. At a 3-month lead-time, CFSv2’s MMJA rainfall forecasts showed reasonable skill in the region, with r = 0.41. Before we downscaled the GCM forecasts, a bias correction of the forecasts was performed against observed regional rainfall. Then, a non-homogeneous hidden Markov model (NHMM) was used to downscale the forecasts to selected weather stations in the region. We evaluated the utility of the forecasts by linking the weather realizations from NHMM with a crop model. Using observed regional rainfall as predictor, simulated rice and maize yields from NHMM-downscaled rainfall were found to be comparable with yields simulated with observed weather at 5% level of significance (paired t-test, p > 0.05), and correlations are > 0.90. This result suggests that NHMM was able to downscale and simulate realistically the daily structure of rainfall in those stations. Using downscaled CFSv2 forecasts, the predicted yields showed more moderate correlations, with r = 0.56 for rice, and r = 0.69 for maize, which was expected because of the current skill of the GCM. Maize has deeper rooting depth enabling the crop to extract more water from deeper and wetter soil layers, which could have contributed to its higher predictability. Lower yields were observed to be associated with warm ENSO events. Our sensitivity analysis showed that planting rice and maize earlier than the usual planting windows practiced by farmers could improve the resilience to climate risks. Managing the variance of this management window however is of paramount importance, which could be informed by climate forecasts. Keywords: climate risk management, forecasts, downscaling, hidden Markov model, crop model Background
The persistent exposure of the Philippines to climate extremes contributes to its developmental problems. Agriculture, being the primary development sector contributing more than 20% to the gross domestic product (GDP), is particularly sensitive to climate. The impacts of climate-related hazards, such as droughts and floods, have enormous social and economic consequences at the farmer’s level and to the national economy.
Managing impacts of climate variability and extremes in agriculture is of utmost importance not only to minimize risk associated with the bad years, but also to maximize opportunities during the good years. In order to manage better climate related risks in agriculture, one must be equipped with useful information in advance to plan ahead in time. Advances in climate science using advanced earth system models combined with statistical models have paved the way to predict climate in advance of the growing season (Goddard et al., 2001; Goddard and Mason, 2002). This advanced climate information could help farmers make better decisions to minimize climate risks and exploit climate opportunities.
This paper presents a study on the potential use of a dynamic seasonal climate forecast for informing climate risk management in the Ilocos region of the Philippines to improve agricultural productivity and resilience. Specifically, we seek to test the downscalibility of the seasonal climate forecasts in the region using a multi-variate spatio-temporal downscaling technique, understand and assess the predictability of rice and maize yields at selected growing areas in the Philippines, and provide guidance on how to develop agricultural risk management strategies.
Methodology Downscaling and Crop Simulations
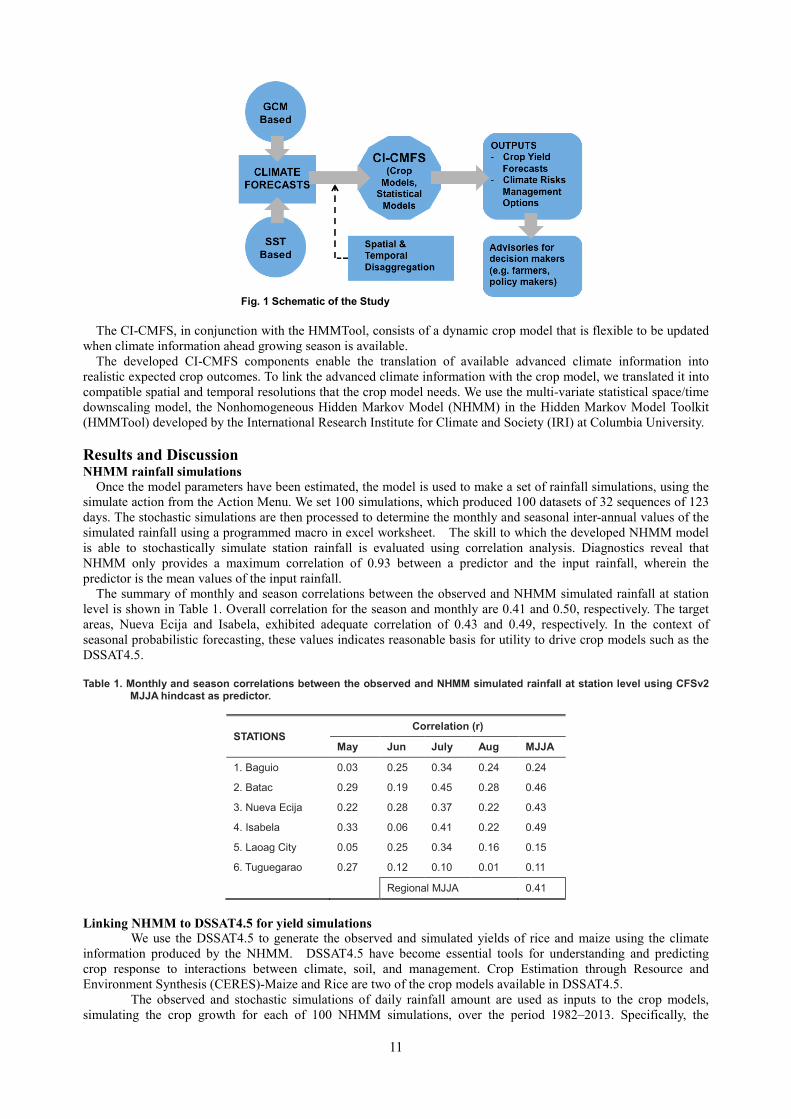
Fig. 1 shows the general framework of the study. Here, we present only the use of dynamic seasonal climate forecasts and crop models for informing agricultural risk management at the farmers’ and policy level.
The core of the study is the Climate Informed-Crop Monitoring and Forecasting System (CI-CMFS), which consists of developed crop and statistical models for crop yield forecasts leading to farming advisories for risk management at the farm level. Essential prerequisite for the development of the CI-CMFS are seasonal climate forecasts (SCF) generated from general circulation model-climate forecasting system v2 (GCM-CFSv2) outputs.
11
Fig. 1 Schematic of the Study
The CI-CMFS, in conjunction with the HMMTool, consists of a dynamic crop model that is flexible to be updated
when climate information ahead growing season is available. The developed CI-CMFS components enable the translation of available advanced climate information into
realistic expected crop outcomes. To link the advanced climate information with the crop model, we translated it into compatible spatial and temporal resolutions that the crop model needs. We use the multi-variate statistical space/time downscaling model, the Nonhomogeneous Hidden Markov Model (NHMM) in the Hidden Markov Model Toolkit (HMMTool) developed by the International Research Institute for Climate and Society (IRI) at Columbia University. Results and Discussion NHMM rainfall simulations
Once the model parameters have been estimated, the model is used to make a set of rainfall simulations, using the simulate action from the Action Menu. We set 100 simulations, which produced 100 datasets of 32 sequences of 123 days. The stochastic simulations are then processed to determine the monthly and seasonal inter-annual values of the simulated rainfall using a programmed macro in excel worksheet. The skill to which the developed NHMM model is able to stochastically simulate station rainfall is evaluated using correlation analysis. Diagnostics reveal that NHMM only provides a maximum correlation of 0.93 between a predictor and the input rainfall, wherein the predictor is the mean values of the input rainfall.
The summary of monthly and season correlations between the observed and NHMM simulated rainfall at station level is shown in Table 1. Overall correlation for the season and monthly are 0.41 and 0.50, respectively. The target areas, Nueva Ecija and Isabela, exhibited adequate correlation of 0.43 and 0.49, respectively. In the context of seasonal probabilistic forecasting, these values indicates reasonable basis for utility to drive crop models such as the DSSAT4.5.
Table 1. Monthly and season correlations between the observed and NHMM simulated rainfall at station level using CFSv2
MJJA hindcast as predictor.
STATIONS Correlation (r)
May Jun July Aug MJJA
1. Baguio 0.03 0.25 0.34 0.24 0.24
2. Batac 0.29 0.19 0.45 0.28 0.46
3. Nueva Ecija 0.22 0.28 0.37 0.22 0.43
4. Isabela 0.33 0.06 0.41 0.22 0.49
5. Laoag City 0.05 0.25 0.34 0.16 0.15
6. Tuguegarao 0.27 0.12 0.10 0.01 0.11
Regional MJJA 0.41
Linking NHMM to DSSAT4.5 for yield simulations
We use the DSSAT4.5 to generate the observed and simulated yields of rice and maize using the climate information produced by the NHMM. DSSAT4.5 have become essential tools for understanding and predicting crop response to interactions between climate, soil, and management. Crop Estimation through Resource and Environment Synthesis (CERES)-Maize and Rice are two of the crop models available in DSSAT4.5.
The observed and stochastic simulations of daily rainfall amount are used as inputs to the crop models, simulating the crop growth for each of 100 NHMM simulations, over the period 1982–2013. Specifically, the

12
observed and NHMM simulated as well as conditioned climate information from Nueva Ecija and Isabela stations are used to drive the CERES-Rice and CERES-Maize models, respectively. Daily maximum and minimum temperatures and solar radiation are set to their monthly climatological means, conditioned on the occurrence of rainfall (here ≥ mm).
The obtained correlations of 0.56 and 0.69 for rice and maize, respectively, indicates that only about 31% (rice) and 48% (maize) of the inter-annual variance of yields (given by r2) can be represented by the models of the dependence between seasonal rainfall total and crop yield. The values, nonetheless, suggest reasonable performance of the models in simulating yields using the NHMM generated climate information. Seasonal predictions of precipitation made with general circulation models (GCMs) are often skillful for some regions and seasons, particularly during El Niño–Southern Oscillation (ENSO) events (e.g., Goddard et. al. 2003). Summary and Conclusions
Philippines. The GCM-CFSv2 MJJA rainfall with 3-months leadtime, averaged over 56 grids across 32 years of record is used as the single driver of the NHMM, in order to investigate the NHMM’s ability to downscale under station scale conditions. Stochastic simulations reveal that NHMM is able to recover the inter-annual variability of station scale rainfall modestly (seasonal r = 0.41, monthly r = 0.50). This indicates a reasonable “downscalability” of GCM-CFSv2 regional-scale rainfall to the station scale given the predictive nature of the predictor data set as well as the imperfect capability of the NHMM. Diagnostics of the NHMM show a maximum r = 0.93 which maybe attributed to unpredictable station scale noise as theorized by Moron et. al., 2006.
With the established reasonable skill of the NHMM in the study region, the downscaled rainfall simulations are then used to drive two crop models (CERES-rice and CERES-maize) in the DSSAT4.5, in order to evaluate the performance of the NHMM’s rainfall simulations in terms of crop yields. Yields are found to be moderately correlated with the simulated yields with r = 0.56 for rice and r = 0.69 for maize. In a linear regression sense (r2), 31% of the simulated Nueva Ecija station averaged yield variability was attributable to seasonal rainfall totals. The Isabela station provided a better r2 of 0.69. Moreover, simulated yields for both rice and maize are found to be comparable with the observed at 5% level of significance using t-test (p > 0.05). In principle, the results of this study demonstrate that regional rice and maize yields over the northern Philippines can be simulated fairly by GCM-CFSv2 rainfall in a predictive sense (3-momths leadtime).
The main goal of this study is to provide seasonal yield forecast for the upcoming wet growing season for rice and maize in Nueva Ecija and Isabela sites in northern Philippines. Climatologically and in consideration of the rainfall states found in this study, the best planting and sowing windows for rice and maize in the study areas are on the first week and last week of May, respectively. Relative hereto, SCF for an incoming season is a rolling and moving target that is acquired by driving the developed models with available advance climate information.
Low yield years are found to be associated with significant ENSO events. Harvest period should not cross over in the month of September to avoid exposure to heavy typhoons.
Acknowledgement
We acknowledge the Ilocos Norte Science Community (INSC) partner agency coordinators for collecting climate data used in this study; PAGASA for providing those datasets; Fulbright Philippines and the Fulbright program for the research grant provided to the main author; IRI for hosting; Bradfield Lyon, Paula Gonzalez and Andrew Robertson for their technical guidance. References: [1] Goddard, L., Mason, S.J., 2002. Sensitivity of seasonal climate forecasts to persisted SST anomalies. Clim. Dyn. 19, 619–
632. [2] Goddard, L., Mason, S.J., Zebiak, S.E., Ropelewski, C.F., Basher, R., Cane, M.A., 2001. Current approaches to seasonal to
interannual climate predictions. Int. J. Climatol. 21, 1111–1152. [3] Hansen, J.W., Indeje, M., 2004. Linking dynamic seasonal climate forecasts with crop simulation for maize yield prediction
in semi-arid Kenya. Agric. For. Meteorol. 125:143-157. [4] Hansen, J.W., Ines, A.V.M., 2005. Stochastic disaggregation of monthly rainfall data for crop simulation studies. Agric. For.
Meteorol. 131: 233-246. [5] Moron, V., Robertson, A. W. and Ward, M. N. 2006. Seasonal predictability and spatial coherence of rainfall characteristics
in the tropical setting of Senegal. Monthly Weather Review 134: 3248–3262.
13
How much is the precipitation amount over the tropical coastal region?
Shin-Ya Ogino1, 2, Manabu D. Yamanaka1, 2, Shuichi Mori1, and Jun Matsumoto1, 3
1Japan Agency for Marine-Earth Science and Technology, 2-15 Natsushima-cho, Yokosuka, 237-0061 Japan
2Graduate School of Science, Kobe University, 1-1 Rokkodai, Nada-ku, Kobe, 657-8501 Japan 3Tokyo Metropolitan University, Minami-Osawa 1-1, Hachioji, 192-0397 Japan
Corresponding author’s e-mail address: [email protected]
Keywords: Precipitation, Tropics, Coastal region
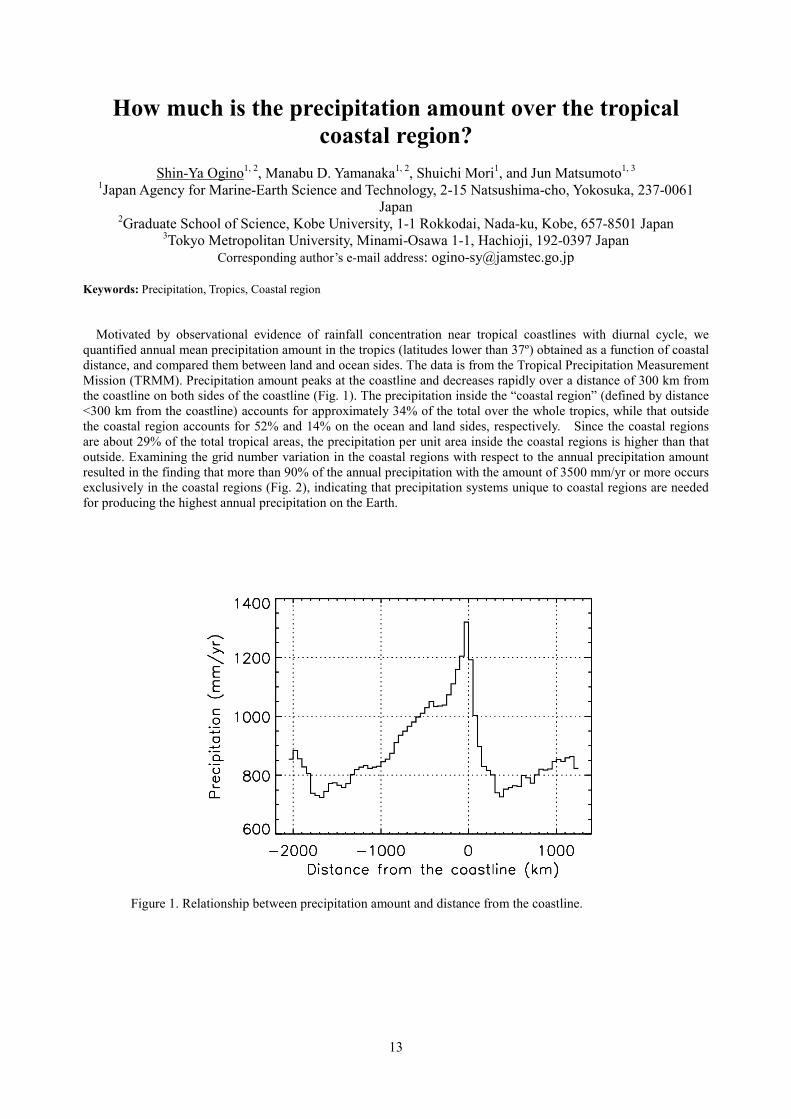
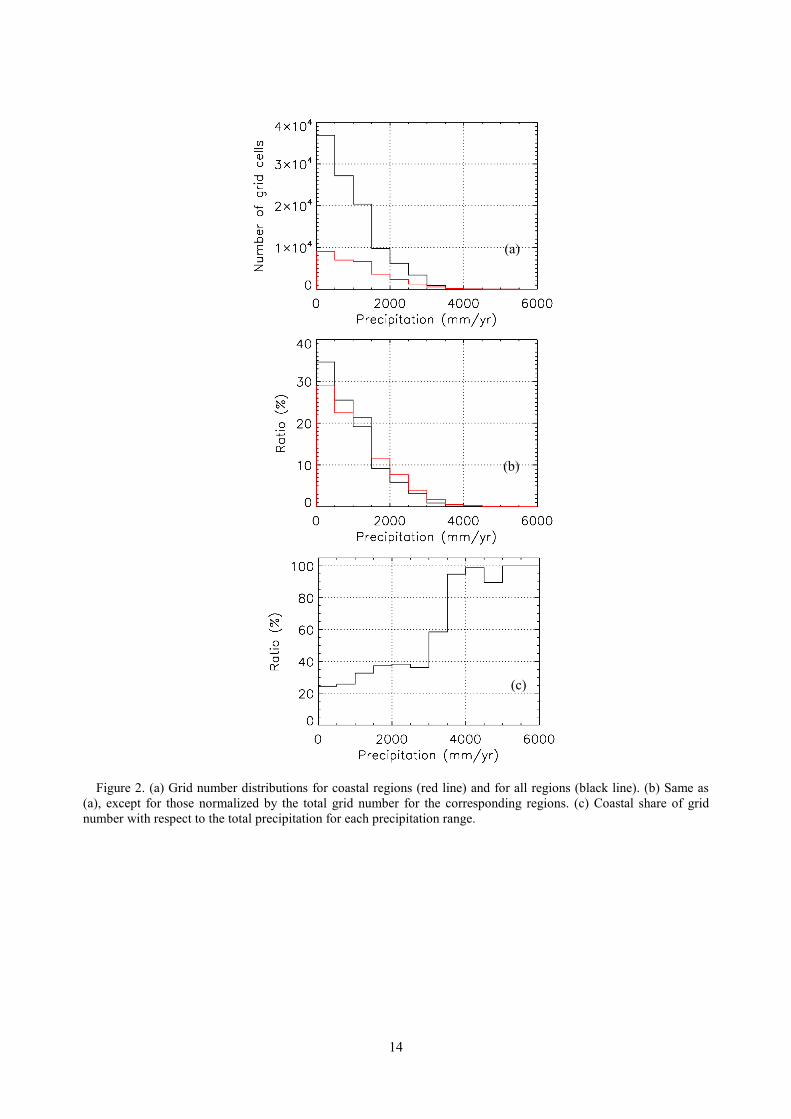
Motivated by observational evidence of rainfall concentration near tropical coastlines with diurnal cycle, we quantified annual mean precipitation amount in the tropics (latitudes lower than 37º) obtained as a function of coastal distance, and compared them between land and ocean sides. The data is from the Tropical Precipitation Measurement Mission (TRMM). Precipitation amount peaks at the coastline and decreases rapidly over a distance of 300 km from the coastline on both sides of the coastline (Fig. 1). The precipitation inside the “coastal region” (defined by distance <300 km from the coastline) accounts for approximately 34% of the total over the whole tropics, while that outside the coastal region accounts for 52% and 14% on the ocean and land sides, respectively. Since the coastal regions are about 29% of the total tropical areas, the precipitation per unit area inside the coastal regions is higher than that outside. Examining the grid number variation in the coastal regions with respect to the annual precipitation amount resulted in the finding that more than 90% of the annual precipitation with the amount of 3500 mm/yr or more occurs exclusively in the coastal regions (Fig. 2), indicating that precipitation systems unique to coastal regions are needed for producing the highest annual precipitation on the Earth.
Figure 1. Relationship between precipitation amount and distance from the coastline.
14
Figure 2. (a) Grid number distributions for coastal regions (red line) and for all regions (black line). (b) Same as
(a), except for those normalized by the total grid number for the corresponding regions. (c) Coastal share of grid number with respect to the total precipitation for each precipitation range.
(b)
(c)
(a)
15
Climatology of rainfall extremes over the Eastern Indonesian Maritime Continent
1HAMADA Jun-Ichi, 2Sopia Lestari, 2Fadli Syamsudin, 3Sunaryo,
1Jun Matsumoto, and 4Manabu D. Yamanaka 1Tokyo Metropolitan University, 1-1, Minami-Osawa, Hachioji, Japan
2Agency for the Assessment and Application of Technology, Jl. M.H. Thamrin No.8, Jakarta, Indonesia 3Agency for Meteorology, Climatology and Geophysics, Jl. Angkasa I, No.2 Kemayoran, Jakarta, Indonesia
4Japan Agency for Marine-Earth Science and Technology, 2-15, Natsushima-Cho, Yokosuka, Japan [email protected]
Keywords: Rainfall extreme, ENSO, Maritime continent
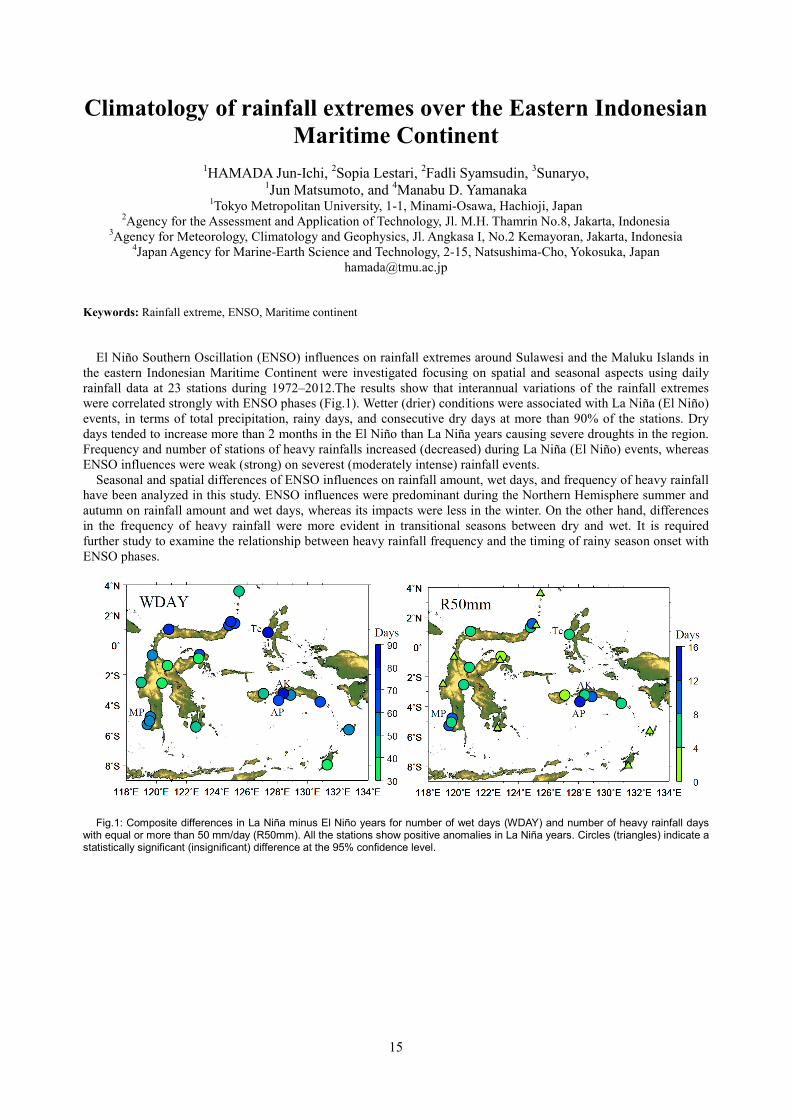
El Niño Southern Oscillation (ENSO) influences on rainfall extremes around Sulawesi and the Maluku Islands in the eastern Indonesian Maritime Continent were investigated focusing on spatial and seasonal aspects using daily rainfall data at 23 stations during 1972–2012.The results show that interannual variations of the rainfall extremes were correlated strongly with ENSO phases (Fig.1). Wetter (drier) conditions were associated with La Niña (El Niño) events, in terms of total precipitation, rainy days, and consecutive dry days at more than 90% of the stations. Dry days tended to increase more than 2 months in the El Niño than La Niña years causing severe droughts in the region. Frequency and number of stations of heavy rainfalls increased (decreased) during La Niña (El Niño) events, whereas ENSO influences were weak (strong) on severest (moderately intense) rainfall events.
Seasonal and spatial differences of ENSO influences on rainfall amount, wet days, and frequency of heavy rainfall have been analyzed in this study. ENSO influences were predominant during the Northern Hemisphere summer and autumn on rainfall amount and wet days, whereas its impacts were less in the winter. On the other hand, differences in the frequency of heavy rainfall were more evident in transitional seasons between dry and wet. It is required further study to examine the relationship between heavy rainfall frequency and the timing of rainy season onset with ENSO phases.
Fig.1: Composite differences in La Niña minus El Niño years for number of wet days (WDAY) and number of heavy rainfall days with equal or more than 50 mm/day (R50mm). All the stations show positive anomalies in La Niña years. Circles (triangles) indicate a statistically significant (insignificant) difference at the 95% confidence level.

16
Climatic Changes Related to Extreme Rainfall and Other Environmental Factors in Jakarta and Surrounding Areas
Fadli Syamsudin1, Sopia Lestari1, and Setyo Moersidik2
1Agency for the Assessment and Aplication of Technology Jl. M.H. Thamrin 8, Jakarta, Indonesia
2Graduate Faculty, Environment Department, University of Indonesia Email: [email protected]
Keywords: Heat island effect, Extreme Rainfall, Aerosol 1. Introduction Recently the high population growth and land use changes have made impacts to the environmental sustainabilty. In the Asian megacities, large population and their activities require the high land to be used for house, mining, and industry establishment. These can cause the environmetal issues such as high energy consumption, enhancement of air pollution, Urban Heat Island (UHI) effect, even also some changes to the local and regional climate [2]. Jakarta is now experiencing the UHI effect since there are many human activities need such as change the land use from forest to industry and housing, besides the increasing amount of transportation. All these activities cause the increasing air pollution (aerosols) and temperature. In this 30 years, the daily average of temperature has increased up to 0,8 °C (Brandsma, 2012). Urban Heat Island is known as temperature, albedo, evapotranspiration, and energy flux changes. The UHI has become important topic nowadays due to the its effect to the local rainfall intensity [1]. Many studies investigate the temperature changes since it can give some effects to the initiation or intensity of local rainfall that can cause floods (Shepherd, 2005). Many studies examined Heat Island (HI) by using land use and temperature data (Takayuki, Tokairin, Sofyan, & Kitada, 2010; Marpaung, 2012). But no studies assess HI effect and its relationship to the rainfall and aerosol. In this study, surface meteorological and aerosol data from Meteorological Climatology Geophysics Agency (BMKG), industry and transportation data from Statistics Agency (BPS), have been analyzed to observe the HI effect to the rainfall and aerosol in Jakarta due to the land use changes, transportation and industrial area. This study evaluate the increasing human activities, result in environmental problems and indirectly can change the rainfall intensity that can cause floods. 2. Materials and Methods
This study use the primary data such as the daily temperature, rainfall and monthly aerosol. Industry, transportation, and land use changes are used as suporting data. Temperature, rainfall, land use change and aerosol data are observed in the stations located in Jakarta and sorroundings. While industry and transportation data are observed in the stations located in Jakarta. Industry and transportation from BPS is available from 1986-2011.
The quality data of rainfall, temperature, and aerosol is checked with the homogeinity test. When the data pass this test, the data can continue to be analyzed. Harmonic analysis is used to find the characteristics of data. Mann-kendall statistics examine the trend of each data then evaluate the trend of these time series (Kendall, 1975).
The supporting data such as industry and transportation are plotted year by year. Its aim is to find the characteristic of the total industry and transportation in Jakarta related to the land use changes.
3. Results and Discussions
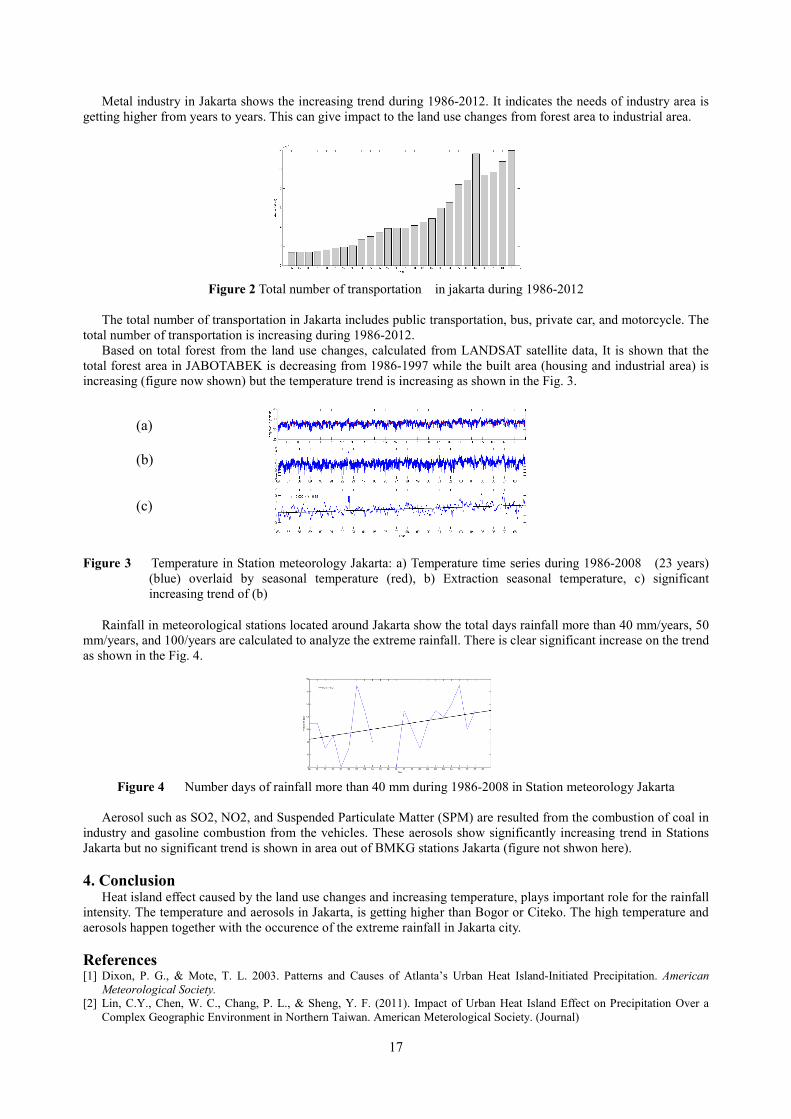
Industry especially the metal industry and transportation Jakarta is increasing during 1986-2012 as shown in Fig 1 and 2 below.
Figure 1 Total number of metal industry in jakarta during 1986-2012
17
Metal industry in Jakarta shows the increasing trend during 1986-2012. It indicates the needs of industry area is getting higher from years to years. This can give impact to the land use changes from forest area to industrial area.
Figure 2 Total number of transportation in jakarta during 1986-2012
The total number of transportation in Jakarta includes public transportation, bus, private car, and motorcycle. The
total number of transportation is increasing during 1986-2012. Based on total forest from the land use changes, calculated from LANDSAT satellite data, It is shown that the
total forest area in JABOTABEK is decreasing from 1986-1997 while the built area (housing and industrial area) is increasing (figure now shown) but the temperature trend is increasing as shown in the Fig. 3.
Figure 3 Temperature in Station meteorology Jakarta: a) Temperature time series during 1986-2008 (23 years)
(blue) overlaid by seasonal temperature (red), b) Extraction seasonal temperature, c) significant increasing trend of (b)
Rainfall in meteorological stations located around Jakarta show the total days rainfall more than 40 mm/years, 50 mm/years, and 100/years are calculated to analyze the extreme rainfall. There is clear significant increase on the trend as shown in the Fig. 4.
Figure 4 Number days of rainfall more than 40 mm during 1986-2008 in Station meteorology Jakarta
Aerosol such as SO2, NO2, and Suspended Particulate Matter (SPM) are resulted from the combustion of coal in
industry and gasoline combustion from the vehicles. These aerosols show significantly increasing trend in Stations Jakarta but no significant trend is shown in area out of BMKG stations Jakarta (figure not shwon here). 4. Conclusion
Heat island effect caused by the land use changes and increasing temperature, plays important role for the rainfall intensity. The temperature and aerosols in Jakarta, is getting higher than Bogor or Citeko. The high temperature and aerosols happen together with the occurence of the extreme rainfall in Jakarta city. References [1] Dixon, P. G., & Mote, T. L. 2003. Patterns and Causes of Atlanta’s Urban Heat Island-Initiated Precipitation. American
Meteorological Society. [2] Lin, C.Y., Chen, W. C., Chang, P. L., & Sheng, Y. F. (2011). Impact of Urban Heat Island Effect on Precipitation Over a
Complex Geographic Environment in Northern Taiwan. American Meterological Society. (Journal)
(a)
(b)
(c)
18
Analysis of Water Availability in the Context of Local Climatic and Seasonal Changes
Budi I. Setiawan1), Chusnul Arif1), Septian DW Saputro1), M. Ihsan Sitepu1) and Masaru Mizoguchi2)
1) Department of Civil and Environmental Engineering, Bogor Agricultural University, Kampus IPB Darmaga,
Bogor 16680, Indonesia 2) The University of Tokyo, Tokyo, Japan.
Corresponding author’s e-mail address: [email protected]
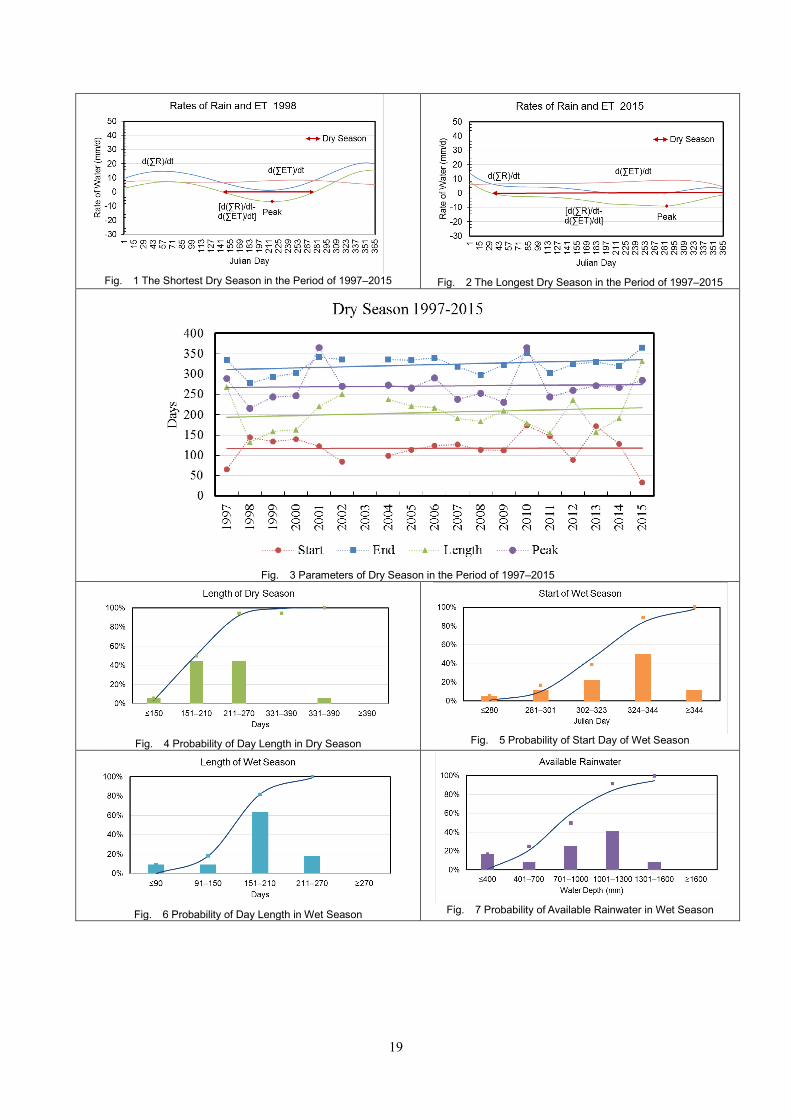
Keywords: Climatic and Seasonal Changes, Water Availability 1. Introduction Climate changes and their impacts to water availably have been effecting food production more severely year by year. The longest El Nino in 2015 caused more than 200 thousands of rice field in the southern parts of equator bared uncultivable. Some wetland areas in the northern parts however managed to harvest with better productivity. Impacts of climate change on seasonal change (wet and dry seasons) might differ from place to place. This study is to figure out occurrences of local climatic and seasonal changes with their impacts to water availability for food production. 2. Material and Methods The studied location was in Indramayu Regency of West-Java Province which is known as one of the rice production centers in Indonesia. Weather data (daily temperature and rainfall) was collected from the closest Jatiwangi Meteorology Station (WMO ID 96791) in the period of 1997–2015. Potential evapotranspiration was calculated using Hargreaves model in which terrestrial solar radiation was estimated from latitude of the station. Trends of climatic change were identified using linear equation and Mann-Kendall Model. Seasonal change was analyzed from daily rate of rain and evapotranspiration using polynomial equation. Probability of wet–dry season occurrences and their impacts on water availability was analyzed using lognormal distribution. 3. Results and Discussion The annual lowest, highest and averaged temperatures, and rainfall indicated no significant changes though the rainfall tended to decrease with time (year). Dry season fluctuated with time where the shortest is in 1998 amounted to 133 days (Fig. 1) while the longest was 332 days in 2015 (Fig. 2). Though very little, there is positive trends of start, end, length and peak of dry season (Fig. 3). Probability occurrences of wet-dry seasons (starting day and day length) followed lognormal distribution (Fig. 4, Fig. 5 and Fig. 6). Using 90% probability, the length of dry season is 264 days, the starting days of wet season is 350 Julian days (middle of December), the length of wet season is 225 days and water availability in the wet season is 1422 mm. If rice cultivation lasts 100 days or a little more it is possible to cultivate paddy in wet season with sufficient rainwater. Though, irrigation water is still necessary to prepare since rainfall commonly happens occasionally. Precaution on El Nino is indispensable though its occurrence probability is 6% within 19 years with its length between 330-390 days. 3. Conclusions This study has revealed that statistically there is no significant climate changes in the annual basis but seasonal wet-dry season clearly fluctuated with time (year). Length of, and rainwater during, wet season are sufficient for rice cultivation two times if started from middle of December. Acknowledgement This study is a part of International Research Collaboration and Scientific Publication entitled “Promoting Innovative Solutions on Water Related Problems” funded by the Ministry of research and Higher Education, the Republic of Indonesia since 2015.
19
Fig. 1 The Shortest Dry Season in the Period of 1997–2015
Fig. 2 The Longest Dry Season in the Period of 1997–2015
Fig. 3 Parameters of Dry Season in the Period of 1997–2015
Fig. 4 Probability of Day Length in Dry Season
Fig. 5 Probability of Start Day of Wet Season
Fig. 6 Probability of Day Length in Wet Season
Fig. 7 Probability of Available Rainwater in Wet Season
20
Interdecadal variability of western north Pacific summer monsoon and its correlation to Japan rice yield
Hisayuki Kubota
Japan Agency for Marine-Earth Science and Technology (JAMSTEC) Yokosuka, Japan
Keywords: Summer monsoon, Interdecadal variability, Japan Rice yield 1. Introduction
About 60% of the world’s population lives in the Asian monsoon region. Asian monsoon climate displays large variability that affects their lives. The Asian summer monsoon system has several regional subsystems. Over the oceanic region in the Philippine Sea, the western North Pacific (WNP) summer monsoon dominates (Murakami and Matsumoto 1994). The Pacific-Japan (PJ) teleconnection pattern is a dominant pattern of interannual variability for the WNP and East Asian summer monsoons (Nitta 1987). The PJ pattern features an anomalous dipole of lower tropospheric circulation, whose centers of action are over the Philippine Sea and the midlatitudes around Japan. In this study, we define a new PJ pattern index using station-based, atmospheric pressure data to represent the long-term variability of the East Asian and WNP summer monsoon. In contrast to other PJ indices using reanalysis data (Kosaka and Nakamura 2010), our new PJ index has an advantage of going back to 1897 for more than 110 years with reliable quality. The long PJ index has potential to relate the PJ pattern to historical natural disasters that occurred in East and Southeast Asia. 2. Data
Historical station data are collected back to 1897 in Japan and Taiwan, and 1901 in the Philippines. The station data are from the Japan Meteorological Agency (JMA), Central Weather Bureau of Taiwan, Philippine Atmospheric, Geophysical and Astronomical Services Administration (PAGASA) and paper books reported by the Central Meteorological Observatory of Japan (CMOJ, the predecessor of JMA) and the Philippine Weather Bureau (PWB). We use sea surface temperature (SST) of HadSST3 data set to define El Niño-Southern Oscillation (ENSO) index of niño 3.4 SST. Japan rice yield data is used from Ministry of Agriculture, Forestry and Fisheries statistical data. Yangtze river flow data is used from the global runoff data centre, 56068. A historical TC counts is based on Kubota and Chan (2009) over the Taiwan and Okinawa region from 1904 to 2013 obtained by combining historical TC track data by PWB and CMOJ and recent best track data by Joint Typhoon Warning Center (JTWC). The selected TC counts area is within a 600 km radius from 2 stations (Ishigakijima and Naha, Japan). 3. Results
PJ pattern can be identified as dominant meridional pressure pattern during summer over the western north Pacific by negative correlation of sea level pressure (SLP) around the Philippine Sea and positive correlation in eastern Japan (Kosaka and Nakamura 2010). Based on this correlation map, we choose Yokohama of Japan in the positive pole and Hengchun of Taiwan in the negative pole to define the PJ index as
The PJ index = P(Yokohama) – P(Hengchun)
where P denotes JJA average of atmospheric pressure anomaly, normalized by SD in each station. We then normalized the index for a reference period of 1979-2009. A wide array of climate variables significantly correlate with the PJ pattern in East and Southeast Asia (Fig. 1), including Western Philippine summer rainfall, Japan summer temperature, and number of tropical cyclones (TCs) that pass through Taiwan and Okinawa region. Rice yield in Japan and Yangtze River flow (before 2003 when the Three Gorges Dam became operational) are also correlated significantly. During the negative phase of the PJ pattern, by contrast, the WNP summer monsoon activity becomes weak with cool, wet summer in Japan, Korea, and the Yangtze River basin due to an active East Asian summer monsoon. In a negative PJ event of 1998 summer, major floods occurred in Yangtze River, more than 3000 people died and 13.3 million houses were damaged or destroyed. The PJ pattern is correlated with El Niño-Southern Oscillation (ENSO) in the preceding boreal winter.

21
Rice is a staple food in Asian countries. An important factor for rice harvest is sunshine duration, which is correlated positively with the PJ pattern in the main island of Japan. Indeed, rice product per unit area in Japan is significantly correlated with the PJ index for the recent four decades (Fig. 1). The correlation is lower before the late 1960s but again significant before the 1920s as well as since the late 1960s (Fig. 2). Despite that rice yield is also related to improved agriculture technology and the policy of rice production, the interdecadal modulation of its correlation with the PJ index is apparent for the recent decades. The 117-year long PJ index reveals that the relationship with ENSO has varied on interdecadal time scales. While the PJ pattern is significantly correlated with ENSO in the preceding boreal winter from the 1970s to 1990s, this relation vanished from the 1950s to early 1970s (Xie et al. 2010). Further back in time, we find that the PJ-ENSO correlations were significant prior to the 1910s and around 1930 (not shown). Since ENSO can be a major driver of the PJ pattern, the PJ variance is high when the PJ-ENSO correlation and ENSO variance are high. The interdecadal modulation of the correlation of climate variables of Japan rice yield and PJ pattern will also be influenced by the variance of PJ pattern.
Fig. 1 Normalized time series of the station-based PJ index, Niño 3.4 SST anomaly in DJF based on HadSST3 median (sign flipped; unit: ºC), anomalous rainfall averaged for West Philippine 5 stations in JJA (unit: SD), northern Japan temperature anomaly in JJA (unit: ºC),
Japan rice yield anomaly per unit area (unit: SD), anomaly of JTWC TC counts in Taiwan and Okinawa regions in JJA (unit: SD), and Yangtze River flow anomaly in JJA (sign flipped; unit: SD). Positive and negative values are shown in red and blue bars, respectively. Numbers on the right side indicate correlation coefficients with the PJ index for the shown period (until 2002 for Yangtze River flow). Bars are shown in grey for Yangtze River flow after Three Gorges Dam was operated in 2003. 9-year running average has been subtracted except for the PJ index.
Fig. 2 21-year running correlation between rice yield per unit area in Japan and the PJ index. 9-year running average has been removed before evaluating the correlation. Thin lines show 95% confidence level. Year refers to the center of a given 21-year window.
Acknowledgement This study was supported by “Global Environment Research Fund from the Ministry of the Environment Japan” B-061, "Data Integration & Analysis System", “Green Network of Excellence” (GRENE), “Program for Risk Information on Climate Change” (SOUSEI), and Grant-in-Aid for Scientific Research No. 25282085, (2024007, 23240122, and 26220202; Leader: Prof. Jun Matsumoto) and Young Scientific Research No. 21684028 funded by Ministry of Education, Culture, Sports, Science and Technology (MEXT) of Japan. References [1] Kosaka, Y. and H. Nakamura, 2010. Mechanisms of meridional teleconnection observed between a summer monsoon system
and a subtropical anticyclone. Part I: The Pacific–Japan pattern, J. Climate 23: 5085–5108. [2] Kubota, H. and J. C. L. Chan, 2009. Interdecadal variability of tropical cyclone landfall in the Philippines from 1902 to 2005,
Geophys. Res. Lett. 36: L12802. doi:10.1029/2009GL038108 [3] Murakami, T. and J. Matsumoto, 1994. Summer monsoon over the Asian continent and western North Pacific, J. Meteor. Soc.
Japan 72: 719–745. [4] Nitta, T., 1987. Convective activities in the tropical western Pacific and their impacts on the Northern Hemisphere summer
circulation, J. Meteor. Soc. Japan 65: 165–171.
22
Influence of local land cover to the agro-meteorological conditions in farmland
- Importance of monitoring weather in farmland -
Tsuneo Kuwagata1*, Yasushi Ishigooka1, Motoki Nishimori1, Keisuke Ono1, Toshihiro Hasegawa1, Mayumi Yoshimoto1, Minehiko Fukuoka1, Yasuhiro Usui1,2,
Shigenori Haginoya3, and Yasuhiro Kawabata3 1 National Institute for Agro-Environmental Sciences, Tsukuba, 305-8604 Japan
2 present address, NARO Hokkaido Agricultural Research Center, Memuro, Kasai, Hokkaido 082-0081 Japan 3 Meteorological Research Institute, Tsukuba, 305-0052 Japan
* Correspondence to: [email protected]
Keywords: Climatic Changes, Farmland, Global Warming, Local Land Cover, Urban Climate 1. Introduction
Agriculture is strongly influenced by weather conditions and climate variation. Accurate meteorological data are essential for both the risk assessment of crop production and the management of cultivating crops. Agro-meteorological conditions in farmland are strongly influenced by local land cover. In the case of Japan, however, many of the surface meteorological stations of the Japan Meteorological Agency (JMA) are located in urban or sub-urban areas, but few stations are located in farmland.
In this study, for pointing out the importance of monitoring weather in farmland, we demonstrated that the differences in meteorological conditions between a meteorological station and a nearby farmland exist and that these differences are strongly influenced by the local land cover. 2. Agro-meteorological conditions in farmland
The seasonal change in temperature difference between a meteorological station in an urban-area and nearby farmland (paddy rice in summer, wheat or barley in winter, horizontal distance between the two sites: 3.2 km) in Kumagaya City was examined over 2010−2012 [1]. Kumagaya City is located in the inland of the Kanto Plain, and has an urban area of around 25 km2, surrounded by farmland. Kumagaya City is also one of the hottest cities in Japan; the extremely high daily maximum temperature of 40.9°C was recorded at the meteorological station on 16 August 2007.The daily mean, maximum, and minimum temperatures (Tmean, Tmax, and Tmin) at the meteorological station (urban site) were higher than those at the nearby farmland site for all seasons. Differences in the monthly temperatures between the two sites were 0.2−0.9°C (Tmean), 0.6−1.6°C (Tmax), and 0.2−0.6°C (Tmin), and the maximum differences were in August (Tmean and Tmax) and April (Tmin). Large monthly temperature difference over 1°C for Tmax was observed during the paddy rice-growing season in farmland from July to September [1]. Differences in daily Tmax and Tmean between the two sites increased with daily solar radiation Sd, and the sensitivities of these temperature differences to Sd were larger during the paddy rice-growing season [1]. The number of “extremely hot days” (Tmax ≥ 35°C) at the farmland site was only 36% of the number at the urban site, while the relative proportion of “sultry nights” (Tmin ≥ 25°C) was 62% [1].
The daily mean temperature at a farmland site (paddy rice in summer, bare-soil in winter) in Tsukuba City (located in the east-south area of the Kanto Plain) was 0−3°C lower than that in an sub-urban area site of the city (the observational field of Meteorological Research Institute, horizontal distance between the two sites: about 7 km) across all seasons, and the temperature difference between the two sites was correlated with the seasonal change in the local land cover conditions. On the other hand, humidity (water vapor pressure) at the farmland became higher than that in the sub-urban area during the paddy rice-growing season from May to August. The differences in temperature and humidity between the two sites during the paddy rice-growing season were closely related to the difference in surface heat budget between the both sites.
During recent 30 years, the increasing rates of temperature in urban areas were larger than those in farmlands in Japan [2]. We also found that the difference in the temperature increasing rate between the both areas varied with season, whose difference was larger during summer, especially for the daily maximum temperature.
23
3. Conclusion
Many of the meteorological stations in Japan are located in urban or sub-urban areas, but few stations are in farmland. Meteorological conditions in urban or sub-urban area are different from those in farmland. There must be a similar situation in other countries in Asian monsoon region. We should point out the importance of monitoring weather in farmland. Acknowledgement
This study is financially supported by the “Green Network of Excellence - environmental information (GRENE-ei)” program and “Research Program on Climate Change Adaptation” by the Ministry of Education, Culture, Sports, Science, and Technology (MEXT), Japan. References [1] Kuwagata, T., Ishigooka, Y., Fukuoka, M., Yoshimoto, M., Hasegawa, T., Usui, Y., and Sekiguchi, T., 2014. Temperature
Difference between Meteorological Station and nearby Farmland –Case Study for Kumagaya City in Japan–, SOLA, 10:45-49 (doi:10.2151/sola.2014-010).
[2] Nishimori, M., Kuwagata, T., Ishigooka, Y., and Murakami, M., 2009. On the regional and seasonal characteristics of recent surface air temperature changes in Japan with considering urban climate effects, Journal of Agricultural Meteorology, 65(2): 221-227 (In Japanese with English abstract).
24
Comparison of the surface downward longwave
radiation at the different regions
Jianqing Xu
Center for Research in Isotopes and Environmental Dynamics University of Tsukuba
Abstract
More than 60% of the world’s population lives in the Asian monsoon region, and it is thus crucial to
understand potential changes in the Asian monsoon under the global climate change. Global solar radiation and longwave radiation arriving at the Earth’s surface play key roles in the energy balance of the earth-atmosphere system. Excepting reflected global solar radiation and upward longwave radiation fluxes, the downward global solar radiation and the surface downward longwave radiation energy act at the ground level, such as by vaporizing surface water, heating the air in the surface layer, and warming the ground surface. These processes determine the surface air temperature. However, the surface downward longwave radiation was seldom observed. In present study, the data of surface downward longwave radiation has been collected at the Center for Research in Isotopes and Environmental Dynamics in the University of Tsukuba (temperate area), Laoag in Philippines (tropical zone), and NamCo (the Tibet Platean). Comparison of the surface downward longwave radiation at those three different climatic regions has been conducted. The flux of the surface downward longwave radiation is bigger than the surface downward global solar radiation over the most of the planet in. This means, the mean value in the energy balance was controlled by the longwave radiation mostly, and the solar radiation managed its amplitude distribution. But in NamCo of Tibet plateau, this relationship is reversed due to the rarefied air, the value of water vapor in the air was very small, and the surface downward longwave radiation was small too. It’s even less than that in the Antarctic Pole in the winter time. The detail of the daily and seasonal change in those three observation points will be analyzed. On the other hand, the surface downward longwave radiation flux reflects the onset signal of the summer monsoon at Laoag, Philippines. And the precipitable water estimated from longwave radiation agreed well with that estimated from aerological observatories. It is thus suggested that observation of longwave radiation may provide the more details about change in precipitable water in the atmosphere.
For correspondence: Jianqing Xu, Dr. Center for Research in Isotopes and Environmental Dynamics (CRiED) University of Tsukuba TEL&FAX:029-853-2533 Email:[email protected]
25
A summary of the impact of land-surface conditions on regional climate over the wet tropics under GRENE-CAAM
Hiroshi G. Takahashi
Tokyo Metropolitan University Minamioosawa 1-1, Hachioji, Japan
[email protected] Keywords: Climate Changes, Land Surface Condition, Regional Climate Model, Precipitation Characteristics 1. Introduction
Land use and land cover changes (LUCCs) can impact regional climates as well as the global climate. In the tropics, one of the largest LUCCs is deforestation. The Asian monsoon region, including the Indochina Peninsula and the maritime continent, has experienced intensive anthropogenic deforestation since the latter half of the 20th century. In addition, a development of mega city and an increase cropland (including double cropping) has been continued as anthropogenic land-surface change. To understand these effects, we conducted some approaches of numerical experiments. The purposes of this review are 1) to understand the impact of land-surface conditions (soil moisture) on precipitation characteristics over the wet Asian monsoon region, 2) to understand the impact of double cropping on regional climate in dry season of the Indochina Peninsula, 3) to evaluate the performance of regional climate model over the wet Asian monsoon region, and 4) to estimate spatial distribution of sensitivity of precipitation characteristics and extremes to soil moisture over the wet Asian monsoon region. 2. Summary
1) Results showed that precipitation characteristics (including extremes) can be changed by the changes in soil moisture condition over and around Bangladesh, which was associated with the seasonal changes in precipitation characteristics there. 2) As an impact of double cropping over northern Thailand of the Indochina Peninsula, soil moisture of the intensive double cropping area can be dried up due to the excessive evapotranspiration during the dry season. This may have impact on the climatological water budget as well as the regional climate. 3) The performance of regional climate model over the wet Asian monsoon regions was basically good, when we use several-kilometer resolution setting without convective cumulus parameterization. Major problem of lower resolution of regional climate experiment in this region was the lower performance of diurnal cycle of precipitation, which was strongly related to the energy and water budget over the region. 4) We are developing an estimation method to evaluate the spatial distribution of sensitivity of regional climate to land-surface conditions.

26
Collection of Data and Parameters for Major Crop Variety in Thailand to Execute and to Validate DSSAT
Kei TANAKA and Takuji KIURA NARO, Agricultural Research Center (NARO/ARC) 3-1-1 Kannondai Tsukuba Ibaraki 305-8666 Japan
Keywords: yield prediction, rice, cassava, cabbage, DSSAT 1. Introduction
We developed a prediction system to identify and recommend an appropriate crop and area for cultivation, in our research seeking to elucidate the effect that climatic change has on agriculture. We chose the area from the northeast to the north of Thailand as a research target area. Northeastern Thailand is a rainfed farming area, and rice is cultivated during the rainy season, and drought-tolerant crops such as cassava and sugarcane are cultivated during the dry season. Northern Thailand is a mountainous area, and several kinds of vegetables such as cabbage are cultivated. The system clarifies the influence of the climatic change by showing the change of appropriate crop and area for cultivation.
The system employs the software program DSSAT (Decision Support System for Agrotechnology Transfer; Jones 1998, 2003, DSSAT 2004) to simulate the growth of crops, because it provides modules for major crops and is used frequently in Thailand. And, to do an accurate simulation, crop variety parameters, experiment data and soil data of the target area besides meteorological data (air temperature, precipitation and solar radiation) are necessary.
2. Collection of Data and Parameters
The DSSAT simulates phenology and growth processes including the nitrogen requirement, soil, climate, and management conditions for a specific environment. Therefore, parameter files such as species (SPE), cultivar (CUL), and ecotype (ECO), and experiment (X) are required to execute DSSAT. These data and parameters of DSSAT for the chosen areas in Thailand were collected under cooperation with researchers who have networks in Thailand.
Cultivar data include coefficient of genetic information of a plant. The data of five varieties of rice (KDML105, NIEW SANPATONG, SUPANBURI60, CHAINAT1, and DOA1) and six varieties of cassava (RY1, RY90, RY5, KU50, RY3, and RY72) were collected from the research reports (TRF 2009, Felkner et al. 2008). These data were validated using weather data from ECHAM4-PRECIS climate models, crop management data recommended by the Ministry of Agriculture and Cooperatives, and field data (Fig 1.).
Soil data include soil name, pH, drainage, texture, organic matter. This data were provided by Soil Survey and Natural Resource in Soil Division, Land Development Department (LDD) (Fig. 2). Moreover, the soil data can be obtained from the WISE soil data base (Batjes 1995, 2002) of the International Soil Reference and Information Centre (ISRIC) in Wageningen. The soil data base IDs of Khon Kaen is WI_ACTH049, 050, and IDs of Chiang Mai is WI_GLTH016, 017, 018.
Fertilizer data is a part of the experiment data, and influences crop yield. These data of Khon Kaen and Chiang Mai from 2002 to 2014 were provided by Agricultural Information center, Office of Agricultural Economics.
Yield data and crop calendar are used to validate the result data of a crop model such as yield and cultivation period. Based on the validation result, the parameters are modified. These data from 2003 to 2014 were provided by Khon Kaen and Chiang Mai Rice Research center, Bureau of Rice Research and Development (BRRD).
Weather data is indispensable data to crop model execution. The past data are used to validate the crop model with
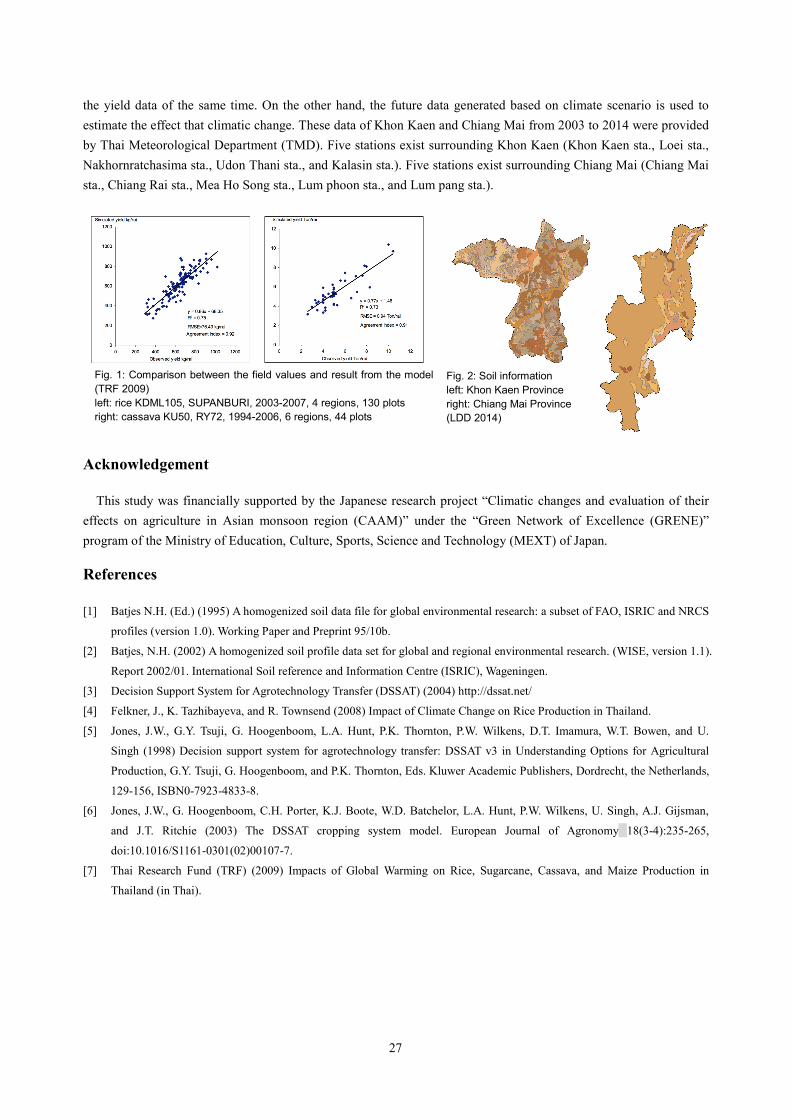
27
the yield data of the same time. On the other hand, the future data generated based on climate scenario is used to estimate the effect that climatic change. These data of Khon Kaen and Chiang Mai from 2003 to 2014 were provided by Thai Meteorological Department (TMD). Five stations exist surrounding Khon Kaen (Khon Kaen sta., Loei sta., Nakhornratchasima sta., Udon Thani sta., and Kalasin sta.). Five stations exist surrounding Chiang Mai (Chiang Mai sta., Chiang Rai sta., Mea Ho Song sta., Lum phoon sta., and Lum pang sta.).
Acknowledgement
This study was financially supported by the Japanese research project “Climatic changes and evaluation of their effects on agriculture in Asian monsoon region (CAAM)” under the “Green Network of Excellence (GRENE)” program of the Ministry of Education, Culture, Sports, Science and Technology (MEXT) of Japan.
References
Batjes N.H. (Ed.) (1995) A homogenized soil data file for global environmental research: a subset of FAO, ISRIC and NRCS [1]
profiles (version 1.0). Working Paper and Preprint 95/10b.
Batjes, N.H. (2002) A homogenized soil profile data set for global and regional environmental research. (WISE, version 1.1). [2]
Report 2002/01. International Soil reference and Information Centre (ISRIC), Wageningen.
Decision Support System for Agrotechnology Transfer (DSSAT) (2004) http://dssat.net/ [3]
Felkner, J., K. Tazhibayeva, and R. Townsend (2008) Impact of Climate Change on Rice Production in Thailand. [4]
Jones, J.W., G.Y. Tsuji, G. Hoogenboom, L.A. Hunt, P.K. Thornton, P.W. Wilkens, D.T. Imamura, W.T. Bowen, and U. [5]
Singh (1998) Decision support system for agrotechnology transfer: DSSAT v3 in Understanding Options for Agricultural
Production, G.Y. Tsuji, G. Hoogenboom, and P.K. Thornton, Eds. Kluwer Academic Publishers, Dordrecht, the Netherlands,
129-156, ISBN0-7923-4833-8.
Jones, J.W., G. Hoogenboom, C.H. Porter, K.J. Boote, W.D. Batchelor, L.A. Hunt, P.W. Wilkens, U. Singh, A.J. Gijsman, [6]
and J.T. Ritchie (2003) The DSSAT cropping system model. European Journal of Agronomy 18(3-4):235-265,
doi:10.1016/S1161-0301(02)00107-7.
Thai Research Fund (TRF) (2009) Impacts of Global Warming on Rice, Sugarcane, Cassava, and Maize Production in [7]
Thailand (in Thai).
Fig. 2: Soil information left: Khon Kaen Province right: Chiang Mai Province (LDD 2014)
Fig. 1: Comparison between the field values and result from the model (TRF 2009) left: rice KDML105, SUPANBURI, 2003-2007, 4 regions, 130 plots right: cassava KU50, RY72, 1994-2006, 6 regions, 44 plots

28
Coping with Climate Change in Northeast Thailand:
A new three cropping practices using Cassava
Mallika Srisutham1, Masaru Mizoguchi2 and Anan Polthanee1 1Khon Kaen University, 2Universitty of Tokyo
Email: [email protected]
Abstract
One-third populations in the northeast Thailand are engage in agriculture. However, most of the
agricultural lands (80%) in this region are carried out under rainfed conditions, with poor soils and defined
as sandy in texture. In general, rice has been grown as a major crop in the rainy season (May-Oct) for
consumption, and excess for sale to generate household income. In the past, rice-based cropping systems
such as rice-peanut double cropping can be practices in rainfed rice land by the farmers. Recently, this
double cropping system disappeared due to climate change; temperature increased in the winter season,
low rainfall amount and rainfall stop early at the end of rainy season. Cassava, a drought tolerance is
potential crop to grow for coping with climate change in this region. Three cropping practices as; (1)
cassava grow after rice harvest as a second crop in November for short duration within 6-7 months, (2)
cassava grow replaced rice in September-October when rice unable to survive due to insufficient of water
supply by rainfall at the end for rainy season, and (3) cassava grow in October instead of left the paddy
fields due to drought condition in some year. These cropping practices using cassava have been proved to
be an effective adaptation and mitigation strategies against climate change in the northeast Thailand.
29
Mapping rice paddy intensities using MODIS, Landsat 8OLI and Field IP camera
Uday Pimple1, Asamaporn Sitthi1, Wataru Takeuchi2,Sirintornthep Towprayoon1, Kazunori
MINAMIKAWA3
1The Joint Graduate School of Energy and Environment King Mongkuts University of Technology Thonburi,
126 Prachauthit Rd, Bangmod, Tungkru, Bangkok, Thailand 2Institute of Industrial Science, The University of Tokyo
Ce-505, 6-1, Komaba 4-chome, Meguro, Tokyo 153-8505, Japan 3National Institute for Agro-Environmental Sciences
Carbon and Nutrient Cycles Division 3-1-3 Kannondai, Tsukuba, 305-8604, JAPAN
Corresponding author: [email protected], [email protected]
Keywords: Rice Paddy, MODIS, IP camera, Landsat 8 OLI, vegetation indices, digital photographs
In Southeast Asia, the regional rice paddy intensity mapping based on optical remotely sensed data suffers from the limited ground observation for validation. We evaluated the satellite based rice paddy characterized by an initial period of flooding and transplanting. The main objective of this study was to obtain rice intensity maps using multi-temporal images of Moderate Resolution Imaging Spectroradiometer (MODIS) and Landsat at selected sites in Thailand and validate using digital repeat photography. However, the digital photographs cannot be directly compared with satellite based rice intensity maps that require information about rice paddy properties at green and near infrared (NIR) wavelengths. Here, we develop a new approach, using IP camera photographs to validate the existing rice intensity maps. We evaluated the quality if MODIS based rice paddy map with the situ data obtained from IP camera. Our analysis shows that the vegetation indices (VI) obtained from digital photographs is almost identical to that VI measured by MODIS and Landsat platform. In addition to validating rice paddy intensity maps, our method should be useful for a variety of applications, including continuous monitoring of phenological cycle, flooding duration on reginal scale.
30
CH4 emission from future irrigated rice paddies in central Thailand under different water management practices
Kazunori Minamikawa1, Tamon Fumoto1, Toshichika Iizumi1, Nittaya Cha-un2, Uday Pimple2, Motoki
Nishimori1, Yasushi Ishigooka1, Tsuneo Kuwagata1 1 National Institute for Agro-Environmental Sciences, Tsukuba, Japan
2 The Joint Graduate School of Energy and Environment, Centre of Excellence on Energy Technology and Environment, King Mongkut's University of Technology Thonburi, Bangkok, Thailand
[email protected] (K.M.) Keywords: DNDC-Rice, Global climate model, Intermittent irrigation, Midseason drainage, Regional climate downscaling, Representative concentration pathways 1. Introduction
Rice cultivation is one of the major anthropogenic sources of atmospheric methane (CH4). Future climate, increasing atmospheric CO2 concentration ([CO2]) and rising air temperature may accelerate CH4 emission from rice paddies[1]. We hypothesize that an appropriate water management practice can negate the accelerated CH4 emission from irrigated rice paddies under future climate. The objective of the present study was to test the above-mentioned hypothesis. We used a process-based biogeochemistry model, DNDC-Rice[2] to project the future CH4 emission from irrigated rice paddies in the central region of Thailand under different water management practices. 2. Methods
First, we adjusted the model using observation data at six experimental sites located in central Thailand (Fig. 1). Then, we simulated CH4 emission at each site during the period of 2001-2060 under different climate scenarios that were generated by a regional downscaling[3] from selected seven GCMs under four RCPs.
We set three scenarios on water management practices common to the six sites: continuous flooding (CF), single aeration (SA), and multiple aeration (MA). For each site, we assumed a rice-rice double cropping with the application of harvested straw, with the fixed crop calendar during the period. 3. Results and discussion
The model adjusted with the observed dates of rice heading and maturation at each site well reproduced the observed rice grain yield and CH4 emission. Although there were a few outliers, we concluded that the model adjusted for each site is capable for the subsequent long-term simulation.
The effect of water management on CH4 emission mitigation was persistent through the simulated years (Fig. 2). CH4 emission was gradually enhanced with the future time course, and the degree of which was dependent on RCPs.
The regional mean mitigation potential of CH4 emission by SA and MA relative to CF was comparable among four RCPs and between the current and future decades (Fig. 3). Regardless of RCPs and dates, the mitigation potential by SA and MA was estimated to be 22-23% and 53-55%, respectively. IPCC[4] has adopted 0.60 (error range: 0.46-0.80) and 0.52 (0.41-0.66) as the scaling factor of water management for SA and MA, respectively. Our results of the regional mitigation potential by SA and MA were within the ranges. References [1] Van Groenigen KJ, Van Kessel C, Hungate BA (2013) Increased greenhouse-gas intensity of rice production under future
atmospheric conditions. Nature Climate Change, 3: 288-291. [2] Fumoto T, Kobayashi K, Li C, Yagi K, Hasegawa T (2008) Revising a process-based biogeochemistry model (DNDC) to
simulate methane emission from rice paddy fields under various residue management and fertilizer regimes. Global Change Biology, 14: 382-402.
[3] Iizumi T, Okada M, Yokozawza M (2014) A meteorological forcing data set for global crop modeling: Development, evaluation, and intercomparison. Journal of Geophysical Research: Atmospheres, 119: 363-384.
[4] 2006 IPCC Guidelines for National Greenhouse Gas Inventories (2006) http://www.ipcc-nggip.iges.or.jp/public/2006gl/pdf/4_Volume4/V4_05_Ch5_Cropland.pdf
Fig. 1
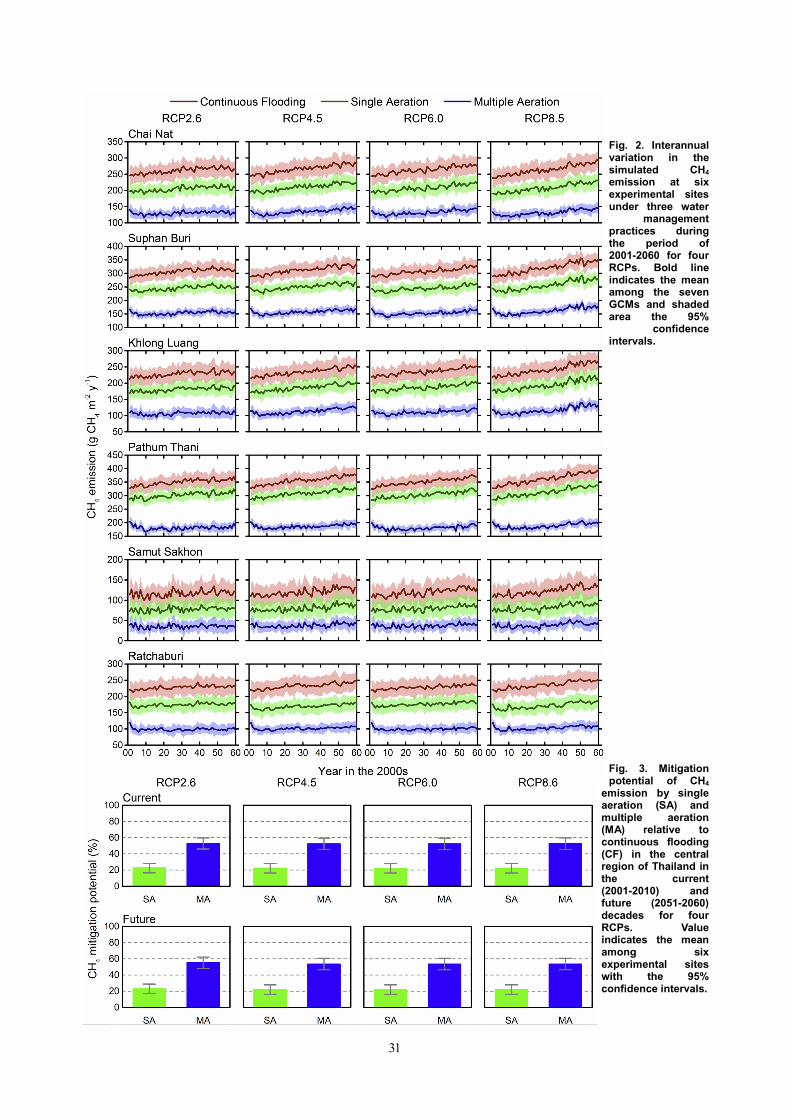
31
Fig. 2. Interannual variation in the simulated CH4 emission at six experimental sites under three water
management practices during the period of 2001-2060 for four RCPs. Bold line indicates the mean among the seven GCMs and shaded area the 95%
confidence intervals.
Fig. 3. Mitigation potential of CH4
emission by single aeration (SA) and multiple aeration (MA) relative to continuous flooding (CF) in the central region of Thailand in the current (2001-2010) and future (2051-2060) decades for four RCPs. Value indicates the mean among six experimental sites with the 95% confidence intervals.
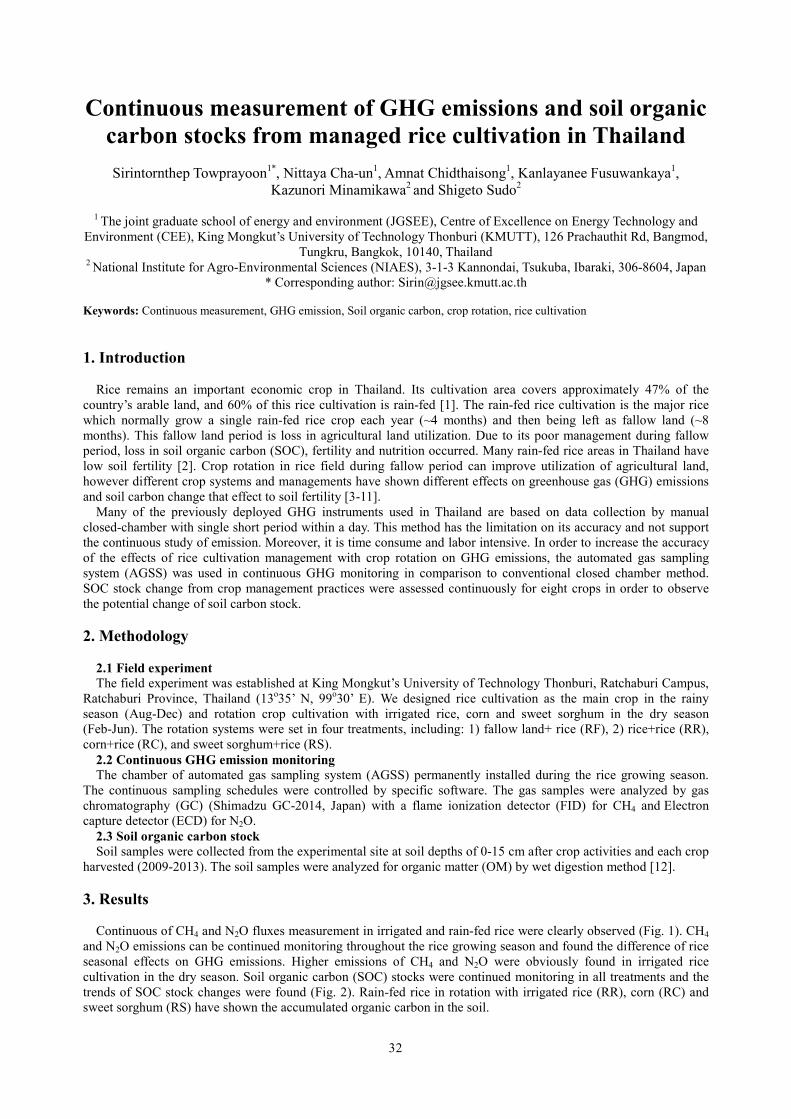
32
Continuous measurement of GHG emissions and soil organic carbon stocks from managed rice cultivation in Thailand
Sirintornthep Towprayoon1*, Nittaya Cha-un1, Amnat Chidthaisong1, Kanlayanee Fusuwankaya1,
Kazunori Minamikawa2 and Shigeto Sudo2
1 The joint graduate school of energy and environment (JGSEE), Centre of Excellence on Energy Technology and Environment (CEE), King Mongkut’s University of Technology Thonburi (KMUTT), 126 Prachauthit Rd, Bangmod,
Tungkru, Bangkok, 10140, Thailand 2 National Institute for Agro-Environmental Sciences (NIAES), 3-1-3 Kannondai, Tsukuba, Ibaraki, 306-8604, Japan
* Corresponding author: [email protected] Keywords: Continuous measurement, GHG emission, Soil organic carbon, crop rotation, rice cultivation 1. Introduction
Rice remains an important economic crop in Thailand. Its cultivation area covers approximately 47% of the country’s arable land, and 60% of this rice cultivation is rain-fed [1]. The rain-fed rice cultivation is the major rice which normally grow a single rain-fed rice crop each year (~4 months) and then being left as fallow land (~8 months). This fallow land period is loss in agricultural land utilization. Due to its poor management during fallow period, loss in soil organic carbon (SOC), fertility and nutrition occurred. Many rain-fed rice areas in Thailand have low soil fertility [2]. Crop rotation in rice field during fallow period can improve utilization of agricultural land, however different crop systems and managements have shown different effects on greenhouse gas (GHG) emissions and soil carbon change that effect to soil fertility [3-11].
Many of the previously deployed GHG instruments used in Thailand are based on data collection by manual closed-chamber with single short period within a day. This method has the limitation on its accuracy and not support the continuous study of emission. Moreover, it is time consume and labor intensive. In order to increase the accuracy of the effects of rice cultivation management with crop rotation on GHG emissions, the automated gas sampling system (AGSS) was used in continuous GHG monitoring in comparison to conventional closed chamber method. SOC stock change from crop management practices were assessed continuously for eight crops in order to observe the potential change of soil carbon stock. 2. Methodology
2.1 Field experiment The field experiment was established at King Mongkut’s University of Technology Thonburi, Ratchaburi Campus,
Ratchaburi Province, Thailand (13o35’ N, 99o30’ E). We designed rice cultivation as the main crop in the rainy season (Aug-Dec) and rotation crop cultivation with irrigated rice, corn and sweet sorghum in the dry season (Feb-Jun). The rotation systems were set in four treatments, including: 1) fallow land+ rice (RF), 2) rice+rice (RR), corn+rice (RC), and sweet sorghum+rice (RS).
2.2 Continuous GHG emission monitoring The chamber of automated gas sampling system (AGSS) permanently installed during the rice growing season.
The continuous sampling schedules were controlled by specific software. The gas samples were analyzed by gas chromatography (GC) (Shimadzu GC-2014, Japan) with a flame ionization detector (FID) for CH4 and Electron capture detector (ECD) for N2O.
2.3 Soil organic carbon stock Soil samples were collected from the experimental site at soil depths of 0-15 cm after crop activities and each crop
harvested (2009-2013). The soil samples were analyzed for organic matter (OM) by wet digestion method [12].
3. Results
Continuous of CH4 and N2O fluxes measurement in irrigated and rain-fed rice were clearly observed (Fig. 1). CH4 and N2O emissions can be continued monitoring throughout the rice growing season and found the difference of rice seasonal effects on GHG emissions. Higher emissions of CH4 and N2O were obviously found in irrigated rice cultivation in the dry season. Soil organic carbon (SOC) stocks were continued monitoring in all treatments and the trends of SOC stock changes were found (Fig. 2). Rain-fed rice in rotation with irrigated rice (RR), corn (RC) and sweet sorghum (RS) have shown the accumulated organic carbon in the soil.
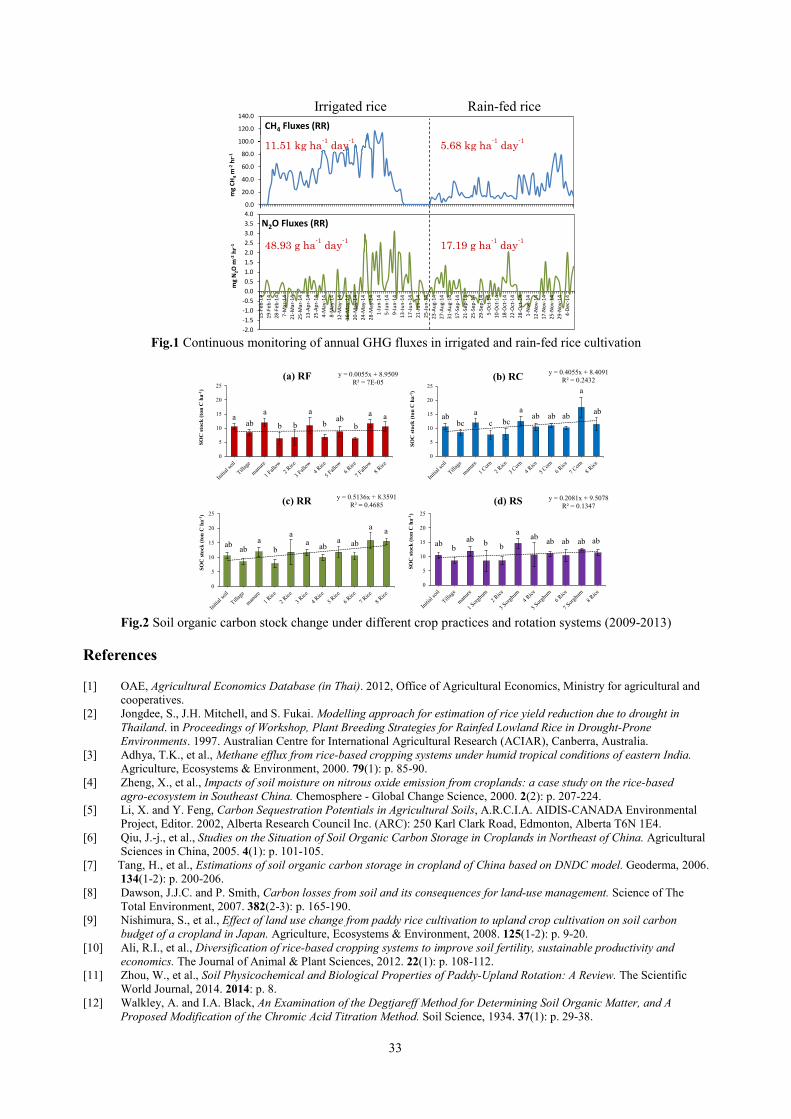
33
Fig.1 Continuous monitoring of annual GHG fluxes in irrigated and rain-fed rice cultivation
Fig.2 Soil organic carbon stock change under different crop practices and rotation systems (2009-2013)
References
[1] OAE, Agricultural Economics Database (in Thai). 2012, Office of Agricultural Economics, Ministry for agricultural and
cooperatives. [2] Jongdee, S., J.H. Mitchell, and S. Fukai. Modelling approach for estimation of rice yield reduction due to drought in
Thailand. in Proceedings of Workshop, Plant Breeding Strategies for Rainfed Lowland Rice in Drought-Prone Environments. 1997. Australian Centre for International Agricultural Research (ACIAR), Canberra, Australia.
[3] Adhya, T.K., et al., Methane efflux from rice-based cropping systems under humid tropical conditions of eastern India. Agriculture, Ecosystems & Environment, 2000. 79(1): p. 85-90.
[4] Zheng, X., et al., Impacts of soil moisture on nitrous oxide emission from croplands: a case study on the rice-based agro-ecosystem in Southeast China. Chemosphere - Global Change Science, 2000. 2(2): p. 207-224.
[5] Li, X. and Y. Feng, Carbon Sequestration Potentials in Agricultural Soils, A.R.C.I.A. AIDIS-CANADA Environmental Project, Editor. 2002, Alberta Research Council Inc. (ARC): 250 Karl Clark Road, Edmonton, Alberta T6N 1E4.
[6] Qiu, J.-j., et al., Studies on the Situation of Soil Organic Carbon Storage in Croplands in Northeast of China. Agricultural Sciences in China, 2005. 4(1): p. 101-105.
[7] Tang, H., et al., Estimations of soil organic carbon storage in cropland of China based on DNDC model. Geoderma, 2006. 134(1-2): p. 200-206.
[8] Dawson, J.J.C. and P. Smith, Carbon losses from soil and its consequences for land-use management. Science of The Total Environment, 2007. 382(2-3): p. 165-190.
[9] Nishimura, S., et al., Effect of land use change from paddy rice cultivation to upland crop cultivation on soil carbon budget of a cropland in Japan. Agriculture, Ecosystems & Environment, 2008. 125(1-2): p. 9-20.
[10] Ali, R.I., et al., Diversification of rice-based cropping systems to improve soil fertility, sustainable productivity and economics. The Journal of Animal & Plant Sciences, 2012. 22(1): p. 108-112.
[11] Zhou, W., et al., Soil Physicochemical and Biological Properties of Paddy-Upland Rotation: A Review. The Scientific World Journal, 2014. 2014: p. 8.
[12] Walkley, A. and I.A. Black, An Examination of the Degtjareff Method for Determining Soil Organic Matter, and A Proposed Modification of the Chromic Acid Titration Method. Soil Science, 1934. 37(1): p. 29-38.
y = 0.0055x + 8.9509R² = 7E-05
0
5
10
15
20
25
SOC
stoc
k (t
on C
ha-1
)
(a) RF y = 0.4055x + 8.4091R² = 0.2432
0
5
10
15
20
25
SOC
stoc
k (t
on C
ha-1
)
(b) RC
y = 0.5136x + 8.3591R² = 0.4685
0
5
10
15
20
25
SOC
stoc
k (t
on C
ha-1
)
(c) RR y = 0.2081x + 9.5078R² = 0.1347
0
5
10
15
20
25
SOC
stoc
k (t
on C
ha-1
)
(d) RS
aab
a
b b
ab ab
b
ab aba
b
aa ab
a ab
abbc
ac bc
aab ab ab
ab bab b b
a ab ab ab
a a
a
ab
a aab ab
Rain-fed rice
-20.0
0.0
20.0
40.0
60.0
80.0
100.0
120.0
140.0
15-F
eb-1
419
-Feb
-14
28-F
eb-1
47-
Mar
-14
21-M
ar-1
425
-Mar
-14
13-A
pr-1
425
-Apr
-14
4-M
ay-1
48-
May
-14
12-M
ay-1
416
-May
-14
20-M
ay-1
424
-May
-14
28-M
ay-1
41-
Jun-
145-
Jun-
149-
Jun-
1413
-Jun-
1417
-Jun-
1421
-Jun-
1425
-Jun-
1423
-Aug
-14
27-A
ug-1
431
-Aug
-14
17-S
ep-1
421
-Sep
-14
25-S
ep-1
429
-Sep
-14
5-O
ct-1
410
-Oct
-14
18-O
ct-1
422
-Oct
-14
28-O
ct-1
41-
Nov
-14
12-N
ov-1
417
-Nov
-14
25-N
ov-1
429
-Nov
-14
4-De
c-14
mg
CH4
m-2
hr-1
CH4 Fluxes (RR)
-2.0-1.5-1.0-0.50.00.51.01.52.02.53.03.54.0
15-F
eb-1
419
-Feb
-14
28-F
eb-1
47-
Mar
-14
21-M
ar-1
425
-Mar
-14
13-A
pr-1
425
-Apr
-14
4-M
ay-1
48-
May
-14
12-M
ay-1
416
-May
-14
20-M
ay-1
424
-May
-14
28-M
ay-1
41-
Jun-
145-
Jun-
149-
Jun-
1413
-Jun-
1417
-Jun-
1421
-Jun-
1425
-Jun-
1423
-Aug
-14
27-A
ug-1
431
-Aug
-14
17-S
ep-1
421
-Sep
-14
25-S
ep-1
429
-Sep
-14
5-O
ct-1
410
-Oct
-14
18-O
ct-1
422
-Oct
-14
28-O
ct-1
41-
Nov
-14
12-N
ov-1
417
-Nov
-14
25-N
ov-1
429
-Nov
-14
4-De
c-14
mg
N2O
m-2
hr-1
N2O Fluxes (RR)
11.51 kg ha-1 day-1 5.68 kg ha-1 day-1
48.93 g ha-1 day-1 17.19 g ha-1 day-1
Irrigated rice
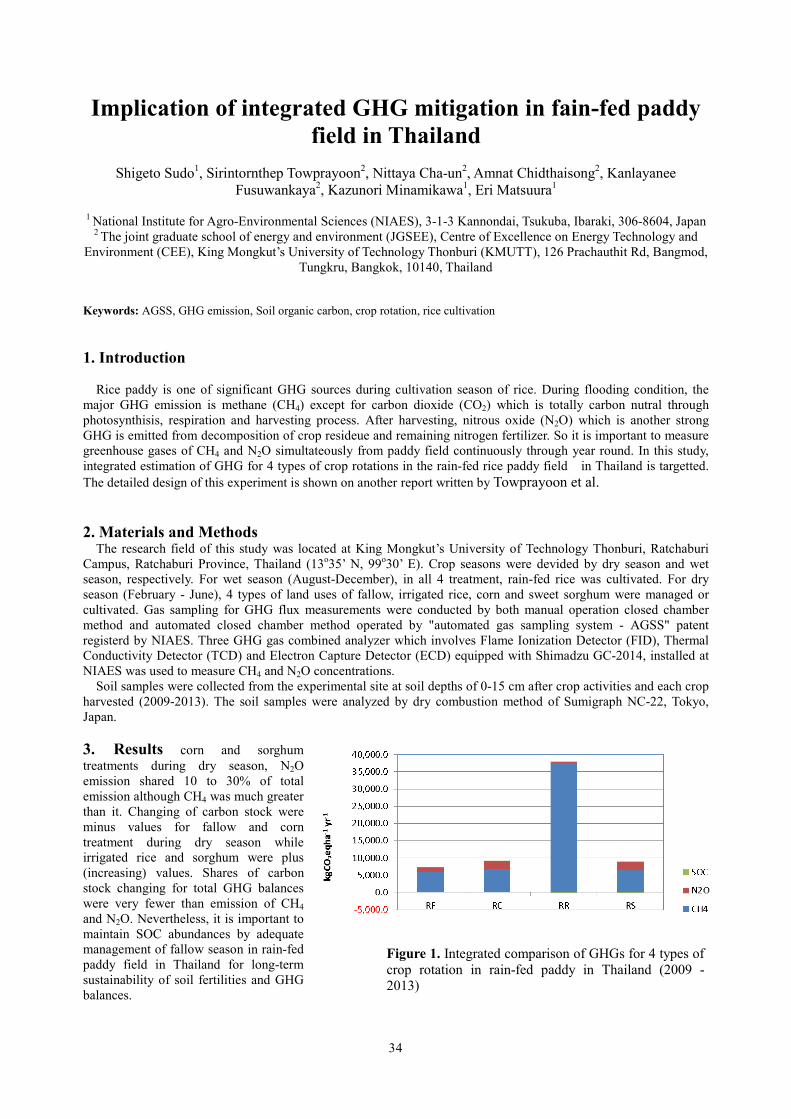
34
Implication of integrated GHG mitigation in fain-fed paddy field in Thailand
Shigeto Sudo1, Sirintornthep Towprayoon2, Nittaya Cha-un2, Amnat Chidthaisong2, Kanlayanee
Fusuwankaya2, Kazunori Minamikawa1, Eri Matsuura1
1 National Institute for Agro-Environmental Sciences (NIAES), 3-1-3 Kannondai, Tsukuba, Ibaraki, 306-8604, Japan 2 The joint graduate school of energy and environment (JGSEE), Centre of Excellence on Energy Technology and
Environment (CEE), King Mongkut’s University of Technology Thonburi (KMUTT), 126 Prachauthit Rd, Bangmod, Tungkru, Bangkok, 10140, Thailand
Keywords: AGSS, GHG emission, Soil organic carbon, crop rotation, rice cultivation 1. Introduction
Rice paddy is one of significant GHG sources during cultivation season of rice. During flooding condition, the major GHG emission is methane (CH4) except for carbon dioxide (CO2) which is totally carbon nutral through photosynthisis, respiration and harvesting process. After harvesting, nitrous oxide (N2O) which is another strong GHG is emitted from decomposition of crop resideue and remaining nitrogen fertilizer. So it is important to measure greenhouse gases of CH4 and N2O simultateously from paddy field continuously through year round. In this study, integrated estimation of GHG for 4 types of crop rotations in the rain-fed rice paddy field in Thailand is targetted. The detailed design of this experiment is shown on another report written by Towprayoon et al.
2. Materials and Methods The research field of this study was located at King Mongkut’s University of Technology Thonburi, Ratchaburi
Campus, Ratchaburi Province, Thailand (13o35’ N, 99o30’ E). Crop seasons were devided by dry season and wet season, respectively. For wet season (August-December), in all 4 treatment, rain-fed rice was cultivated. For dry season (February - June), 4 types of land uses of fallow, irrigated rice, corn and sweet sorghum were managed or cultivated. Gas sampling for GHG flux measurements were conducted by both manual operation closed chamber method and automated closed chamber method operated by "automated gas sampling system - AGSS" patent registerd by NIAES. Three GHG gas combined analyzer which involves Flame Ionization Detector (FID), Thermal Conductivity Detector (TCD) and Electron Capture Detector (ECD) equipped with Shimadzu GC-2014, installed at NIAES was used to measure CH4 and N2O concentrations.
Soil samples were collected from the experimental site at soil depths of 0-15 cm after crop activities and each crop harvested (2009-2013). The soil samples were analyzed by dry combustion method of Sumigraph NC-22, Tokyo, Japan.
3. Results corn and sorghum treatments during dry season, N2O emission shared 10 to 30% of total emission although CH4 was much greater than it. Changing of carbon stock were minus values for fallow and corn treatment during dry season while irrigated rice and sorghum were plus (increasing) values. Shares of carbon stock changing for total GHG balances were very fewer than emission of CH4 and N2O. Nevertheless, it is important to maintain SOC abundances by adequate management of fallow season in rain-fed paddy field in Thailand for long-term sustainability of soil fertilities and GHG balances.
Figure 1. Integrated comparison of GHGs for 4 types of crop rotation in rain-fed paddy in Thailand (2009 - 2013)

35
Determining Optimal Planting Calendar Based on Field Monitored Data in Saba Watershed, Bali Indonesia
Chusnul Arif1, Budi Indra Setiawan1, Satyanto K Saptomo1, Yudi Chadirin1, I Wayan Budiasa2, Hisaaki
Kato3, Jumpei Kubota3, Masaru Mizoguchi4 1Dept of Civil and Environmental Engineering, Bogor Agricultural University
2Faculty of Agriculture, Udayana University 3Research Institute for Humanity and Nature
4Dept of Global Agriculture, The University of Tokyo Kampus IPB Damarga, Bogor, Indonesia Email: [email protected]
Keywords: Field Monitoring System, Paddy Fields, Plant Water Requirement, Planting Calendar, Saba Watershed 1. Introduction
Saba watershed, located in northern part of Bali Province, Indonesia, has facing problem of water availability due to climate change impact. It was indicated by changing rain patterns in which increasing rain intensity with shorted period in wet season and longer dry season event. As consequence, it was difficult to determine optimal planting calendar to prevent drought in dry season and flooded in wet season. Therefore, suitable mitigation and adaptation strategy is urgent addressing the problem.
The current study propose developing field monitoring system in field scale to provide the data that will be used to determine optimal planting calendar in the context of climate change. The main objective is to develop suitable method to determine optimal planting calendar based on field monitored data. 2. Methodology 1) Field Observation: Saba Watershed
Saba Watershed is located in the geographical coordinates of 114o 55’ 13.08” East to 115o 7’ 7.68” East and from 8o 10’ 50.16” South to 8o 20’ 5.64” South. The area of the watershed is about 140.19 km2 with the highest altitude about 5000 m from the mean sea level. A part of the watershed belongs to Buleleng Regency (78%) and the other part belongs to Tabanan Regency (22%). In Buleleng Regency, there are 5 districts located in the watershed which are 1) Banjar, 2) Busungbiu, 3) Seririt, 4) Sukasada, while in Tabanan Regency, there is only one district called 5) Pupuan District. 2) Field Monitoring System
Climate conditions in the watershed were assessed based on intensive measurements using automatic weather station and soil sensors. These instruments were installed in three locations inside farmlands each representing upstream (Umejero Village), midstream (Titab Village) and downstream (Lokapaksa Village) (Figure 1). Since 2013 three sets of field monitoring system were installed in paddy fields as well as automatic weather station in three different locations, which are upstream, midstream and downstream [1]. Weather parameters were collected using AWS that consisted of some sensors including rain gauge, pyranometer, temperature and humidity sensors, wind speed and direction sensor (anemometer). Meanwhile, soil physics parameters as well as water table were measured using data loggers consisted of soil moisture, soil temperature, soil electrical conductivity, water depth, soil matrix potential sensors. There were three layers soil measurement i.e., 5 cm, 10 and 30 cm of soil depth. All data were stored using Em50 data-logger and the Console for soil and weather measurements, respectively. Then all data were collected by FieldRouter and send to the server daily as well as field image data. 3) Data Analysis
Based on field monitored data, cumulative rainfall and evapotranspiration were fitted by polynomial equation [2], then they rate were defined as first derivative of those equations. The onset of dry season is started when the rate of evapotranspiration is higher than that rainfall. Then, it will be end when the rate of evapotranspiration is lower than that rainfall. The first planting calendar is initiated in the onset of wet season.
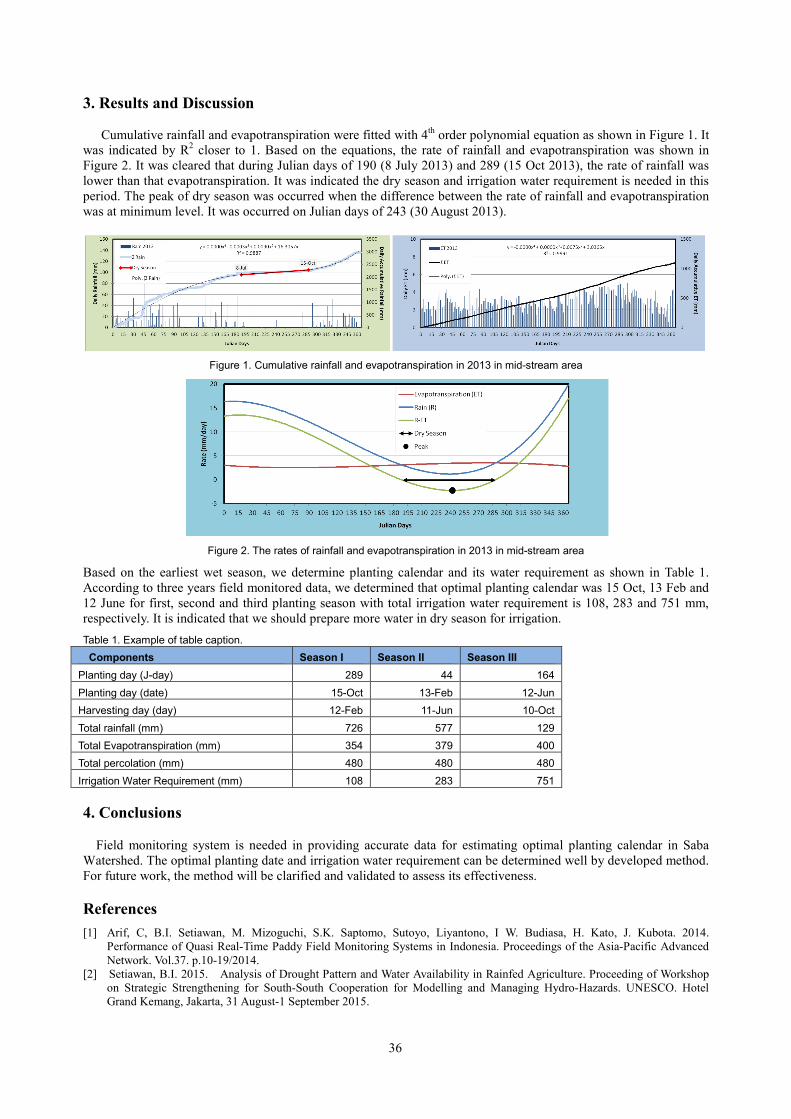
36
3. Results and Discussion
Cumulative rainfall and evapotranspiration were fitted with 4th order polynomial equation as shown in Figure 1. It was indicated by R2 closer to 1. Based on the equations, the rate of rainfall and evapotranspiration was shown in Figure 2. It was cleared that during Julian days of 190 (8 July 2013) and 289 (15 Oct 2013), the rate of rainfall was lower than that evapotranspiration. It was indicated the dry season and irrigation water requirement is needed in this period. The peak of dry season was occurred when the difference between the rate of rainfall and evapotranspiration was at minimum level. It was occurred on Julian days of 243 (30 August 2013).
Figure 1. Cumulative rainfall and evapotranspiration in 2013 in mid-stream area
Figure 2. The rates of rainfall and evapotranspiration in 2013 in mid-stream area
Based on the earliest wet season, we determine planting calendar and its water requirement as shown in Table 1. According to three years field monitored data, we determined that optimal planting calendar was 15 Oct, 13 Feb and 12 June for first, second and third planting season with total irrigation water requirement is 108, 283 and 751 mm, respectively. It is indicated that we should prepare more water in dry season for irrigation. Table 1. Example of table caption. Components Season I Season II Season III
Planting day (J-day) 289 44 164 Planting day (date) 15-Oct 13-Feb 12-Jun Harvesting day (day) 12-Feb 11-Jun 10-Oct Total rainfall (mm) 726 577 129 Total Evapotranspiration (mm) 354 379 400 Total percolation (mm) 480 480 480 Irrigation Water Requirement (mm) 108 283 751 4. Conclusions
Field monitoring system is needed in providing accurate data for estimating optimal planting calendar in Saba Watershed. The optimal planting date and irrigation water requirement can be determined well by developed method. For future work, the method will be clarified and validated to assess its effectiveness. References [1] Arif, C, B.I. Setiawan, M. Mizoguchi, S.K. Saptomo, Sutoyo, Liyantono, I W. Budiasa, H. Kato, J. Kubota. 2014.
Performance of Quasi Real-Time Paddy Field Monitoring Systems in Indonesia. Proceedings of the Asia-Pacific Advanced Network. Vol.37. p.10-19/2014.
[2] Setiawan, B.I. 2015. Analysis of Drought Pattern and Water Availability in Rainfed Agriculture. Proceeding of Workshop on Strategic Strengthening for South-South Cooperation for Modelling and Managing Hydro-Hazards. UNESCO. Hotel Grand Kemang, Jakarta, 31 August-1 September 2015.

37
Low-Cost Water Level Monitoring System for Paddy Field
Tien Cao-hoang College of Rural Development,
Can Tho University, Can Tho, Vietnam [email protected]
Keywords: Water level monitoring system, ultrasonic sensor, Raspberry Pi. 1. Introduction
Water level is one of the most important elements in rice production. Water level information monitoring is also important in water management and decision making in precision agriculture. This article reports the design of automatic water level monitoring system for paddy field. The purpose of this project is to collect water level signal in real time. This system comprises of sensor, embedded computer, wireless protocol. An ultrasonic sensor – HC-SR04 [1] is used to measure the water level and provide it to embedded computer – Raspberry Pi [2]. A 3G USB modem connected to the embedded computer helps in transmitting data from the field to the web server where data are stored and visualized as graph. 2. System architecture 1) Components of system
Fig. 1 shows the architecture of water level monitoring system. The system consists of three main components: gateway, ultrasonic sensor and data server. The gateway is used to collect data from sensor and then send to server via GPRS protocol. It can also provide Wi-Fi protocol. Therefore, user can connect to the gateway via laptop and smart phone.
Fig. 1 Components of system. 2) Gateway
Fig. 2 shows gateway equipment, which consists of an embedded computer – Raspberry Pi, 3G USB modem, Wi-Fi modem (optional) and battery. Because the device is placed outside, it is power by solar power source (6w solar panel, 6V, 4.5mAh battery). User can connect to gateway by using laptop, smart phone via Wi-Fi connection to configure sampling time and check server connection status. Gateway sends data to server over 3G modem that is plugged into the Raspberry Pi which is a low-cost computer based module (39 USB per one). Raspberry Pi can only operate at 5 voltage, so battery power is converted to 5 voltage via a voltage converter board. Raspberry Pi has 40 function I/O pins such as power, analog, digital and some interface protocols: UART, I2C, SPI. These protocols are compatible to variety of sensors.
Ultrasonic sensor Solar panel
Gateway
Data Server
GPRS
WI-FI

38
Fig. 2 Gateway
3) Water level sensor - Ultrasonic sensor
In this study, water level sensor is HC-SR04 ultrasonic sensor that uses sonar to determine distance to an object. It can measure distance from 2 cm to 400 cm. Fig. 3 shows how to measure water level on the paddy field.
Fig. 3 Mesurement of water level.
Water level is calculated in Eq. (1). We need to measure Dr manually.
Dw = Dr − Ds (1)
4) Data server
Data server is developed basing on IBM Bluemix – a Cloud Platform that provides many services such as coding programs, storage, database, analytic, etc... It can help users develop and deploy an application very fast.
In this study, an application was built to receive data from gateway and store into a database. A website was also built to visualize data as graph and data are available to download. The website link is http://agrinode.mybluemix.net
3. Conclusions
In general, the system can work correctly. However, it has been testing to check the robustness of the system (power consumption, internet connection and data storage) and the accuracy of sensor. References [1] URL: Seeed Studio. Ultrasonic sensor. Available at: http://www.seeedstudio.com/depot/Grove-Ultrasonic-Ranger-p-
960.html [2] URL: Raspberry Pi Foundation. Raspberry Pi 2 model B. Available at: https://www.raspberrypi.org/products/raspberry-pi-2-
model-b/

39
FMS-based weather monitoring for local climate change adaptation for agriculture in the Philippines
Wilfredo A. Dumale, Jr.*, Fidel G. Patricio, Jr., and Florentina S. Dumlao
Nueva Vizcaya State University Bayombong, 3700 Nueva Vizcaya, Philippines
*corresponding author: [email protected]
1. Abstract
In a pioneering work in the Philippines, we now model a localized FMS-based weather monitoring network and highlighting the importance of partnership with local governments for climate change adaptation. Institutionalization of the research and anchoring it to the NVSU R and D agenda on climate change would ensure sustainability and funding in the years to come. 2. Highlight of accomplishments Partnership with local government units (LGUs) in the operation of field monitoring systems (FMS)
To ensure sustainability, Memorandum of agreements (MOA) between the Nueva Vizcaya State University (NVSU) and LGUs were formalized. Six weather monitoring zones in six municipalities were established – Bayombong, Kasibu, Santa Fe, Dupax del Sur, Kayapa, and Diadi. These strategic deployment of the FMS would ensure monitoring and capture of the local weather variability. Database management and data parsing
In order to organize the datasets obtained from the FMS, we have created a data parsing software designed for organizing and visualizing measured data from FMS sensors.
Fig. 1. Data transmission schema of the field monitoring system
Weather monitoring website
The project designed a weather monitoring website at http://fms.nvsu.edu.ph. This website allows multi-sectoral users to access FMS data, which include temperature, rainfall, humidity, wind speed and direction, solar radiation, among others. The website has two vital components: (1) Query window to view weather information; and (2) cropping calendar for major crops which compare the ideal weather requirements of the crop with the actual field data.
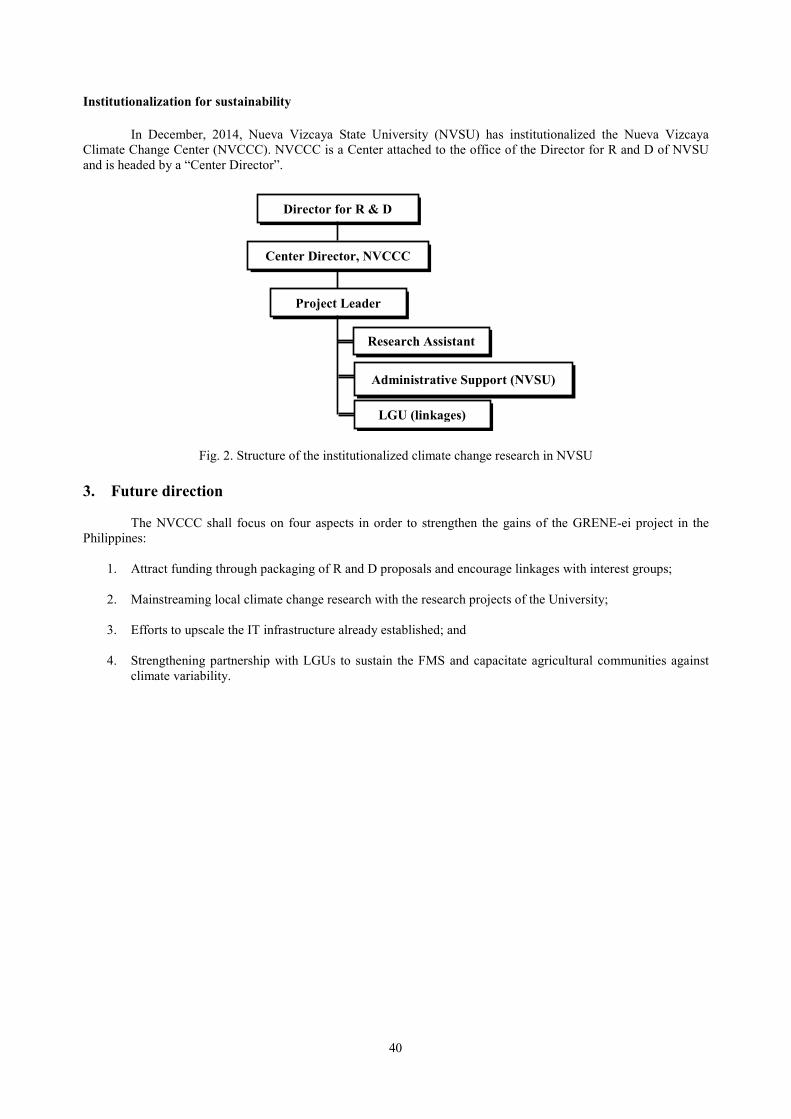
40
Institutionalization for sustainability
In December, 2014, Nueva Vizcaya State University (NVSU) has institutionalized the Nueva Vizcaya Climate Change Center (NVCCC). NVCCC is a Center attached to the office of the Director for R and D of NVSU and is headed by a “Center Director”.
Fig. 2. Structure of the institutionalized climate change research in NVSU
3. Future direction
The NVCCC shall focus on four aspects in order to strengthen the gains of the GRENE-ei project in the Philippines:
1. Attract funding through packaging of R and D proposals and encourage linkages with interest groups;
2. Mainstreaming local climate change research with the research projects of the University;
3. Efforts to upscale the IT infrastructure already established; and
4. Strengthening partnership with LGUs to sustain the FMS and capacitate agricultural communities against climate variability.
Director for R & D
Center Director, NVCCC
Project Leader
Research Assistant
Administrative Support (NVSU)
LGU (linkages)
41
Spatial Information Technology-Aided Inspection Chart Mapping and Its Potential as Management Tool to Climate Change Effects and Evaluation: The Case of NPC Major
Agroforestry & Reforestation Projects
Elmer T. Castañeto, Arvin P. Vallesteros & Jayson Q. Caranza
Nueva Vizcaya State University, Center for Environmental Resources Management and Sustainable Development Bayombong, Nueva Vizcaya 3700, Philippines
Abstract
Efficient watershed management is vital not only to support and sustain water-based electric power projects but has significant contribution to biodiversity and climate condition. The National Power Corporation (NPC) of the Philippines has been implementing watershed rehabilitation projects such as reforestation, agro-forestation and assisted natural regeneration in areas within their jurisdiction. NPC has adopted measures to validate the integrity of these projects and to determine the actual status of plantations through the intervention of other agencies. Hence, an Inspection Chart Mapping (ICM) of the Reforestation and Agroforestry Projects of NPC-Pantabangan-Carranglan Watershed Area Team in Pantabangan, Nueva Ecija and Magat Watershed Area Team in Ramon, Isabela, Philippines incorporating available spatial information technologies has been done by the Nueva Vizcaya State University- Center for Environmental Resources Management and Sustainable Development (CERMSD) primarily to establish adequate and verifiable ground control points for effective management and closer monitoring of the reforestation and agroforestry projects; assess and determine the overall status of the completed plantation projects through one hundred (100%) percent counting of seedlings planted; and establish permanent monitoring plots in order to assess the growth and development of the plants in varying locations and conditions. Inspection chart mapping (ICM) is a 100% inventory of planted trees. Its main feature is the use of chart where every planting space is drawn as square or rectangle depending on the spacing of planted trees. Presence or absence of trees or their conditions, as well as the condition of planting spots, are recorded in the chart. However, in rugged terrain, a common feature of all the project areas, ICM is difficult to perform. Modifications to the old ICM strategy has been introduced by CERMSD where the team makes use of freely available high-resolution Google Earth imageries (HRGEI) to assess land cover, locate non-plantable areas, delineate regions of interests, and evaluate existing maps. To enhance accuracy of ground measurements and observations, CERMSD fully employs Global Positioning System (GPS) and Geographic Information System (GIS) in field measurement and mapping needs. Such techniques include tracing of all recognizable points, lines or regions of interest from Google Earth image in order to come up with a detailed base map, GPS-guided charting, and mapping of topographical features such as contour and streams using digital elevation model. Improving the technology has gained to the following advantages: 1. High-resolution Google Earth image (HRGEI) allows quick assessment of land cover, amount of plantable areas and terrain, and mapping of visible features such as streams, roads, trails, cultivated areas; 2. GPS survey is fast and efficient, and points or regions of interest easily mapped; 3. HRGEI visual interpretation, DEM data and GPS reconnaissance survey allow creating detailed base maps; 4. GPS-guided charts allows relatively accurate positioning of transects in ICM chart; and 5. Each tree within permanent monitoring plot is geotagged. The enhanced ICM tool can be a very good field instrument for the following: a) field validation/evaluation of major watershed rehabilitation efforts; and b) health assessment / agricultural productivity assessment (survival, growth & development) of areas affected or experiencing climate change effects side by side with hydrometeorological monitoring. Keywords: Inspection Chart Mapping, Resource Monitoring, Resource Inventory, Spatial Information Technologies Acknowledgement We deeply acknowledge the assistance provided by the NPC Pantabangan-Carranglan Watershed Area Team & Magat Watershed Area Team, our field men and NVSU administrative personnel.

42
Application of PRECIS for Climate Change Projection A2 and A1B in Thailand
Boonlert Archevarahuprok1
1Meteorological Development Bureau, Thai Meteorological department, Thailand
[email protected] Abstract Climate Change and global warming is very interesting important issue which many country concerned and compose it to the national strategic plan. The climate change information is important for the society to protect their life support system which base on the ecology and the natural resources. In order to investigate climatic changes and their impact, the regional climate model PRECIS has been implemented on the LINUX operating system. The climate change projection is design for the period 1961 to 2100 with initial and boundary condition of GCM of climate change scenario A2 and A1B. The various climate results in the past, present and future are examined on spatial and temporal high resolution on daily, monthly, yearly, decadal, century and normal value in each time period. The normal value in each period trend is increasing especially in normal period year 2051 to 2080 about 4 degree Celsius. The specific location climate projection is increasing of extremely maximum and minimum temperature as past observation compared but precipitation are variation with none trend of increasing or decreasing. The results of the extreme minimum temperature from ECHAM4A2 show the best performance of the model when comparison to observation with correlation coefficient value is 0.66 and for extreme maximum temperature and precipitation from HADCM3Q0A1B is 0.52 and 0.30 respectively.

43
Abstracts of 5th GRENE-ei workshop
Date of issue: 1 March 2016 Edited by: E. Matsuura and T. Motokado
Issued by the secretariat of GRENE-ei workshop Funded by MEXT Japan

Member institutes Japan Agency for Marine-Earth Science and Technology
National Institute for Ago-Environmental Sciences University of Tokyo
Tokyo Metropolitan University National Agriculture and Food Research Organization