abundance and distribution of larval and juvenile fish in ... · frequency (every 2 d) time-series...
TRANSCRIPT
MARINE ECOLOGY PROGRESS SERIESMar Ecol Prog Ser
Vol. 305: 177–191, 2005 Published December 23
INTRODUCTION
Numerous species of marine fish spend a portion oftheir lives, often as larvae or juveniles, within estuaries(Elliott & Hemingway 2002). Some estuarine habitats,such as salt marsh and seagrass, play a vital role in theearly life history of some fish species, and the presenceof many other species in estuaries is well documented(Able & Fahay 1998, Beck et al. 2001). The specificrole, however, that estuaries play in species persis-tence is uncertain for many species. The current needfor precise definitions of ‘essential fish habitat’ as pre-scribed in the 1996 Magnuson-Stevens Fishery Con-servation and Management Act prompted Beck et al.(2001) to call on researchers to refine their definition of
‘nursery habitat’ and the experiments used to test thenursery function of estuaries, specifically in terms ofdensity, growth, survival, and movement to adult habi-tats.
The larvae and juveniles of numerous fish species(>20) are found in Pacific Northwest estuaries (Haertel& Osterberg 1967, Mistano 1977, Monaco et al. 1992).The region’s estuaries, however, are considered lessimportant in terms of fish production than otherregions, such as the Gulf of Mexico and the southeast-ern United States (Pearcy & Myers 1973, Haedrich1983, Boehlert & Mundy 1987). This is due, in part, tothe less extensive estuarine area along the west coastof the United States. Conclusions regarding estuarineuse, however, can be influenced by collection method.
© Inter-Research 2005 · www.int-res.com*Email: [email protected]
Abundance and distribution of larval and juvenilefish in Coos Bay, Oregon: time-series analysis
based on light-trap collections
Jessica A. Miller*, Alan L. Shanks
Oregon Institute of Marine Biology, University of Oregon, PO Box 5389, Charleston, Oregon 97420, USA
ABSTRACT: Recent interest in the role of estuaries as ‘essential fish habitat’ has led to more precisedefinitions and quantitative assessments of estuaries as nursery habitat. Although the larvae andjuveniles of >20 fish species are found in Pacific Northwest estuaries, information on their presencein and use of Oregon’s estuaries is scarce. The objectives of this study were to use a long-term timeseries (3.75 yr) of high-frequency (every 1–2 d) light-trap collections from Coos Bay, Oregon to doc-ument species diversity, compare intra- and interannual patterns of species abundance and size, andidentify potential wind- and/or tidally-driven transport mechanisms. Thirty-five taxa (28 species) oflarval and juvenile fish were identified. Five species consistently comprised >70% of the catch. Onaverage, the majority (94 ± 6% SD) of the catch at the most ocean-dominated site occurred during thedownwelling season (1 October to 31 May) with 15 to 62% of that catch collected during the springtransition (1 April to 31 May) when conditions shift from predominantly downwelling to upwellingconditions. Conversely, <1 km farther up estuary an average of 64 ± 12.7% SD of the catch occurredduring downwelling conditions with only 8% during the spring transition. Relative abundancepatterns indicate seasonal and spatial variation in estuarine use and potentially extended residenceperiods for some species. Time-series analyses indicate the presence of the larval and juvenile fishcollected in the estuary may have been primarily regulated by a combination of tidally-driven trans-port and reproductive timing with less evidence for wind-driven transport.
KEY WORDS: Larval and juvenile fish · Temperate estuary · Light traps
Resale or republication not permitted without written consent of the publisher
Mar Ecol Prog Ser 305: 177–191, 2005
For example, Pearcy & Myers (1973) concluded, aftercompleting a planktonic survey that identified 44 typesof larval fish in Yaquina Bay, Oregon, that the estuaryappeared to function as a nursery only for Pacific her-ring Clupea pallasi and a variety of small cottids, gob-ies, and stichaeids. They note that their planktonic sur-vey was not adequate to fully assess the estuary as anursery due to their sample bias toward weakly swim-ming organisms in the water column. Strong swim-mers, such as the surf perches (embiotocids), or ben-thic juveniles, such as the starry flounder Platichthysstellatus and English sole Parophrys vetulus, were notadequately sampled with plankton nets. Other re-search targeted larval and postlarval planktonic (Mis-tano 1977) or benthic fishes (Haertel & Osterberg 1967,Bottom et al. 1987). Since the 1970s, most regionalresearch has focused primarily on a few commerciallyimportant species, notably Pacific salmon Oncor-hynchus spp. (Healey 1982, Fisher & Pearcy 1990,Miller & Sadro 2003) and P. vetulus (Boehlert & Mundy1987). The information available for most species isinsufficient to estimate relative density, growth, or sur-vival as suggested by Beck et al. (2001) or identifyshifts in species composition, abundance, or habitatuse.
The coastal environment off Oregon is characterizedby seasonal variation in along- and cross-shore circula-tion patterns. During spring and summer, northwestwinds result in persistent upwelling and the establish-ment of an upwelling front where low-density, offshorewaters meet high-density, recently upwelled waters(Mooers et al. 1976). Late fall through early spring,winds are from the southwest, which promotes theshoreward movement and subsequent downwelling ofsurface waters. The spring transition, which is associ-ated with an increase in the frequency and intensity ofupwelling-favorable winds, typically occurs betweenmid-February and mid-May (Strub et al. 1987). The falltransition, which is less abrupt than the spring transi-tion, typically occurs between September and October(Strub & James 2000). Additionally, the predominantalong-shore surface current over the continental shelfis equatorward during the upwelling period butreverses seasonally when the Davidson Current (In-shore Counter Current) moves shoreward and towardthe surface during fall and winter (Huyer et al. 1979,Strub et al. 1987, Strub & James 2000).
The apparent potential for larval loss in such a sys-tem due to advection away from adequate rearingand/or settlement areas contributed to Parrish et al.’s(1981) hypothesis that pelagic species should spawnprimarily during downwelling to minimize such losses.Some pelagic species, however, reproduce and haveeggs and larvae in coastal waters during summerupwelling, e.g. peak spawning for the northern sub-
population of northern anchovy Engraulis mordax isJuly and August (Richardson 1981). Successful repro-duction during the upwelling season has been pro-posed to result from an ‘optimal window’ in ocean con-ditions when intermediate wind speeds may enhancefeeding efficiency and reduce larval loss (Lasker 1974,Cury & Roy 1989). There are, however, relatively fewdata on the seasonal abundance patterns of larval andjuvenile fish in Oregon’s nearshore waters, and themechanisms of transport are not well understood.
Pacific Northwest estuaries are relatively small, typ-ically shallow, and strongly influenced by the coastalocean. The physical and biological characteristics ofthe region’s estuaries are tightly coupled with oceanicprocesses (Roegner & Shanks 2001, Roegner et al.2002, Miller & Shanks 2004). Roegner et al. (2002) doc-umented rapid (<1 d) exchange of estuarine watersafter a wind reversal and the relaxation of upwelling.The estuarine intrusion of coastal waters resulted in amarked, prolonged (>5 d) increase in phytoplanktonstanding stock (measured as fluorescence) within theestuary. It is not yet well described, however, how suchtight ocean-estuary coupling affects secondary con-sumers, such as fish larvae, and their cross-shelf trans-port and estuarine ingress.
Larval and juvenile fish that reside in estuaries needto locate, enter, and potentially remain in such envi-ronments, whether by passive or active means (Boeh-lert & Mundy 1988). Various wind- and tidally-driventransport mechanisms can promote shoreward move-ment (Shanks 1995, Epifanio & Garvine 2001, Forward& Tankersley 2001) and estuarine ingress (Boehlert &Mundy 1988, Goodrich et al. 1989, Munch & Conover2000) of organisms. Estuarine ingress may be associ-ated with onshore, or downwelling, winds that forcecoastal waters into the estuary (Goodrich et al. 1989,Munch & Conover 2000). Non-linear internal tides andbores and tidal-stream transport through verticalmigration can also promote shoreward transport andestuarine ingress (Kingsford & Choat 1986, Pineda1991, Shanks 1983, 1998). Additionally, modelingefforts have demonstrated the potential for net hori-zontal transport to occur in organisms that undergodiel vertical migration in oscillatory tidal currents overthe continental shelf (Hill 1998). The relative impor-tance of such mechanisms, however, to the shorewardtransport and estuarine ingress of larval and juvenilefish in Pacific Northwest estuaries is not well de-scribed.
We previously completed a short-term (4 mo), high-frequency (every 2 d) time-series analysis of light-trapcollections to compare the timing and magnitude ofabundance of juvenile fish and crab megalopae at acoastal and adjacent estuarine location and to identifypotential transport mechanisms (Miller & Shanks
178
Miller & Shanks: Larval and juvenile fish in Coos Bay, Oregon
2004). Here we build upon that work with a study oflarval and juvenile fish in the same temperate estuary,Coos Bay, Oregon, using a significantly longer timeseries (3.75 yr) of high-frequency (every 1 to 2 d) light-trap collections. The objectives of this study were to(1) document larval and juvenile fish species diversity(i.e. richness and abundance), (2) document intra- andinterannual patterns in species abundance and sizebased on collections from 3 locations in the lower estu-ary, and (3) identify potential wind- and/or tidally-driven transport mechanisms. This study did not in-clude any collections from the outer coast and did notaim to complete a comprehensive survey of larval andjuvenile fish use of Coos Bay. Rather, the intent was todocument seasonal and interannual patterns of larvaland juvenile fish use at selected locations within CoosBay and to identify potential wind- and/or tidally-driven transport mechanisms.
MATERIALS AND METHODS
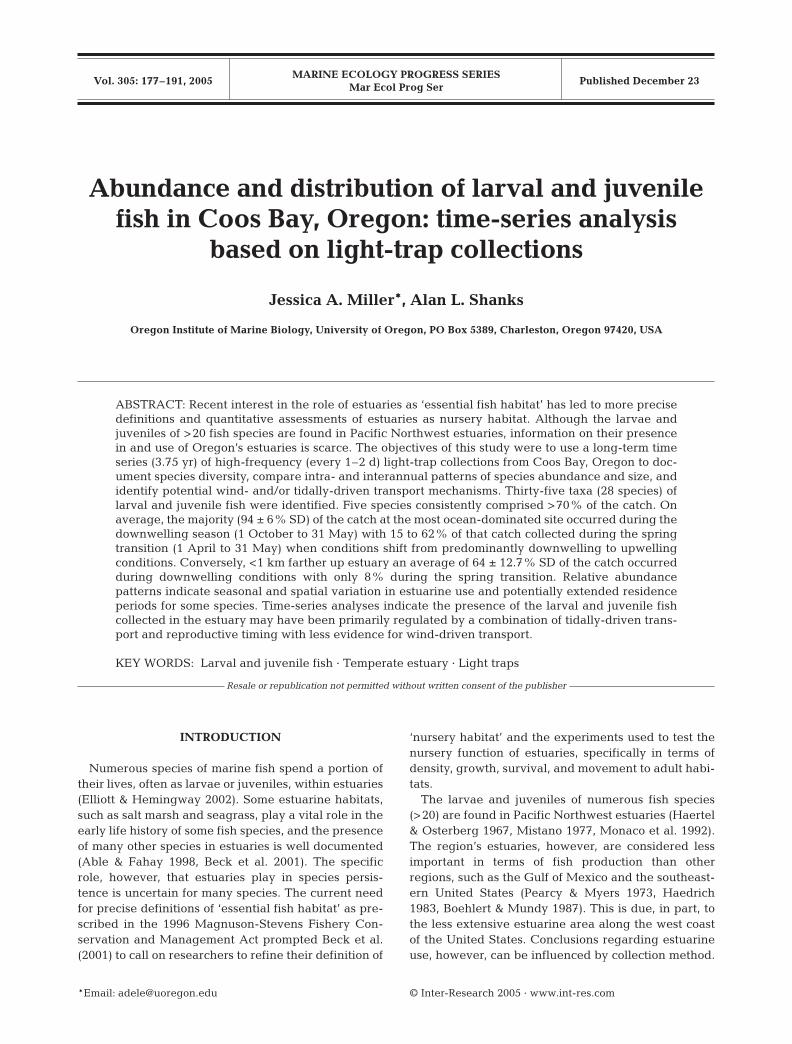
Study site. The Coos Bay estuary is located on Ore-gon’s south coast and, at ca. 54 km2, is the state’s secondlargest estuary (Fig. 1). Tides are mixed, semidiurnalwith a mean amplitude of 2 m. The region experiencesa distinct rainy season, from November to March, andthe 30 yr average annual precipitation is 161.3 cm.
Biological sampling. Light traps were used to collectlarval and juvenile fish. Traps (illustrated in Miller &
Shanks 2004) consisted of a 10 l polycarbonate (clear)carboy with 10 circular funnel openings (diameter = 1to 1.25 cm) and an 8 W fluorescent light in a sealedtube powered either by shore power or with a 12.0 V,12.0 Ah rechargeable Pb-Acid acid battery controlledwith a photocell. One light trap was deployed at theOuter Boat Basin, Charleston, Oregon (43° 20’ 36’’ N,124°19’ 17’’ W) from 1 April 1998 to 31 December 2001(Fig. 1). Hereafter, this site is referred to as the En-trance. A set of 3 light traps was deployed at the Dis-tant Fleet Facility (43° 20’12’’ N, 124° 19’14’’ W), loca-ted ca. 1 km inside of Coos Bay, from 12 January 2000to 31 December 2001. Hereafter, this site is referred toas Mid-Slough. Both of these sites were associatedwith a dock, and shore power was used. An additionalset of 3 light traps was deployed farther up-estuary inSouth Slough (43° 19’15’’ N, 124°19’ 10’’ W), ca. 1.5 kmfrom the Entrance, from 9 June to 20 September 2001(Fig. 1). Hereafter, this site is referred to as UpperSlough. These traps were tethered to anchored buoysand powered with 12.0 V batteries. Traps within eachsite were deployed 15 to 30 m apart and cleaned regu-larly. Dock traps were usually emptied once per day,while tethered traps were emptied every other day.Fish were identified to the lowest possible taxon,counted, and measured to the nearest mm. Totallength (TL) was used for preflexion fish and standardlength (SL) for postflexion fish.
Although light traps are passive collectors of posi-tively phototactic organisms, they offer advantagesover more traditional net collections. Light traps allowfor simultaneous and integrated sampling over a rela-tively long period, i.e. the entire night, which increasesthe probability of capture for rare organisms. They alsooften capture late-stage larvae and early juveniles,which are poorly sampled with nets (Milicich &Doherty 1994). Therefore, this technique may be wellsuited to determine estuarine use by later-stage larvaeand early juveniles (Strydom 2003). Additionally, theselater stages may be more indicative of recruitment suc-cess than early larvae (Peterman et al. 1988).
Physical sampling. Hourly wind speed and directionwere obtained from the National Oceanic andAtmospheric Administration’s (NOAA) National DataBuoy Center’s C-MAN Stn CAR03 (43° 20’ 30’’ N,124° 22’ 30’’ W) located on the outer coast ca. 2 kmsouth of Coos Bay (Fig. 1). Daily averages for along-shore and cross-shore wind stress (dyn cm–2) werecalculated as described in Miller & Shanks (2004).Daily average upwelling indices (m3 s–1 per 100 mcoastline) at 45°N, 125°W were obtained from theNOAA Pacific Fisheries Environmental Laboratory(PFEL), Pacific Grove, California (see Miller & Shanks2004 for details). Data on coastal ocean water tempera-tures (°C) (depth = 0.6 m) were obtained from offshore
179
Upper Slough
Coos Bay
124°22’30”
45°N
42°N
117°W124°W
Oregon
California
•
CARO3
2 km
a) b)
N
buoy
Mid-Slough
Entrance Upper Slough
Coos Bay
43°25’
43°20’
124°12’30”
42°N
117°W
Oregon
California
•
CARO3
2 km
a) b)
N
buoy
Mid-Slough
Entrance
Fig. 1. Study sites in Coos Bay, Oregon. (a) Study region and (d)location of NOAA buoy #46027 (41° 51’ 01’’ N, 124° 22’ 52’’ W)which provided surface water temperature data (0.6 m waterdepth). (b) Map of Coos Bay indicating the location of Entrance,Mid-Slough, and Upper Slough light traps. NOAA’s C-MANStn CAR03 (43° 20’ 30’’ N, 124° 22’ 30’’ W), which provided daily
wind speed and direction, is labeled
Mar Ecol Prog Ser 305: 177–191, 2005
NOAA buoy #46027 (41° 51’ 01’’ N, 124° 22’ 52’’ W),which was the closest working coastal buoy. Hourlysurface water temperatures (°C) were obtained fromNOAA Stn #9432780 (43° 20’ 42’’ N, 124° 19’ 21’’ W)located in the Outer Boat Basin (Fig. 1). Additionally,water temperature and salinity for the Mid-Slough andthe Upper Slough sites were obtained from the SouthSlough National Estuarine Research Reserve’s SystemWide Monitoring Program. Maximum daily tidalranges (cm) came from the Harbor Master softwareprogram.
Statistical analysis. Time-series analysis was used tocompare catch between trap locations and identifypotential transport mechanisms. A constant time step,or sample frequency, is necessary for time-seriesanalysis. A daily time step was used for all analysesthat did not include samples from the Upper Sloughsite, which were collected every other day. Biologicaland physical data were averaged over 2 d for analysesthat included Upper Slough samples. Species abun-dance data were log-transformed to reduce the influ-ence of large peaks and examined for trends and/orautocorrelations (Emery & Thomson 1997).
The biological time series, due to the pulsed natureof the catch data, typically displayed a significant auto-correlation with an exponential decay. The autocorre-lation can be removed by differencing the original dataseries with a smoothed data series to generate residu-als (Miller & Shanks 2004). If biological data displayeda significant autocorrelation, data were smoothed withan unweighted moving average (19 d average for alltime series >200 d in length and 9 d average for alltime series <200 d in length). The difference, or resid-ual, between the data series and the smoothed datawas computed with Eq. (1):
Xt = Yt – Zt (1)
where Xt = residual at time t, Yt = raw data at time t,and Zt = smoothed data at time t. The residuals werethen smoothed with a 3 d moving average to removehigh-frequency noise. We considered the above trans-formation successful if the exponential decay in theautocorrelation function associated with the biologicalseries was removed.
If a physical data series displayed a seasonal trend,the trend was removed. Trends were evaluated withlinear regression. If a series displayed a significantlinear trend (p ≤ 0.05), the trend was removed withEq. (2):
Xd = Xi – (a + b × t) (2)
where Xd = detrended value at time t, Xi = originalvalue at time t, a (intercept) and b (slope) are com-puted from the original data series via least squaresregression, and t = time, i.e. sample day. The trend
removal was considered successful if there was nolonger a significant linear regression in the series. Theupwelling indices, however, were an exception. Theannual pattern of daily average upwelling was curvi-linear (i.e. concave) due to largely positive values dur-ing spring and summer months. Therefore, a residualanalysis as described above for the biological serieswas used on the time series of daily average upwellingindices.
Biological time series were statistically comparedwith physical variables indicative of wind and tidal con-ditions, including surface water temperature, salinity,along-shore and cross-shore wind stress, upwelling in-dex, and maximum daily tidal range. This allowedidentification of potential transport mechanisms. Time-series analysis measures the strength of a relationshipbetween 2 variables. As in all correlative studies, a sig-nificant statistical correlation does not necessarily im-ply a cause-and-effect relationship. In this study, lagsbetween variables represent days; the sign indicateswhether peaks in the lagged series occurred after (neg-ative values) or before (positive values) changes in theother variable. Positive along-shore wind stress cross-correlatations indicate a relationship with northwardwinds, and negative along-shore wind stress cross-correlations indicate southward winds. Positive cross-shore wind stress cross-correlations indicate a relation-ship with eastward, and negative cross-shore windstress cross-correlations indicate westward winds. Pos-itive maximum tidal range cross-correlations indicate arelationship with spring tides, and negative maximumtidal range cross-correlations indicate neap tides. Time-series analyses of fish abundance and physical vari-ables were completed only when adequate numbers offish (>50 individuals yr–1) were collected. Statistica wasused for all time-series analyses.
Annual patterns. Annual patterns in fish abundancewere examined in 2 ways. First, annual catch was di-vided into periods dominated by either upwelling ordownwelling conditions to determine how catch variedduring these periods. Years were divided into (1) winterdownwelling to spring transition, (2) upwelling, and(3) fall transition to downwelling. Due to the variation inthe timing of the spring transition, 2 dates, 1 April and1 June, were used for the onset of upwelling. Therefore,the periods examined were (1) 1 January to 31 March(winter downwelling), (2) 1 January to 31 May (ex-tended winter downwelling), (3) 1 April to 30 September(extended upwelling), (4) 1 June to 30 September (up-welling), and (5) 1 October to 31 December (fall down-welling). Second, single-spectrum Fourier analysis wasused to test for significant cycles in the abundance of themost common species collected. This analysis was lim-ited to the 3 complete years of data collection, 1999 to2001, at the Entrance site, and STATISTICA was used.
180
Miller & Shanks: Larval and juvenile fish in Coos Bay, Oregon
Fish size. An average daily fish size (mm, SL) foreach year was calculated for the most common speciescollected. For each day a species was collected at asite, all individuals were pooled to generate a dailyaverage size, e.g. all fish caught in the one Entrancetrap or the 3 Mid-Slough traps. The daily averageswere used to generate an annual average for each spe-cies at each site. The daily averages displayed discon-tinuous and non-normal distributions. Therefore, non-parametric statistics were used to test for differencesbetween collection sites. However, the assumptions ofequal population dispersion and similar distributionalshape were frequently not met and could not be cor-rected with data transformations. Therefore, Mann-Whitney U tests were used to test for differencesbetween collection sites only when fish size distribu-tions were similar among locations.
RESULTS
Overall, 28 species of larval, primarily postflexion,and juvenile fish were identified in all samples com-bined. Seven additional and unique species of larvae
or juveniles were identified to genus. Adult sand lanceAmmodytes hexapterus, stickleback Gasterosteusacculeatus, and bay pipefish Syngnathus leptor-hynchus were also collected but will not be discussedfurther. Twenty-three species of larvae or juvenileswere identified at the Entrance (Table 1), 22 at Mid-Slough (Table 2), and 3 at Upper Slough (Table 3).
The majority of the species collected are demersalspawners with attached, adhesive, or guarded eggs. Theexceptions include the pelagic spawners, e.g. northernanchovy Engraulis mordax, Pacific sardine Sardinopssagax, and English sole Parophrys vetulus, and live bear-ers, e.g. the rockfishes Sebastes spp. The Sebastes spp.identified in this study (Tables 1 & 2) comprised at least 4species, including black S. melanops, brown S. auricula-tus, and yellowtail S. flavidus rockfish.
Five species consistently comprised the majority(>70%) of the catch, including northern anchovyEngraulis mordax, penpoint gunnel Apodichthysflavidus, Pacific sardine Sardinops sagax, rosylipsculpin Ascelichthys rhodorus, and surf smeltHypomesus pretiosus. Correlations of species catchbetween traps within a site averaged +0.55 ± 0.10 SDand ranged from +0.40 to +0.62.
181
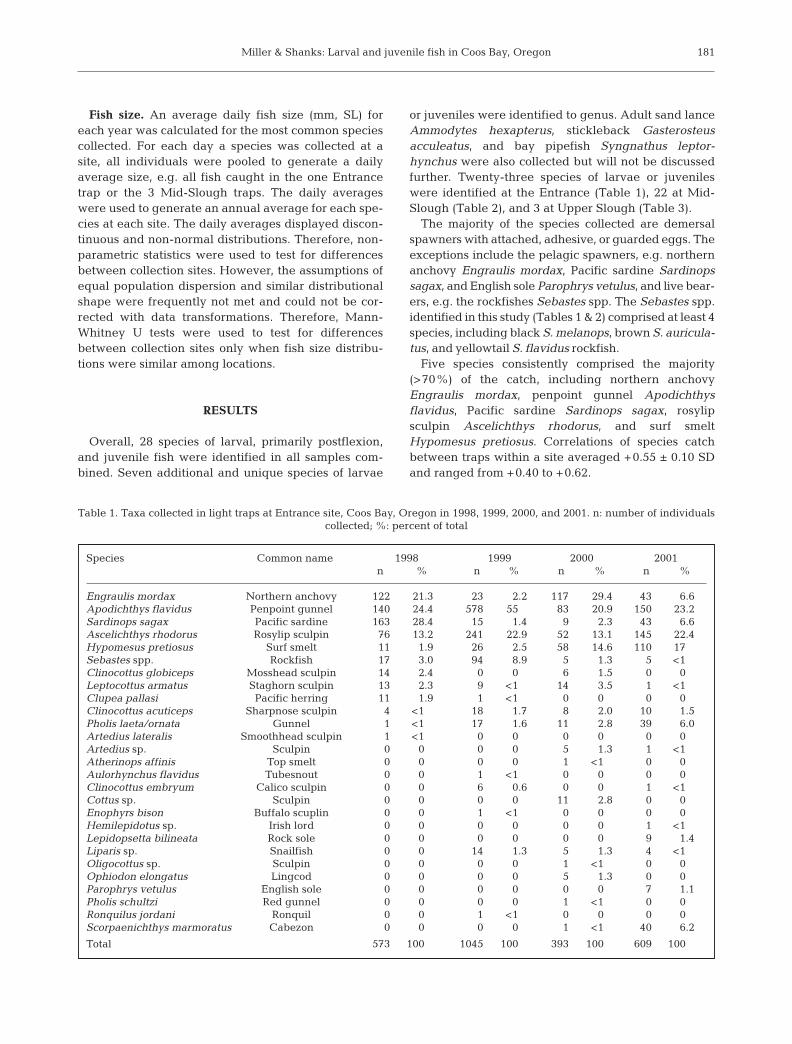
Table 1. Taxa collected in light traps at Entrance site, Coos Bay, Oregon in 1998, 1999, 2000, and 2001. n: number of individuals collected; %: percent of total
Species Common name 1998 1999 2000 2001n % n % n % n %
Engraulis mordax Northern anchovy 122 21.3 23 2.2 117 29.4 43 6.6Apodichthys flavidus Penpoint gunnel 140 24.4 578 55 83 20.9 150 23.2Sardinops sagax Pacific sardine 163 28.4 15 1.4 9 2.3 43 6.6Ascelichthys rhodorus Rosylip sculpin 76 13.2 241 22.9 52 13.1 145 22.4Hypomesus pretiosus Surf smelt 11 1.9 26 2.5 58 14.6 110 17Sebastes spp. Rockfish 17 3.0 94 8.9 5 1.3 5 <1Clinocottus globiceps Mosshead sculpin 14 2.4 0 0 6 1.5 0 0Leptocottus armatus Staghorn sculpin 13 2.3 9 <1 14 3.5 1 <1Clupea pallasi Pacific herring 11 1.9 1 <1 0 0 0 0Clinocottus acuticeps Sharpnose sculpin 4 <1 18 1.7 8 2.0 10 1.5Pholis laeta/ornata Gunnel 1 <1 17 1.6 11 2.8 39 6.0Artedius lateralis Smoothhead sculpin 1 <1 0 0 0 0 0 0Artedius sp. Sculpin 0 0 0 0 5 1.3 1 <1Atherinops affinis Top smelt 0 0 0 0 1 <1 0 0Aulorhynchus flavidus Tubesnout 0 0 1 <1 0 0 0 0Clinocottus embryum Calico sculpin 0 0 6 0.6 0 0 1 <1Cottus sp. Sculpin 0 0 0 0 11 2.8 0 0Enophyrs bison Buffalo scuplin 0 0 1 <1 0 0 0 0Hemilepidotus sp. Irish lord 0 0 0 0 0 0 1 <1Lepidopsetta bilineata Rock sole 0 0 0 0 0 0 9 1.4Liparis sp. Snailfish 0 0 14 1.3 5 1.3 4 <1Oligocottus sp. Sculpin 0 0 0 0 1 <1 0 0Ophiodon elongatus Lingcod 0 0 0 0 5 1.3 0 0Parophrys vetulus English sole 0 0 0 0 0 0 7 1.1Pholis schultzi Red gunnel 0 0 0 0 1 <1 0 0Ronquilus jordani Ronquil 0 0 1 <1 0 0 0 0Scorpaenichthys marmoratus Cabezon 0 0 0 0 1 <1 40 6.2
Total 573 100 1045 100 393 100 609 100
Mar Ecol Prog Ser 305: 177–191, 2005
Northern anchovy Engraulis mordax spawn through-out the year in California, but spawning appears tobe concentrated in summer months farther north(Richardson 1981). Three subpopulations of E. mordaxhave been identified, namely northern (British Columbiato northern California), central (off southern Californiaand northern Baja California), and southern (off centraland southern Baja California) (Kucas 1986). Pacific sar-dine Sardinops sagax spawn in central California fromJanuary to June and typically migrate northward duringsummer. Surf smelt Hypomesus pretiosus are reported tospawn throughout the year in much of their range withpeaks in spring and summer months (Love 1996). Rosylipsculpin Ascelichthys rhodorus have a relatively brief,seasonal spawning peak, reportedly from early January
to early February in Puget Sound (Petersen et al. 2004).Penpoint gunnel Apodichthys flavidus spawn fromJanuary to March.
Entrance
In 1998, 15 unique taxa were collected at the En-trance and 13 identified to species (Table 1). In 1999,18 unique taxa were collected and 15 identified tospecies. In 2000, 20 unique taxa were collected and 15identified to species. In 2001, 18 unique taxa werecollected and 14 identified to species.
Mid-Slough
In 2000, 23 unique taxa were collected at the Mid-Slough site and 19 identified to species (Table 2). In2001, 19 unique taxa were collected and 16 identifiedto species.
Upper Slough
Three species were collected at the Upper Sloughsite in 2001, the only year that light traps were main-
182
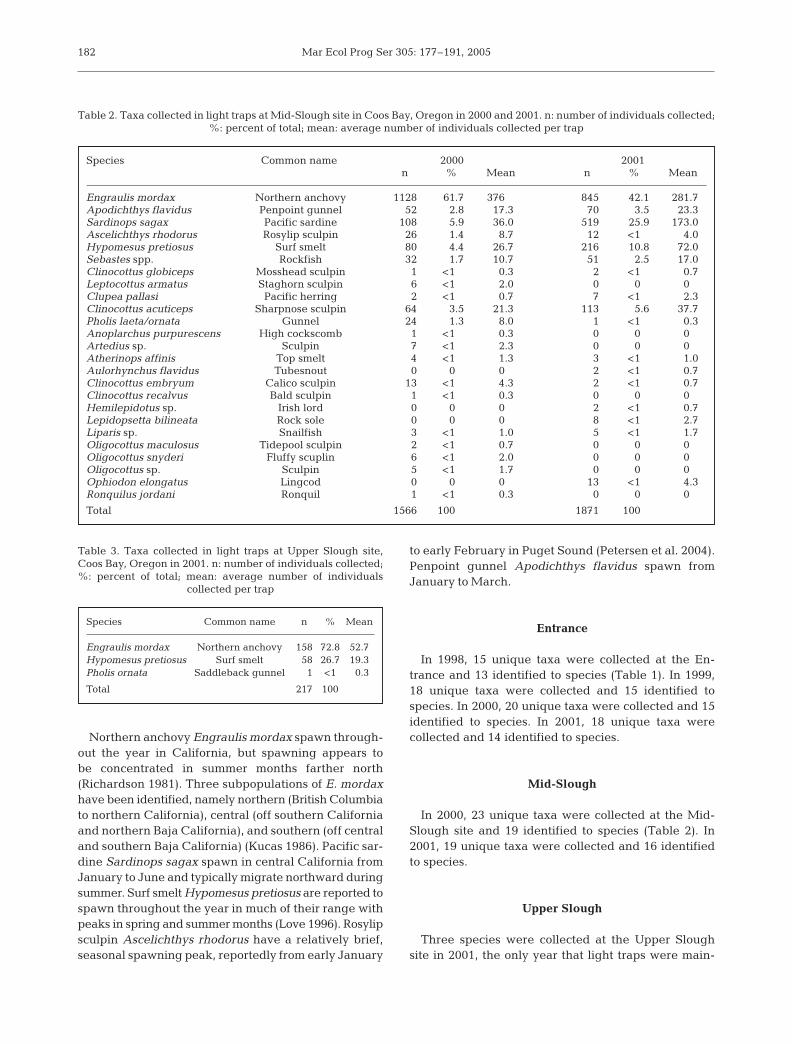
Table 2. Taxa collected in light traps at Mid-Slough site in Coos Bay, Oregon in 2000 and 2001. n: number of individuals collected; %: percent of total; mean: average number of individuals collected per trap
Species Common name 2000 2001n % Mean n % Mean
Engraulis mordax Northern anchovy 1128 61.7 376 845 42.1 281.7Apodichthys flavidus Penpoint gunnel 52 2.8 17.3 70 3.5 23.3Sardinops sagax Pacific sardine 108 5.9 36.0 519 25.9 173.0Ascelichthys rhodorus Rosylip sculpin 26 1.4 8.7 12 <1 4.0Hypomesus pretiosus Surf smelt 80 4.4 26.7 216 10.8 72.0Sebastes spp. Rockfish 32 1.7 10.7 51 2.5 17.0Clinocottus globiceps Mosshead sculpin 1 <1 0.3 2 <1 0.7Leptocottus armatus Staghorn sculpin 6 <1 2.0 0 0 0Clupea pallasi Pacific herring 2 <1 0.7 7 <1 2.3Clinocottus acuticeps Sharpnose sculpin 64 3.5 21.3 113 5.6 37.7Pholis laeta/ornata Gunnel 24 1.3 8.0 1 <1 0.3Anoplarchus purpurescens High cockscomb 1 <1 0.3 0 0 0Artedius sp. Sculpin 7 <1 2.3 0 0 0Atherinops affinis Top smelt 4 <1 1.3 3 <1 1.0Aulorhynchus flavidus Tubesnout 0 0 0 2 <1 0.7Clinocottus embryum Calico sculpin 13 <1 4.3 2 <1 0.7Clinocottus recalvus Bald sculpin 1 <1 0.3 0 0 0Hemilepidotus sp. Irish lord 0 0 0 2 <1 0.7Lepidopsetta bilineata Rock sole 0 0 0 8 <1 2.7Liparis sp. Snailfish 3 <1 1.0 5 <1 1.7Oligocottus maculosus Tidepool sculpin 2 <1 0.7 0 0 0Oligocottus snyderi Fluffy scuplin 6 <1 2.0 0 0 0Oligocottus sp. Sculpin 5 <1 1.7 0 0 0Ophiodon elongatus Lingcod 0 0 0 13 <1 4.3Ronquilus jordani Ronquil 1 <1 0.3 0 0 0
Total 1566 100 1871 100
Table 3. Taxa collected in light traps at Upper Slough site,Coos Bay, Oregon in 2001. n: number of individuals collected;%: percent of total; mean: average number of individuals
collected per trap
Species Common name n % Mean
Engraulis mordax Northern anchovy 158 72.8 52.7Hypomesus pretiosus Surf smelt 58 26.7 19.3Pholis ornata Saddleback gunnel 1 <1 0.3
Total 217 100
Miller & Shanks: Larval and juvenile fish in Coos Bay, Oregon
tained at this location (Table 3). North-ern anchovy Engraulis mordax and surfsmelt Hypomesus pretiosus comprised99.5% of the total catch.
Annual patterns
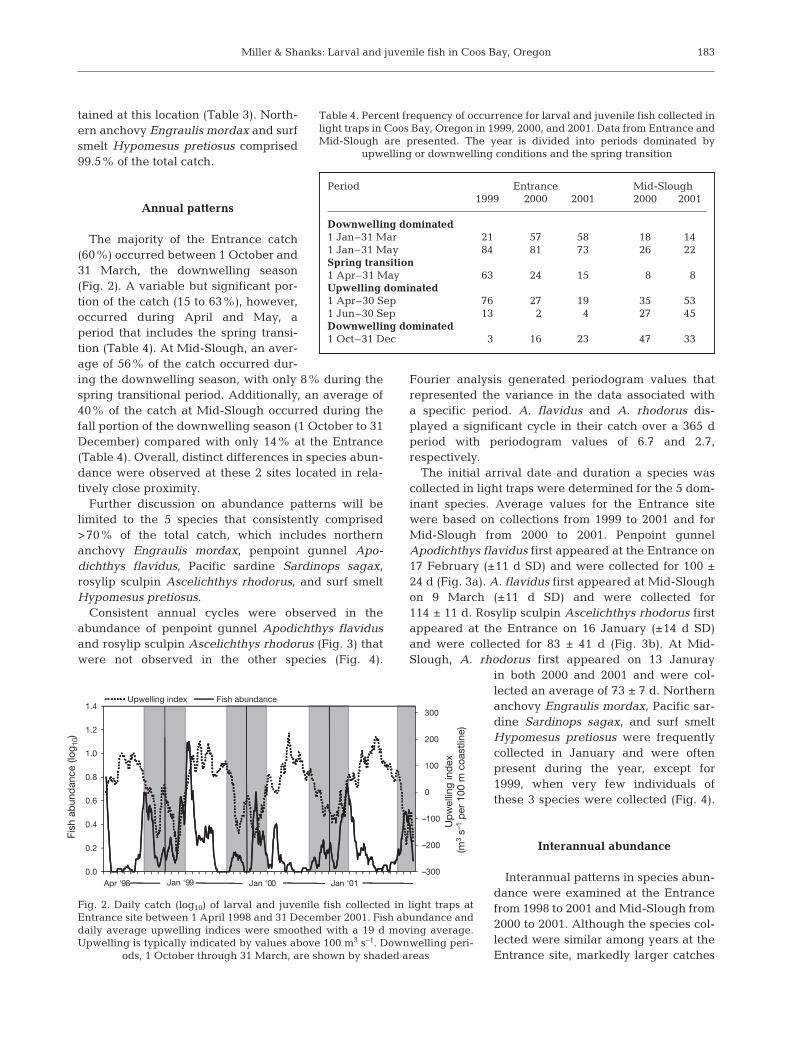
The majority of the Entrance catch(60%) occurred between 1 October and31 March, the downwelling season(Fig. 2). A variable but significant por-tion of the catch (15 to 63%), however,occurred during April and May, aperiod that includes the spring transi-tion (Table 4). At Mid-Slough, an aver-age of 56% of the catch occurred dur-ing the downwelling season, with only 8% during thespring transitional period. Additionally, an average of40% of the catch at Mid-Slough occurred during thefall portion of the downwelling season (1 October to 31December) compared with only 14% at the Entrance(Table 4). Overall, distinct differences in species abun-dance were observed at these 2 sites located in rela-tively close proximity.
Further discussion on abundance patterns will belimited to the 5 species that consistently comprised>70% of the total catch, which includes northernanchovy Engraulis mordax, penpoint gunnel Apo-dichthys flavidus, Pacific sardine Sardinops sagax,rosylip sculpin Ascelichthys rhodorus, and surf smeltHypomesus pretiosus.
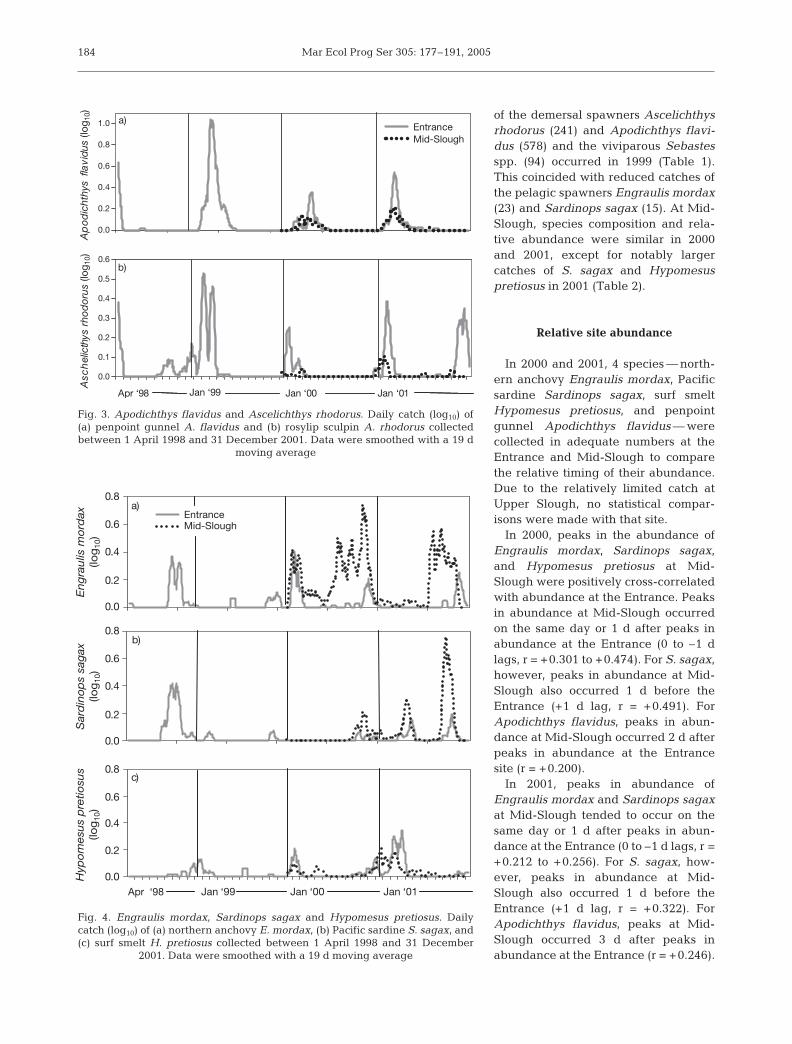
Consistent annual cycles were observed in theabundance of penpoint gunnel Apodichthys flavidusand rosylip sculpin Ascelichthys rhodorus (Fig. 3) thatwere not observed in the other species (Fig. 4).
Fourier analysis generated periodogram values thatrepresented the variance in the data associated witha specific period. A. flavidus and A. rhodorus dis-played a significant cycle in their catch over a 365 dperiod with periodogram values of 6.7 and 2.7,respectively.
The initial arrival date and duration a species wascollected in light traps were determined for the 5 dom-inant species. Average values for the Entrance sitewere based on collections from 1999 to 2001 and forMid-Slough from 2000 to 2001. Penpoint gunnelApodichthys flavidus first appeared at the Entrance on17 February (±11 d SD) and were collected for 100 ±24 d (Fig. 3a). A. flavidus first appeared at Mid-Sloughon 9 March (±11 d SD) and were collected for114 ± 11 d. Rosylip sculpin Ascelichthys rhodorus firstappeared at the Entrance on 16 January (±14 d SD)and were collected for 83 ± 41 d (Fig. 3b). At Mid-Slough, A. rhodorus first appeared on 13 Januray
in both 2000 and 2001 and were col-lected an average of 73 ± 7 d. Northernanchovy Engraulis mordax, Pacific sar-dine Sardinops sagax, and surf smeltHypomesus pretiosus were frequentlycollected in January and were oftenpresent during the year, except for1999, when very few individuals ofthese 3 species were collected (Fig. 4).
Interannual abundance
Interannual patterns in species abun-dance were examined at the Entrancefrom 1998 to 2001 and Mid-Slough from2000 to 2001. Although the species col-lected were similar among years at theEntrance site, markedly larger catches
183
0.0
0.2
0.4
0.6
0.8
1.0
1.2
1.4
–300
–200
–100
0
100
200
300
Apr ‘98 Jan ‘99 Jan ‘00 Jan ‘01
Fish
ab
und
ance
(log
10)
Up
wel
ling
ind
ex
(m3
s–1 p
er 1
00 m
coa
stlin
e)
Upwelling index Fish abundance
Fig. 2. Daily catch (log10) of larval and juvenile fish collected in light traps atEntrance site between 1 April 1998 and 31 December 2001. Fish abundance anddaily average upwelling indices were smoothed with a 19 d moving average.Upwelling is typically indicated by values above 100 m3 s–1. Downwelling peri-
ods, 1 October through 31 March, are shown by shaded areas
Table 4. Percent frequency of occurrence for larval and juvenile fish collected inlight traps in Coos Bay, Oregon in 1999, 2000, and 2001. Data from Entrance andMid-Slough are presented. The year is divided into periods dominated by
upwelling or downwelling conditions and the spring transition
Period Entrance Mid-Slough1999 2000 2001 2000 2001
Downwelling dominated1 Jan–31 Mar 21 57 58 18 141 Jan–31 May 84 81 73 26 22Spring transition1 Apr–31 May 63 24 15 8 8Upwelling dominated1 Apr–30 Sep 76 27 19 35 531 Jun–30 Sep 13 2 4 27 45Downwelling dominated1 Oct–31 Dec 3 16 23 47 33
Mar Ecol Prog Ser 305: 177–191, 2005
of the demersal spawners Ascelichthysrhodorus (241) and Apodichthys flavi-dus (578) and the viviparous Sebastesspp. (94) occurred in 1999 (Table 1).This coincided with reduced catches ofthe pelagic spawners Engraulis mordax(23) and Sardinops sagax (15). At Mid-Slough, species composition and rela-tive abundance were similar in 2000and 2001, except for notably largercatches of S. sagax and Hypomesuspretiosus in 2001 (Table 2).
Relative site abundance
In 2000 and 2001, 4 species — north-ern anchovy Engraulis mordax, Pacificsardine Sardinops sagax, surf smeltHypomesus pretiosus, and penpointgunnel Apodichthys flavidus — werecollected in adequate numbers at theEntrance and Mid-Slough to comparethe relative timing of their abundance.Due to the relatively limited catch atUpper Slough, no statistical compar-isons were made with that site.
In 2000, peaks in the abundance ofEngraulis mordax, Sardinops sagax,and Hypomesus pretiosus at Mid-Slough were positively cross-correlatedwith abundance at the Entrance. Peaksin abundance at Mid-Slough occurredon the same day or 1 d after peaks inabundance at the Entrance (0 to –1 dlags, r = +0.301 to +0.474). For S. sagax,however, peaks in abundance at Mid-Slough also occurred 1 d before theEntrance (+1 d lag, r = +0.491). ForApodichthys flavidus, peaks in abun-dance at Mid-Slough occurred 2 d afterpeaks in abundance at the Entrancesite (r = +0.200).
In 2001, peaks in abundance ofEngraulis mordax and Sardinops sagaxat Mid-Slough tended to occur on thesame day or 1 d after peaks in abun-dance at the Entrance (0 to –1 d lags, r =+0.212 to +0.256). For S. sagax, how-ever, peaks in abundance at Mid-Slough also occurred 1 d before theEntrance (+1 d lag, r = +0.322). ForApodichthys flavidus, peaks at Mid-Slough occurred 3 d after peaks inabundance at the Entrance (r = +0.246).
184
0.0
0.2
0.4
0.6
0.8
1.0 Entrance Mid-Slough
0.0
0.1
0.2
0.3
0.4
0.5
0.6
a)
b)
Apr ‘98 Jan ‘99 Jan ‘00 Jan ‘01
Ap
od
icht
hys
fla
vidu
s (lo
g 10)
Entrance Mid-Slough
Asc
hel
icth
ys r
hod
orus
(log
10)
a)
b)
Fig. 3. Apodichthys flavidus and Ascelichthys rhodorus. Daily catch (log10) of(a) penpoint gunnel A. flavidus and (b) rosylip sculpin A. rhodorus collectedbetween 1 April 1998 and 31 December 2001. Data were smoothed with a 19 d
moving average
0.8
0.6
0.4
0.2
0.0
0.8
0.6
0.4
0.2
0.0
0.8
0.6
0.4
0.2
0.0
Entrance
En
gra
ulis
mo
rdax
(log
10)
Sar
din
op
s sa
gax
(log
10)
Hyp
om
esu
s p
retio
sus
(log
10)
Mid-Slough
Apr ‘98 Jan ‘99 Jan ‘00 Jan ‘01
a)
b)
c)
Fig. 4. Engraulis mordax, Sardinops sagax and Hypomesus pretiosus. Dailycatch (log10) of (a) northern anchovy E. mordax, (b) Pacific sardine S. sagax, and(c) surf smelt H. pretiosus collected between 1 April 1998 and 31 December
2001. Data were smoothed with a 19 d moving average
Miller & Shanks: Larval and juvenile fish in Coos Bay, Oregon
Fish size
In general, there was little interannual variation inthe daily average size of the dominant species col-lected at the Entrance (Table 5). The trend for Sar-dinops sagax, however, was that fish were progres-sively larger each year of collection. The assumptionof similar statistical distributions required for theMann-Whitney U test was not met in all cases. Thus,statistical comparisons between collection sites weremade only when fish size distributions were similaramong locations, i.e. between Hypomesus pretiosus,Apodichthys flavidus, and Ascelicthys rhodorus at theEntrance and Mid-Slough in 2000. There was no sta-tistically significant difference in the daily averagesize of H. pretiosus between the 2 sites in 2000 (Z =–1.9; p = 0.06). In 2001, however, H. pretiosus werelarger (50.7 ± 13.1) at Mid-Slough than at theEntrance (32.1 ± 12.4) (Table 5). A. flavidus werelarger at Mid-Slough than at the Entrance in 2000(Z = –2.8; p = 0.008) and 2001 (Table 5). There wereno statistically significant differences in A. rhodorussize in 2000 (U = –0.9; p = 0.37), and daily averagesizes were similar in 2001. Daily average size of En-graulis mordax and S. sagax were similar at all sitesin 2000 and 2001.
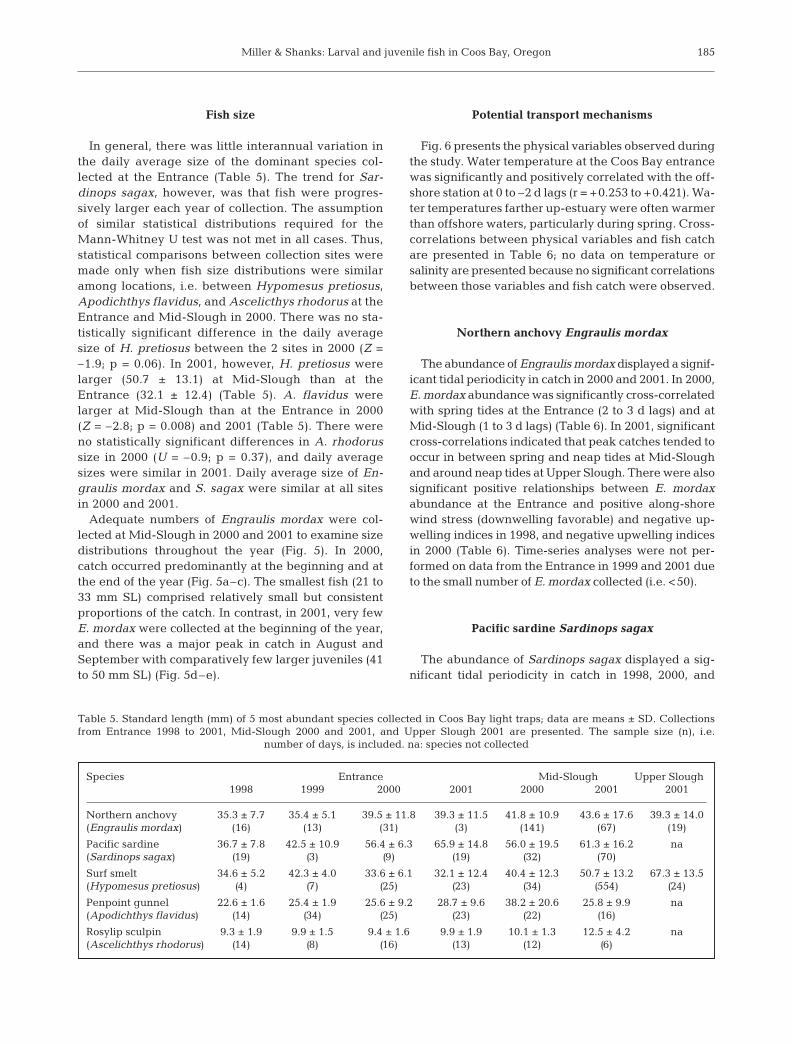
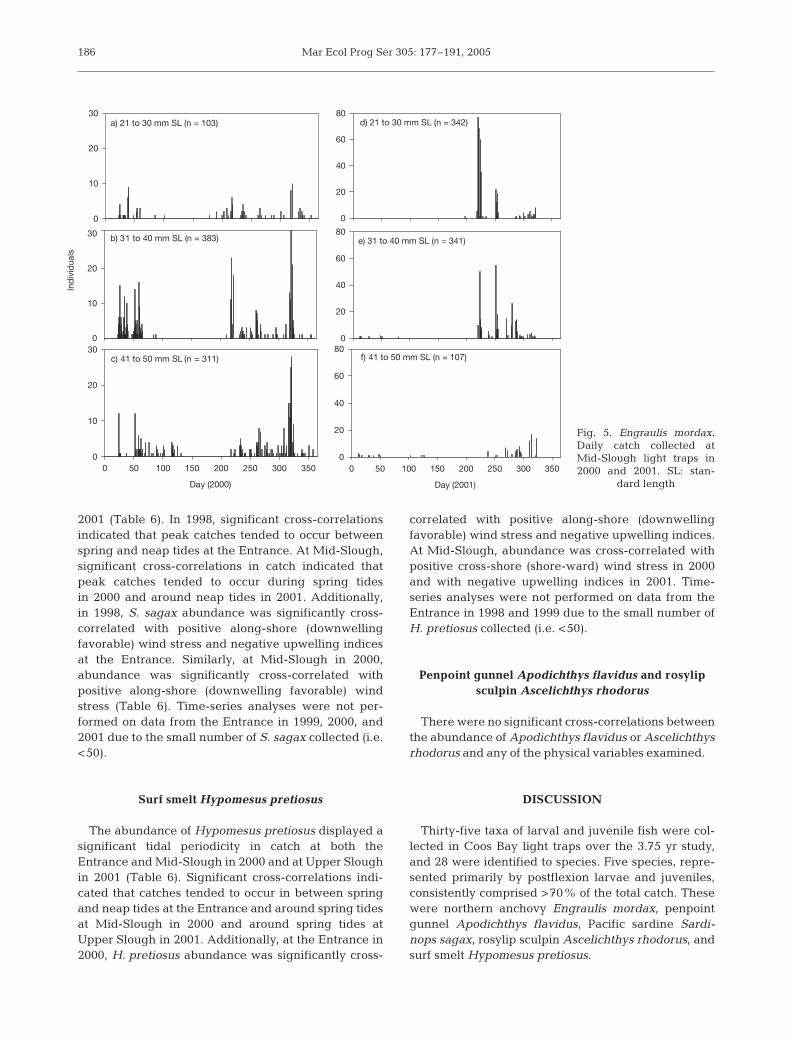
Adequate numbers of Engraulis mordax were col-lected at Mid-Slough in 2000 and 2001 to examine sizedistributions throughout the year (Fig. 5). In 2000,catch occurred predominantly at the beginning and atthe end of the year (Fig. 5a–c). The smallest fish (21 to33 mm SL) comprised relatively small but consistentproportions of the catch. In contrast, in 2001, very fewE. mordax were collected at the beginning of the year,and there was a major peak in catch in August andSeptember with comparatively few larger juveniles (41to 50 mm SL) (Fig. 5d–e).
Potential transport mechanisms
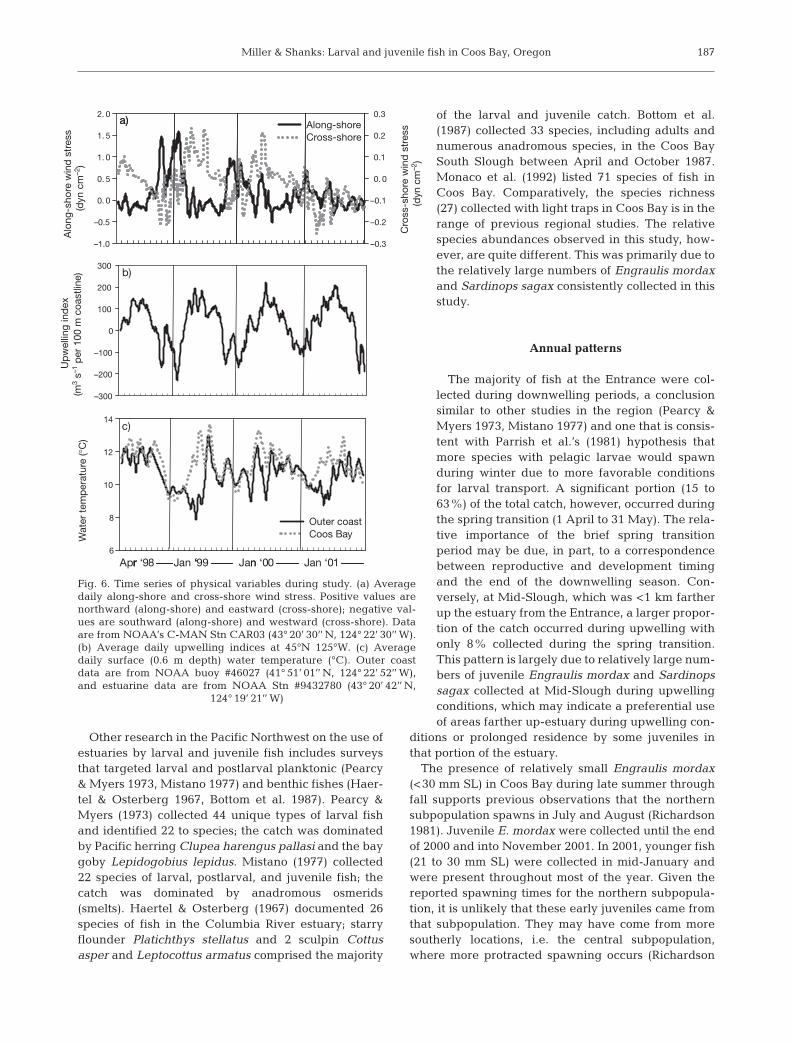
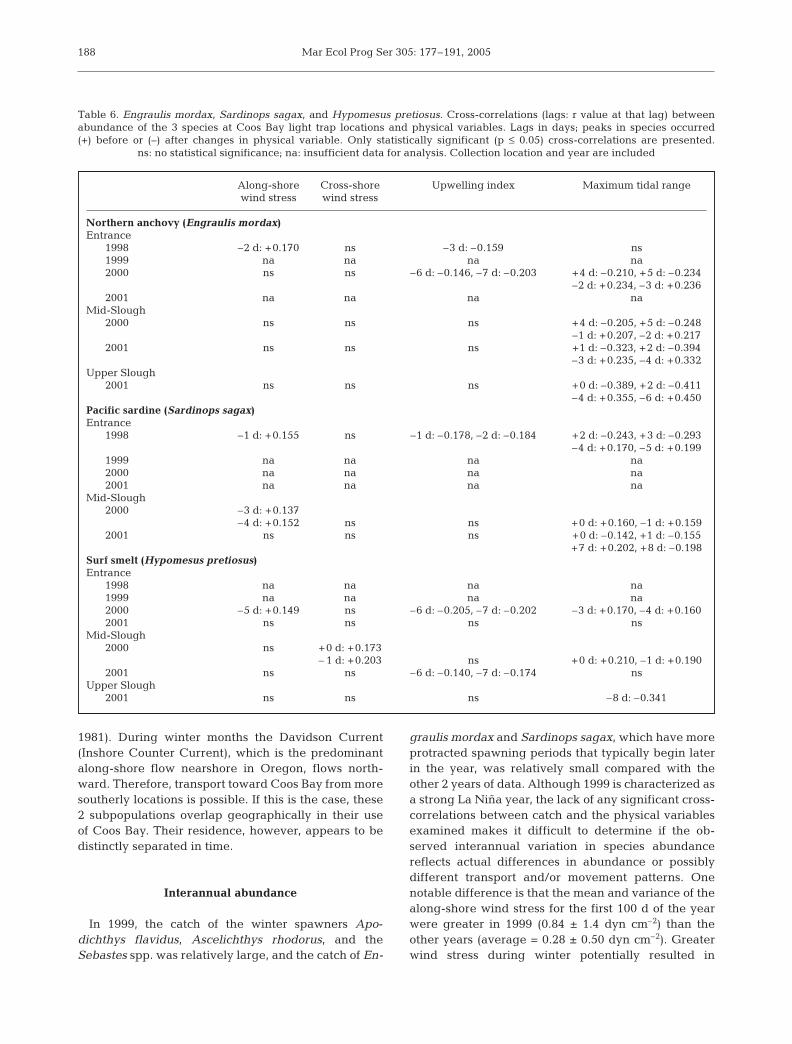
Fig. 6 presents the physical variables observed duringthe study. Water temperature at the Coos Bay entrancewas significantly and positively correlated with the off-shore station at 0 to –2 d lags (r = +0.253 to +0.421). Wa-ter temperatures farther up-estuary were often warmerthan offshore waters, particularly during spring. Cross-correlations between physical variables and fish catchare presented in Table 6; no data on temperature orsalinity are presented because no significant correlationsbetween those variables and fish catch were observed.
Northern anchovy Engraulis mordax
The abundance of Engraulis mordax displayed a signif-icant tidal periodicity in catch in 2000 and 2001. In 2000,E. mordax abundance was significantly cross-correlatedwith spring tides at the Entrance (2 to 3 d lags) and atMid-Slough (1 to 3 d lags) (Table 6). In 2001, significantcross-correlations indicated that peak catches tended tooccur in between spring and neap tides at Mid-Sloughand around neap tides at Upper Slough. There were alsosignificant positive relationships between E. mordaxabundance at the Entrance and positive along-shorewind stress (downwelling favorable) and negative up-welling indices in 1998, and negative upwelling indicesin 2000 (Table 6). Time-series analyses were not per-formed on data from the Entrance in 1999 and 2001 dueto the small number of E. mordax collected (i.e. <50).
Pacific sardine Sardinops sagax
The abundance of Sardinops sagax displayed a sig-nificant tidal periodicity in catch in 1998, 2000, and
185
Table 5. Standard length (mm) of 5 most abundant species collected in Coos Bay light traps; data are means ± SD. Collectionsfrom Entrance 1998 to 2001, Mid-Slough 2000 and 2001, and Upper Slough 2001 are presented. The sample size (n), i.e.
number of days, is included. na: species not collected
Species Entrance Mid-Slough Upper Slough1998 1999 2000 2001 2000 2001 2001
Northern anchovy 35.3 ± 7.7 35.4 ± 5.1 39.5 ± 11.8 39.3 ± 11.5 41.8 ± 10.9 43.6 ± 17.6 39.3 ± 14.0 (Engraulis mordax) (16) (13) (31) (3) (141) (67) (19)
Pacific sardine 36.7 ± 7.8 42.5 ± 10.9 56.4 ± 6.3 65.9 ± 14.8 56.0 ± 19.5 61.3 ± 16.2 na(Sardinops sagax) (19) (3) (9) (19) (32) (70)
Surf smelt 34.6 ± 5.2 42.3 ± 4.0 33.6 ± 6.1 32.1 ± 12.4 40.4 ± 12.3 50.7 ± 13.2 67.3 ± 13.5(Hypomesus pretiosus) (4) (7) (25) (23) (34) (554) (24)
Penpoint gunnel 22.6 ± 1.6 25.4 ± 1.9 25.6 ± 9.2 28.7 ± 9.6 38.2 ± 20.6 25.8 ± 9.9 na(Apodichthys flavidus) (14) (34) (25) (23) (22) (16)
Rosylip sculpin 9.3 ± 1.9 9.9 ± 1.5 9.4 ± 1.6 9.9 ± 1.9 10.1 ± 1.3 12.5 ± 4.2 na(Ascelichthys rhodorus) (14) (8) (16) (13) (12) (6)
Mar Ecol Prog Ser 305: 177–191, 2005
2001 (Table 6). In 1998, significant cross-correlationsindicated that peak catches tended to occur betweenspring and neap tides at the Entrance. At Mid-Slough,significant cross-correlations in catch indicated thatpeak catches tended to occur during spring tidesin 2000 and around neap tides in 2001. Additionally,in 1998, S. sagax abundance was significantly cross-correlated with positive along-shore (downwellingfavorable) wind stress and negative upwelling indicesat the Entrance. Similarly, at Mid-Slough in 2000,abundance was significantly cross-correlated withpositive along-shore (downwelling favorable) windstress (Table 6). Time-series analyses were not per-formed on data from the Entrance in 1999, 2000, and2001 due to the small number of S. sagax collected (i.e.<50).
Surf smelt Hypomesus pretiosus
The abundance of Hypomesus pretiosus displayed asignificant tidal periodicity in catch at both theEntrance and Mid-Slough in 2000 and at Upper Sloughin 2001 (Table 6). Significant cross-correlations indi-cated that catches tended to occur in between springand neap tides at the Entrance and around spring tidesat Mid-Slough in 2000 and around spring tides atUpper Slough in 2001. Additionally, at the Entrance in2000, H. pretiosus abundance was significantly cross-
correlated with positive along-shore (downwellingfavorable) wind stress and negative upwelling indices.At Mid-Slough, abundance was cross-correlated withpositive cross-shore (shore-ward) wind stress in 2000and with negative upwelling indices in 2001. Time-series analyses were not performed on data from theEntrance in 1998 and 1999 due to the small number ofH. pretiosus collected (i.e. <50).
Penpoint gunnel Apodichthys flavidus and rosylipsculpin Ascelichthys rhodorus
There were no significant cross-correlations betweenthe abundance of Apodichthys flavidus or Ascelichthysrhodorus and any of the physical variables examined.
DISCUSSION
Thirty-five taxa of larval and juvenile fish were col-lected in Coos Bay light traps over the 3.75 yr study,and 28 were identified to species. Five species, repre-sented primarily by postflexion larvae and juveniles,consistently comprised >70% of the total catch. Thesewere northern anchovy Engraulis mordax, penpointgunnel Apodichthys flavidus, Pacific sardine Sardi-nops sagax, rosylip sculpin Ascelichthys rhodorus, andsurf smelt Hypomesus pretiosus.
186
a) 21 to 30 mm SL (n = 103)
0
10
20
30
b) 31 to 40 mm SL (n = 383)
0
10
20
30
c) 41 to 50 mm SL (n = 311)
Day (2000)
0 50 100 150 200 250 300 3500
10
20
30
d) 21 to 30 mm SL (n = 342)
0
20
40
60
80
f) 41 to 50 mm SL (n = 107)
Day (2001)
0 50 100 150 200 250 300 3500
20
40
60
80
e) 31 to 40 mm SL (n = 341)
0
20
40
60
80
Ind
ivid
uals
Fig. 5. Engraulis mordax.Daily catch collected atMid-Slough light traps in2000 and 2001. SL: stan-
dard length
Miller & Shanks: Larval and juvenile fish in Coos Bay, Oregon
Other research in the Pacific Northwest on the use ofestuaries by larval and juvenile fish includes surveysthat targeted larval and postlarval planktonic (Pearcy& Myers 1973, Mistano 1977) and benthic fishes (Haer-tel & Osterberg 1967, Bottom et al. 1987). Pearcy &Myers (1973) collected 44 unique types of larval fishand identified 22 to species; the catch was dominatedby Pacific herring Clupea harengus pallasi and the baygoby Lepidogobius lepidus. Mistano (1977) collected22 species of larval, postlarval, and juvenile fish; thecatch was dominated by anadromous osmerids(smelts). Haertel & Osterberg (1967) documented 26species of fish in the Columbia River estuary; starryflounder Platichthys stellatus and 2 sculpin Cottusasper and Leptocottus armatus comprised the majority
of the larval and juvenile catch. Bottom et al.(1987) collected 33 species, including adults andnumerous anadromous species, in the Coos BaySouth Slough between April and October 1987.Monaco et al. (1992) listed 71 species of fish inCoos Bay. Comparatively, the species richness(27) collected with light traps in Coos Bay is in therange of previous regional studies. The relativespecies abundances observed in this study, how-ever, are quite different. This was primarily due tothe relatively large numbers of Engraulis mordaxand Sardinops sagax consistently collected in thisstudy.
Annual patterns
The majority of fish at the Entrance were col-lected during downwelling periods, a conclusionsimilar to other studies in the region (Pearcy &Myers 1973, Mistano 1977) and one that is consis-tent with Parrish et al.’s (1981) hypothesis thatmore species with pelagic larvae would spawnduring winter due to more favorable conditionsfor larval transport. A significant portion (15 to63%) of the total catch, however, occurred duringthe spring transition (1 April to 31 May). The rela-tive importance of the brief spring transitionperiod may be due, in part, to a correspondencebetween reproductive and development timingand the end of the downwelling season. Con-versely, at Mid-Slough, which was <1 km fartherup the estuary from the Entrance, a larger propor-tion of the catch occurred during upwelling withonly 8% collected during the spring transition.This pattern is largely due to relatively large num-bers of juvenile Engraulis mordax and Sardinopssagax collected at Mid-Slough during upwellingconditions, which may indicate a preferential useof areas farther up-estuary during upwelling con-
ditions or prolonged residence by some juveniles inthat portion of the estuary.
The presence of relatively small Engraulis mordax(<30 mm SL) in Coos Bay during late summer throughfall supports previous observations that the northernsubpopulation spawns in July and August (Richardson1981). Juvenile E. mordax were collected until the endof 2000 and into November 2001. In 2001, younger fish(21 to 30 mm SL) were collected in mid-January andwere present throughout most of the year. Given thereported spawning times for the northern subpopula-tion, it is unlikely that these early juveniles came fromthat subpopulation. They may have come from moresoutherly locations, i.e. the central subpopulation,where more protracted spawning occurs (Richardson
187
6
8
10
12
14
Outer coastCoos Bay
Up
wel
ling
ind
ex
–300
–200
–100
0
100
200
300
Alo
ng-s
hore
win
d s
tres
s(d
yn c
m–2
)
–1.0
–0.5
0. 0
0. 5
1. 0
1. 5
2. 0
Cro
ss-s
hore
win
d s
tres
s (d
yn c
m–2
)
–0.3
–0.2
–0.1
0. 0
0.1
0.2
0.3Along-shoreCross-shore
Apr ‘98 Jan ‘99 Jan ‘00 Jan ‘01
a)
b)
c)
Wat
er t
emp
erat
ure
(°C
)
Outer coastCoos Bay
(m3
s–1 p
er 1
00 m
coa
stlin
e)
r ‘ n r ‘
a)
b)
c)
Fig. 6. Time series of physical variables during study. (a) Averagedaily along-shore and cross-shore wind stress. Positive values arenorthward (along-shore) and eastward (cross-shore); negative val-ues are southward (along-shore) and westward (cross-shore). Dataare from NOAA’s C-MAN Stn CAR03 (43° 20’ 30’’ N, 124° 22’ 30’’ W).(b) Average daily upwelling indices at 45°N 125°W. (c) Averagedaily surface (0.6 m depth) water temperature (°C). Outer coastdata are from NOAA buoy #46027 (41° 51’ 01’’ N, 124° 22’ 52’’ W),and estuarine data are from NOAA Stn #9432780 (43° 20’ 42’’ N,
124° 19’ 21’’ W)
Mar Ecol Prog Ser 305: 177–191, 2005
1981). During winter months the Davidson Current(Inshore Counter Current), which is the predominantalong-shore flow nearshore in Oregon, flows north-ward. Therefore, transport toward Coos Bay from moresoutherly locations is possible. If this is the case, these2 subpopulations overlap geographically in their useof Coos Bay. Their residence, however, appears to bedistinctly separated in time.
Interannual abundance
In 1999, the catch of the winter spawners Apo-dichthys flavidus, Ascelichthys rhodorus, and theSebastes spp. was relatively large, and the catch of En-
graulis mordax and Sardinops sagax, which have moreprotracted spawning periods that typically begin laterin the year, was relatively small compared with theother 2 years of data. Although 1999 is characterized asa strong La Niña year, the lack of any significant cross-correlations between catch and the physical variablesexamined makes it difficult to determine if the ob-served interannual variation in species abundancereflects actual differences in abundance or possiblydifferent transport and/or movement patterns. Onenotable difference is that the mean and variance of thealong-shore wind stress for the first 100 d of the yearwere greater in 1999 (0.84 ± 1.4 dyn cm–2) than theother years (average = 0.28 ± 0.50 dyn cm–2). Greaterwind stress during winter potentially resulted in
188
Table 6. Engraulis mordax, Sardinops sagax, and Hypomesus pretiosus. Cross-correlations (lags: r value at that lag) betweenabundance of the 3 species at Coos Bay light trap locations and physical variables. Lags in days; peaks in species occurred(+) before or (–) after changes in physical variable. Only statistically significant (p ≤ 0.05) cross-correlations are presented.
ns: no statistical significance; na: insufficient data for analysis. Collection location and year are included
Along-shore Cross-shore Upwelling index Maximum tidal rangewind stress wind stress
Northern anchovy (Engraulis mordax)Entrance
1998 –2 d: +0.170 ns –3 d: –0.159 ns1999 na na na na2000 ns ns –6 d: –0.146, –7 d: –0.203 +4 d: –0.210, +5 d: –0.234
–2 d: +0.234, –3 d: +0.2362001 na na na na
Mid-Slough2000 ns ns ns +4 d: –0.205, +5 d: –0.248
–1 d: +0.207, –2 d: +0.2172001 ns ns ns +1 d: –0.323, +2 d: –0.394
–3 d: +0.235, –4 d: +0.332Upper Slough
2001 ns ns ns +0 d: –0.389, +2 d: –0.411–4 d: +0.355, –6 d: +0.450
Pacific sardine (Sardinops sagax)Entrance
1998 –1 d: +0.155 ns –1 d: –0.178, –2 d: –0.184 +2 d: –0.243, +3 d: –0.293–4 d: +0.170, –5 d: +0.199
1999 na na na na2000 na na na na2001 na na na na
Mid-Slough2000 –3 d: +0.137
–4 d: +0.152 ns ns +0 d: +0.160, –1 d: +0.1592001 ns ns ns +0 d: –0.142, +1 d: –0.155
+7 d: +0.202, +8 d: –0.198Surf smelt (Hypomesus pretiosus)Entrance
1998 na na na na1999 na na na na2000 –5 d: +0.149 ns –6 d: –0.205, –7 d: –0.202 –3 d: +0.170, –4 d: +0.1602001 ns ns ns ns
Mid-Slough2000 ns +0 d: +0.173
– 1 d: +0.203 ns +0 d: +0.210, –1 d: +0.1902001 ns ns –6 d: –0.140, –7 d: –0.174 ns
Upper Slough2001 ns ns ns –8 d: –0.341
Miller & Shanks: Larval and juvenile fish in Coos Bay, Oregon
enhanced downwelling that could have contributed toenhanced estuarine ingress and/or retention of thewinter spawned larvae. It is unclear, however, whyE. mordax and S. sagax catches were lower.
Relative abundance and size
The catch of Engraulis mordax, Sardinops sagax,Hypomesus pretiosus, and Apodichthys flavidus attrap locations farther up the estuary was significantlyand positively cross-correlated, with catch lower in theestuary, suggesting that individuals moved up theestuary shortly after arrival at the Entrance site. In2000 and 2001, however, peaks in the catch of S. sagaxat sample locations farther up-estuary also occurred1 d prior to peaks lower in the estuary. This may indi-cate a preferential use of areas farther up the estuary.Alternatively, some juvenile S. sagax may remain inthe South Slough arm of Coos Bay for extended peri-ods. If this were the case, however, one would expecttheir average size to increase and observed sizes weresimilar at both locations in 2000 and 2001.
Generally, the annual average daily fish size was sim-ilar between and among sites for the dominant speciescollected. In some cases, larger fish were collected far-ther up estuary, i.e. Apodichthys flavidus in 2000 andHypomesus pretiosus in 2000 and 2001. These data sug-gest that, at least for some species, individuals movedup-estuary after their initial entrance. The occurrence oflarger individuals farther up estuary may be due tohigher growth rates, enhanced tidal-stream transport byolder juveniles with enhanced swimming ability, theingress of smaller individuals into the estuary, or a com-bination of such factors (Laprise & Dodson 1989, Kimuraet al. 2000, Forward & Tankersley 2001).
Transport and estuarine ingress
Although the catch data indicate larvae and juvenileswere more abundant in the estuary during the down-welling season, there was minimal evidence for down-welling-related transport. For example, there were nosignificant cross-correlations between indicators ofdownwelling events and the abundance of Apodichthysflavidus or Ascelichthys rhodorus and infrequent, rela-tively weak cross-correlations for Engraulis mordax,Sardinops sagax, and Hypomesus pretiosus. There wasno evidence for upwelling-related transport. Significantcross-correlations between species abundance and thespring–neap tidal cycle were more consistent.
At times, the relationship between catch and tidalstage was consistent among species. At Mid-Slough in2000, for example, peaks in all 3 species were associ-
ated with spring tides. Similarly, at the Entrance in2000, peaks in the abundance of Engraulis mordax andHypomesus pretiosus were associated with springtides. This may occur, in part, via selective tidal-streamtransport (STST). Numerous studies have documentedSTST in estuaries (Laprise & Dodson 1989, Kimura etal. 2000, Forward & Tankersley 2001), and modelingefforts have demonstrated that net horizontal displace-ment of zooplankton may occur in the presence ofoscillatory tidal currents and diel vertical migrations(Hill 1998). Another potential mechanism of shorewardtransport is non-linear internal tides and bores.Increased concentrations of larval fish and inverte-brates (Shanks 1983, 1998, Pineda 1991), juvenile fish(Kingsford & Choat 1986), and small adult fish(Rogachev et al. 1996) have been observed in slicksassociated with internal waves and bores. In somecases, the shoreward transport of material concen-trated in slicks associated with internal waves wasobserved directly (Shanks 1983, 1988) or tidal frequen-cies in the nearshore abundance of larval invertebratesand fish were identified (Shanks 1983, Pineda 1991,1994, Shanks 1998). Therefore, it is possible that acombination of STST and non-linear internal tides andbores contributed to the abundance patterns observedin this study. Overall, these data indicate that the pres-ence of larval and juvenile fish within Coos Bay mayhave been regulated more by tidally-driven, ratherthan wind-driven, transport.
Although we only considered larval and juvenile fishcollected in light traps in the lower estuary, we canmake some regional comparisons. In a comprehensivereview of estuarine salt marsh fishes, Nordlie (2003)found marine transients to comprise the largest com-ponent of fish collected in estuaries (52.3%), followedby marine nursery (17.7%), freshwater transients(15.2%), permanent residents (9.3%), and diadromousfishes (5.5%). Similarly, marine transients and marinenursery species comprised the 2 largest fractions of fishcollected in South African estuaries (Nordlie 2003). Ofthe 28 species identified in this study, 3 are marine spe-cies that are known to use estuaries as nursery areas:topmelt Atherinops affinis, staghorn sculpin Leptocot-tus armatus, and English sole Parophrys vetulus (Bot-tom et al. 1987). This does not necessarily mean thesespecies are estuarine dependent, although there issuch evidence for P. vetulus (Boehlert & Mundy 1987),but they can be considered to use the estuary as a nurs-ery. Additionally, although not technically estuarinedependent and considered here to be a marine tran-sient, the tube snout Aulorhynchus flavidus may verywell function as a permanent estuarine resident. Thus,88.5% of the species collected in this study can be con-sidered marine transient with the remaining 11.5% asmarine nursery. No freshwater transients or diadro-
189
Mar Ecol Prog Ser 305: 177–191, 2005
mous species were collected in this study. Further-more, Nordlie (2003) reported that Engraulidae andClupeidae are among the most widely distributed fam-ilies found in estuaries. There were 3 representativesof these families collected in this study: 1 fromEngraulidae and 2 from Clupeidae.
The potential nursery function of Coos Bay is diffi-cult to determine without additional information fromareas outside of the estuary. In 2000, simultaneous col-lections of Engraulis mordax were made at an outercoastal and estuarine site (Miller & Shanks 2004). Inthat case, significantly more E. mordax were collectedat the outer coast compared to the estuary. In the cur-rent study, however, relatively large numbers of larvalApodichthys flavidus and Ascelichthys rhodorus werepresent in Coos Bay for 2 to 3 mo while juvenile E. mor-dax and Hypomesus pretiosus were often presentthroughout much of the year. It would be premature toconclude that Coos Bay does not provide nursery areasfor some of these species without additional informa-tion on growth and survival.
We conclude, as did Doherty (1987), that light trapsare selective but useful devices for determining thedistribution and relative abundance of larval and juve-nile fishes. These results further support the utility oflight traps in temperate estuaries (Hickford & Schiel1999, Strydom 2003, Miller & Shanks 2004). The rela-tive abundance patterns we observed indicate sea-sonal and spatial variation in estuarine use and poten-tially extended residence periods for some species.Certain species — Apodichthys flavidus, Ascelichthysrhodorus, and Engraulis mordax — were collected atsmall sizes (10, 26, and ≤30 mm, respectively) in dis-crete pulses that were temporally coherent amongyears. Additionally, there were numerous indicationsof shoreward transport and/or estuarine ingressthrough tidally-driven transport processes but lesssupport for wind-driven transport. Overall, the evi-dence presented here indicates that the presence ofthe larval and juvenile fish collected within Coos Baymay have been primarily regulated by a combinationof tidally-driven transport and reproductive timing.
Acknowledgements. Field assistance was provided byE. Backus, A. McCulloch, A. Puls, K. Zosel, J. Tyson, J. April,and D. Williams. Valuable suggestions and encouragementwere generously supplied by C. Roegner. We appreciate thehelpful comments of T. Miller and 2 anonymous reviewers.This research was funded by an ERD, OOCRM, NOS, NOAAgrant to J.A.M. and an NSF SGER to A.L.S.
LITERATURE CITED
Able KW, Fahay MP (1998) The first year in the life of estuar-ine fishes in the Middle Atlantic Bight. Rutgers UniversityPress, New Brunswick, NJ
Beck MW, Heck KLJ, Able KW, Childers DL and 9 others(2001) The identification, conservation, and managementof estuarine and marine nurseries for fish and inverte-brates. Bioscience 51:633–641
Boehlert GW, Mundy BC (1987) Recruitment dynamics ofmetamorphosing English sole, Parophrys vetulus, toYaquina Bay, Oregon. Estuar Coast Shelf Sci 25:261–281
Boehlert GW, Mundy BC (1988) Roles of behavioral and phys-ical factors in larval and juvenile fish recruitment to estu-arine nursery areas. Am Fish Soc Symp 3:51–67
Bottom DL, Jones KK, Rodgers JD (1987) Fish communitystructure, standing crop, and production in upper SoughSlough (Coos Bay), Oregon. NOAA Tech Rep No SOS1–88, Portland
Cury P, Roy C (1989) Optimal environmental window andpelagic fish recruitment success in upwelling areas. Can JFish Aquat Sci 46:670–680
Doherty PJ (1987) Light-traps: selective but useful devices forquantifying the distributions and abundances of larvalfishes. Bull Mar Sci 41:423–431
Elliott M, Hemingway KL (2002) Fishes in estuaries. Black-well, London
Emery WJ, Thomson RE (1997) Data analysis methods inphysical oceanography. Pergamon, Oxford
Epifanio CE, Garvine RW (2001) Larval transport on theAtlantic continental shelf of North America: a review.Estuar Coast Shelf Sci 52:51–77
Fisher JP, Pearcy WG (1990) Distribution and residence timesof juvenile fall and spring chinook salmon in Coos Bay,Oregon. Fish Bull (Wash DC) 88:51–58
Forward RB, Tankersley RA (2001) Selective tidal-streamtransport of marine animals. Oceanogr Mar Biol Annu Rev39:305–353
Goodrich DM, van Montfrans J, Orth RJ (1989) Blue crabmegalopal influx to Chesapeake Bay: evidence for a wind-driven mechanism. Estuar Coast Shelf Sci 29:247–260
Haedrich RL (1983) Estuarine fishes. In: Ketchum BH (ed)Ecosystems of the world 26, Estuaries and enclosed seas.Elsevier, New York, p 187–207
Haertel L, Osterberg C (1967) Ecology of zooplankton, ben-thos and fishes in the Columbia River estuary. Ecology 48:459–472
Healey MC (1982) Juvenile Pacific salmon in estuaries: thelife support system. In: Kennedy VS (ed) Estuarine com-parisons. Academic Press, New York, p 315–341
Hickford MJH, Schiel DR (1999) Evaluation of the perfor-mance of light traps for sampling fish larvae in inshoretemperate waters. Mar Ecol Prog Ser 186:293–302
Hill AE (1998) Diel vertical migration in stratified tidal flows:implications for plankton dispersal. J Mar Res 56:1069–1096
Huyer A, Sobey EJC, Smith RL (1979) The spring transition incurrents over the Oregon continental shelf. J Geophys ResC 84:6995–7011
Kimura R, Secor DH, Houde ED, Piccoli PM (2000) Up-estuarydispersal of young-of-the-year bay anchovy Anchoamitchilli in the Chesapeake Bay: inferences from micro-probe analysis of strontium in otoliths. Mar Ecol Prog Ser208:217–227
Kingsford M, Choat JH (1986) The influence of surface slickson the distribution and onshore movement of small fish.Mar Biol 91:161–171
Kucas ST Jr (1986) Species profiles: life histories and environ-mental requirements of coastal fishes and invertebrates(Pacific southwest) — northern anchovy. U.S. Fish WildlServ Biol Rep 82
Laprise R, Dodson JJ (1989) Ontogeny and importance of tidal
190
Miller & Shanks: Larval and juvenile fish in Coos Bay, Oregon
vertical migrations in the retention of larval smeltOsmerus mordax in a well-mixed estuary. Mar Ecol ProgSer 55:101–111
Lasker R (1974) Field criteria for survival of anchovy larvae:the relation between inshore chlorophyll maximum layersand successful first feeding. Fish Bull US 73:453–462
Love MS (1996) Probably more than you want to know aboutthe fishes of the Pacific Coast. Really Big Press, Santa Bar-bara, California
Milicich MJ, Doherty PJ (1994) Larval supply of coral reef fishpopulations: magnitude and synchrony of replenishmentto Lizard Island, Great Barrier Reef. Mar Ecol Prog Ser110:121–134
Miller BA, Sadro S (2003) Residence time and seasonal move-ments of juvenile coho salmon in the ecotone and lowerestuary of Winchester Creek, South Slough, Oregon.Trans Am Fish Soc 132:546–559
Miller JA, Shanks AL (2004) Ocean-estuary coupling in theOregon upwelling region: abundance and transport ofjuvenile fish and of crab megalopae. Mar Ecol Prog Ser271:267–279
Mistano DA (1977) Species composition and relative abun-dance of larval and post-larval fishes in the ColumbiaRiver estuary, 1973. Fish Bull (Wash DC) 75:218–222
Monaco ME, Lowery TA, Emmett RL (1992) Assemblages ofthe U.S. west coast estuaries based on the distribution offishes. J Biogeogr 19:251–267
Mooers CNK, Collins CA, Smith RL (1976) The dynamicstructure of the frontal zone in the coastal upwellingregion off Oregon. J Phys Oceanogr 6:3–21
Munch SB, Conover DO (2000) Recruitment dynamics ofbluefish (Pomotomus saltatrix) from Cape Hatteras toCape Cod. ICES J Mar Res 57:393–402
Nordlie FG (2003) Fish communities of estuarine salt marshesof eastern North America, and comparisons with temper-ate estuaries of other continents. Rev Fish Biol Fish 13:281–325
Parrish RH, Nelson CS, Bakun A (1981) Transport mecha-nisms and reproductive success of fishes in the CaliforniaCurrent. Biol Oceanogr 1:175–203
Pearcy WG, Myers SS (1973) Larval fishes of Yaquina Bay,Oregon: a nursery ground for marine fishes? Fish Bull(Wash DC) 72:201–213
Peterman RM, Bradford MJ, Lo NCH, Methot RD (1988) Con-tribution of early life stages to interannual variability inrecruitment of northern anchovy (Engraulis mordax). CanJ Fish Aquat Sci 45:8–16
Petersen CW, Zarrella KA, Ruben CA, Mazzoldi C (2004)
Reproductive biology of the rosylip sculpin, an intertidalspawner. J Fish Biol 64:868–875
Pineda J (1991) Predictable upwelling and the shorewardtransport of planktonic larvae by internal tidal bores. Sci-ence 253:548–551
Pineda J (1994) Internal tidal bores in the nearshore: warm-water fronts, seaward gravity currents and the onshoretransport of neustonic larvae. J Mar Res 52:427–458
Richardson SL (1981) Spawning biomass and early life historyof northern anchovy, Engraulis mordax, in the northernsubpopulation off Oregon and Washington. Fish Bull(Wash DC) 78:855–876
Roegner GC, Shanks AL (2001) Import of coastally-derivedchlorophyll a to South Slough, Oregon. Estuaries 24:244–256
Roegner GC, Hickey BM, Newton JA, Shanks AL, ArmstrongDA (2002) Wind-induced plume and bloom intrusions intoWillapa Bay, Washington. Limnol Oceanogr 47:1033–1042
Rogachev KA, Salomatin AS, Carmack EC (1996) Concentra-tion of pelagic organisms at mesoscale fronts in the west-ern subarctic Pacific: small fish on long waves. FishOceanogr 5:153–162
Shanks AL (1983) Surface slicks associated with tidally forcedinternal waves may transport pelagic larvae of benthicinvertebrates and fishes shoreward. Mar Ecol Prog Ser 13:311–315
Shanks AL (1988) Further support for the hypothesis thatinternal waves can cause shoreward transport of larvalinvertebrates and fish. Fish Bull (Wash DC) 86:703–714
Shanks AL (1995) Mechanisms of cross-shelf dispersal of lar-val invertebrates and fish. In: McEdward L (ed) Ecology ofmarine invertebrate larvae. CRC Press, New York,p 323–367
Shanks AL (1998) Abundance of post-larval Callinectessapidus, Penaeus spp., Uca spp., and Libinia spp. collectedat an outer coastal site and their cross-shelf transport. MarEcol Prog Ser 168:57–69
Strub PT, Allen JS, Huyer A, Smith RL (1987) Seasonal cyclesof currents, temperatures, winds, and sea level over thenortheast Pacific continental shelf: 35° N to 48° N. J Geo-phys Res 92:1507–1526
Strub PT, James C (2000) Altimeter-derived variability of sur-face velocities in the California Current System: 2. Sea-sonal circulation and eddy statistics. Deep-Sea Res II 47:831–870
Strydom NA (2003) An assessment of habitat use by larvalfishes in a warm temperate estuarine creek using lighttraps. Estuaries 26:1310–1318
191
Editorial responsibility: Otto Kinne (Editor-in-Chief),Oldendorf/Luhe, Germany
Submitted: November 2, 2004; Accepted: July 15, 2005Proofs received from author(s): November 22, 2005