abundance of ‘indicator’ species - groundtruth.co.nz · 127 abundance of ‘indicator’...
TRANSCRIPT
127
ABUNDANCE OF ‘INDICATOR’ SPECIES
The indicator
What is it?The relative or absolute abundance of a particular ‘indicator’ species or group of species.
DiscussionThere are many situations when the abundance of a particular species or group of specieswill be important as indicators. The abundance of seedlings and saplings of species that arehighly palatable to introduced browsing animals may be assessed to indicate how successfulanimal control operations have been in improving understorey condition.
It is often useful to monitor species that are an important food source for birds or areimportant canopy species.
Species or groups of species that are selected as indicators will vary from site to sitedepending on the species present and management objectives. The key issues section belowidentifies some important considerations in selecting indicator species.
Some key issuesSelection of appropriate species is important. Some important features are:
● Relevant to the issue you are interested in – for example, are browsed by introduced
animals, an important food source for birds, etc.
● Sufficiently common that you will be able to locate it readily.
● Has either a sufficient local seed source or source of vegetative propagation (for example,
underground stem rhizomes, or stems for epicormic shoots). Without this, it may need to re-colonise the area, which can be very slow.
● Has a sufficient growth rate so changes will occur quickly.
Be careful using the same indicator species in different areas. Aspects such as browsepreference for different species can vary greatly between areas.
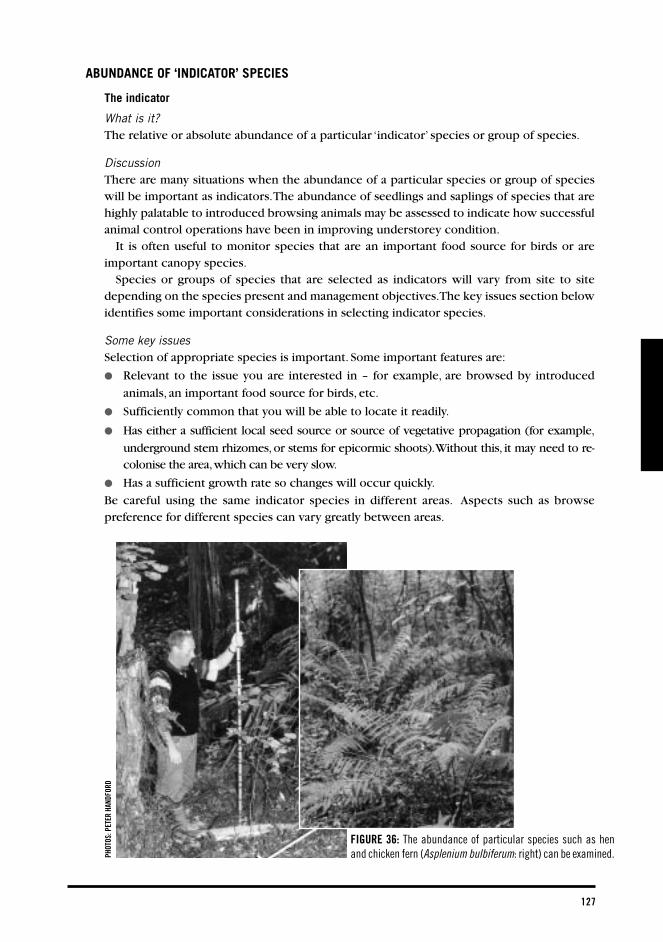
FIGURE 36: The abundance of particular species such as henand chicken fern (Asplenium bulbiferum: right) can be examined.PH
OTOS
: PET
ER H
ANDF
ORD
NATIVE FOREST MONITORING128
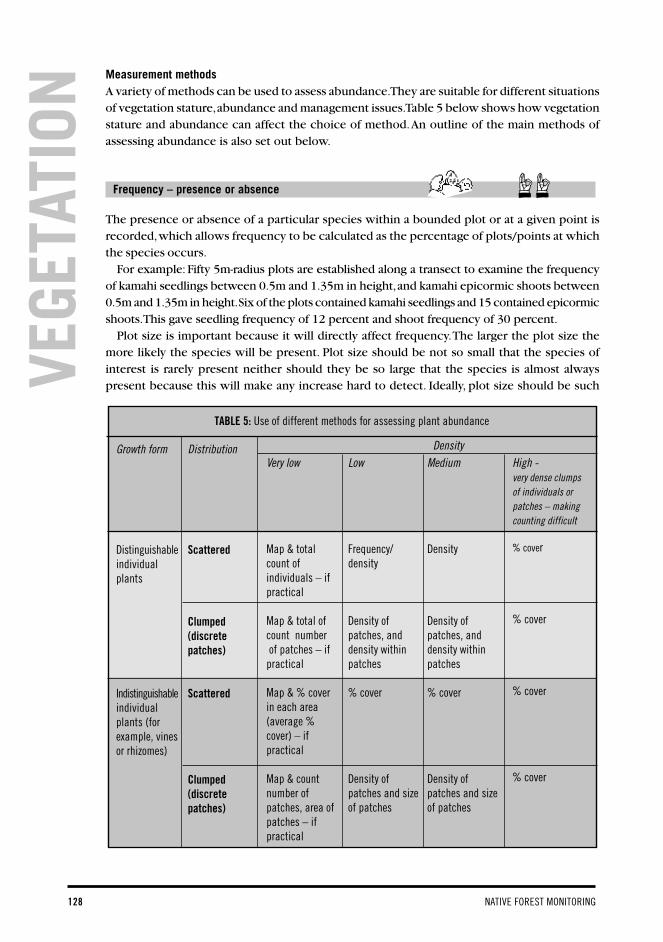
Measurement methodsA variety of methods can be used to assess abundance. They are suitable for different situationsof vegetation stature, abundance and management issues. Table 5 below shows how vegetationstature and abundance can affect the choice of method. An outline of the main methods ofassessing abundance is also set out below.
Frequency – presence or absence
The presence or absence of a particular species within a bounded plot or at a given point isrecorded, which allows frequency to be calculated as the percentage of plots/points at whichthe species occurs.
For example: Fifty 5m-radius plots are established along a transect to examine the frequencyof kamahi seedlings between 0.5m and 1.35m in height, and kamahi epicormic shoots between0.5m and 1.35m in height. Six of the plots contained kamahi seedlings and 15 contained epicormicshoots. This gave seedling frequency of 12 percent and shoot frequency of 30 percent.
Plot size is important because it will directly affect frequency. The larger the plot size themore likely the species will be present. Plot size should be not so small that the species ofinterest is rarely present neither should they be so large that the species is almost alwayspresent because this will make any increase hard to detect. Ideally, plot size should be such
TABLE 5: Use of different methods for assessing plant abundance
Growth form
Distinguishableindividualplants
Indistinguishableindividualplants (forexample, vinesor rhizomes)
Distribution
Scattered
Clumped(discretepatches)
Scattered
Clumped(discretepatches)
Very low
Map & totalcount ofindividuals – ifpractical
Map & total ofcount number of patches – ifpractical
Map & % coverin each area(average %cover) – ifpractical
Map & countnumber ofpatches, area ofpatches – ifpractical
Low
Frequency/density
Density ofpatches, anddensity withinpatches
% cover
Density ofpatches and sizeof patches
Medium
Density
Density ofpatches, anddensity withinpatches
% cover
Density ofpatches and sizeof patches
High -very dense clumpsof individuals orpatches – makingcounting difficult
% cover
% cover
% cover
% cover
Density
VEGE
TATI
ON

129
that a frequency of between about 10 percent and 60 percent is obtained. The same plot sizemust be used for any comparisons between areas or over time. Using the same permanentlymarked plots is also advised (see ‘What is the advantage of re-measuring change …’, p.97)
This is a relatively quick and easy method, generally involving a low level of measurementskill. However it does not involve assessing the ‘amount’ of a species at a sample plot/point soit can be less effective at picking up small changes than cover or density-based methods.
Comments
● Quick and simple to measure
● Selection of plot size is very important
● Can pick up large changes when densities are quite low
● Not as good at picking up small changes
Density
This is normally assessed using bounded plots. All individuals (for example, tree stems, orground fern crowns etc) are counted within the plot area. Abundance is then described asindividuals per square metre, or per hectare.
For example: A 20m X 4m (80m2) plot was assessed to examine the abundance of pigeonwoodseedlings and saplings. This formed part of a monitoring programme involving several plotsthrough the forest area. A thorough search of the plot revealed 18 seedlings and eight saplings.This gave the following densities for this plot:
Per plot Seedling 18
Sapling 8
Per square metre Seedling 18/80 0.23
Sapling 8/80 0.1
Per hectare (1 hectare Seedling 18x10,000/80 2250
= 10,000 m2) Sapling 8x10,000/80 1000
Comments
● Provides simple objective data
● Can be a time-consuming method
● Selection of plot size is important (see ‘What plot size’, p.99)
Biomass
This is the total weight or quantity of living material. It is not generally practical to measure thisdirectly for plants so it is usually estimated indirectly through relationships to more easilymeasured parameters such as diameter of tree stems, crown diameter of shrubs or canopycover (Spurr & Warburton 1991).
Biomass is not generally used in practical regular monitoring because of these complexities.It can be a useful measure for identifying primary production in scientific studies, or examiningcarbon storage. Such studies normally include forest floor material as well.
NATIVE FOREST MONITORING130
Comments References
● Considerable effort required to obtain good Spurr & Warburton 1991
accurate data
● Data useful for scientific studies
Cover
Commonly this relates to the percentage of cover of an area of the forest canopy, forest floor,or of a specified height tier. Absolute area of cover, usually in square metres, may sometimesbe measured if monitoring, for example, the spread of a particular patch of weeds.
Percentage cover can be measured by any of the methods described under ‘Canopy Cover’p. 113-117 above. As discussed in that section, visual estimates of cover have a low level ofprecision and are only suitable for picking up large changes. Point intercept methods canprovide greater precision.
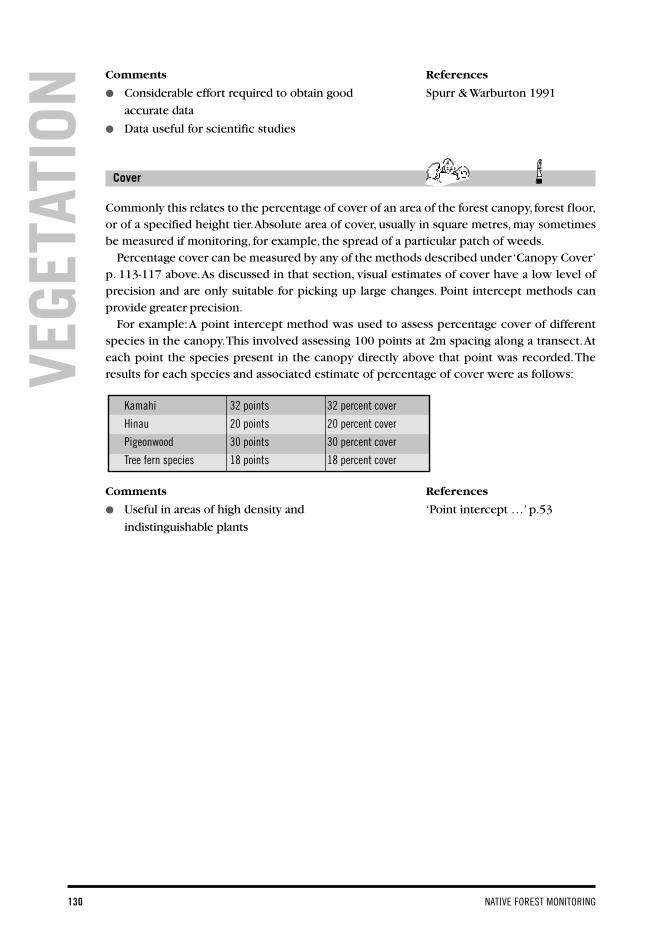
For example: A point intercept method was used to assess percentage cover of differentspecies in the canopy. This involved assessing 100 points at 2m spacing along a transect. Ateach point the species present in the canopy directly above that point was recorded. Theresults for each species and associated estimate of percentage of cover were as follows:
Kamahi 32 points 32 percent cover
Hinau 20 points 20 percent cover
Pigeonwood 30 points 30 percent cover
Tree fern species 18 points 18 percent cover
Comments References
● Useful in areas of high density and ‘Point intercept …’ p.53
indistinguishable plants
VEGE
TATI
ON
131
DISTRIBUTION OF KEY SPECIES/UNCOMMON SPECIES
The indicator
What is it?The distribution of important or rare plant species.
DiscussionThis indicator becomes particularly important if a particular species is localised or present as smallpatches in particular locations (for example, New Zealand mistletoe). In these situations its presenceat certain locations becomes more important because density across thewhole area may be too low to measure.
Maintenance of the species at locations and increase or decrease inthe number of locations where the species is present can be monitoredas well as changing locations of a species.
This indicator can also be of particular importance with weed speciesthat are new infestations, if their occurrence and spread are important.
Some key issues
● Intensity (area covered and effort) of searching needs to be similar
to make valid comparisons of changes in distribution over time, orbetween areas.
● What scale should distribution be assessed at? This needs to be
determined depending on factors such as how large an area thespecies is spread over, and how precisely you need to know individuallocations.
Measurement methodsMeasuring changes in the distribution of a species will help identify changes in the size of thetotal population as well as its relative density or cover. For example, an examination usingplots through a forest reserve where a species is present may show that the density of individualsremains constant. However, a wider examination of distribution throughout the whole regionmay show the species is declining. It may be disappearing from some areas while remainingunaffected at others.
If a species is uncommon, widespread random sampling to assess cover or density will be oflittle help because the species will seldom, if ever, be encountered (see also Table 5). In thesesituations mapping of scattered individuals or groups of the species may be more appropriate.
It is also important to identify if both adults and juveniles are present when assessingdistribution (see also ‘Population structure’, p.136). This can give an indication of whether thepopulation is increasing or declining.
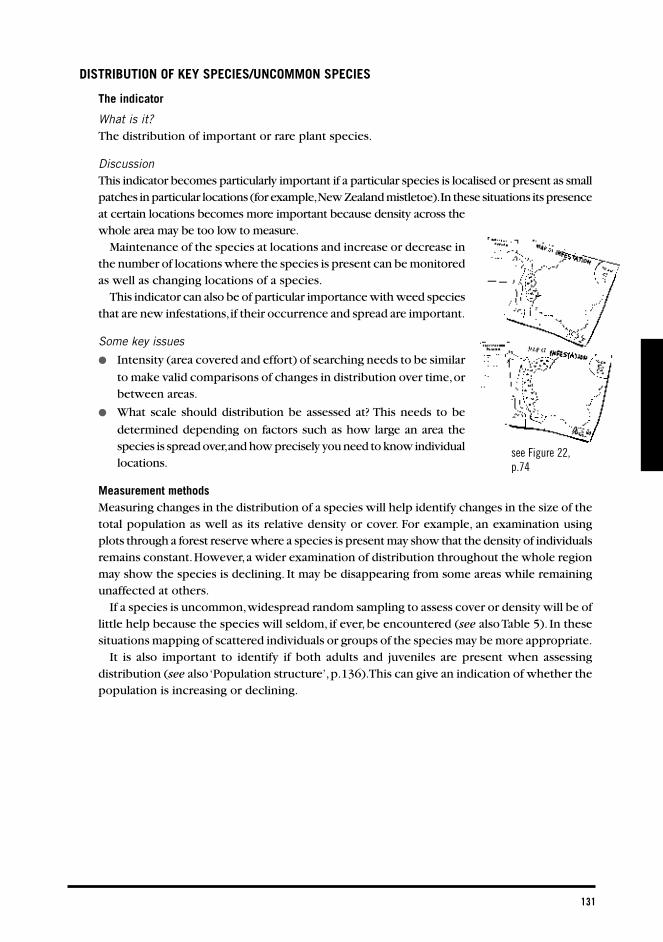
see Figure 22,p.74
NATIVE FOREST MONITORING132
Mapping
Thorough searching of an area is undertaken to identify locations of individuals or localisedpopulations. These are then mapped at a scale sufficient to allow their easy relocation in thefield. The suitability of different mapping scales will depend on what is being mapped. If a 50-hectare area of a rare canopy species is being identified, then mapping on 1:50,000 maps maybe appropriate. If you are examining locations of individual rare plants or patches of plantsaerial photographs of 1:5000 or larger scale may be appropriate.
Comments
● Choice of mapping scale is important
● If accurate coordinates are present (for example, from GPS), a smaller scale may be used
● When comparing distribution, intensity of searching must be similar
Total counts/absolute cover
Total known individuals over an area or within a localised population may be counted, orabsolute cover determined (see ‘Understorey abundance’, p.128 and Table 5), whereappropriate. Marking of individuals or small populations on the ground (for example, withmarker pegs, or tags) may be necessary to ensure they can be relocated. Total numbers/covercan be monitored at regular intervals to identify changes.
For example, a manager wants to examine changes in mistletoe distribution between twoareas, one with possum control, one without. Both areas are thoroughly searched for mistletoebefore a possum control operation. Mistletoe locations are identified on 1:10,000 scale aerialphotographs, and written notes are kept on how to locate each plant. One year after thecontrol operation, the area is searched again to relocate the plants. In the control area, 24 ofthe original 26 plants were still present, and an additional three were found. In the no-controlarea, only 16 of the original 22 plants were still present, and no new plants were found.
Comments
● Thorough and consistent search effort required
● Very effective for rare species of well-known distribution
VEGE
TATI
ON
133
FLOWERING AND FRUITING OF KEY SPECIES
The indicator
What is it?The amount of fruiting or flowering of key species, sometimes including other features suchas damage to fruit or flowers.
DiscussionThe amount of flowering and fruiting can be useful and important indicators for several reasons:● Very important to examining the ongoing reproduction of the plant species involved.● Important high quality food sources for birds which can affect their breeding success.● Some (particularly certain larger fruits – eg, hinau) are important food sources for introduced
vertebrates, particularly the possum, affecting their fat levels and condition (Cowan 1990).● As it requires considerable resources for a plant to produce flowers and fruit, consequently,
sustained improvements in the level of fruiting and flowering can sometimes indicate animprovement in overall plant health.
Individual New Zealand native plant species vary considerably from year to year in their levelof flowering and fruiting, sometimes with higher fruiting levels every two to five years, withsome years of nil or very low levels of flowering and fruiting (West 1986, Leathwick 1984,Dijkgraaf 1998). It is important that the impacts of these natural fluctuations are taken intoaccount when using this indicator to look at changes in relation to management.
Some key issues
● It is necessary to develop knowledge of the phenology cycles of the species involved.
● Select species that are easier to assess – for example, have conspicuous fruits and flowers,
and are significant to the ecosystem – for example, important food source for birds (seeappendix 3) or introduced vertebrates or important canopy species.
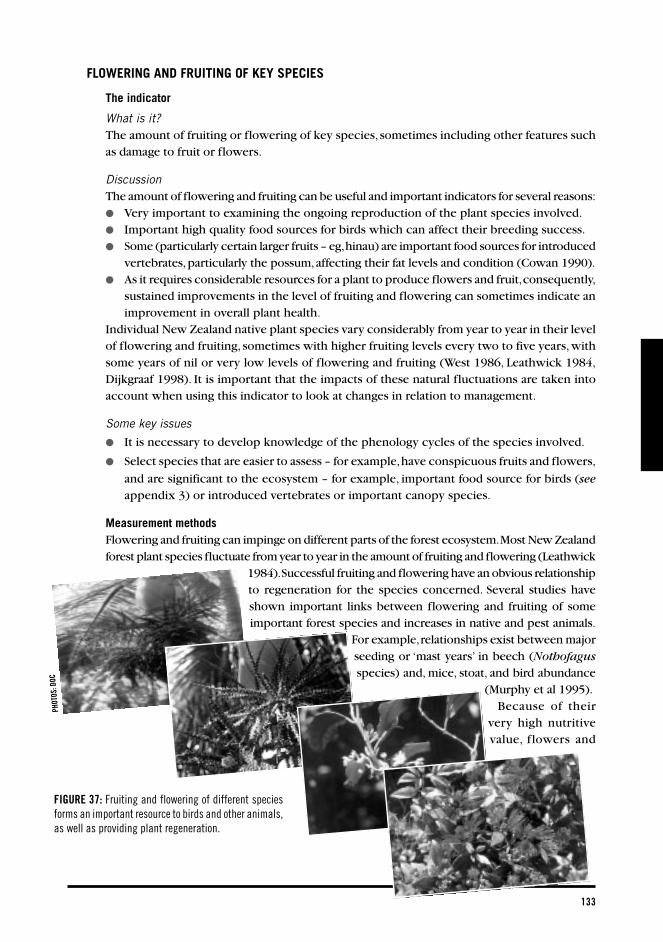
Measurement methodsFlowering and fruiting can impinge on different parts of the forest ecosystem. Most New Zealandforest plant species fluctuate from year to year in the amount of fruiting and flowering (Leathwick
1984). Successful fruiting and flowering have an obvious relationshipto regeneration for the species concerned. Several studies haveshown important links between flowering and fruiting of someimportant forest species and increases in native and pest animals.
For example, relationships exist between majorseeding or ‘mast years’ in beech (Nothofagusspecies) and, mice, stoat, and bird abundance
(Murphy et al 1995).Because of their
very high nutritivevalue, flowers and
FIGURE 37: Fruiting and flowering of different speciesforms an important resource to birds and other animals,as well as providing plant regeneration.
PHOT
OS: D
OC
NATIVE FOREST MONITORING134
fruits are often targeted by introduced browsers such as possums. Measures of the level of impacton flowers and fruit are important to identify the damage caused by pests such as possums.
Several simple approaches to the assessment of flowering and fruiting are possible (seeFigure 38).
Visual estimates
Regular visual assessment of flowering and fruiting of different plant species, and estimates of thepercentage of the canopy with fruit or flowers, can provide valuable early information. Monthlyrecords can be kept of a sample of individual trees, or through general assessment of an area offorest (see ‘Flowering and fruiting observation record’, p.57). As with most visual estimates, this willnot provide sufficient precision to identify small changes. However, it can be sufficient to pick upmajor flowering or fruiting events of significance to management.
Comments References
● Provides a general indication of timing, ‘Flowering and fruiting
and peak years observation record’, p.57
● It is important to calibrate visual estimates Leathwick 1984
year to year by taking photographs Williams & Karl 1996of fruiting and flowering Clout & Gaze 1984
Seed-fall counts
Direct counts of seed-fall can provide precise estimates of its abundance. Such methods aregenerally easier for species with larger fruits. Two suitable ways of gathering this informationare as follows:
Traps: Fixed litter fall traps can be constructed that collect fruit, flowers, leaves and otherlitter falling from above. These traps often involve some sort of large funnel on a stand abovethe ground that collects material and directs it into a removable ‘jar’. Simple traps can beconstructed by mounting a bucket on a stake under the tree. Measurement of the amount ofmaterial collecting in these traps, including a count of seeds/fruit is used to monitor changes.
Ground plots: A quicker, lower cost alternative is to establish small circular ground plotsbelow trees that are permanently marked. This method is only suitable for species with relativelylarge conspicuous fruit such as tawa, hinau, taraire, karaka, etc. A list of species for which thisapproach could be considered is given in ‘Ground plot monitoring of seed and fruit-fall’, p.62.In the plot, the fruit on the ground surface and among recently fallen litter is counted.
Other ground plot methods involving randomly located plots can also be used, as long asonly fresh fruit is counted.
Comments References
● Can provide a precise and objective measure ‘Ground plot monitoring of
● Does not require much skill as long as only seed and fruit-fall’, p.62
conspicuous, larger fruited species are examined West 1986Cowan & Waddington 1990Dijkgraaf 1998Burrows 1994Brockie 1992
VEGE
TATI
ON

135
FIGURE 38: Different methods of assessment of fruiting abundance.
NATIVE FOREST MONITORING136
POPULATION STRUCTURE
The indicator
What is it?The relative numbers of plants of one species in different age/growth classes.
DiscussionRelative numbers of adult and juvenile plants can be a useful indicator to help determine if aspecies is increasing, stable or in decline. If no juvenile plants are present, then there may besome concern about the regeneration of the species. With ongoing monitoring, the progressof development from one age/growth/size class to the next can be examined to identify ifnormal regeneration is occurring or if it is being hindered by some impact such as browsing.
It is important to understand the species being examined, in terms of what is a usualpopulation structure. Some light demanding species may have few seedlings present under afull canopy, but then have bursts of regeneration when the canopy opens after such events asdamage by wind storms.
When using this indicator to compare areas, they need to be similar, ideally only differing insome major agent that is causing change, such as much greater browsing animal numbers inone area. Without this consideration, it can become difficult to interpret the reasons fordifferences between areas.
Some key issues
● Identify the best way to examine different age/growth classes for the species concerned.
This may be by examining height classes, different growth phases (for example, juvenileand adult foliage), or diameter classes for woody species.
● Ensure age/growth/size classes being compared are the same.
● Understand the normal population structure of the species being examined.
● Only compare very similar forest areas.
Measurement methodsObtaining information on the population structure (number of juveniles and adults) of aparticular species provides indications of aspects such as regeneration and growth that identifyif a species is increasing, stable or in decline.
This involves examining the relative abundance of juveniles and adults, and changes inproportions over time. With tree species, we commonly expect many more seedlings andsaplings than adults, because many seedlings will die or are out-competed, leaving only asmall number to eventually grow into mature trees. In situations where seedlings and saplingsare present in relatively similar or lower numbers than adult trees, there may be some concernabout maintenance of a forest canopy.
Care must be taken in interpreting the results from these sorts of considerations becausesome species may only regenerate occasionally following major events such as wind-throw.Long cycles over decades may be occurring that are not immediately obvious and areindependent of current impacts. However, useful examinations of the same area over time orin relation to management changes, or between similar areas, can sometimes be made. If theimpact of browsing ungulates is important, useful comparisons can often be made betweenthe numbers of juveniles occurring in an exclosure, and the number outside. As discussed in‘Understorey abundance’, p.119, both man-made and natural exclosures, such as cliffs or gorges,where browsing pressure is excluded can be examined.
VEGE
TATI
ON
137
Height/size classes
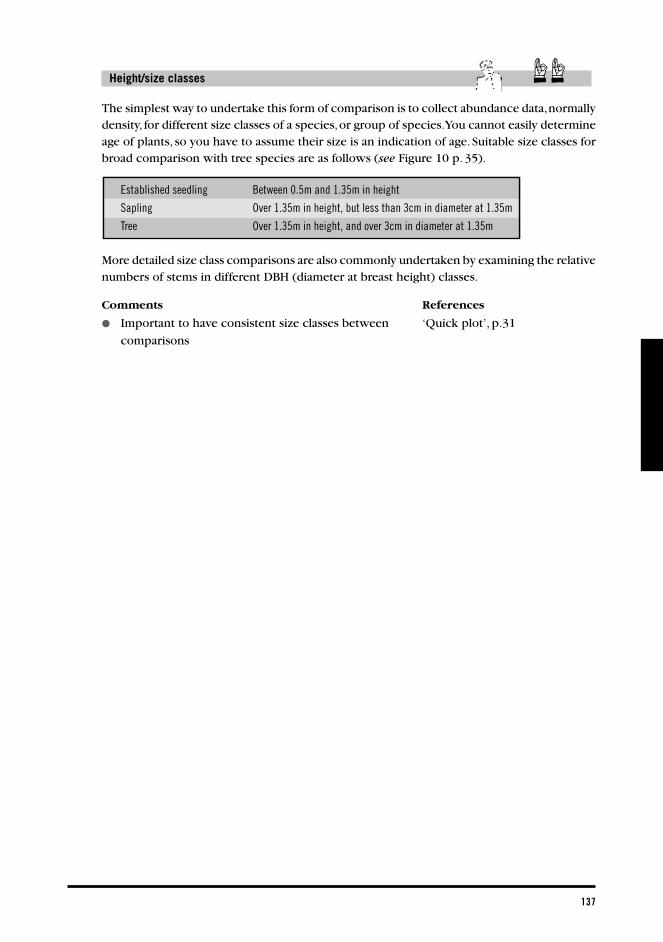
The simplest way to undertake this form of comparison is to collect abundance data, normallydensity, for different size classes of a species, or group of species. You cannot easily determineage of plants, so you have to assume their size is an indication of age. Suitable size classes forbroad comparison with tree species are as follows (see Figure 10 p. 35).
Established seedling Between 0.5m and 1.35m in height
Sapling Over 1.35m in height, but less than 3cm in diameter at 1.35m
Tree Over 1.35m in height, and over 3cm in diameter at 1.35m
More detailed size class comparisons are also commonly undertaken by examining the relativenumbers of stems in different DBH (diameter at breast height) classes.
Comments References
● Important to have consistent size classes between ‘Quick plot’, p.31
comparisons
NATIVE FOREST MONITORING138
MORTALITY
The indicator
What is it?The proportion of plants dying over a certain time period, within a certain age/size class.
DiscussionAll plant stems have a certain life span and then eventually die. The annual rate of this mortalityis an important indicator. An increase in the rate of mortality can indicate a decline in conditiondue to pests or diseases, or some other environmental factor. However it is essential to havesome understanding of the population dynamics of the species involved, before attempting touse this indicator. For example, a long-lived species may have a low natural rate of mortality,whereas a short-lived species may have high levels of mortality. Some even aged stands may haveoccasional periods of high mortality associated with normal growth cycles.
Examining the size/age classes in which mortality is occurring is also important. An increasein mortality in immature stems can be particularly important – because such stems are clearlynot dying from old age.
Some key issues
● Understand the population structure and dynamics for the species and area you are
examining.
● Identify the size/age classes in which mortality is occurring.
Measurement methodsSome methods of examining mortality are as follows.
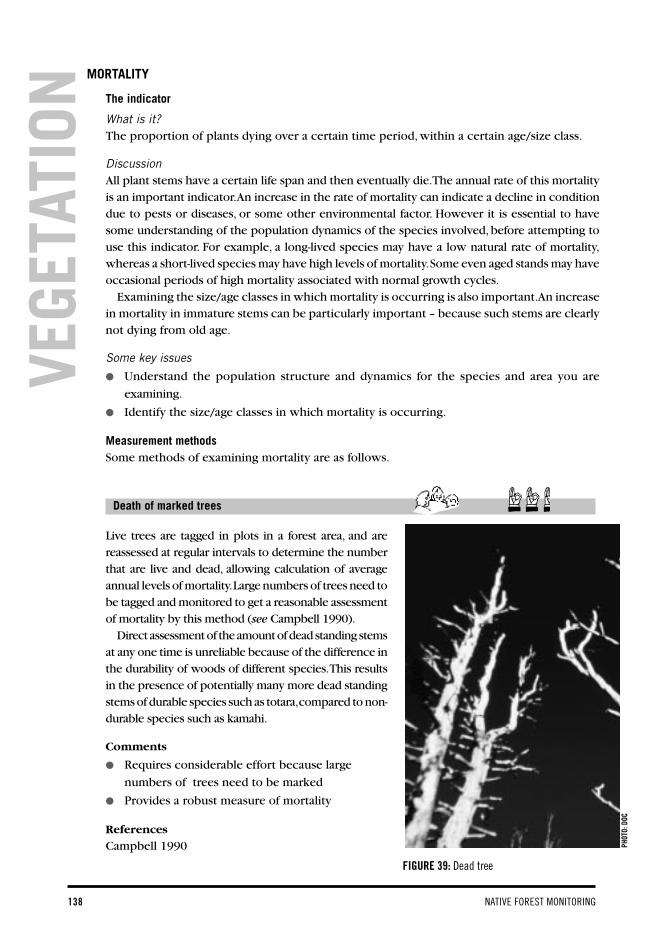
Death of marked trees
Live trees are tagged in plots in a forest area, and arereassessed at regular intervals to determine the numberthat are live and dead, allowing calculation of averageannual levels of mortality. Large numbers of trees need tobe tagged and monitored to get a reasonable assessmentof mortality by this method (see Campbell 1990).
Direct assessment of the amount of dead standing stemsat any one time is unreliable because of the difference inthe durability of woods of different species. This resultsin the presence of potentially many more dead standingstems of durable species such as totara, compared to non-durable species such as kamahi.
Comments
● Requires considerable effort because large
numbers of trees need to be marked
● Provides a robust measure of mortality
References
Campbell 1990
FIGURE 39: Dead tree
PHOT
O: D
OC
VEGE
TATI
ON
139
Change in total mortality over time
The proportion of total standing stems that are dead can be compared from assessment toassessment to identify if the relative amount of dead stems is changing. This relies on beingable to identify the species of dead stems – this is not always easy.
Comments
● A less reliable measure than reassessing marked stems
NATIVE FOREST MONITORING140
LITTER-FALL
The indicator
What is it?The total amount of annual litter-fall in an area of forest, often separated into twigs, leaf-fall,fruit and flowers.
DiscussionLitterfall provides an indication of total primary production or productivity of the forest. Thisvaries greatly between different types of forest, and declines with increasing latitude andincreasing altitude (Brockie 1992).
It may give some indication of the relative condition of similar areas of forest (Cowan &Waddington 1991), with more healthy areas producing a larger total amount of litter. Litter-fall also provides the food source for many invertebrates living on the forest floor, directlyimpacting these populations.
Litter accumulation on the forest floor is affected by the rate of decomposition, which isstrongly influenced by climate. Warm, moist areas have much faster decomposition than cold,dry areas.
The use of this indicator may have some potential, but needs to be treated carefully due tothe major variation naturally occurring between different forest areas in litter-fall and litterdecomposition.
Green litter of some palatable species is commonly eaten from the ground by introducedbrowsing animals when animal numbers are high, and preferred food is in short supply.
Some key issues
● Understand the litter cycles of the species being studied, for example, when peak litter-
fall occurs.
● Comparisons should only be undertaken with similar forests in a similar geographic and
climatic location.
Measurement methodsMethods involve the collection of litter and usually assessment of oven dry weight. Otherforms of field assessment, such as volume of loosely packed litter may be possible. Two possiblemethods of collecting leaf litter are identified below.
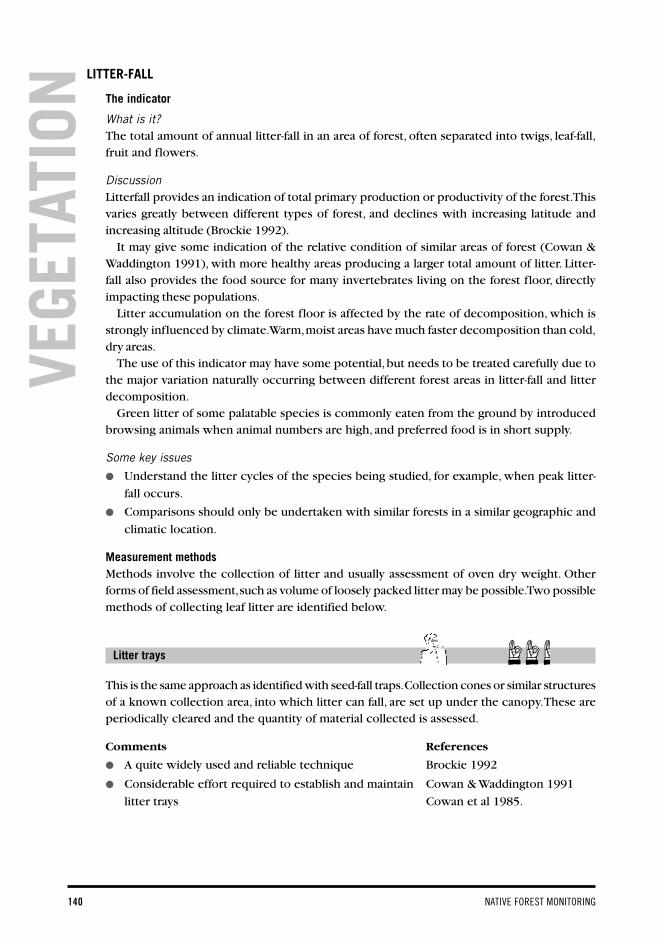
Litter trays
This is the same approach as identified with seed-fall traps. Collection cones or similar structuresof a known collection area, into which litter can fall, are set up under the canopy. These areperiodically cleared and the quantity of material collected is assessed.
Comments References
● A quite widely used and reliable technique Brockie 1992
● Considerable effort required to establish and maintain Cowan & Waddington 1991
litter trays Cowan et al 1985.
VEGE
TATI
ON
141
Litter plots
In a similar way to that set out for seedfall plots, it may be possible to collect and assess litterfrom small plots on the forest floor, without the expense of establishing litter trays. Withinsmall plots, intact litter is scraped up, to the level of the more decomposed humus layer. Thequantity of this material can then be assessed. Care is required if ongoing monitoring isundertaken using the same marked plots, as fixed plots will always have less litter in subsequentmeasurements due to the accumulated litter sampled in the first measurement.
Comments
● This is a less proven technique than litter trays, and may have somewhat less reliable
results
● Less effort will be involved in establishment and maintenance
NATIVE FOREST MONITORING142
WEED DISTRIBUTION
The indicator
What is it?The distribution of particular weed species.
DiscussionThe distribution of plant pests is often a very important indicator. Weeds may be new arrivalsto an area and have potential to spread. Obtaining up to date information on distribution ofweeds allows managers to identify new infestations, and identify sites where eradication maybe possible.
Ongoing changes in the distribution of particular species, and their spread into new areascan be assessed.
Some key issues
● See ‘Distribution of key species/uncommon species’, p.131
Measurement methodsThe methods for assessing distribution are the same as those for examining the distribution ofimportant or uncommon species (see ‘Distribution of key species/uncommon species’, p.131).Some particular points to consider about weed distribution are set out below. Useful informationcan also be found in the Department of Conservation’s Weed Surveillance Standard OperatingProcedure (DOC 1999)
It is necessary to obtain information about the presence and distribution of important weedswithin an area under management. This initial work will be important to any decisions on
more detailed monitoring.If there is little information on the presence of weeds,
a thorough search of an area should be undertaken toidentify locations of individuals or localised populations.This can be particularly significant with new infestations
of weeds because theweeds may be at a verylow density and wouldnot be picked up byabundance surveys.
When undertakingsuch searches, thereare certain areas thatare particularly vul-nerable to the spread ofweeds (DOC 1999),and these should forman important focus,particularly if resourcesto search the wholea r e a a r e l i m i t e d .
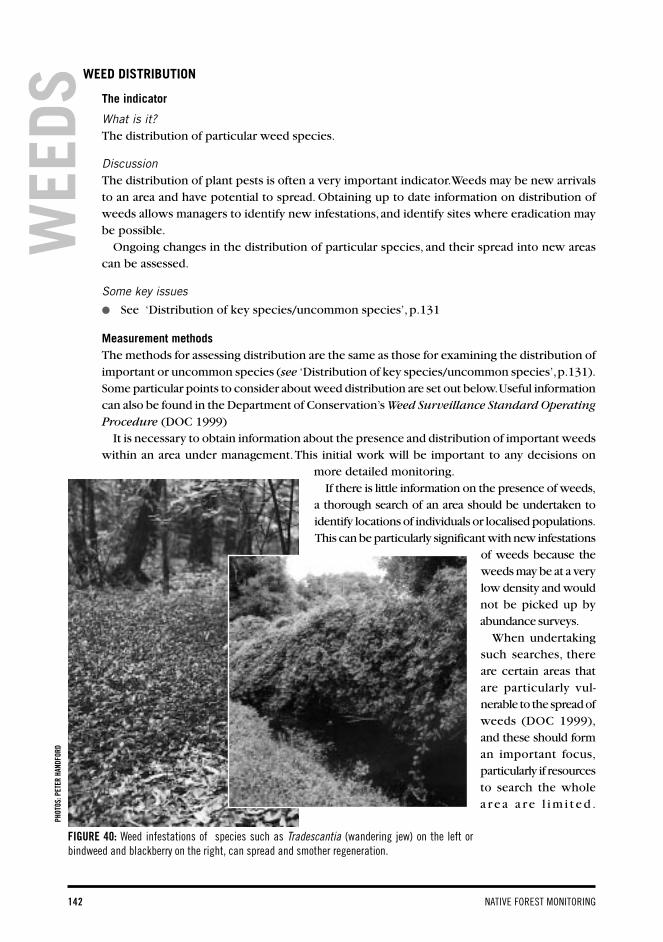
FIGURE 40: Weed infestations of species such as Tradescantia (wandering jew) on the left orbindweed and blackberry on the right, can spread and smother regeneration.
PHOT
OS: P
ETER
HAN
DFOR
D
WEE
DS
143
Vulnerable areas include:
● Alongside roads and railways.
● Rubbish dumps.
● Places with low scrubby or disturbed vegetation.
● Beside streams, rivers, lakes or the coast.
● Places modified by human activity, for example, farms, cleared land, excavations.
● The edges of reserves, particularly close to settlements.
Mapping of the location of individual infestations should be undertaken for importantuncommon species with only localised distribution (see ‘Distribution of key species/uncommon species’, p.131). Mapping of specific locations of particular infestations enablestheir spread to be monitored. With localised infestations, it is sometimes possible to monitorthe total cover or number of individuals.
For weeds that are more widely dispersed, the broad extent of distribution rather thanindividual infestations can be mapped. The suitability of different mapping scales will dependon what is being mapped. If a 50-hectare area of continuous evenly distributed weed infestationis being identified, then mapping on 1:50,000 maps may be appropriate. If you are examininglocations of individual weed plants or patches of weeds over a small reserve, aerial photographsof 1:5000 or larger scale may be appropriate.
WEED ABUNDANCE
The indicator
What is it?The relative or absolute abundance of a particular weed species or group of weed species (see‘Abundance of indicator species’, p.127).
DiscussionThe abundance of particular weed species can be important to managers of native forest. Itcan provide indications of whether the population is increasing or decreasing, and the impactof weed control or other management operations.
Including assessment of the abundance of both juvenile and adult plants is useful (see also‘Population structure’, p.136) to identify if populations are increasing, with many juveniles,or are apparently fairly stable, with a few mature plants.
The Department of Conservation Standard Operating Procedure (DOC 2000) for monitoringweed control is a very useful reference for designing and undertaking weed abundancemonitoring.
Some key issues
● See ‘Abundance of indicator species’, p.127.
● Select the important weed species to monitor. Look first at those species that have features
such as high impact, potential for control, or are established throughout the area and spreading.
● If the species is new and only present as early introductions, a distribution survey (see
‘Weed distribution’, p.142) may be the best approach.
Measurement methodsAs with vegetation in general, the approach to assessing the abundance of weeds will dependto a large extent on the growth form, distribution and relative density of the individual species.
NATIVE FOREST MONITORING144
Table 5 in ‘Abundance of indicator species’, p.131 identifies how these issues affect the methodused. Methods available are also described in ‘Abundance of indicator species’.
WEED POPULATION STRUCTURE
The indicator
What is it?The relative numbers of plants of one weed species in different age/growth classes.
DiscussionThis indicator can provide information on the trend in a weed population (see also ‘Populationstructure, p. 136). Presence of mature adult plants that have been present for a long time, withno, or very few, juvenile plants, may suggest a fairly stable population. The presence of a fewadult plants and many new juveniles suggests a potentially rapidly expanding population.
Examining the population structure can be important with species that take time to reachmaturity and start producing seed. For example, introduced conifer species (pines, Douglasfir, etc) take years to reach a stage where they are producing seed. Identifying populationstructure when monitoring these species can help to identify which areas are priorities forcontrol and which areas are not so urgent.
Some key issues
● See ‘Population structure’, p.136.
● Determine how you will clearly separate age/size/growth classes.
Measurement methodsSee ‘Population structure’, p.136.
WEED MORTALITY
The indicator
What is it?The proportion of plants dying over a certain time period, within a certain age/size class.
DiscussionAs well as being a vital part of understanding general population dynamics of a weed species,assessing mortality can be particularly important when considering the effects of controloperations such as herbicide application (DOC, 2000).
Some key issues
● See ‘Mortality’, p.138.
Measurement methodsDeaths of individually marked plants or the portion of stems or cover within marked plotscan be assessed over time, including before and after a control operation. See ‘Mortality’,p.138 for an outline of measurement methods.
WEE
DS &
GRO
UN
D CO
VER
145
GROUND COVER
The indicator
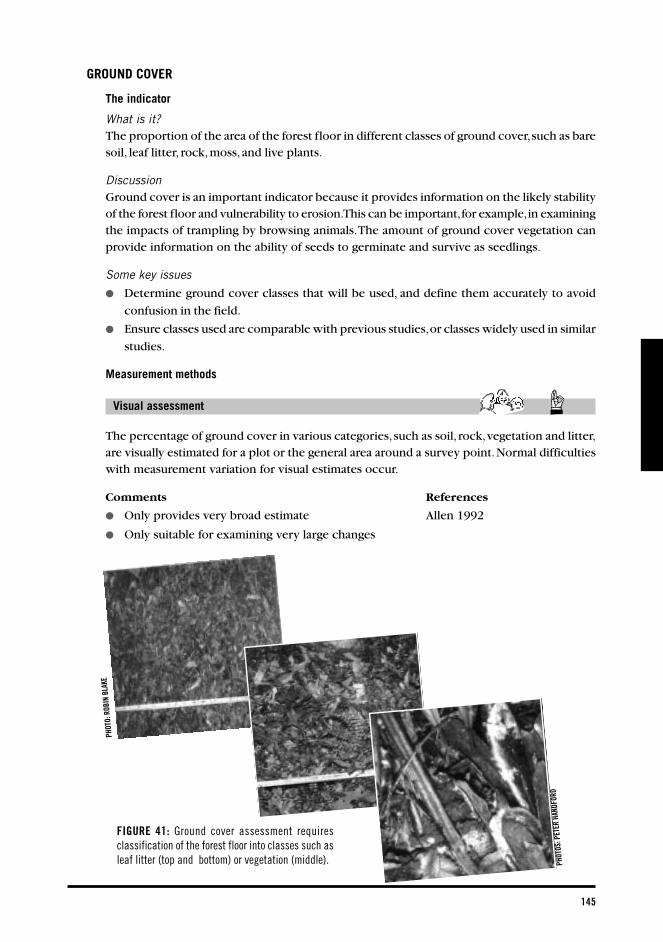
What is it?The proportion of the area of the forest floor in different classes of ground cover, such as baresoil, leaf litter, rock, moss, and live plants.
DiscussionGround cover is an important indicator because it provides information on the likely stabilityof the forest floor and vulnerability to erosion. This can be important, for example, in examiningthe impacts of trampling by browsing animals. The amount of ground cover vegetation canprovide information on the ability of seeds to germinate and survive as seedlings.
Some key issues
● Determine ground cover classes that will be used, and define them accurately to avoid
confusion in the field.
● Ensure classes used are comparable with previous studies, or classes widely used in similar
studies.
Measurement methods
Visual assessment
The percentage of ground cover in various categories, such as soil, rock, vegetation and litter,are visually estimated for a plot or the general area around a survey point. Normal difficultieswith measurement variation for visual estimates occur.
Comments References
● Only provides very broad estimate Allen 1992
● Only suitable for examining very large changes
FIGURE 41: Ground cover assessment requiresclassification of the forest floor into classes such asleaf litter (top and bottom) or vegetation (middle).
PHOT
O: R
OBIN
BLA
KE
PHOT
OS: P
ETER
HAN
DFOR
D