ac no: 1. purpose. - federal aviation administration · subject: continued airworthiness...
TRANSCRIPT

Subject: CONTINUED AIRWORTHINESS ASSESSMENTS OF POWERPLANT AND AUXILIARY POWER UNIT INSTALLATIONS OF TRANSPORT CATEGORY AIRPLANES
Date: 9/8/03 Initiated By: AIR-100
AC No: 39-8 Change:
1. PURPOSE.
a. This advisory circular (AC) describes the Continued Airworthiness Assessment Methodologies (CAAM). The Federal Aviation Administration (FAA) Engine and Propeller Directorate (EPD) and the Transport Airplane Directorate (TAD) may use CAAM to identify unsafe conditions and determine when an “unsafe condition is likely to exist or develop in other products of the same type design” before prescribing corrective action in accordance with Title 14 of the Code of Federal Regulations (14 CFR) part 39. CAAM is used for products associated with the Powerplant or Auxiliary Power Unit (APU) Installations on Transport Category Airplanes.
b. Continued airworthiness requires that safety concerns within the existing fleet be addressed, and the knowledge gained applied for the benefit of future fleets as well. This AC also provides CAAM guidance for estimating the risks associated with identified unsafe conditions; defining, prioritizing, and selecting suitable corrective actions for all identified unsafe conditions; and verifying that the corrective actions were effective. This AC is intended to present a tangible means of logically assessing and responding to the safety risks posed by unsafe conditions.
c. This AC does not establish any requirement that the FAA must perform a risk assessment before issuing an AD, or that the FAA must wait to issue an AD until the design approval holder performs a risk assessment, or that the FAA must accept the findings of a risk assessment performed by the design approval holder. CAAM, as described in this AC, assists the FAA in making decisions concerning the priority in which unsafe conditions should be addressed. The FAA may issue an AD for a particular unsafe condition before a risk assessment is performed, or without having an assessment performed at all.
d. In this regard, CAAM does not define "unsafe condition" in a powerplant or APU installation. Rather, CAAM is a tool that the FAA usually will use to make the kinds of decisions described above. This AC provides guidance and acceptable methods, but not the only
AC 39-8 9/8/03
methods, for assessing the risk of unsafe conditions on products associated with the Powerplant or Auxiliary Power Unit (APU) Installations on Transport Category Airplanes.
e. Note that the descriptive level of the CAAM process contained in this AC is aimed at the individual, whether from the FAA or the manufacturer, who is without extensive risk analysis experience. Some of the material within this AC will therefore seem very basic to the experienced analyst. Additionally, this AC recognizes that an analysis must sometimes be performed without the benefit of readily-available information from the manufacturer. Typically, it is expected that more specific information will be available to the analyst, thus eliminating the need for some of the process steps that are described.
f. While information may be provided by and the assessment performed by the applicant, decisions as to whether an unsafe condition exists, and the appropriate responses to that unsafe condition, are exclusively the responsibility of the Administrator. g. The guidance provided in this document is directed to engine manufacturers, modifiers, foreign regulatory authorities, and FAA engine type certification engineers and their designees. h. This material is neither mandatory nor regulatory in nature and does not constitute a regulation. It describes acceptable means, but not the only means, for demonstrating compliance with the applicable regulations. The FAA will consider other methods of demonstrating compliance that an applicant may elect to present. Terms such as “should,” “shall,” “may,” and “must” are used only in the sense of ensuring applicability of this particular method of compliance when the acceptable method of compliance in this document is used. While these guidelines are not mandatory, they are derived from extensive FAA and industry experience in determining compliance with the relevant regulations. On the other hand, if the FAA becomes aware of circumstances that convince us that following this AC would not result in compliance with the applicable regulations, we will not be bound by the terms of this AC, and we may require additional substantiation as the basis for finding compliance. i. This material does not change, create any additional, authorize changes in, or permit deviations from existing regulatory requirements.
2. RELATED REGULATIONS (CFR) AND READING MATERIAL.
a. Related Regulations (CFR).
(1) 14 CFR 21.99, Certification Procedures for Products and Parts - Required Design Changes.
Page 2 Par 1

9/8/03 AC 39-8
(2) 14 CFR part 39, Airworthiness Directives.
b. Federal Aviation Administration (FAA) Related References.
(1) Technical Report on Propulsion System and APU-Related Aircraft Safety Hazards, dated October 25, 1999 (available on-line at http://www.faa.gov/certification/aircraft/engine_caamfnl.doc).
(2) AC 25.1309-1B, System Design and Analysis (draft status; awaiting publication).
(3) AC 25.901-1 Safety Assessment of Powerplant Installations (draft status; awaiting publication).
(4) FAA-AIR-M-8040, Airworthiness Directives Manual
c. Related Reading Material.
(1) E. Lloyd and W. Tye, Systematic Safety, London: Taylor Young Limited, 1982.
(2) AFWAL-TR-83-2079, Weibull Analysis Handbook, Air Force Wright Aeronautical Laboratories.
(3) Simulation Modeling and Analysis by Law and Kelton, 2nd Edition, The McGraw-Hill Companies, Inc., copyright 1991.
(4) Society of Automotive Engineers (SAE) Aerospace Recommended Practice (ARP) 4761, Guidelines and Methods for Conducting the Safety Assessment Process on Civil Airborne Systems and Equipment.
(5) SAE ARP 4754, Certification Considerations for Highly-Integrated or Complex Aircraft Systems.
(6) Air Transport Association of America, ATA Spec 111, Airworthiness Concern Coordination Process.
3. APPLICABILITY.
a. This AC is applicable to the identification, prioritization and resolution of unsafe conditions within the powerplant and auxiliary power unit installations of transport category
Par 2 Page 3
AC 39-8 9/8/03
airplanes. Section 25.901(a) states “the powerplant installation includes each component that is: necessary for propulsion; affects the control of the major propulsive units; or affects the safety of the major propulsive units between normal inspections or overhauls”. Typically, the powerplant installation includes the components that make up the following:
(1) main engines and propellers;
(2) engine and propeller accessories including engine oil systems, engine bleed systems, gear boxes, etc.;
(3) engine and propeller controls and indications;
(4) engine and propeller protection systems, including engine fire protection systems, engine overspeed protection systems, engine icing protection systems, etc.;
(5) engine nacelles and cowling, including inlets, exhaust nozzles, core cowls, fan cowls, thrust reversers, etc.;
(6) engine struts and pylons; and
(7) fuel systems, including fuel feed systems, refuel and defuel systems, fuel transfer systems, fuel system controls and indications, etc.
b. Typically, the auxiliary power unit installation includes:
(1) the APU itself,
(2) APU accessories,
(3) APU inlet and exhaust systems,
(4) APU control systems,
(5) APU indicating systems,
(6) APU fire protection systems, and
(7) APU bleed air systems, etc.
c. Throughout the CAAM process, the threat to persons both inside and outside the airplane should be considered. It is recognized that certain causes of serious injury to persons outside the
Page 4 Par 3

9/8/03 AC 39-8
aircraft cannot be mitigated by practicable changes to the type design. Examples of this include personnel (having disregarded cautions and warning markings or manual instructions) walking into turning propellers or being ingested into engines. Experience has been that many risks to persons outside the aircraft, such as the shedding of small components from the aircraft or engine, have been judged to be insignificant due to the low probability of persons being injured. If the threat to persons outside the airplane is obviously insignificant relative to either the threat to persons inside the airplane or to the applicable risk guidelines, then it need not be taken into account.
4. DEFINITIONS. The following definitions apply to the guidance material provided in this AC. Do not assume these definitions should apply to the same or similar terms used in other federal regulations or ACs. Terms for which standard dictionary definitions apply are not defined in this AC.
a. Compliance schedule. A timetable for performing specified corrective actions (e.g., maintenance, inspections, part replacements, alterations, etc.) to alleviate an identified unsafe condition.
b. Continued airworthiness. The ongoing activities associated with ensuring a product remains in compliance with the intent of the applicable Product Design Standards.
c. Control program. The combination of compliance schedule and corrective actions needed to alleviate an identified unsafe condition. Note that the condition is no longer considered to be unsafe while it is being addressed by a control program developed under the guidelines of this AC.
d. Event. The occurrence of a failure or other condition. Note that while the event of interest is usually the occurrence of the identified unsafe condition, events of lesser or greater severity may also be analyzed.
e. Hazard level. Level of event outcome, as defined by its effect on the aircraft, passengers, and crew (see appendix 2).
f. Hazard ratio. The conditional probability that a particular powerplant installation failure mode will result in an event of a specific hazard level.
Par 3 Page 5

AC 39-8 9/8/03
g. Malfunction type. A single initiating cause of a failure, defect or other abnormal condition on a type design that can affect one or more parts. One specific cause (such as a melt-related defect leading to fracture) that affects several different parts (5th stage disks and 6th stage disks, for example) within an engine type design is still considered a single malfunction type. However, multiple initiating causes for a single part (e.g., melt-related defect, high-cycle fatigue, corrosion, etc., for 5th stage disks) represent multiple malfunction types. Note that this use of the term “malfunction” attempts to cover the traditional definition referring to systems or components not functioning properly along with hardware-induced failures.
h. Powerplant installation. Each component that is necessary for propulsion, affects the control of the major propulsive units, or affects the safety of the major propulsive units between normal inspections or overhauls. See paragraph 3 above.
i. Product Design Standards. Those requirements delineated within the “Airworthiness Standards” (e.g., 14 CFR Parts 25 and 33) and “Operating Rules” (e.g., 14 CFR Parts 91, 121, 125, and 135) which regulate the physical and functional characteristics of airplanes, engines, and components thereof.
j. Propulsion system. See Powerplant installation.
k. Risk factor. A quantitative assessment output equal to the average number of future events expected to occur within a given time. Risk factors can be differentiated into three types (see below), and typically cover the time required for problem resolution. However, in the case of uncorrected risk factor and control program risk factors for control programs that do not incorporate final corrective actions (e.g., recurring inspections), risk factors usually cover a 20-year (60,000-hour) period or shorter interval corresponding to the expected life of the fleet
(1) Uncorrected risk factor. The forecasted number of future events expected to occur in the entire worldwide fleet (or, if applicable, the relevant affected subfleet) if no corrective actions are incorporated.
(2) Control program risk factor. The forecasted number of future events expected to occur in the entire worldwide fleet (or, if applicable, the relevant affected subfleet) during the control program.
(3) Corrected risk factor. The forecasted number of future events expected to occur after the entire worldwide fleet (or, if applicable, the relevant affected subfleet) incorporates the final
Page 6 Par 4

9/8/03 AC 39-8
corrective actions. Note that this number should be consistent with the long-term acceptable risk guidelines listed within table 1 of paragraph 9 of this AC.
l. Unsafe Condition. A condition which, if not corrected, is reasonably expected to result in one or more serious injuries.
(1) Is reasonably expected. Has a probability of occurrence acceptable to neither the long-term risk guidelines listed within table 1 of paragraph 9 of this AC nor the intent of the applicable product design standards.
(2) Serious injuries. As defined by the National Transportation Safety Board (NTSB), any injury that:
(A) requires hospitalization for more than 48 hours, commencing within seven days from the date the injury was received;
(B) results in the fracture of any bone (except simple fractures of fingers, toes or nose);
(C) involves lacerations that cause severe hemorrhages, nerve, muscle or tendon damage;
(D) involves injury to any internal organ; or
(E) involves second- or third-degree burns or any burns affecting more than five percent of the body surface, and
(F) "fatal injury" is defined as an injury that results in death within 30 days of the accident.
5. BACKGROUND.
a. In 1991, the Aerospace Industries Association (AIA) chartered a working group to develop methods to identify, prioritize, and resolve safety-related problems occurring on aircraft engines. This group was called the Continued Airworthiness Assessment Methodologies (CAAM) committee. It was decided to limit the scope of the effort to engines, propellers, and APUs installed on transport airplanes due to the availability of credible data. An event characterization system, termed the hazard level, was developed, based on the observed outcome of the event at the aircraft level. (The CAAM hazard levels are listed in appendix 2 of this AC.) Ten years of
Par 4 Page 7

AC 39-8 9/8/03
engine, propeller and APU events were then analyzed and grouped by event cause (i.e., uncontainment, fire, etc.) and hazard level. Historical conditional probabilities of the most serious events (CAAM levels 3 and 4) were also calculated for each cause, and a methodology was developed for quantitatively estimating the risks of safety-related problems occurring on aircraft engines, propellers, and APUs. The results of the CAAM activity were published first in AIA PC-342 and AIA PC-342-1, and later in the “Technical Report on Propulsion System and APU-Related Aircraft Safety Hazards” (FAA Related Reference (1) in paragraph 2b of this AC). The results have been used by the EPD since 1994 to help identify and prioritize responses to potential engine, propeller, and APU unsafe conditions. In 2001, the CAAM committee was reformed to update the database for the period 1992-2000, and to expand the database to cover propulsion-related events beyond the engine, propeller and APU. At the time of publication of this AC, the CAAM database update is still underway, though the information available at the time of publication is contained within appendix 8 of this AC. When completed, the update will be published as the “2nd Technical Report on Propulsion System and Auxiliary Power Unit (APU) Related Aircraft Safety Hazards.” That report will be available at the same website as the first report.
b. Since the FAA TAD is responsible for the certification of engines, propellers and APUs as installed on transport category airplanes, identifying and responding to potential engine, propeller, or APU unsafe conditions often involves joint decision making by the TAD and EPD. It was recognized that a compatible continued airworthiness assessment policy needed to be adopted by both directorates. To that end, the EPD and TAD developed a revised process that included specific guidance to address the range of unsafe conditions facing the TAD. This revised process was published for Public Comment in May of 2000. Due to the level of interest expressed by the AIA and other entities with respect to the revised process, a comment disposition team was formed within the Aviation Rulemaking Advisory Committee (ARAC) to provide recommendations to the FAA. Representatives from a variety of organizations representing airlines and manufacturers participated in this team. This AC is the result of updating the revised process, as appropriate, with the input received from the comment disposition team. As part of this update, the CAAM process has been extended to a level 5. This AC thus extends objective risk assessment principles to the entire powerplant installation in transport category airplanes.
c. The CAAM levels classify events based on the actual outcome. There are other methods in use to classify the severity of events, such as the assessment during certification of the worst anticipated outcome. Because these different classification systems were developed independently, are based on either actual or projected outcomes, and have different purposes,
Page 8 Par 5

9/8/03 AC 39-8
there is not a one-to-one relationship for any given failure condition. For example, a disk burst may be classified as “catastrophic” or “hazardous” under certification assessments, but actual disk burst events may range in severity from CAAM levels 1 (minor) up to 5 (catastrophic). Nevertheless, the intention of this AC is to evaluate risk objectively, regardless of the classification system used. This risk evaluation includes severity of outcome and conditional probability of that outcome given the failure condition. Whether one starts with the assessment that disk bursts are catastrophic, or observes that there has been a CAAM level 3 disk burst in service, the risk assessment for a given outcome, such as serious injury (level 4), should be equivalent. The acceptable levels of safety and risk assessment methods are different between certification and continued airworthiness. Consequently, to avoid confusion, this AC does not focus on certification classifications.
6. DOES AN UNSAFE CONDITION EXIST?
a. When a potential unsafe condition (see appendix 1) is identified, the potential should be evaluated for the actual risk of the event of interest. This evaluation may take quantitative or qualitative form. Methodologies for assessing risk quantitatively are discussed in paragraph 7, below. Additionally, appendix 5 discusses techniques to assist in either qualitative or quantitative analyses.
b. Determination that a potential unsafe condition exists should be followed by a determination of either the root cause(s) or contributing factors, or both. Preliminary information and details may be insufficient to identify appropriate corrective action. Therefore, it is often necessary to seek additional information to determine the root cause and other contributions to the potential unsafe condition. Unsafe conditions may be caused, either in combination or separately, by improper design, manufacture, maintenance, or operation. The contribution of these individual elements should be evaluated in order to ascertain the probability of future occurrences, as well as the effectiveness of candidate corrective actions. Unsafe conditions that are not mitigated by contributing or conditional factors may require expeditious action unless the root cause, failure distribution and risk factor can be reasonably established.
c. Root cause problem assessments may identify concerns in other products of the same or similar type design or usage. In these cases, consideration of corrective action beyond the initially-identified population may be necessary.
d. Prior examples of similar occurrences of the potential unsafe condition, and their associated airplane-level effects, should be reviewed to help with the determinations described in this and all aspects of the CAAM process. The CAAM report (FAA Related Reference (1) in
Par 5 Page 9

AC 39-8 9/8/03
paragraph 2b of this AC) provides information on previous occurrences of a variety of propulsion system and APU events. Additional information is included in appendix 8. This information is especially helpful in estimating the hazard ratio – that is, the conditional probability that the event could result in a CAAM level 3, 4 or 5 occurrence. (See appendix 3 for guidance on estimating the hazard ratio.)
e. The probability of future CAAM level 3 and above occurrences should be compared to the long-term acceptable risk guidelines in table 1, found in paragraph 9 of this AC, and also to the applicable design standards. If the probability of occurrence is acceptable to neither of those guidelines, the condition is judged to be unsafe.
f. Upon identifying an unsafe condition, a decision should first be made as to whether immediate action is warranted. The magnitude of a required immediate action will be related to the severity of the condition and the likelihood of additional events occurring prior to the implementation of a longer-term solution. It is quite possible that, immediately following a potentially severe event, the likelihood of its recurrence cannot be adequately estimated. If it is possible to take immediate, practical, mitigating action while an initial assessment is being made, that action should be taken. An example of this type of situation was the unsafe condition posed by a thrust reverser inflight deployment on specific types of airplanes with wing-mounted high-bypass ratio engines. An accident resulted from an inflight thrust reverser deployment. Neither the failure(s) which lead to the thrust reverser deploying inflight nor the reasons why the inflight deployment resulted in the pilot losing control of the airplane could be readily determined. However, it was possible to take reasonable immediate action by “locking-out” the reversers. Reversers were subsequently allowed to be “unlocked” when system integrity was assured by requiring periodic checks of the entire thrust reverser system, including its fault indication features. The final corrective action was to incorporate system modifications to ensure that subsequent inflight deployments are not anticipated to occur within the fleet life of the airplane type.
g. If no practical or readily-implemented immediate action is possible, or if such action is not known to be sufficient in and of itself, then every effort should be made to objectively evaluate the appropriate level of response to the identified unsafe condition. Where factual data are sparse, this review will necessarily be based primarily on judgment and expert opinion. The intent in either situation is for consistent and objective responses to unsafe conditions.
h. Responses to identified unsafe conditions can vary from an immediate mitigating reaction
Page 10 Par 6

9/8/03 AC 39-8
to an extensively-considered final response. The control programs for most unsafe conditions may include initial, interim, and final actions. The CAAM process assists with the evaluation of those actions, and helps to verify that the actions are appropriate and timely to mitigate the unsafe condition.
7. RISK ASSESSMENT.
a. It is usually necessary to work closely with the design approval holder and, if appropriate, the operators to adequately complete the steps outlined within the risk assessment process. This cooperative effort may take the form of: the FAA engineer overseeing the work of the manufacturer or designer, the FAA engineer and manufacturer working in concert, or the FAA engineer performing the analysis with input and guidance from the manufacturer.
b. Any analysis, whether qualitative or quantitative, is only as accurate as the assumptions, data, and analytical techniques it uses. Therefore, these underlying assumptions, data, and analytic techniques should be identified and justified to ensure that the conclusions of the analysis are valid. The justification of the assumptions made should be an integral part of the analysis. Assumptions can be validated by using experience with identical or similar systems or components, with due allowance made for differences of design, duty cycle and environment. Where it is not possible to adequately justify the critical elements of the analysis, either conservatism should be built into the initial assumptions, or uncertainty in the data and assumptions should be evaluated to the degree necessary to demonstrate that the analysis conclusions are relatively insensitive to that uncertainty. If a quantitative method is used, it is essential that the analysis calibrate with the experience to date. A quantitative risk analysis cannot be expected to credibly predict into the future if it does not calibrate to actual experience.
c. As discussed in the Background section of this AC, there are various methods used to classify the severity and predict the probability of events. The following steps may be performed using either quantitative or qualitative methods, or both. The intent in any case is to perform a realistic structured assessment using case-specific or similar data or assumptions or both. Depending on the nature of the potential unsafe condition, the level of previous experience with similar unsafe conditions, and the level of risk assessment and prioritization information needed to support effective decision making, the actual process used may vary. However, a process equivalent to that described in this AC should normally be performed as fully as possible.
d. The intent of these assessments is to determine whether an unsafe condition exists (that is, whether the potential unsafe condition has a reasonable expectation of resulting in injury) and to ensure that an unsafe condition that represents the greater risk receives higher levels of attention and resources for its timely resolution than does one that represents a lower risk.
Par 6 Page 11
AC 39-8 9/8/03
e. Estimate the number of airplanes exposed. Determine the number of airplanes for which the unsafe condition may exist or be expected to develop if no corrective action is taken. For example, airplanes with engine parts within a certain serial number range, or airplanes with installed engines below a certain total cycles or total hours. Note that exposure means the possibility of occurrence, not the certainty of it. If multiple airplane types are exposed to the same unsafe condition, then the estimate should include all affected airplanes rather than assessing the risk to each airplane type separately.
f. Estimate the uncorrected risk factor. Use analytical techniques such as those described in this AC in appendix 5 to estimate the uncorrected risk factor – the expected number of events if no action is taken to address the condition. This step takes the exposed population and estimates the number that are expected to experience the event. While the event of interest is usually the occurrence of the identified unsafe condition, events of lesser or greater severity may also be analyzed. Risk factors for CAAM levels 3, 4 and 5 are also calculated to allow for comparison to the risk guidelines in table 1 of paragraph 9. Risk factors for higher-level events are obtained by multiplying the event risk factor by the applicable hazard ratio.
g. Failure rate data is often provided in failures per flight hour, even though the failure rate itself is not directly a function of flight hours. Therefore, care should be taken to ensure the event predictions take into account the frequency with which the actual stresses that cause failure will occur within the total exposure period. For example, a component failure mode may be predominantly a function of the number of times electrical power is applied to it. If so, the average power applications per flight hour should be the same between the source of the failure rate data and the subject application of that data, or an appropriate correction should be applied.
h. For uncorrected risk factor, a 20-year (60,000-flight hour) fleet life per aircraft may be assumed or another reasonable estimate of the actual fleet life may be used. Additionally, the risk factor should be converted to risk per flight (or flight hour, if applicable) to facilitate comparing risks on a common exposure basis. This is normally done by dividing the risk factor by the total number of flights (or flight hours) within the assumed exposure period. Whatever exposure basis is used (flights or flight hours), it should be used consistently to allow the various risks being managed simultaneously to be readily compared to each other and the risk guidelines. The uncorrected risk factor(s) should be compared to the risk guidelines in table 1 of paragraph 9 to help establish the relative threat posed by the unsafe condition.
i. Identify options for mitigating action. Some types of actions that have proven to be both practical and beneficial for immediate responses are inspections, placards, revisions or
Page 12 Par 7

9/8/03 AC 39-8
supplements to the Aircraft Flight Manual (AFM), staggering engines to obtain mixed life engines on a given airplane (for infant-mortality problems) and pre-flight checks. These same actions are appropriate for follow-on actions, along with repair or replacement of the suspect components.
j. Estimate the effects of candidate actions. Candidate actions considered after an unsafe condition has been identified should be evaluated with the appropriate manufacturer, designer, or operators. This is to consider their capacity to reduce the future risk to acceptable levels (see the guidelines table 1 of paragraph 9 for short-term acceptable risk). From a technical perspective, several candidate actions may be available; the selected action(s) should consider such issues as confidence in the effectiveness of the corrective action, availability of the resources necessary to support the corrective action, and the ability of the operators to expediently and properly incorporate the corrective action.
k. Estimate potential risk reduction. Once the candidate actions have been identified, the risk factor for the proposed mitigation program should be estimated using the same process described above. This process should be performed for all actions under consideration, thereby allowing the effects of different programs to be compared. The objective is to keep the risks to the affected fleet below the applicable guidelines until final action can be incorporated to bring the product back to the level of safety intended by the product's original basis of certification. If none of the candidate immediate corrective action programs can achieve the needed risk reductions, more aggressive action, including grounding, should be considered.
l. Estimate resource requirements. Resources are generally considered to be time, material (parts and inspection equipment), and labor. However, there are additional considerations such as shop capacity, parts distribution, operational disruptions and lost revenue. The extent of these required resources should be estimated to quantify the impact of the AD or other corrective action (such as improved training and interim non-AD actions), allow for timely provisioning, and aid in the determination of desirable tradeoffs between resources and risk. Depending on the analysis that has been performed, the number of replacement parts, shop visits, inspections, etc., may be available as output parameters. However, the results from the steps used to establish the risk factor can likewise be used to estimate impact on resources. Data will often be required from the manufacturer(s), operators or both to aid in this process.
m. Rank practical candidate actions. Various possibilities will be suggested to deal with the unsafe condition. Given that several candidate actions provide equivalent reduction in risk, they can be readily ranked in desirability regarding the impact on resources. Small tradeoffs in risk can be accepted where a candidate action with the lower risk is of much greater difficulty to
Par 7 Page 13

AC 39-8 9/8/03
effectively implement or is much more burdensome than a slightly riskier option. Furthermore, some highly-effective options may prove not to be in the public interest if the cost to implement them exceeds the potential benefits. Care should be taken to not mandate AD actions for which a petition for exemption would likely be granted. Each candidate action should be evaluated against the following criteria:
(1) first and foremost, its effectiveness, meaning its relative reduction of risk,
(2) availability of resources (shop visit capacity, material availability, personnel, etc.),
(3) how quickly it can be implemented,
(4) how easy it is to implement, and
(5) its relative cost.
n. Candidate actions include such items as: manufacturing, maintenance, or operational procedural changes; on-wing or in-shop inspections; limitations on time-limited dispatch (TLD); and part repairs, replacement, or modifications. The number of cycles or hours between initial and repetitive actions should also be evaluated. The ideal action would be inexpensive, easy to perform, possible to begin immediately, and 100 percent effective. The real situation often requires trading off these characteristics. For example, developing an accurate inspection tool and method that can be used for engines on wing may mean inspection does not begin immediately.
o. Develop and implement appropriate responses. The objective of all continued airworthiness decisions is to maintain an acceptable level of safety by reducing the risks posed by future events. Selection of actions, including taking no specific action, should be based on the specific circumstances and an assessment of the risk of future occurrences of the unsafe condition. Prohibition of airplane operation based on an observed unsafe condition, pending determination of the root cause and appropriate corrective action, is rarely necessary, and should be reserved for situations where paragraph 9g, “Risk guidelines for immediate action”, indicates that immediate action is necessary yet no less burdensome effective option is available.
p. If the FAA decides not to implement a particular candidate corrective action, the decision and its justification should be documented and filed for future reference. Closure documentation should include justification and reasons for determination of non-implementation of the corrective action.
Page 14 Par 7

9/8/03 AC 39-8
q. Verify results of corrective actions. Initial corrective actions, whether immediate reactions or initial considered responses, may not represent the final action required to address the unsafe condition. To that end, service experience and any other data gathered during the action implementation should be carefully reviewed to increase the validity of the analytical process and the estimated risks.
r. Monitor implementation and impacts of the corrective actions taken. When feasible, the rate of incorporation of the corrective action(s) should be tracked to verify that the action is being implemented in a timely manner. If the action includes inspection, inspection results should be analyzed to help quantify incipient failures and aid assessment of the extent of the problem. Service experience should be tracked to ensure that the rate of occurrence is being reduced; however, rate of occurrence may not be applicable in cases of rare events or small exposures. Service experience and inspection results should also be evaluated against expectations developed as a result of any quantitative or qualitative analysis performed as part of the action. Note that there is no existing method to ensure complete reporting to all interested parties. The inclusion of reporting requirements within the body of the AD itself will ensure that the operators report inspection findings to the FAA, and this should be considered for those unsafe conditions of high risk where the inspection findings are necessary to evaluate the adequacy of actions. Although manufacturers will not automatically receive these findings, they may receive responses to reporting requests within a manufacturer's service bulletin. For more general reporting (e.g., determination of the effectiveness of a new repair procedure or whether new problems are being introduced due to the corrective action), the principal inspectors at affected airlines (for the FAA), or the manufacturer’s Field Service Representatives can provide direct insights into the impacts of mandated corrective actions.
s. Verify corrective actions were effective. Any experience that deviates significantly from expectations or assumptions is grounds to revise the assessment of the situation. Since an initial reaction may not be the complete response to the unsafe condition, a complete validation of the effectiveness of any initial corrective action may not be feasible prior to additional actions being taken. Field experience and inspection results should continue to be monitored to ensure that any interim action (i.e., inspection) continues to validate assumptions and predictions, or to alleviate any consequence of any extra conservatism built into an initial assessment. Final action (part modification or replacement) carries with it an assumption that the causal factors have been effectively eliminated or mitigated with regard to their ability to result in an unsafe condition. Field experience should be tracked to validate this assumption. Care should be taken to ensure that any unforeseen adverse impacts of corrective actions are identified and evaluated.
t. Follow-on assessments and responses. In many circumstances, the initial actions taken in response to an unsafe condition may be insufficient to effectively mitigate the risk to acceptable
Par 7 Page 15

AC 39-8 9/8/03
levels. Therefore, follow-on responses and actions may be required. The risk assessment process described above should be applied to the decisions involved in the use of actions, whether initial or follow-on. A more complete understanding of the problems and contributing factors to the unsafe condition at later points will most likely be available. Initial responses may be based upon limited or partial data, and later steps are usually based upon information that is more complete.
u. The FAA response to an unsafe condition should be based on a technical understanding of the problem and should require an appropriate implementation schedule that is consistent with the risk assessment. When performing a follow-on assessment, the fact that exposure time has elapsed between the initial and follow-on assessments should not be used to justify unduly extending the duration of the control program. The exposure time for evaluating the risk for follow-on actions is the amount of time required to complete the entire correction program (i.e., any initial, interim and final actions). The objective throughout the entire correction program is to keep the risks below the applicable guidelines until the product is brought back to the level of safety intended by the product’s original basis of certification. The schedule for follow-on actions should be established such that these applicable guidelines will be met.
8. ASSESSMENT MODEL CONSIDERATIONS. As mentioned above, quantitative assessments of potential unsafe conditions are desired, since they provide measurements that enhance the oversight and viability of proposed corrective actions and prioritization. Often, the need to quickly reduce the risk of an unsafe condition may not always be supported by an adequate quantitative assessment. However, manufacturers should be able to acquire or develop data by experience, test, and analysis as needed for quantitative assessments. These assessments are used to judge the adequacy of control programs and validate that immediate or initial corrective actions provide sufficient risk reduction. Quantitative assessments, therefore, should be a goal for assessing any potential unsafe condition. A structured approach in performing quantitative assessments is essential for ensuring credible results. Important controls include:
a. Anchoring model to known facts. There will be a number of irrefutable facts within a problem. For instance, these facts may include the number of parts failed, the number of parts found cracked, and the number of parts found not cracked. The model should not contradict any known factual information.
b. Reviewing input data, assumptions, and judgment. Critical input data, assumptions, and judgment require careful review and validation. A team approach in reviewing input data, assumptions and judgment is most effective. The team should consist of experts from
Page 16 Par 7

9/8/03 AC 39-8
appropriate disciplines (e.g., stress analysis, fracture mechanics, reliability engineering, airworthiness, product support, inspection methods, etc.) Agreement by consensus on critical assessment model inputs is essential, including validation of operational data by operators. Some examples of critical inputs include hazard ratio, inspection reliabilities, crack initiation and propagation lives, failure distributions, part utilization, affected population definition, shop visit rates, material defect distributions and rate of incorporating corrective actions. Realistic assessments of hazard ratio will often necessitate the involvement of the installer. The assessment should also consider the possibility of individual airplanes operating in an MMEL or other configuration that would adversely affect the risk associated with the unsafe condition, although it is neither necessary nor appropriate to assume that the entire fleet is operating in such a configuration. Consideration should be made as to whether it is appropriate to allow continued dispatch in all previously-acceptable configurations or for all previously-acceptable missions.
c. Calibrating model to actual experience. It is essential that the model be capable of calibration to what has already happened. If the model does not calibrate, there will need to be further team review to determine which model assumptions may be in error. The model will not predict reliably if it cannot calibrate to the actual experience.
d. Review by affected parties. It is important that all critical elements (input data, assumptions, judgment, etc.) of the model be made available to affected parties for detailed review. Review by the responsible ACO is essential for ensuring regulatory goals are met, and review by the operators is essential for ensuring accurate data and viable corrective actions. ATA Spec 111 specifies a process that facilitates these reviews. It may be appropriate for the installer to review certain elements, especially in the determination of hazard ratio.
e. Establishing a consistent set of ground rules. Comparing the assessment results from multiple problems is the essence of a prioritization model. A consistent set of ground rules for constructing numerical assessments is necessary to ensure valid comparisons. Examples of areas where consistent ground rules are necessary include the determination of flight exposures (i.e., uncorrected risk for ‘x’ years), event hazard levels, hazard ratios and event probability for each flight. There may be subtle yet significant differences in the ground rules used by different manufacturers in performing quantitative assessments. Therefore, it is important to refrain from comparing assessment results from different manufacturers unless it can be verified that the assessments were performed using the same ground rules. The desire to have a consistent set of ground rules for comparative purposes factors into the recommended use of a 20-year fleet exposure for uncorrected risk, and for the use of hazard ratios to predict the risk of events of equivalent severity (i.e., CAAM levels 3, 4 or 5).
Par 8 Page 17

AC 39-8 9/8/03
f. Engineering judgment. Regardless of how many engineering data are gathered to mathematically describe a problem, engineering judgment will always be necessary. Engineering judgment is, however, a potential source of subjectivity that can introduce uncertainty into the assessment. In assessing the need for action and the adequacy of a control program, it may be helpful to assess the potential variation in the major assumptions. This will result in a range of results. Acquiring additional data on model inputs will reduce the uncertainty and, therefore, reduce the range of possible results. This judgment and any other assumptions in the analysis need to be documented and validated to the greatest extent possible. The amount of judgment and the level of confidence in the associated validations should be considered when determining the appropriate response to the problem.
9. RISK GUIDELINES.
a. There are long-term and short-term guidelines for risk factor, and for risk per flight. These guidelines help establish whether immediate action is necessary, and also establish acceptable risk for control programs. There are guidelines for CAAM level 3 events and for CAAM level 4 events. Note that the level 3 guideline covers events predicted to be at least level 3 (i.e., levels 3, 4 and 5 events). The level 4 guideline covers events predicted to be at least level 4 (i.e., levels 4 and 5 events). This is necessary to assess the true risk exposure.
b. The per-flight guidelines apply to the average of the fleet or subfleet suspected of having the unsafe condition. The risk factor guidelines apply to the aggregate fleet or subfleet suspected of having the unsafe condition.
c. Control programs should be acceptable to both level 3 and level 4 short-term acceptable risk. Generally, for events unlikely to progress beyond level 3 (i.e., those that have low level 4 or 5 hazard ratios), the level 3 guidelines will be the limiting values. For those with high hazard ratio for level 4 and above, the level 4 guidelines will be the limiting values. Corrective actions should reflect the event’s hazard level, the probability of an event, and the size of the affected fleet. For large fleet sizes, the risk factor guideline will likely be the limiting value. For small fleets, it is likely that the risk per flight guideline will be the limiting value.
d. There are currently no mutually-acceptable, standardized guidelines for level 5 events. This is due in part to the need by all affected parties to gain more experience with and develop confidence in applying CAAM specifically to level 5 events. Once there is confidence that meaningful and useful level 5 guidelines have been developed, the FAA is committed to adding
Page 18 Par 8

9/8/03 AC 39-8
those to this AC. In the interim, while a level 5 risk evaluation should always meet the level 4 guidelines, the level 4 guidelines may not always be considered sufficient to provide adequate protection in those cases where the level 5 risk factor is a significant proportion of the level 4 risk factor.
Table 1. Risk Guidelines Level 3 Guidelines Level 4 Guidelines Risk factor Per flight Risk factor Per flight Long-term acceptable risk
-
1x10⁻⁸
-
1x10⁻⁹
Short-term acceptable risk
1.0
4x10⁻⁵
0.1
4x10⁻⁶
e. These guidelines should not be regarded as targets or typical values. The control program values should usually be lower than these guidelines unless a lower value would result in extreme resource availability difficulties. Any reasonable action which reduces the risk should be included as part of the control program (keeping in mind the principles of prioritization of resources).
f. The level 4 risk guidelines are intended to cover exposures to the most severe of “serious injuries” (i.e., life-threatening injuries). Consequently, relaxation of these guidelines may be acceptable in cases where the associated “serious injuries” are clearly not life threatening (e.g., simple fractures).
g. Risk guidelines for immediate action. If the uncorrected risk factor for the affected fleet would exceed the applicable short-term risk factor within 60 days, or the risk per flight to which airplanes would be exposed during that same 60-day period would exceed the applicable CAAM level guideline, immediate action should be considered. How “immediate” this action should be could vary from before the next flight to within 60 days depending on the nature and level of risk. If a quantitative assessment of the risk is unavailable, the decision as to the necessity of immediate action should be made based on objective judgment and expert opinion. This initial analysis is not meant to take the place of the complete and in-depth analysis typically performed during the continuing assessment of the risk posed by the identified unsafe condition. It is meant
Par 9 Page 19

AC 39-8 9/8/03
to give a best-estimate relative ranking compared to the overall contributions of all unsafe conditions, and to indicate whether continued operation without immediate corrective action is acceptable.
10. PRIORITIZATION BASED ON RISK. Figure 1 provides a useful means to graphically compare unsafe conditions based on risk calculations and the risk guidelines, helping to establish priorities. Figure 1 uses the CAAM level 3 guidelines; a similar graph for level 4 guidelines can be prepared.
a. High risk. A level 3 event is a likely occurrence when its risk plots in the area to the right of the sloped line in Figure 1 (i.e., greater than 1.0 predicted events, or risk factor). Furthermore, the malfunction is beginning to contribute more risk than the aggregate risk from all other causes, including contributions from the crew, when it plots in the area above the top horizontal line in Figure 1 (i.e., above 4x10⁻⁵ per-flight). In these instances, immediate actions, as described in this AC, may be necessary. Similar values can be established for level 4 events, an order of magnitude below the associated level 3 values; i.e., the high-risk area for level 4 events is greater than 0.1 predicted events, or above 4x10⁻⁶ per-flight. These values equate to the short-term acceptable risk guidelines. These concepts can be extended to level 5; however, the associated numerical levels have yet to be formally agreed upon.
b. Excessive risk. Exposure within the enclosed envelope in Figure 1 (i.e., to the left of the sloped line and above the bottom horizontal line) imposes sufficient risk to warrant concern and action. Effective management of the risk may be possible through voluntary compliance to the manufacturer's recommended corrective actions. However, even though the risk has been mitigated, issuance of an AD may still be required to correct the product’s Type Certificate and minimize the potential for the unsafe condition being reintroduced in future products.
c. Reasonable risk. Risk factors of 1.0 level 3 events in 100 million aircraft flights (1x10⁻⁸) meet the long-term acceptable risk guidelines. (This assumes no other aspects of the original basis of certification have been violated.) The equivalent value for level 4 events is 1 in a billion flights (1x10⁻⁹). Note that the long term acceptable risk guideline for type certification may sometimes appear less restrictive. However, as noted earlier, comparing certification and continued airworthiness assessments and guidelines can be confusing and misleading. For example, the additional accuracy potentially afforded to continued airworthiness assessments
Page 20 Par 9

9/8/03 AC 39-8
over certification assessments must be compensated for within the guidelines. Further, until CAAM hazard level 5 guidelines (and hence possibly new, less conservative, CAAM hazard level 4 guidelines) are developed, the CAAM hazard level 4 guidelines are expected to cover most level 5 threats.
1.00E-10
1.00E-09
1.00E-08
1.00E-07
1.00E-06
1.00E-05
1.00E-04
1.00E-03
1.00E+03 1.00E+04 1.00E+05 1.00E+06 1.00E+07 1.00E+08 1.00E+09
Number of Aircraft Flights (exposure)
HIGH RISK
EXCESSIVE RISK
REASONABLE RISK
IncreasingConcern
FIGURE 1. Aircraft Threat Comparison
11. CORRECTED RISK. The final goal in resolving an unsafe condition is the development and implementation of corrective actions that, when fully incorporated, minimize the probability of future events to less than the long-term acceptable risk guidelines. Interim measures, such as
Par 10 Page 21

AC 39-8 9/8/03
recurring inspections, are often effective in providing immediate risk reduction to a high-risk problem. However, recurring inspections should not be relied upon to serve as a final corrective action unless there is no practicable alternative. If the interim measures minimize the probability of additional events to below the long-term guidelines, the incorporation of the final corrective actions can be delayed to minimize resource impact. The completion of all actions to correct the unsafe condition should be done as soon as feasible and in accordance with the risk guidelines and principles. The actions shall return the product to the level of safety intended by that product's original Basis of Certification, unless an exemption from that basis is found to be in the public interest.
12. CUMULATIVE RISK.
a. If there are several unsafe conditions being resolved concurrently on the same powerplant installation, the combined risk of those various conditions may represent an unacceptable risk level for that airplane type, even if each taken individually does not. Furthermore, repeated exposure to risk levels acceptable against any single unsafe condition could be reasonably expected to result in an unacceptable risk of serious injury somewhere in the life of the worldwide transport fleet with its various unsafe conditions. The Poisson distribution explains the statistical variation associated with average prediction for rare events (see Figure 2). The 0.1 risk factor guideline for level 4 equates to a 9.5 percent probability of one or more level 4 events. If, during the life of a fleet, there are seven different malfunctions which are each managed to a level 4 risk factor of 0.1 events (i.e., cumulative level 4 forecast of 0.7 events), then it is likely that a level 4 event will occur at some point due to one of these malfunctions. Additionally, for an event forecast of 0.7, there is a 16 percent probability of two or more events and a three percent probability of three or more events.
Page 22 Par 11

9/8/03 AC 39-8
0
0.1
0.2
0.3
0.4
0.5
0.6
0.7
0.8
0.9
1
0 0.1 0.2 0.3 0.4 0.5 0.6 0.7 0.8 0.9 1
Expected Number of Fa ilures (Event Forecast)
Ze ro Events
One or More Events
T wo or More EventsT hree or More Events
FIGURE 2. Event Probability vs. Event Forecast (Risk Factor)
b. It is neither expected nor required to calculate cumulative risk nor track cumulative risk across the life of the fleet. The intent of this section is only to provide recognition that acceptable risk levels should be regarded as upper limits, to be allowed only when reducing the risk further would result in undue burden. The goal of risk analysis is not to find the most lenient program possible within acceptable risk levels. The plot of risk factor versus impact on resources follows an asymptotic relationship. This means, that at some point, any additional reduction in risk comes only at great increase in the required resources. This particular point varies from situation to situation. The engineer should decide if the reduction in risk warrants the additional burden against the available resources. Currently, no definitive standards exist for what is an acceptable cumulative risk. Additionally, no definitive standards currently exist for where the balance should be struck between decreasing risk and increasing burden. The FAA should therefore judge what actions best serve the public interest on a case by case basis, considering the cost benefit to the public and the appropriate allocation of resources. The intent of this AC is to aid in this process. Since no guidelines have been developed on cumulative risk, the guidelines published in this AC apply to individual unsafe conditions being addressed by a control program (although the individual unsafe condition may apply to several products).
Par 12 Page 23

AC 39-8 9/8/03
13. LESSONS LEARNED. Throughout the process for any one potential unsafe condition, the experience gained and lessons learned should be applied to future certification (including regulatory action as necessary) and continued airworthiness monitoring processes. This ensures continuous improvement in the effectiveness of the continued airworthiness assessment process for current products, and improves the certification assessment process and instructions for continued airworthiness for new products. Centralized accessible repositories for CAAM “lessons learned” (e.g., risk models, hazard ratios, AD worksheets, etc.) are a valuable resource. As such centralized data repositories become available for general use, reference to these resources will be included in future revisions of this AC. Given that an unsafe condition is determined to exist which is not adequately addressed by current Airworthiness Standards, an Airworthiness Directive should be issued and rulemaking action should be undertaken. In the interim, generic special conditions should be developed and imposed until such time as the new rulemaking actions are completed.
14. ALTERNATIVE METHODS OF COMPLIANCE (AMOC). The objective of an AMOC is to allow an operator or manufacturer to propose an alternative corrective action to that prescribed in an AD. The intent of the AMOC is to enable approval of options that were not necessarily conceived of at the time of AD issuance, but which provide an equivalent level of safety to that afforded by the AD. The risk assessment process described in this AC can be used to help determine if a proposed AMOC does in fact afford an equivalent level of safety. AMOCs should not result in an increase of the total risk assessed against the unsafe condition.
15. ADDITIONAL INTERNAL TRANSPORT AIRPLANE DIRECTORATE (TAD) GUIDANCE. Due to the necessity to evaluate diverse programs across diverse airplane types, the FAA TAD may choose to take the risk assessment process one step beyond ‘risk factors’ and consider the number of persons expected to be seriously injured per event. The TAD may perform this activity as required to allocate necessarily limited resources and determine what regulatory actions are justified. Appendix 6 provides this internal TAD guidance.
16. INTER-DIRECTORATE COORDINATION. It is recognized that different risk management objectives may lead to differences of opinions between directorates as to the appropriate actions to address identified unsafe conditions, or to the timing of those actions. Because of the inter-involvement of both directorates with most unsafe conditions, especially those that are highly installation-dependent, close coordination is recommended to resolve these differences. However, if these differences persist after inter-directorate coordination and
Page 24 Par 13

9/8/03 AC 39-8
discussion of the assumptions, available data and objectives, the final control program decisions rest with the directorate with the most relevant specialized technical expertise. This means that, for unsafe conditions caused primarily by shortcomings within the engine type design, the EPD is responsible for making the final control program decisions. In cases of significant installation-dependency of an engine-related unsafe condition, special care should be taken to address any installation concerns raised by the TAD. For unsafe conditions that are caused primarily by shortcomings in the airplane type design, exclusive of the engine type design, the TAD is responsible for making the final control program decisions. The primary responsibility must be respected by both directorates, and any tendency towards the writing of competing ADs by the different directorates against the same unsafe condition must be avoided. /s/ John J. Hickey Director, Aircraft Certification Service Par 16 Page 25

AC 39-8 9/8/03
APPENDICES
Appendix 1. Potential Unsafe Conditions A1-1
Appendix 2. CAAM Event Hazard Levels and Definitions A2-1
Appendix 3. Hazard Ratio Development A3-1
Appendix 4. Airworthiness Information Resources A4-1
Appendix 5. Structured Assessment Methods and Tools A5-1
Appendix 6. Additional Transport Airplane Directorate Guidance A6-1
Appendix 7. Assessment Examples A7-1
Appendix 8. Historically Potentially Unsafe Conditions A8-1

9/8/03 AC 39-8
Appendix 1
POTENTIAL UNSAFE CONDITIONS
1. PURPOSE. The objective of this appendix is to provide the user with an overview of potentially unsafe conditions. Issuance of an Airworthiness Directive (AD), in accordance with Part 39, requires that an unsafe condition exist in a product, and the condition is likely to exist or develop in other products of the same type design. This appendix presents material that can be used in reviewing actual or potential problems to determine if they should be identified as unsafe conditions. Unsafe conditions may result from design, manufacturing, operational or maintenance deficiencies as well as unforeseen changes in operations or the operating environment.
2. IDENTIFICATION OF POTENTIAL UNSAFE CONDITIONS.
a. There are at least three areas of information that can be used as a guide in identifying potential unsafe conditions. The first, and most visible, are the conditions which alone or in combination with other contributing factors have led to accidents. Such conditions or combinations have clearly been demonstrated to be unsafe. The second includes conditions that have significantly increased the probability of, but not directly caused, serious injuries. If such “contributing conditions” occur frequently enough, this too is an unsafe condition. In fact, the majority of ADs are intended to correct this type of unsafe condition. The third area of information involves hazards identified as part of the product’s certification program. Indications that the actual experience is worse than that allowed by the standards may require mitigating action to return the product to the level of safety required by the certification standards.
b. It is normal for the achieved level of safety of a product to vary throughout the lifetime of the fleet. This variation may result in some failure conditions occurring more frequently than permitted by initial certification requirements, in which case it is possible, but not necessarily the case, that an unsafe condition exists. If the risk to the airplane, passengers or crew is very much greater than permitted by initial certification standards, an unsafe condition is likely to exist. Some assessment of the degree of risk is therefore advisable if the failure condition rates significantly exceed those assumed or intended in the initial certification.
c. Recognizing the size and complexity of today’s worldwide air transportation system, it would be unusual for an identified unsafe condition to be limited to a single airplane or engine. Examples of singular events where AD action would not be expected are those caused by gross negligence or a rare meteorological phenomenon.
A1-1

AC 39-8 9/8/03
d. Conditions specified as potentially unsafe. For transport category airplanes, the FAA has defined certain specific conditions as potentially unsafe based upon previous service experience and relevant certification assessments:
(1) Historical potentially unsafe conditions. Appendix 8 of this AC contains a list of conditions considered to be potentially unsafe, along with hazard ratios where they could be calculated. Historical hazard ratio data is also contained for certain conditions in the “Technical Report on Propulsion System and APU-Related Aircraft Safety Hazards” (FAA Related Reference (1) in paragraph 2b in the main body of this AC). The proposed “2nd Technical Report on Propulsion System and Auxiliary Power Unit (APU) Related Aircraft Safety Hazards” (see paragraph 5a in the main body of this AC) will contain a fuller descriptive listing of the events covered in appendix 8.
(2) Potential unsafe conditions identified during certification assessments. Certification assessments often identify and classify failure and operating conditions according to the severity of the impacts they are expected to have on the continued operational safety of the airplane. Very severe conditions are assigned to categories such as “catastrophic”, “preventing continued safe flight and landing”, or “critical” because of their potential to directly cause serious injuries to multiple persons. Severe conditions are assigned to categories such as “emergency” or “hazardous” because of their potential to either directly cause serious injuries to a limited number of persons or to impair the ability of the flightcrew to perform their tasks. Therefore, the occurrence of any of these conditions in service is by definition a potential unsafe condition regardless of the actual outcome. More moderate conditions are assigned to categories such as “abnormal” or “major”. The occurrence of any moderate conditions in service at a high frequency may be considered a potential unsafe condition if a reasonable potential exists for it to contribute to a more serious event.
3. CATEGORIES OF FAILURES LEADING TO POTENTIAL UNSAFE CONDITIONS.
a. Single failures. The type certification regulations limit the severity and frequency of single failures. Single failures that could result in a serious injury but are not expected to result in serious injuries to multiple persons are allowed by the regulations provided the frequency of occurrence is sufficiently low. Most single failures that could result in serious injuries to multiple persons are prohibited by the regulations. However, prohibition of certain single failures is currently impracticable. These include uncontained engine rotor failure, engine case burst, engine case burnthrough, and propeller separations. For these noted exceptions, the regulations require that the hazards be minimized. When these failures or their precursors occur (e.g., a flaw is detected in a disk before the disk actually fails), the design of the component or engine is carefully reviewed to determine cause, and appropriate action is developed, as necessary, to ensure that the occurrence of similar future events is minimized. The results of the
A1-2

9/8/03 AC 39-8
investigation may require AD action to implement more effective monitoring or improved component inspections, shorter component life limits, improved maintenance procedures, or other means to minimize a reoccurrence. In addition, the design of the airplane is reviewed to ensure that the design covers the likelihood that these failures may continue to occur, and the installation incorporates design considerations to minimize the impact of these failures on the airplane.
b. Latent failures. Latent failures are failures that are unknown to the flight and maintenance crews. Certification requirements assume that any expected latent failure, in combination with the next failure, under any operating and environmental conditions approved for the airplane, should not jeopardize continued safe flight and landing. A simple example is undetected loss of fire containment in a fire zone. If the next failure releases flammable fluid into the zone, a potentially catastrophic condition exists. While the intent is that such latent failure conditions not exist, there are, as a practical matter, limitations on how frequently the operators can perform inspections on the powerplant and APU installations to note and correct such conditions. This is particularly true when such inspections require some degree of disassembly, or otherwise expose components to potential distress or human error. Where automated monitoring and indication is practical, this should be used to detect and annunciate failure conditions, especially when the next failure could lead to hazardous or catastrophic consequences. The intent is for the components of the powerplant and APU installations to continue to operate safely between normal inspections and overhauls. The intent of the inspection is not so much to discover the latent failure, but, rather, to note the proper functioning of the equipment and any safe limits of deterioration, so that the equipment can be replaced before any significant failure or malfunction occurs. An additional concern are those latent failures which were either not anticipated at all or were expected to be detectable by either the flight or maintenance crews.
c. Cascading failures:
(1) Cascading failures are those for which the probability of occurrence of a subsequent failure is substantially increased by the existence of a previous failure. These types of failures are of particular concern because they can create interdependence between structural and system design elements that are intended or assumed to be independent, or even unrelated. This is especially true when the intended means of safely accommodating a failure is affected by that failure. For example, in the structural design area, the failure of one load path should not result in loads that compromise the intended redundancy. Another example is that engine failures, such as fan blade failures, that result in a high vibration condition should not cause loss of the fuel shutoff function. A cascading failure of this sort could lead to a hazardous or catastrophic condition.
A1-3

AC 39-8 9/8/03
(2) Cascading failures in the propulsion systems area can sometimes be difficult to anticipate. In transport aircraft, failures in the systems of one engine are typically required to be independent of failures in the systems of another engine. Furthermore, a system of one engine may need to be isolated from the effects of failures within another system of that same engine. Engine systems areas where cascading failures are most likely to be of concern are the engine control systems and fuel systems.
d. Multiple failures and probability estimates.
(1) In general, the powerplant and APU installations are required to be fail-safe. That is, one assumes the failure and then ensures the resulting failure condition does not jeopardize continued safe flight and landing. For example, the shutdown of a single engine is assumed to be fail-safe since transport category airplanes have multiple engines and are certified to operate safely following the sudden failure of the most critical engine. Though combinations of failure conditions leading to violation of the fail-safe assumption are possible, the consideration of such combinations should, as a practical matter, be limited to those conditions anticipated to occur within the fleet life of the airplane type. To make such determinations, the safety assessment methods associated with § 25.1309(b) are often used. Two examples of such situations are uncontrolled engine overspeed and an adverse frequency of engine shutdowns. It is usually agreed that the first of these is a potential unsafe condition because the engine may liberate parts that could hazard the aircraft. For overspeed, the requirement for engine control system certification is that no single failure cause such a condition, and that the probability of such a condition being caused by multiple failures be less than 10-8 per flight hour (i.e., extremely remote).
(2) The second example requires attention because it is recognized that if the engine shutdowns begin occurring at an abnormally high rate, from the same or different failure conditions, the likelihood of multiple independent engine failures should be addressed. Engine shutdown rates below 2x10⁻⁴ failures per cycle should not be a cause for concern (note that other values may be listed elsewhere on a per-flight-hour basis; for example, ETOPs). In any case, if an anticipated failure or malfunction can significantly affect the continued safe operation of more that one engine within a given flight, a potential unsafe condition exists. Typically, business decisions to provide engine reliability improvements provide adequate protection against excessive IFSD rate concerns.
(3) In addition, it should be recognized that certain engine anomalies during critical flight regimes have, on occasion, resulted in accidents due to lack of recognition or appropriate
A1-4

9/8/03 AC 39-8
response to a single engine failure, especially in cases of very startling or very subtle failures. Excessive exposure to these events raises the possibility of an inappropriate response. Care should be taken in situations where certification assumptions of appropriate responses, and the timing of those responses, have been repeatedly called into question.
e. Common mode failures. This term refers to multiple otherwise independent failures occurring due to the same event. This type of failure differs from “cascading failures” in that the multiple failures occur in parallel rather than in series. That is, the same event causes each failure independently rather than the first failure causing the second, and so on. The most frequently encountered common mode threats are those associated with environmental conditions and human error. Environmental factors include heavy rain and hail, icing, bird ingestion, etc. Human-caused common failures include fuel contamination or mismanagement, procedural deviations, and maintenance errors. There are no regulations specifying that any engine-related maintenance be conducted on only one engine at a time. For example, prior to long flights, it is common to service engine oil in all engines. Some cases are probably unavoidable. However, it should be recognized that there are many instances of multiple engine shutdown due to common cause maintenance error (e.g., chip detector reinstall, O-ring removal, etc.) leading to unsafe conditions.
A1-5

AC 39-8 9/8/03
Appendix 2
CAAM EVENT HAZARD LEVELS AND DEFINITIONS
1. PURPOSE. This appendix outlines propulsion system malfunctions or related incidents, in certain cases coupled with crew error or other aircraft system malfunctions, resulting in the following consequences to the aircraft or its passengers/crew.
2. CAAM LEVELS.
LEVEL 5 - CATASTROPHIC CONSEQUENCES.
Catastrophic outcome (reference Catastrophe as defined by draft AC 25.1309-B) - an occurrence resulting in multiple fatalities, usually with the loss of the airplane.
LEVEL 4 - SEVERE CONSEQUENCES.
a. Forced landing. Forced landing is defined as the inability to continue flight due to the consequences of damage, uncontrolled fire or thrust loss where imminent landing is obvious but aircraft controllability is not necessarily lost (i.e., total power loss due to fuel exhaustion will result in a "forced landing”). The term "emergency landing" may also be used to mean a forced landing if there is an urgent requirement to land, but declaration of an emergency does not necessarily imply that a forced landing is imminent. An air turn back or diversion due to a malfunction is not a forced landing, since there is a lack of urgency and the crew has the ability to select where they will perform the landing. However, off-airport landings are almost always forced landings.
b. Actual loss (hull loss) of aircraft (as opposed to economic) while occupants were on board.
c. Serious injuries or fatalities. The NTSB definition of "serious injury" means any injury that:
(1) Requires hospitalization for more than 48 hours, commencing within seven days from the date the injury was received,
A2-1

9/8/03 AC 39-8
(2) results in the fracture of any bone (except simple fractures of fingers, toes or nose),
(3) involves lacerations that cause severe hemorrhages, nerve, muscle or tendon damage,
(4) involves injury to any internal organ, or
(5) involves second or third degree burns or any burns affecting more than five percent of the body surface, and
(6) "fatal injury" is defined as an injury that results in death within 30 days of the accident.
Note 1: The level 4 risk guidelines are intended to cover exposures to the most severe of “serious injuries” (i.e., life-threatening injuries). Consequently, relaxation of these guidelines may be acceptable in cases where the associated “serious injuries” are clearly not life threatening (e.g., simple fractures). Note 2: Injuries resulting from an emergency evacuation rather than from the event which caused the evacuation are not considered in evaluating the severity of the event. It is recognized that emergency evacuations by means of the slides can result in injuries without regard to the kind of event precipitating the evacuation.
LEVEL 3 - SERIOUS CONSEQUENCES.
a. Substantial damage to the aircraft or second unrelated system.
(1) "Substantial damage" in this context means damage or structural failure that adversely affects the limit loads capability of a Primary Structural Element or the performance or flight characteristics of the aircraft, and that would normally require major repair or replacement of the affected components. Typically not considered “substantial damage” (because they do not generally result in the effects delineated above) are:
• engine failure damage limited to the engine or its mounts, • bent fairings or cowlings, • dented skin, • small puncture holes in the skin or fabric, • damage to landing gear associated with runway departures, • wheel, tires, • flaps,
A2-2

AC 39-8 9/8/03
• engine accessories on failed engine, • brakes or • wing tips.
(2) Damage to a second unrelated system must impact the ability to continue safe flight and landing. Coordination and agreement between the engine/propeller/APU manufacturer and the airframe manufacturer may be required to properly categorize events related to second system damage. In general, aircraft are designed to be dispatched with one part of a redundant system inoperative with no effect on flight safety. Therefore, an uncontained rotor event which severed an unrelated hydraulic system line without significantly degrading the ability to continue safe flight should not be considered a level 3a event.
(3) Small penetrations of aircraft fuel lines or aircraft fuel tanks, where the combined penetration areas exceed two square inches, is a level 3a classification (The concern is exhaustion of fuel reserves.) Assistance of the airframe manufacturer should be sought when questions arise.
(4) Damage to a second engine that results in a significant loss of thrust or an operational problem requiring pilot action to reduce power is a level 3a event. Minor damage which was not observed by the crew during flight and which did not affect the ability of the engine to continue safe operation for the rest of the flight is should not be considered a level 3a event.
b. Uncontained (uncontrolled) fires. Fire outside the fire zone is level 3. The concern is impinging flames onto the wing/fuselage or acting as an ignition source for flammable material anticipated to be present. Localized fires with very limited fuel sources (such as gearbox and IDG fires) may exit the fire zone in locations remote from the wing, fuselage and airplane structure or flammable material anticipated to be present and thus not be deemed level 3 since they do not present the above concern. Fires inside the fire zone are not level 3 unless they escape.
c. Rapid depressurization of the cabin.
d. Permanent loss of thrust or power greater than one propulsion system (inflight).
e. Temporary or permanent inability to climb and fly 1000 feet above terrain (increased threat from terrain, inclement weather, etc.) along the intended route that results in restricted
A2-3

9/8/03 AC 39-8
capability (i.e., multiple propulsion system malfunctions or single propulsion system malfunctions and/or other aircraft system malfunction or crew error.)
f. Any temporary or permanent impairment of aircraft controllability caused by, for instance, propulsion system malfunction, thrust reverser inflight deployment, propeller control malfunction, or propulsion system malfunction coupled with aircraft control system malfunction, abnormal aircraft vibration, or crew error.
g. Malfunctions or failures that result in smoke or other fumes, delivered through the ECS system, that result in a serious impairment. Serious impairment includes the loss of crew’s ability to see flight deck instrumentation or perform expected flight duties. Purely psychological aspects of the concern of odors, etc., are not to be included, nor are concerns about long-term exposure.
3. LOWER HAZARD LEVELS.
A means to differentiate between CAAM hazard levels 0, 1 and 2, as delineated within the “Technical Report on Propulsion System and APU-Related Aircraft Safety Hazards” (FAA Related Reference (1) in paragraph 2b in the main body of this AC), is not necessary for the purposes of this AC. Consequently, the FAA EPD and TAD have not attempted to reach agreement on or include these definitions in this AC.
4. GENERAL NOTES APPLICABLE TO ALL EVENT HAZARD LEVELS.
a. The severity of aircraft damage is based on the consequences and damage that actually occurred.
b. Uncontained event damage definitions have been modified from those used in Society of Automotive Engineers Aerospace Information Reports (AIR 1537, AIR 4003, and AIR 4770) with respect to a level 3 secondary system damage event. The objective has been to more clearly define and separate those events that had a major impact on continued safe flight and landing from those with lesser consequences.
c. These definitions have been revised slightly from the original CAAM data report (FAA Related Reference (1) in paragraph 2b of this AC) to reflect the activity associated with the planned updated report.
A2-4

AC 39-8 9/8/03
Appendix 3
HAZARD RATIO DEVELOPMENT
1. PURPOSE. This appendix describes methodologies to estimate the hazard ratio for use in risk assessments.
2. GENERAL. The hazard ratio converts the basic event risk factor to a risk factor for CAAM levels 3, 4, and/or 5 events. It does this by estimating the conditional probability of a 3, 4, and/or 5 CAAM level event given the occurrence of the basic event. Developing a hazard ratio will require considerable engineering judgment. The hazard ratio strongly influences the quantitative assessment results and, therefore, should have a sufficient validation basis or be assessed conservatively. Hazard levels are used for CAAM levels 3, 4 and/or 5, as is appropriate, to establish the appropriate comparison of the risk of the unsafe condition to the CAAM guidelines.
3. HAZARD RATIO DEVELOPMENT. The following methods should be employed to establish the hazard ratio for a given CAAM level (X):
a. At least one level X or higher event has occurred.
(1) Data. When at least one level X or higher event has occurred, use the value obtained by dividing the number of level X or higher events by the total number of events. If the latest event used in the calculation was not level X or higher, add one additional level X event, and one additional event to the totals (e.g., 1:4 becomes 2:5). The addition of another event is to provide an element of conservatism for the true value of the hazard ratio as estimated by the data to date. Alternatively, use the ratio obtained by counting only the events up to and including the most-recent level X event. For example, a history of 6 events, in the sequence 0 0 X 0 0 0, would result in a level X hazard ratio of 1:3 at the time the last level X occurred as opposed to assuming an additional event for a hazard ratio of 2:7. This method may be used when it produces a more conservative result (as in the example above).
(2) Analysis. If analysis suggests the true hazard ratio, that ratio may be used. For example - for a particular airplane, a propeller blade will pass through the fuselage if it is released within a 90o arc. The hazard ratio (assuming level 4 for serious injury to passengers seated in the plane of the propeller) would then be 90o/360o=0.25 level 4 events given a blade
A3-1

9/8/03 AC 39-8
release. This method has particular value where little data exists. Note that when the hazard ratio obtained by analysis is significantly different than what would be calculated from the observed data, it is strongly suggested that the observed data be used to establish the hazard ratio.
a. No level X or higher events have occurred.
(1) Historical data. Appendix 8 of this AC and the “Technical Report on Propulsion System and APU-Related Aircraft Safety Hazards” (FAA Related Reference (1) in paragraph 2b of this AC) provide hazard ratios for CAAM levels 3, 4 and (in the case of appendix 8) 5 events. These historical hazard ratios should be used cautiously. The hazard ratio is installation dependent, and the historical hazard ratio may be skewed by the historical data available for the affected aircraft installation. Reading the summaries of the events from which the hazard ratios were developed will provide valuable insight into the applicability of the data. (Note that appendix 8 does not contain event summaries; however, the “2nd Technical Report” will contain those summaries when it is published.) Some examples of the installation dependency of the hazard ratio are supplied here for illustration:
(A) Engine separation. There are a large number of examples of engine separation in flight on older aircraft without adverse effects upon airplane control. More recent designs of aircraft, although designed with the same intent of allowing safe separation, have encountered difficulties after the separation of high bypass ratio engines. Separation of a wing-mounted engine may have very different consequences than separation of a tail-mounted engine.
(B) Uncontained rotor. The potential effect of an uncontained rotor depends largely upon the airplane systems in the plane of the rotor and their proximity to the engines. The effects may be very different for a wing-mounted installation and a fuselage-mounted installation.
(2) Next event assumption. Where no level X or higher event has occurred, and no industry-wide data are available or suitable, a conservative hazard ratio may be established by assuming the next event would be level X or higher (e.g., 0:4 becomes 1:5). There may be cases where this method is overly conservative.
(3) Analysis. As described above, engineering analysis may allow for accurate estimation of the hazard ratio.
A3-2

AC 39-8 9/8/03
4. NOTES ON HAZARD RATIO DEVELOPMENT. Communication between the engine/propeller/APU manufacturer, installer, operators and the FAA is often necessary, especially if no appropriate historical hazard ratio is available. Additionally, it may be necessary to use engineering judgment to assess the impact of unique features of a specific powerplant or APU installation.
5. USE OF THE HAZARD RATIO. Use of the hazard ratio allows the conversion of the base level event to the CAAM level event. For example, if, using the methods outlined above, the level 3 hazard ratio is estimated at 2/6 (.33), the risk factor for the base event can be converted to a risk factor for level 3 events by multiplying the base event risk factor by the hazard ratio.
A3-3

9/8/03 AC 39-8
Appendix 4
AIRWORTHINESS INFORMATION RESOURCES
1. PURPOSE. This appendix provides a brief description of some airworthiness information resources that may be of use in supporting continued airworthiness assessments. More complete data may be available from the manufacturer. The types of information resources chosen depend on the depth and scope of the required analysis, which in turn is based on the type, frequency and severity of the unsafe condition.
2. REPORTING OF AIRWORTHINESS INFORMATION.
a. Airworthiness information is available in many forms from many sources. Such information is provided to the FAA by the manufacturers, operators, and design approval holders of products in response to either routine reporting requirements (e.g., §§ 21.3, 121.703, 121.705, special agreements with manufacturers, bilateral reporting agreements with foreign authorities, etc.), or special airworthiness information requests made under the authority of section 44709 of Title 49 US Code (49 USC 44709). Safety recommendations issued by the NTSB and the FAA Office of Accident Investigation provide information on the airworthiness of powerplant and APU installations. Additional sources of information on the airworthiness of a product are frequently contained in documents (service bulletins, service letters, changes to flight or operations manuals) developed by the manufacturers. In addition, airworthiness information can be acquired by the FAA from technical committees, research programs, databases, etc.
b. Regular reporting. Sections 21.3, 121.703, and 121.705 mandate reporting of various service information. These reports should be reviewed to identify any existing or potential unsafe conditions. Additionally, the occurrence rate of any reported type of event, whether or not it is expected to individually result in an unsafe condition, should be monitored to ensure it does not unacceptably contribute to the risk of an unsafe condition. For example, § 21.3(c)(10) requires the reporting of all engine failures. The rate of engine failures should be tracked to ensure that the risk of dual-engine failure is not of concern. In addition, routine reporting can and should be used to establish what is “normal” so that when “abnormal” conditions occur, they are more easily recognized. Routine reporting is typically used proactively to monitor for trends that could affect continued airworthiness.
c. Special reporting. Based on the reviews outlined in paragraph 2a above, conditions may warrant the need for special reporting under the authority of section 44709 of Title 49 of the
A4-1

AC 39-8 9/8/03
United States Code (40 USC 44709) and section 21.99 of Title 14 of the Federal Regulations (14 CFR 21.99). For example, the FAA may need special reporting to gather information to help establish the root cause, total rate of occurrence, and conditional probability of an unsafe condition. The FAA may also need inspection results to determine the number of incipient failures and operational information to establish the extent of the population at risk. The FAA may require immediate fleet-wide inspections to determine the extent of a condition. These actions may result in a one-time inspection and correction procedure or a periodic inspection to monitor a situation until a revised design or other permanent fix is available. Special reporting is typically used reactively to investigate, understand, and resolve specific problems or incidents.
d. Regular review of this airworthiness information is intended to help proactively identify potential or actual unsafe conditions. Continued monitoring after identification of the unsafe condition is necessary to ensure corrective actions are providing their intended effects.
e. Monitoring the available data on failure conditions against the assumptions inherent in the original certification compliance, both for occurrence rates as well as outcome, allows for a proactive comparison of the safety-significant assumptions of certification with the actual situation in the fleet.
3. OTHER SOURCES OF AIRWORTHINESS INFORMATION. Several other types of airworthiness information may be considered for use in a continued airworthiness assessment:
a. In-service problems.
(1) In-service experience related to the type design: accident, incident, events, operational feedback, shop and test findings, and configuration status. The Air Transport Association of America (ATA) uses the “Airworthiness Concern Coordination Process” (ATA Spec 111) to coordinate fact finding and data reporting when airworthiness problems arise. This information is also collected and organized within numerous databases, many of which are readily accessible to the FAA and others (see paragraph 4 below).
(2) Relevant experience with similar designs/configurations.
(3) Procedural changes proposed or adopted by one or more operators.
b. Product design, production, and operational information.
A4-2

9/8/03 AC 39-8
(1) Certification compliance data.
(2) Quality review reports, test results.
(3) Maintenance, flight and ops manuals.
(4) Maintenance and operations specification.
(5) Maintenance and flight crew training materials.
(6) Simulations, mock-ups, models.
c. Design approval holder proposed changes.
(1) Proposed type design changes.
(2) Service bulletins.
(3) Changes to recommended operating procedures.
4. AIRWORTHINESS DATABASES. This section lists some of the databases and how the FAA and others can access them. Please note that listed websites were correct at the time of publication. However, web addresses may have changed since then. Use of search engines is recommended to locate the current sites.
a. Many airworthiness databases are available through the National Aviation Safety Data Analysis Center (NASDAC). This center was established to serve as a centralized directory and repository of aviation safety data. It provides on-site technical and analytical support and a series of automated analysis tools. The data it provides includes a variety of historical accident/incident data as well as supporting data such as airport files, registry, and air taxi operator listings. NASDAC also maintains a document list of databases, which are available through NASDAC and other organizations, entitled, "Guide to Data Systems Used in Aviation Safety Analysis". On-line access to NASDAC is available through either the FAA Intraweb (“intraweb.nasdac.faa.gov”; requires password registration) or the Internet (“nasdac.faa.gov”).
b. In addition to NASDAC, there are other on-line sources of airworthiness information, including those maintained internally within the FAA’s Aircraft Certification Division (AIR).
A4-3

AC 39-8 9/8/03
These are individual to each directorate; see the directorate office for specific information. Some airworthiness databases are also published in paper document or digital medium (usually Compact Disc) form.
c. The following is a list of databases that contain information related to airworthiness issues. Some of these databases are not available to the public and others may require a fee for access. However, since airworthiness information resources change rapidly, this listing should be viewed as a dated guide and not an accurate or complete listing.
(1) NTSB aviation accident data system:
Source: NTSB Available from: The NTSB website (www.ntsb.gov) or through NASDAC (1983 to date, updated weekly). Contains: Information collected during investigations of accidents or incidents involving civil aircraft within the U.S., its territories and possessions, and international waters. NTSB is the official source of accident data and their causal factors. Database includes preliminary and final reports, narratives, and findings. In addition, “NTSB Recommendations and FAA Responses” are available.
(2) National Airspace Information Monitoring System (NAIMS):
Source: FAA/ASY100 Available from: ASY website (www.asy.faa.gov) or through NASDAC (1987 to date, updated monthly). Contains: Subsystems PDS, OEDS, NMACS, and VPDS as described below:
(A) Pilot Deviation System (PDS): Contains pilot deviation reports resulting from a violation of the Code of Federal Regulations (CFRs) or a NORAD Air Defense ID Zone tolerance. New reporting forms went into effect in 1992.
(B) Operational Error and Deviation System (OEDS): This contains all operational error or deviation reports that have occurred in the NAS. Additionally, it also contains causal factor information.
A4-4

9/8/03 AC 39-8
(C) Near Midair Collision System (NMACS): Contains pilot reported near midair collision incidents. Reporting is voluntary and often subjective, and pilots may report to NASA (through ASRS) instead of FAA. New reporting forms went into effect in 1992.
(D) Vehicle/Pedestrian Deviation System (VPDS): Contains information on incidents involving entry or movement on an airport movement area by a vehicle operator or pedestrian that has not been authorized by ATC.
(E) Runway Incursion System (RI): Contains information derived from OEDS, VPDS, and PDS airport surface incidents that created a collision hazard or resulted in loss of separation with an aircraft taking off, intending to take-off, landing, or intending to land.
(F) Aircraft Operations (operations) (tower counts): This database contains operations conducted since 1987 at air traffic control facilities and is used to normalize accident and incident rates.
(3) FAA Accident/Incident Data System (AIDS):
Source: FAA/Flight Standards (AFS) - AFS-410 Available from: ASY website (www.asy.faa.gov/safety_data) or through NASDAC (1985 to date, updated monthly). Contains: Data records for incidents gathered from FAA Incident Report Form 8020-5, and teletype preliminary data. AIDS is most useful for incidents since NTSB is the official source of accident information.
(4) Service Difficulty Reporting System (SDRS):
Source: FAA/AFS-600 Available from: the FAA website redirects to an external search site (http://www.landings.com/aviation.html). Contains: General aviation malfunction and defect reports and air carrier mechanical reliability report subsets. Air carriers, field offices, manufacturers, and individuals submit data.
(5) Aviation Safety Reporting System (ASRS):
Source: NASA/Ames Laboratory Available from: NASA website (http://asrs.arc.nasa.gov/report_sets_nf.htm; 1976 to date),
A4-5

AC 39-8 9/8/03
NASDAC (1988 to date, updated quarterly), ASY website (www.asy.faa.gov/safety_data), or commercial CD-ROM. Contains: Voluntary reports of occurrences that could impact aviation safety. Approximately 30,000 reports are submitted each year by pilots, controllers, flight attendants, mechanics, other interested parties, and users of the NAS. Human factors information in the narratives. All privacy or identifying data is expunged or “sanitized”.
(6) National Flight Data Center (NFDC):
Source: NFDC Available from: Through the Bureau of Transportation Statistics (www.bts.gov) or through NASDAC (updated every 56 days). Contains: Subsystems AF, LF, LI, NA, and FX as described below:
(A) Landing Facilities (LF): Contains information on all private and public use landing facilities (airports, heliports, gliderports, etc.) including location, services, runway, lighting, administrative, and remarks.
(B) Air Route Traffic Control Center (AF): Contains records for each Air Route Traffic Control Center Facility. The Air Route Traffic Control Center Facility File (ARTCC) contains all Remote Air/Ground Facilities (RCAG), Air Route Surveillance Radars (ARSR), Secondary Radar (SECRA), and Center Radar Approach Control Facilities (CERAP), under US area of responsibility. The database does not include any foreign facilities or radars.
(C) Radio Fix (FX): Contains named and numbered radio fixes used in airway navigation. Includes: waypoints, reporting points, turning points, military fixes, ARTCC boundary crossing points, and airway intersections. Information includes positional, charting, and fix facility makeup.
(D) Location Identifiers (LI): One record for each identifier assigned to an active facility. Describes all facilities (airports, instrument landing systems, navigational aids, Flight Service States, Air Route Traffic Control Centers, and special use) assigned to that identifier.
(E) Navigational Aids (NA): Description of all VHF Omni-directional Range (VOR), Non-directional Beacon (NDB), Tactical Air Navigation (TACAN), Fan Marker, and Consolan facilities used in airspace navigation. Information includes location, position, class, features, frequencies, and associated fixes.
A4-6

9/8/03 AC 39-8
(7) Aircraft Registry (AR):
Source: FAA/AFS-700 Available from: AFS-700 website (http://registry.faa.gov/), or through NASDAC (real time updates), or the Public Documents Room in the Registry Building at the Mike Monroney Aeronautical Center in Oklahoma City, Oklahoma. Contains: The FAA aircraft registry data system used to record and track civil aircraft registered in the United States. Registration occurs at the Federal Aviation Administration in Oklahoma City where the appropriate information is obtained and recorded from the aircraft purchaser. The Registry maintains the permanent records of over 320,000 active civil aircraft. Information recorded in the registry includes the aircraft registrant's name, address and state. Information on the aircraft includes the engine manufacturer and type, the aircraft N number, serial number, make model code, year of manufacture and much more including special use of the aircraft (agricultural or patrolling for example) and number of seats.
(8) Aviation System Indicators (SI):
Source: FAA/System Safety (ASY) Available from: FAA intranet ASY website (www.asy.faa.gov) or NASDAC (1987 to data, updated quarterly). Contains: Excel spreadsheets with monthly flight-hours data and accident/incident rates categorized according to large air carriers, commuters, air taxis, general aviation and rotorcraft. While published System Indicator reports cover limited periods, the database contains all data from 1987 to current, and is updated quarterly.
(9) FAA Flight Standards Service Aviation Information Website:
Source: AFS Available from: AFS-AI website (av-info.faa.gov). Contains: Utilization and fleet age information (by U.S. operator), Airworthiness Directives, Technical Standard Orders (TSO's), Special Airworthiness Information Bulletins (SAIB's) and other FAA notices, SDR query and summary capability, and Type Certificate Data Sheets (TCDS's) and Supplemental Type Certificates (STC's).
A4-7

AC 39-8 9/8/03
(10) Bureau of Transportation and Statistics (BTS) (Formerly RSPA):
Source: BTS Available from: BTS website (www.bts.gov) or through NASDAC. Contains: Subsets T1, T2, T3 and A1 as described below:
(A) BTS Form 41 Reports - Traffic Schedule (T1): Monthly totals since 1990 for large certified air carriers of capacity and traffic data including: departures, passenger and cargo traffic, and available seats and cargo capacity. All are classified as scheduled or nonscheduled, first class or coach, civilian or military.
(B) BTS Form 41 Reports - Traffic Schedule (T2): Delivered quarterly by summarizing data submitted since 1991 by U.S. carriers in their monthly T-100 Segment/Market reports and their quarterly supplemental Schedule T-2. All data items summarized by carrier, date, and aircraft type.
(C) BTS Form 41 Reports - Traffic Schedule (T3): Quarterly totals since 1991 for: reporting carriers, each airport served, departures and passenger and cargo traffic enplaned, both scheduled and nonscheduled service as well as departures by each aircraft type which served the airport.
(D) BTS Form 41, 298-C (A1): Contains statistics pertaining to the commuter air carrier.
(E) BTS bulletin board system: Form 41 Financial Data, consisting of balance sheets, profit and loss statements, and aircraft operating expenses since 1992.
(11) Airclaims Data System (AC):
Source: Airclaims Group, UK Available from: Airclaims (www.airclaims.co.uk; subscription required) or through NASDAC (1952 to date); some directorates may have hard copy versions, which are updated yearly. Contains: Worldwide accident data from government sources and insurance claim information on accidents involving fatalities or major financial loss, as well as exposure and other operations data. Airclaims also has world fleet registration and utilization data.
A4-8

9/8/03 AC 39-8
(12) Aviation data compact disc:
Source: NASDAC Available from: NASDAC. Contains the following listings:
(A) Licensed pilots
(B) Aircraft owners
(C) Licensed mechanics
(D) Medical examiners
(E) Airports
(F) SDRS
(G) Air taxis
(H) Schools
(13) ATP navigator compact disc:
Source: Aircraft Technical Publishers Available from: ATP or NASDAC. Contains the following information:
(A) Airworthiness Directives(AD)
(B) Associated Service Information
(C) Type Certificates
(D) Supplemental Type Certificates
(E) Advisory Circulars (ACs)
A4-9

AC 39-8 9/8/03
(F) Orders
(G) Code of Federal Regulations (CFRs)
(14) Airworthiness Directives compact disc:
Source: FAA/AIR (each directorate may have copies) Available from: Source or through NASDAC. Contains: The following information:
(A) Revisions for 97-10
(B) Airworthiness Directives (ADs)
(C) Advisory Circulars (ACs)
(D) Code of Federal Regulations (CFRs) 1-199
(E) Service Bulletins
(F) Type Certificates V1-6
(15) Aviation publications compact disc:
Source: Available from: Through NASDAC. Contains: The following information:
(A) Code of Federal Regulations (CFRs)
(B) Airman’s Information Manual (AIM)
(C) Advisory Circulars (ACs)
(D) Airworthiness Directives (ADs)
(16) Jane’s compact disc:
A4-10

9/8/03 AC 39-8
Source: Jane’s Available from: Jane’s website (www.janes.com) or through NASDAC. Contains: Jane’s Encyclopedia of Aircraft.
(17) Safety Performance Analysis System (SPAS):
Source: FAA/AFS Available from: SPAS website (home.spas.faa.gov/spas.asp; training required prior to access). Contains: A computer-based application that can be used to evaluate both current and historical safety related aviation data. SPAS collects data over time to show trends, to help users spot anomalies, and to provide a visual comparison to already established thresholds. The data used comes from a variety of data sources, such as the National Program Tracking and Reporting Subsystem (NPTRS), National Vital Information Subsystem (NVIS), Service Difficulty Reporting Subsystem (SDRS), NTSB accident data base, AIDS, and Airworthiness Directives Subsystem (ADS).
(18) The Aviation Safety/Accident Prevention (ASAP):
Source: FAA ASW-100 Available from: Contact ASW for access. Contains: A locally-generated and maintained database tool that links Service Difficulty Reports (SDRs) and Accident/Incident Data by Air Transport Association of America (ATA) code, part number, etc. There are approximately 350,000 entries for rotorcraft and fixed-wing airplanes. ASAP also includes Airworthiness Directives.
(19) World Airline Accident Summary (WAAS):
Source: The British Civil Aviation Authority (CAA) Available from: CAA Contains: Accident summaries.
(20) Air Transportation Oversight System (ATOS):
Source: FAA/AFS Available from: ATOS website (www.faa.gov/avr/afs/ATOS). Contains: Airline oversight information, including surveillance system design, system safety attributes and risk indicators.
A4-11

AC 39-8 9/8/03
d. In addition to these readily-available airworthiness databases, there are numerous other databases indirectly available. These include databases maintained by individual manufacturers, operators, insurance companies, etc. Under the authority of section 44709 of Title 49 US Code (49 USC 44709), the FAA can request whatever airworthiness information is needed from those it regulates. The FAA also can purchase needed data from those entities, such as insurance companies, which it does not regulate. Access to individual manufacturer databases is obviously not available to the general public.
e. In addition to the described databases in this appendix, there are numerous other types of airworthiness information available to the FAA and others. An example of this information is the Boeing Commercial Airplane Group's "Statistical Summary of Commercial Jet Aircraft Accidents", which includes both Boeing and non-Boeing aircraft. A wide variety of expert assessments (and associated data) on specific safety trends (e.g., uncontained rotor failures, bird ingestion, icing) are also publicly available in report form through many organizations such as: the Society of Automotive Engineers (SAE), Flight Safety Foundation (FSF), International Civil Aviation Organization (ICAO), and the AIA. Additionally, the “Technical Report on Propulsion System and APU-Related Aircraft Safety Hazards” documents the 10 years of engine, propeller and APU events comprising the CAAM database.
A4-12

9/8/03 AC 39-8
Appendix 5
STRUCTURED ASSESSMENT METHODS AND TOOLS
1. PURPOSE. This appendix briefly describes various structured methods and tools that are available to provide qualitative and quantitative insights into the existence, causes, risks, and resolutions of potential and actual unsafe conditions. These structured methods and tools should be used to support experienced engineering and operational judgment.
2. RELEVANT STRUCTURED METHODS AND TOOLS. There are a variety of analytical tools that can aid in the process of identifying potential unsafe conditions and resolving those judged to be actually unsafe. These include both qualitative and quantitative techniques. Listed below are categories of methods. These are described in greater detail in Society of Automotive Engineers (SAE) Aerospace Recommended Practice (ARP) 4761, “Guidelines and Methods for Conducting the Safety Assessment Process on Civil Airborne Systems and Equipment”. The tools listed are variously applicable to both the identification and risk estimation steps.
a. Deductive analysis methods. The following tools enable analytical assessments of components and systems from the general level to the specific: Decision tree, fault tree analysis, Markov analysis, dependency diagram analysis, success trees, functional hazard assessment, similarity assessment, common cause analysis, root cause analysis, and consensus expert opinion.
b. Inductive analysis methods. The following tools enable analytical assessments of components and systems from the specific level to the general: Failure modes and effects analysis, failure modes and effects summary, and manufacturing tolerance assessments.
c. Statistical and numerical methods. Often, either inductive or deductive analysis methods are used to qualitatively identify the characteristics of either populations or failure conditions, or both, for which quantitative insight is desired. The following tools are used to quantitatively model and evaluate those characteristics: Weibull and other distributional analyses, and Monte Carlo simulation.
d. Trend analysis. The following tools help to identify time-related changes in a monitored characteristic: Time series and cu-sum (cumulative sum).
A5-1

AC 39-8 9/8/03
e. Population analysis. The following tools help to identify whether segments of the exposed population are at greater or lesser risk of the unsafe condition: Pattern plot (i.e., pictorial representation of data), and analysis of variance (ANOVA).
f. Automated event, threshold level, or trend alarms. These tools provide alerts/warnings when typical or expected event rates are exceeded. Some examples of such tools are the alerts/warnings from the FAA Flight Standards Safety Performance Analysis System (SPAS) and the Extended-range Twin-engine Operations (ETOPS) warning and alert levels.
3. MATRIX OF STRUCTURED METHODS AND REFERENCES. The following matrix of objectives, available methods and tools, and associated references can be used to locate relevant details on some of the more prominent structured methods, tools and associated information.
OBJECTIVE METHODS AND TOOLS RELEVANT REFERENCES
Identify failure modes of a
specified component
Similarity Analysis using
historical failure modes data
Mil-Std-217-E;
“Reliability Engineers’ Toolkit”
Rome Laboratory/ERSR
525 Brooks Road
Griffiss AFB, NY 13441
Common Cause Analysis – used
to look at the “zonal”, “particular
risk”, and “common mode”
stresses to which installed
components will be exposed
SAE ARP 4761;
AC 25.1309-1B
A5-2

9/8/03 AC 39-8
OBJECTIVE METHODS AND TOOLS RELEVANT REFERENCES
Identify failure modes of a
specified component (continued)
Stress Analysis (Parts stress
method, structural,
Electromagnetic Compatibility
(EMC), etc.) – used to determine
the effects of applied stresses on
the component
Mil-Std-217;
Mil-Std-756B;
System Safety Analysis
Handbook, 1993;
Stress and Strain Data Handbook,
Hsu, Teng H., 1986;
NASA Structural Analysis
(NASTRAN)
Identify potential unsafe
conditions
Trend or event rate-based alarms FAA SPAS;
AC120-42A, "Extended Range
Operation with Two-Engine
Airplanes (ETOPS)"
Conditional Similarity Appendix 8 of this AC;
SAE ARP 4761;
AC 25.1309-1B
Analysis of Variance (ANOVA) Snedecor and Cochran, Statistical
Methods, or any other statistics
textbook
Cumulative Sum Analysis (Cu-
Sum) to sum the cumulative
occurrence rate of events versus
time
Sachs, Lothar (1984), Applied
Statistics: A Handbook Of
Techniques, New York:
Springer-Verlag., pp. 201-202
A5-3

AC 39-8 9/8/03
OBJECTIVE METHODS AND TOOLS RELEVANT REFERENCES
Common Cause Analysis SAE ARP4761;
AC 25.1309-1B
Identify potential unsafe
conditions (continued)
Failure Modes and Effects
Analysis (FMEA) – a qualitative
or quantitative bottom-up
analysis for conditions typically
due to foreseeable single or
multiple failures at the
component, assembly, system, or
aircraft level. A failure mode,
effects, and criticality analysis
(FMECA) is the combination of
an FMEA and a criticality
analysis.
SAE ARP 4761;
AC 25.1309-1B;
Mil-Std-1629A
Functional Hazard Assessment
(FHA) – a qualitative top-down
analysis for conditions due to
foreseeable malfunctions
SAE ARP 4754;
SAE ARP 4761;
AC 25.1309-1B
Identify potential causes of a
specified condition
Fault Tree Analysis (FTA);
Dependence Diagram Analysis –
qualitative top-down for
conditions due to multiple
independent failures or events
SAE ARP 4761;
AC 25.1309-1B
A5-4

9/8/03 AC 39-8
OBJECTIVE METHODS AND TOOLS RELEVANT REFERENCES
Identify potential causes of a
specified condition (continued)
Failure Modes and Effects
Analysis (FMEA) – qualitative
bottom-up for conditions due to
single or multiple failures
SAE ARP 4761
Common Cause Analysis –
qualitative top-down for
conditions due to multiple
failures resulting from a single
event
SAE ARP 4761;
AC 25.1309-1B
Root Cause Analysis “Root Cause Analysis – Effective
Problem Solving and Beyond”,
Apollo Associated Services
Identify the effects of a specified
failure
Failure Modes and Effects
Analysis (FMEA)
SAE ARP 4761;
AC 25.1309-1B
Event Tree Analysis System Safety Analysis
Handbook, 1993
Fault Insertion Testing
Common Cause Analysis SAE ARP4761;
AC 25.1309-1B
A5-5

AC 39-8 9/8/03
OBJECTIVE METHODS AND TOOLS RELEVANT REFERENCES
Assess the rate of a specified
failure
Historical failure rate data on
similar components
Mil-Std-217-E;
Mil-Std-756B;
“Reliability Engineers’ Toolkit”
Rome Laboratory/ERSR
525 Brooks Road
Griffiss AFB, NY 13441
(315) 330-4726;
“Summary of Failure Rates”,
GIDEP
Lognormal, Poisson, and other
Statistical analyses.
Snedecor and Cochran, Statistical
Methods, or any other statistics
textbook
Weibull Analysis for failure life
distributions
AFWAL-TR-83-2079, “Weibull
Analysis Handbook”
Assess the severity of a specified
condition
Historical Hazard Ratio FAA, “Technical Report on
Propulsion System and APU-
Related Aircraft Safety Hazards”;
Appendix 8 of this AC
Hazard Classification SAE ARP 4761;
AC 25.1309-1B
Common Cause Analysis SAE ARP 4761;
AC 25.1309-1B
A5-6

9/8/03 AC 39-8
OBJECTIVE METHODS AND TOOLS RELEVANT REFERENCES
Assess the probability of
occurrence of specified failure
conditions
Fault Tree Analysis (FTA),
Dependence Diagram Analysis,
or Markov Analysis –
quantitative top down for
conditions due to single or
multiple failures or conditions
SAE ARP 4761;
AC 25.1309-1B;
An Introduction to Reliability
Modeling of a Fault-tolerant
System, The Charles Stark
Draper Laboratory, Inc.,
Cambridge, MA, 1986
Failure Modes and Effects
Analysis (FMEA), Failure Mode,
Effects, and Criticality Analysis
(FMECA) -quantitative
SAE ARP 4761;
AC 25.1309-1B;
Mil-Std-1629A
Event Tree Analysis -
quantitative
System Safety Analysis
Handbook, 1993
Identify potential mitigating
actions
Hazard and Operability Study
(HAZOP) - structured team
review to identify potential
hazards/operability problems and
recommend corrective actions
System Safety Analysis
Handbook, 1993
What-If/Checklist Analysis; Task
Analysis -
Structured team review to
identify potential hazards and
recommend corrective actions
System Safety Analysis
Handbook, 1993
A5-7

AC 39-8 9/8/03
OBJECTIVE METHODS AND TOOLS RELEVANT REFERENCES
Assess the relative mitigation of
various actions
Monte Carlo Simulation used to
help judge the acceptability of
various proposed corrective
actions and implementation
schedule
Simulation Modeling and
Analysis, Law and Kelton, 1991
Markov Analysis used when
evaluating various repair
scenarios, due to the ease of
inputting repair information
SAE ARP 4761;
AC 25.1309-1B;
An Introduction to Reliability
Modeling of a Fault-tolerant
System, The Charles Stark
Draper Laboratory, Inc.,
Cambridge, MA, 1986
Cost/Benefit Analysis FAA Order 8040.4;
FAA/APO-89-10 Report;
FAA Aviation Data and Analysis
System (ADA)
Sensitivity Analysis Sensitivity Analysis, Uncertainty
Analysis - qualitatively or
quantitatively assess the
sensitivity of the results to
changes in input parameters
SAE ARP 4754;
System Safety Analysis
Handbook, 1993
Monte Carlo Analysis Simulation Modeling and
Analysis, Law and Kelton, 1991
Monitor Effectiveness of
Corrective Actions
Risk Tracking Techniques “NASA Systems Engineering
Handbook”, SP-6105, 1995
A5-8

9/8/03 AC 39-8
Appendix 6
ADDITIONAL TRANSPORT AIRPLANE DIRECTORATE (TAD) GUIDANCE
1. PURPOSE. This appendix provides supplemental risk assessment guidance and guidelines that may be used internally by the TAD to augment those contained in the main body of this AC.
2. DEFINITIONS. Paragraph 4 of the main body of this AC also applies to this appendix. The following additional definitions are defined for the purpose of this appendix only:
a. Risk forecast (injury risk factor). A quantitative assessment output that is proportional to the average number of persons expected to be seriously injured within a given time period. Risk forecasts are derived from the risk factor and therefore can be differentiated into the same three types (i.e., “uncorrected, “control program”, and “corrected”).
b. Risk level (injury risk level). The risk forecast for a single flight or flight-hour. As with risk factor and risk forecasts, risk levels can be differentiated into the same three types (i.e., “uncorrected”, “control program”, and “corrected”).
3. BACKGROUND. Within the Transport Category Airplane fleet, there is significant diversity in both the severity of potential unsafe conditions and the numbers of persons potentially affected by those conditions. To further differentiate between the unsafe conditions of a given CAAM hazard level, TAD may go beyond the airplane level event-focused assessments and also consider the number of serious injuries that could reasonably be expected to result from a given airplane level event. To that end, TAD may use “risk forecasts” and “risk guidelines”, in addition to “event forecasts” and “event guidelines”, as common measures and standards for assessing, prioritizing and responding to continued airworthiness risks. This can result in two unsafe conditions with identical “event forecasts” not warranting the same response from TAD if one “event” is expected to seriously injure more persons than the other. To aid in joint decision making between the EPD and TAD in cases of shared product responsibility, close coordination is highly recommended, especially if TAD intends to use the supplemental guidance and guidelines of this appendix to support TAD decision making.
4. SUPPLEMENTAL GUIDANCE AND GUIDELINES FOR PARAGRAPH 7f, “Estimate the uncorrected risk factor".
a. The objective under this paragraph can either be accomplished by direct numerical assessments such as those recommended in the following paragraphs, or alternatively by “severity classification” based assessments such as those described in this AC and in AC 25.1309-1B. Whatever assessment methods are used, the risk forecast (injury risk factor) should
A6-1

AC 39-8 9/8/03
remain below the 0.1 short-term risk factor guideline and the risk level (injury risk level) below a 1x10⁻⁵ serious injuries per-flight guideline throughout the control program.
b. Estimate the average number of persons expected to be exposed to serious injury per event. Assign or calculate from specific or similar service experience or System Safety Assessment (SSA) data the relative fraction of occurrences which would result in any serious injury and the average number of persons expected to be exposed to serious injury during such occurrences. Note that not all persons exposed to serious injury will be seriously injured. Furthermore, serious injury may arise from a number of outcomes. For example, a disk uncontainment may pose a direct injury threat due to fuselage penetration, or an indirect threat due to damage to the flight control system. Delineate the fractions of the events resulting in the various potential outcomes and the average number of persons expected to be exposed to serious injury from that outcome. Then, calculate a weighted average of those outcomes to arrive at the average number of persons expected to be exposed to serious injury per event. For example, an uncontained engine rotor failure may result in:
(1) No threat of serious injuries (e.g., 80 percent of the events are expected to result in no serious injuries).
(2) Threat of serious injuries (e.g., 20 percent of the events are expected to result in some serious injuries).
(A) Serious injuries limited to a specific subset of occupants (e.g., if 10 seats are within the debris zone/area of an airplane which operates at an average 70 percent load factor and 10 percent of the total events are expected to have this outcome, then 10 x 0.70 = 7 persons should be assumed to be exposed to serious injury for 10 percent of the events).
(B) Serious injuries to occupants in general but without hull loss (e.g., if the failure would cause the cabin of a 100-passenger airplane which operates at an average 70 percent load factor to be exposed to conditions (e.g., toxic fumes, depressurization, etc.) which would expose 40 percent of a typical occupant demographic to serious injury and five percent of the total events are expected to have this outcome, then 100 x 0.70 x 0.40 = 28 persons should be assumed to be exposed to serious injury for five percent of the events).
A6-2

9/8/03 AC 39-8
(C) Catastrophic accident (e.g., if the failure would prevent the airplane from making a safe landing (e.g., cause inflight breakup, loss of control, critical loss of performance, etc.) and five percent of the total events are expected to have this outcome, then 100 x 0.70 = 70 persons should be assumed to be exposed to serious injury for five percent of the events).
NOTE: The result of the above example would mean an average of 5.6 persons are expected to be exposed to serious injury per event (i.e., 0.80 x 0 + 0.1 x 7 + 0.05 x 28 + 0.05 x 70).
c. Estimate the average number of persons expected to be seriously injured per event. Historical data indicates that the actual number of persons seriously injured is proportionally less than those exposed to serious injury. Furthermore, a scalar is needed to allow a single risk guideline to fit historically acceptable AD responses to both low and high severity outcomes. Consequently, the number of persons expected to be seriously injured per event should be taken to be x , where x = the number of persons expected to be exposed to serious injury per event from 4.b. above. (E.g., of the 5.6 persons expected to be exposed to serious injury per event in the above example, an average of 2.4 persons are expected to actually be seriously injured per event.) Note that since this scalar is not effective for average injury exposures of less than 1.0, use the exposure as the actual injury number (e.g., 0.7 average number of persons exposed to serious injury equals 0.7 persons expected to be seriously injured.)
d. Calculate the uncorrected risk forecast and uncorrected risk level. The uncorrected risk forecast is calculated by multiplying the uncorrected risk factor (derived in paragraph 7f in the main body of this AC) by the number of persons expected to be seriously injured per event from paragraph 4c above. Since this is an average, it may be a fractional number. Additionally, convert this uncorrected risk forecast into a uncorrected risk level to facilitate comparing risks on a common exposure basis. This is normally done on a per flight or per flight hour basis by dividing the uncorrected risk forecast by the total number of flights or flight hours within the exposure period used.
5. SUPPLEMENTAL GUIDANCE FOR PARAGRAPH 9g, “Risk guidelines for immediate action”. If the risk forecast would exceed 0.1 within 60 days or the risk level during that same 60-day period would be greater than 1x10⁻⁵ serious injuries per flight, immediate action should be considered. How “immediate” this action must be could vary from before the next flight to within 60 days depending on the nature and level of risk. To establish what the
A6-3

AC 39-8 9/8/03
maximum short term uncorrected event forecast should be for the causal event itself, simply divide the risk forecast guideline provided above (risk forecast < 0.1 serious injuries) by the results of 4c. For the example used above, the maximum short term uncorrected event forecast for the uncontained engine rotor failure itself would be 0.043 events (0.1 injuries ÷ 2.3 injuries/event). To establish what the maximum short-term event forecast rate should be for the causal event itself, likewise divide the risk level guideline (risk level < 1x10⁻⁵ serious injuries per flight) by the results of 4c. For the example used above, the maximum short-term event forecast rate for the uncontained engine rotor failure itself would be 4.3x10⁻⁶ events/flight (1x10⁻⁵ injuries/flight ÷ 2.3 injuries/event). When flight hours have been used in the analysis, the guideline for immediate action may be established by dividing the per-flight risk (1x10⁻⁵/flight) by the average number of hours per-flight. For example, a three-hour average flight length corresponds to a risk criterion of 3.3x10⁻⁶ per flight hour.
6. SUPPLEMENTAL GUIDANCE AND GUIDELINES FOR PARAGRAPH 7k, “Estimate potential risk reduction”. Once the candidate actions have been identified, the risk under the proposed mitigation program should be estimated using the same process described above. This process should be performed for all actions under consideration, which allows for the effects of different programs to be compared. The objective is to keep the risk forecast (injury forecast) below a 0.1 risk factor guideline and the risk level (injury risk level) below a 1x10⁻⁵ per flight guideline until final action can be incorporated to bring the product back to the level of safety intended by the product's original basis of certification.
7. SUPPLEMENTAL GUIDANCE AND GUIDELINES FOR PARAGRAPH 7u. The objective throughout the entire correction program is to keep the risk forecast (injury risk factor) below a 0.1 risk factor guideline and the risk level (injury risk level) below a 1x10⁻⁵ per-flight guideline until the product is brought back to the level of safety intended by the product's original basis of certification. Therefore, the schedule for follow-on actions should be established such that these guidelines will be met.
A6-4

9/8/03 AC 39-8
Appendix 7
ASSESSMENT EXAMPLES
1. PURPOSE. The objective of this appendix is to provide detailed step-by-step examples of the risk assessment process detailed in this AC, taking the reader through several typical fictitious service problem scenarios from identification to resolution.
2. EXAMPLE 1: Compressor disk fracture
a. An 8th stage compressor disk installed in a low-bypass turbofan engine fractures during takeoff roll. The fracture occurs prior to V1, and the takeoff is safely aborted. The fractured disk has 12,508 cycles part life. The fracture is uncontained, but does not cause any damage to the aircraft, or injury to any passenger or crew. Control is maintained at all times, and the aircraft stops on the runway. Failure investigation reveals the disk fractured in low-cycle fatigue due to corrosion. The investigation further indicates the corrosion occurred because the failed part had not been properly coated during manufacture. The problem is identified and corrected in production; however, the risk posed by other improperly-coated parts in service must be assessed.
b. Estimate the number of aircraft exposed: Initial evaluation of the extent of the problem detects no known manufacturing process changes that might have accounted for the coating problem. However, this part number disk is processed at a dedicated coating facility (i.e., the facility produces only this part), and while all disks of this part number are potentially at risk, the problem is not considered to extend to other part numbers (no evidence of any problems with the parts produced by other facilities). Four hundred and thirty-three (433) disks (including spares) of the suspect part number are currently in service, and are considered to be at risk of a repeat event.
c. The engine manufacturer immediately performs a Weibull analysis using a typical fatigue wearout slope against the population of current disks. This analysis gives a material property life distribution to input into a Monte Carlo simulation. The simulation runs a computer model of the fleet forward in time. This model predicts 1.3 additional disk fractures if all current parts are allowed to remain in service until their certified retirement life (15,000 cycles). Calibration of this risk model (by backing up the simulation to the start of service and running the fleet model to the present) gives a prediction of 0.95 events to date (versus 1 occurred), which is judged to be indicative of a valid model.
A7-1

AC 39-8 9/8/03
d. Estimate the uncorrected risk and risk per flight. While this event did not result in serious injury or other CAAM level 4 or 5 event, historical data available at the time on similar disk fractures over the previous 15 years (see the CAAM report referenced in paragraph 2b(1)) indicate a record of seven CAAM level 3 and 4 events out of a total of 10 uncontainments due to low-bypass ratio turbofan high-pressure compressor fractures. Four of those events (40 percent) resulted in hull loss or fatality (CAAM level 4) due to on-ground fire; one of these (10 percent) was also CAAM level 5 (hull loss/multiple fatalities). Structural review by the engine manufacturer predicts that fracture of this 8th stage disk would be expected to result in uncontainment 100 percent of the time. Coordination with the aircraft manufacturer, validated by the TAD, indicates that, for this installation (wing-mounted engine), 50 percent of the uncontainments would be at least CAAM level 3, and 80 percent of the level 3 events would be hull loss/injury events (level 4). The assumption is made that 40 percent of the events (0.50 level 3 x 0.80 level 4 given level 3 = 0.40) would be expected to result in serious injury or other CAAM level 4 event. 10 percent of all events are assumed to be level 5 (0.40 level 4 x 0.25 level 5 given level 4 = 0.10). Since 1.3 events are predicted, and 40 percent of those would be expected to result in a CAAM level 4 event, 0.52 level 4 events would be expected if no action is taken (1.3 x 0.40 = 0.52), and 0.13 level 5 events. There are two at-risk engines per aircraft, and the 433 disks have an average of 5000 cycles remaining until retirement. Therefore, the average per-flight risk of a CAAM level 4 (or higher) event if no action is taken is 4.8 x 10⁻⁷ [0.52 / (433 disks x 5000 cycles/disk / 2 cycles/flight) = 4.8 x 10⁻⁷]. Note that the spare disks are included in the analysis. While these level 4 risks are clearly in the region where action must be taken, the per-flight risk is below the guideline for immediate action (4x10⁻⁶ per-flight for CAAM level 4 events), so the disks are allowed to remain in service while an inspection and replacement plan is developed. CAAM level 3 events are also calculated: there are 0.65 level 3 (or higher) events predicted (1.3 events x 0.50 at least level 3 = 0.65), with a per-flight risk of 6.0x10⁻⁷ [0.65 / (433 disks x 5000 cycles/disk / 2 cycles/flight) = 6.0 x 10⁻⁷].
e. Estimate effects of candidate actions. Over the next few weeks, while a plan is being developed, a number of retired disks are located and inspected, along with several disks in engines currently undergoing scheduled shop visit. One disk is found to have a crack resulting from a corrosion pit. These inspection findings, along with structural modeling by the engine manufacturer, allow for a more refined quantitative analysis, including initiation and propagation distributions. The Monte Carlo simulation is revised, and is performed against a number of inspection and replacement scenarios to find one that acceptably mitigates the risk of serious injury. The engine manufacturer submits a plan to the EPD which calls for replacement of the
A7-2

9/8/03 AC 39-8
disks at next shop visit, with engines above 10,000 cycles part life to be removed no later than within the next 2,000 cycles. The simulation predicts that this plan would result in 0.18 uncontainments, of which 0.09 would be at least level 3 (0.50 level 3 x 0.18 = 0.09), 0.07 would be level 4 (0.40 level 4 x 0.18 events = 0.07), and .02 would be level 5 (0.10 level 5 x 0.18 events = 0.02). Both the level 3 and level 4 predictions are below the risk guidelines (see table 1, paragraph 9 in the main body); the level 5 risk is well controlled within the level 4 exposure. This plan calls for an aggressive production schedule of replacement disks. Shop visit capacity will also be strained, but is expected to be capable of meeting the increase in inducted engines with only minor schedule disruptions. The engine manufacturer issues a Service Bulletin recommending disk replacement to the above schedule.
f. Implement and monitor corrective action plan. The EPD reviews the assumptions and results of the risk analysis. Though the EPD would like to further reduce the risk of this event, it agrees that a more aggressive schedule would result in significant service disruptions. The EPD issues an NPRM, followed by an AD, to mandate the engine manufacturer’s Service Bulletin. Disks are inspected as they are replaced, with the results compared at regular intervals to the month-by-month predicted crack findings from the Monte Carlo simulation. Subsequent inspection findings indicate the initial risk analysis is somewhat conservative. However, both the engine manufacturer and the EPD believe that no alleviation of the disk replacement schedule should be pursued due to the potential seriousness of another event. After nine months, the EPD also requests a comparison of the actual shop visit (disk replacement) rate with the predictions from the risk analysis. The actual is found to be within two percent of the predicted, so no additional action is taken. After four and one-half years, the last of the suspect disks is replaced. No additional events have occurred during that period.
3. EXAMPLE 2: Boost pump wiring chafing
a. Inspection of a fuel leak problem on a transport aircraft revealed that the leak was the result of a conduit burn through caused by an electrical arc between the conduit and a boost pump wire inside the conduit that had chafed completely through the insulation. The penetrated conduit lies within the fuel tank, thus raising a concern about a possible fuel tank ignition. A different airplane type had experienced an unexplained catastrophic fuel tank ignition eight years earlier.
b. Estimate the number of aircraft exposed. The boost pump wiring on this airplane type is common to all models. The worldwide fleet includes about 3000 airplanes with two engine
A7-3

AC 39-8 9/8/03
models and a variety of derivatives. Since the vibration characteristics for the different engine types which might affect chafing is not known, it must be assumed that all airplanes in the fleet could be affected. The analyst has a total of three inspection records. Two of the inspections had been performed prior to the one that indicated conduit penetration. A Weibull analysis of the data indicates a strong wearout mode (i.e., the likelihood of chafing increases with the age of the wiring). The Weibull analysis predicts 0.92 burned-through conduits should have occurred to date, which calibrates with the actual experience. The analysis as applied to the fleet indicates that airplanes with more than 30,000 hours contribute significantly to the overall risk of a bare wire event. Although only one airplane has been found with a burned-through conduit, the analysis indicates that there may be 76 airplanes still flying with undetected exposed wires. The analyst concludes that the entire fleet should be included in the actions to control the situation.
c. Since there is no life limit on the fuel tank wiring, the statistical analysis described in (a) predicts that 76 bare wire events are already latent in the fleet and many more will occur in the remaining life of the fleet. Information gained in investigation of a similar situation in a different airplane type shows that the wing tanks on the airplane type where the bare wire was found are in a flammable condition for three percent of each flight. The center tanks are flammable for 30 percent of each flight.
d. Estimate the uncorrected risk factor and risk per flight. There is no known experience of a bare wire event causing an ignition event; therefore, the analyst must estimate the hazard ratio - the conditional probability of an ignition event given that a bare wire event has occurred. This is conservatively accomplished by assuming that an ignition event in one of the predicted 76 airplanes flying with bare wires is imminent. The hazard ratio, which can also be expressed as the conditional probability, PC, of an ignition event, is estimated by using the model developed by the analysis to compute how long each airplane predicted to have a bare wire has been flying after the event occurred. The analyst determines that the total after-event flight hours accumulated by the 76 airplanes predicted by the model to have bare wires is 624,217 hours. Thus, PC is estimated to be 1/624,217 ≅ 1.6E-6. This is a conservative approach, but the only objective estimate of PC available to the analyst. The only actual fuel tank ignition event on this airplane type resulted in a level 5 event. Although the airplane was on the ground at the time of the ignition, a number of passengers were killed and the airplane was destroyed. No cause for the accident was recorded. Therefore, the analyst concludes that any ignition source in a fuel
A7-4

9/8/03 AC 39-8
tank will have level 5 potential. From this information, the risk can be now be calculated for any length of time, including the next 60 days to determine if immediate action is warranted. (The guideline for immediate action, as defined in paragraph 9g of the main body, applies to a 60-day period.) This airplane accumulates, on average, 341 hours in a 60-day period. The Weibull analysis estimates that 6 additional bare wires will develop over the next 60 days. 76 latent bare wires in the fleet plus 6 more in 341 fleet hours = 82 1.6E-6 per-hour probability of ignition event given bare wire 341 hours operation = 82 x 1.6E-6 x 341 = 0.045 level 5 events in the next 60 days of US fleet-wide operation. The risk does not exceed the short-term acceptable level 4 risk guideline (remember, level 5 risk must at least meet level 4 guidelines) within the next 60 days. However, since the event in question has a high injury forecast, the analyst concludes that immediate mitigating action is necessary.
e. Estimate effects of candidate actions. The analyst uses the information generated above to establish an inspection and repair plan that will meet the risk guidelines. The analyst determines that if all airplanes older than 65,000 flight hours (126 airplanes) are inspected and repaired within 20 days, the risk factor is decreased more than 40 percent. Additional inspections are also proposed: Airplanes with 55,000 but <65,000 flight hours (152 airplanes) should be inspected within 45 days. Airplanes with 45,000 but <55,000 flights (116 airplanes) should be inspected within 90 days. Airplanes with 38,000 but <45,000 flights (154 airplanes) should be inspected within 180 days. Airplanes with 30,000 but <38,000 flights (283 airplanes) should be inspected within one year. Airplanes with 1 but <30,000 flights (2062 airplanes) should be inspected by the time the airplane reaches 30,000 flights. There are 0.09 level 5 events expected in the fleet within the full inspection period. Because this is a conservative analysis (no events to date, but one assumed, among other conservatism), this prediction is judged to be acceptable for a level 5 risk exposure.
f. Implement and monitor corrective action plan. A telegraphic AD is issued to implement the proposed inspection plan. An updated analysis made from the information obtained from the inspections indicates that the safety objectives will not be met without adjustments to the inspection schedule. The original AD is amended to show the following:
A7-5

AC 39-8 9/8/03
Al airplanes older than 65,000 flight hours to be inspected and repaired within 20 days. Airplanes with 55,000 but <65,000 flight hours should be inspected within 40 days. Airplanes with 45,000 but <55,000 flights should be inspected within 60 days. Airplanes with 38,000 but <45,000 flights should be inspected within 90 days. Airplanes with 25,000 but <38,000 flights should be inspected within 180 days. Airplanes with 1 but <25,000 flights should be inspected by the time the airplane reaches 25,000 flights. This new inspection schedule brings the safety objective back to the original expectation of 0.09 level 5 events within the inspection period.
g. The corrective action taken to eliminate the wearout problem consists of a Teflon sleeve over the original wire bundle. Since there has been no time to prove that the corrective action will be effective in the long term, the fleet will require inspections to assure that the safety objectives are maintained in the future. Therefore, the AD is further amended to require that the conduits and wiring be inspected at 30,000 flights since new or last replacement of the wiring.
A7-6

9/8/03 AC 39-8
Appendix 8
HISTORICALLY POTENTIALLY UNSAFE CONDITIONS
1. PURPOSE. The objective of this appendix is to provide the user with a descriptive listing of generic transport airplane powerplant and APU failure conditions that have been defined as potentially unsafe based on previous service experience or traditional assumptions, or both. This appendix is intended to be an example list and not an inclusive or prescriptive checklist, since it may not include all the information relevant to the failure conditions of a specific transport airplane with its various functions and its intended use. This list includes estimates of the conditional probability of the severity outcome (hazard ratio) given the occurrence of the basic failure condition.
2. DATABASE. Unless stated otherwise, these estimates are based on the service data for the time period 1992-2000 as reported to the AIA/AECMA CAAM data update team. Earlier data were added in situations where there were few or no recent high-level events. Historical hazard ratios and event details for the earlier CAAM data (time period 1982-1991) for some of the listed conditions are contained within the “Technical Report on Propulsion System and APU-Related Aircraft Safety Hazards (FAA Related Reference (1) in paragraph 2b in the main body of this AC). The pending “2nd Technical Report,” based on the CAAM data update team activities, will include the 1992-2000 hazard ratios and event details for the conditions listed below.
3. HAZARD RATIO CALCULATION. Where there have been relatively few occurrences within the database of a particular failure condition, and no events of a given CAAM level or higher, hazard ratios have not been listed. This is to avoid both the implication that high-level events are not possible, if a “.000” were to be listed, and possibly overly-conservative estimates, if a “<.XXX” were to be listed. For situations where there are many occurrences of the failure condition without high-level events, “<.XXX” hazard ratios are listed. They are also used for cases of significant under-reporting. Details on how to estimate hazard ratios in the absence of high-level events are provided in appendix 3 of this AC.
NOTE: Care should be taken when using any published hazard ratio that the data source is relevant to the intended application. Since the hazard ratios in this appendix have been developed using the full range of the available data, they should be considered a general guide and not a replacement for more specific guidance and assessments for a particular aircraft type, environment, or operating condition.
A8-1

AC 39-8 9/8/03
FAILURE CONDITION CONSIDERED POTENTIALLY UNSAFE
1 Propeller Debris Release
If resulting debris, aircraft operating characteristics or loads
could directly impact primary aircraft structure, critical system
functions, or critical flight crew functions such that continued
safe flight and landing at an airport would be prevented (e.g.,
debris could cause loss of the other operating engines, the
dynamic yaw/roll could lead to loss of control, or the rotor
imbalance could cause critical structural failure).
If propeller blade release could cause additional potential
unsafe failure conditions (e.g., uncontained engine fire).
Any other time. This failure is assumed to always pose a risk
of serious injury to individuals within the debris zone inside
the aircraft. This failure could cause serious injury to
individuals outside the aircraft, a significant reduction in
aircraft capabilities (e.g., cabin depressurization), and could
pose a hazard to adjacent aircraft or facilities. Therefore, if
such a condition is occurring in service, the uncorrected risk
should be assessed to determine whether the condition is
reasonably expected to result in one or more serious injuries.
If it is, then the condition is unsafe and must be corrected.
A8-2

9/8/03 AC 39-8
FAILURE CONDITION CONSIDERED POTENTIALLY UNSAFE
Propeller Debris Release
(continued)
Hazard ratios: 29 events inflight
1 level 5 (inability to maintain flight)
84 events inflight/on ground
17 level 3; 1 level 4 (serious injury from fuselage
penetration)
Note that only inflight events were used to calculate level 5
HR. That value was then added to the level 3 and 4 risk
(from all events minus the one level 5) to produce inflight
level 3+ and 4+ HRs. On-ground risk exposure thus does not
include the “inability to maintain flight” risk.
Inflight On-ground
level 3+ HR .251 .217
level 4+ HR .047 .012
level 5 HR .034 -
2 Uncontained Engine or APU
Rotor Failure. Includes: shafts,
disks, drums, impellers, fan
blades, turbine blades,
compressor blades, etc. See AC
20-128A for definition of rotor.
For the same reasons identified for Propeller Debris Release.
A8-3
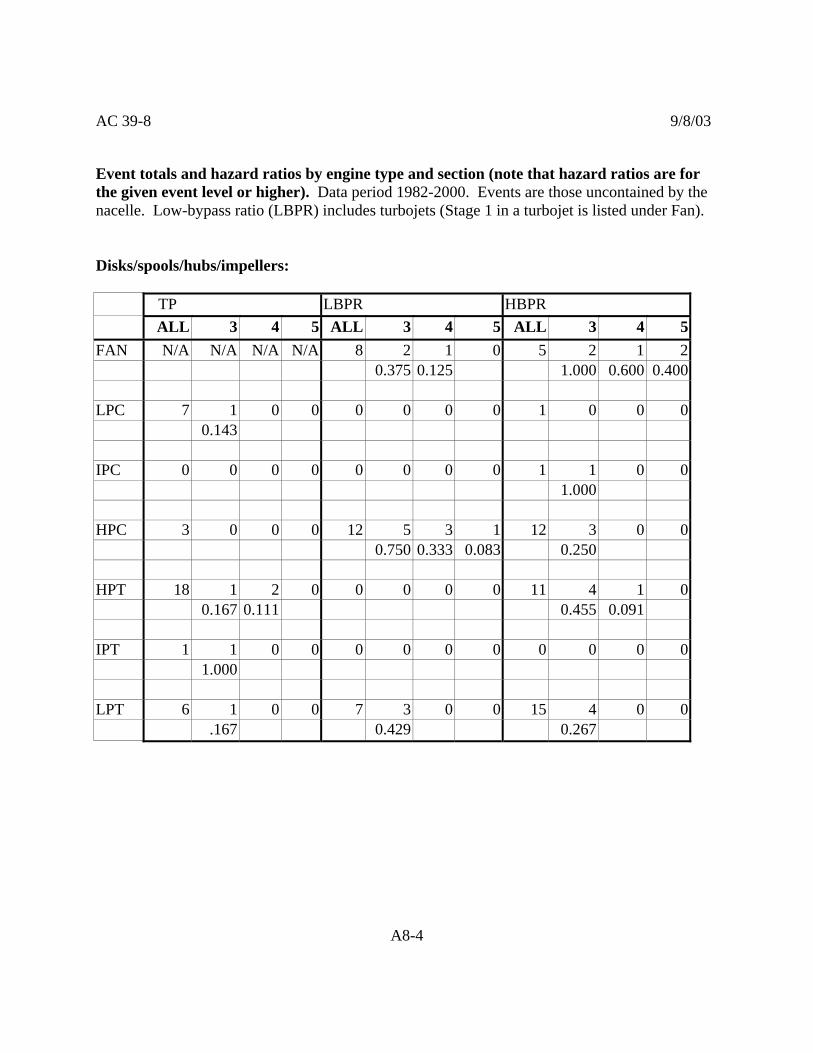
AC 39-8 9/8/03
Event totals and hazard ratios by engine type and section (note that hazard ratios are for the given event level or higher). Data period 1982-2000. Events are those uncontained by the nacelle. Low-bypass ratio (LBPR) includes turbojets (Stage 1 in a turbojet is listed under Fan). Disks/spools/hubs/impellers:
TP LBPR HBPR ALL 3 4 5 ALL 3 4 5 ALL 3 4 5
FAN N/A N/A N/A N/A 8 2 1 0 5 2 1 2 0.375 0.125 1.000 0.600 0.400
LPC 7 1 0 0 0 0 0 0 1 0 0 0 0.143
IPC 0 0 0 0 0 0 0 0 1 1 0 0 1.000
HPC 3 0 0 0 12 5 3 1 12 3 0 0 0.750 0.333 0.083 0.250
HPT 18 1 2 0 0 0 0 0 11 4 1 0 0.167 0.111 0.455 0.091
IPT 1 1 0 0 0 0 0 0 0 0 0 0 1.000
LPT 6 1 0 0 7 3 0 0 15 4 0 0 .167 0.429 0.267
A8-4

9/8/03 AC 39-8
Blades/bluckets:
TP LBPR HBPR ALL 3 4 5 ALL 3 4 5 ALL 3 4 5
FAN N/A N/A N/A N/A 28 3 0 1 103 2 0* 0 0.143 0.036 0.036 0.019
Platforms N/A N/A N/A N/A 1 0 0 0 4 0 0 0
LPC 0 0 0 0 9 0 0 0 2 0 0 0
HPC 1 0 0 0 4 0 0 0 0 0 0 0
HPT 5 0 0 0 4 0 0 0 3 0 0 0
IPT 1 0 0 0 0 0 0 0 0 0 0 0
LPT/PT 10 0 1 0 45 7 0 0 94 1 0 0 0.100 0.100 0.156 0.011
* Note: HBPR level 4 event outside the data period
A8-5

AC 39-8 9/8/03
Spinners/cooling plates/other:
TP LBPR HBPR ALL 3 4 5 ALL 3 4 5 ALL 3 4 5
FAN N/A N/A N/A N/A 0 0 0 0 3 1 0 0 0.333
HPC 0 0 0 0 6 1 0 0 1 0 0 0 0.167
HPT 3 0 0 0 0 0 0 0 7 1 0 0 0.143
LPT/PT 0 0 0 0 0 0 0 0 5 2 0 0 0.400
APUs:
ALL 3 4 5 uncontainment 68 0 0 0
axial ‘uncontainment’ 15 0 0 0 (1992-2000)
A8-6

9/8/03 AC 39-8
FAILURE CONDITION CONSIDERED POTENTIALLY UNSAFE
3 Engine/Pylon Separations
Includes both partial and total
restraint failures.
For the same reasons identified for Propeller Debris Release.
Note that during initial or partial separations, the engine can
produce significant abnormal thrust vectors that should be
taken into account.
Hazard ratios: Time period 1982-2000
Turboprops: 2 events; 0 level 3; 1 level 4; 0 level 5
LBPR TFs: 8 events; 1 level 3; 2 level 4; 1 level 5
HBPR TFs: 5 events; 2 level 3; 1 level 4; 2 level 5
TP LBPR HBPR
level 3+ HR .500 .500 1.000
level 4+ HR .500 .375 .600
level 5 HR - .125 .400
4 Contained Engine or APU
Rotor Failure
If a subsequent occurrence could reasonably be expected to
result in uncontainment.
If the mode of containment is not conditional, then it is
usually assumed that the next occurrence will also be
contained. However, this is a judgment that should be made
by the EPD with assistance from the manufacturer.
If the resulting aircraft operating characteristics or loads
(especially those due to rotor imbalance) could directly
impact primary aircraft structure, critical system functions,
or critical flight crew functions such that continued safe
flight and landing at an airport would be prevented.
A8-7

AC 39-8 9/8/03
FAILURE CONDITION CONSIDERED POTENTIALLY UNSAFE
Contained Engine or APU
Rotor Failure (continued)
If contained engine rotor failure could cause additional
potential unsafe failure conditions (e.g., uncontained engine
fire).
Hazard ratios: In general, the effects of a contained engine failure are more
benign than the uncontained failures, which are covered in
#2, above. There has been an instance of a level 3-equivalent
outcome due to airframe vibration (and associated difficulty
of the crew to read cockpit instrumentation) generated by
the windmilling load of the contained failure of a wide-
chord fan blade in a HBPR engine.
The hazard ratios for contained fan blade failures that exit
the inlet are considered comparable to the fan blade
uncontainment failure hazard ratios (see #2, above).
5 Separation of Significant
Nacelle Components
Includes both partial and total
restraint failure for: Inlet, Fan,
Core, and Reverser Cowls;
Nozzles and Plugs; Dense or
Large Fairings; etc.
If the resulting debris, aircraft operating characteristics or
loads could directly impact primary aircraft structure,
critical system functions, or critical flight crew functions
such that continued safe flight and landing at an airport
would be prevented (e.g., debris could cause critical damage
to the horizontal tail or the aerodynamic effects could cause
critical loss of controllability or performance).
If nacelle component separations could cause additional
potential unsafe failure conditions (uncontained engine fire,
unsafe changes in the magnitude or direction of thrust, etc.)
A8-8

9/8/03 AC 39-8
FAILURE CONDITION CONSIDERED POTENTIALLY UNSAFE
Separation of Significant
Nacelle Components
(continued)
Any other total separation.
This failure could pose a risk of serious injury to individuals
both inside and outside the aircraft, could cause a significant
reduction in aircraft capabilities (e.g., cabin
depressurization), and could impact other aircraft or
facilities. Therefore, if such a condition is occurring in
service, the uncorrected risk must be assessed to determine
whether the condition is reasonably expected to result in one
or more serious injuries. If it is, then the condition is unsafe
and must be corrected.
Hazard Ratios: Time period 1982-2000
Turboprops: 3 events (suspected under-reporting); 0 level 3,
4 or 5
LBPR TFs: 55 events; 1 level 3; 1 level 4 (high-drag forced
landing due to partial separation after internal engine
failure); 0 level 5
HBPR TFs: 195 events; 2 level 3; 0 level 4 or 5
TP LBPR HBPR
level 3+ HR - .036 .010
level 4+ HR - .018 -
A8-9

AC 39-8 9/8/03
FAILURE CONDITION CONSIDERED POTENTIALLY UNSAFE
6 Uncontained Powerplant or
APU Fire
Includes: engine case rupture or
burn through, engine or APU
fires which breach the fire wall,
or fires which initiate outside a
fire zone.
If fire, heat or smoke could spread to the aircraft cabin and
cause serious injuries.
If fire, heat or smoke could impact primary aircraft
structure, critical system functions, or critical flight crew
functions such that continued safe flight and landing would
be prevented.
Any other time hazardous quantities of flammable materials
are potentially available to feed the fire.
Uncontained fire is sufficiently unpredictable and potentially
damaging as to always be considered a potential unsafe
condition unless there will clearly be insufficient flammable
material available to create a hazard. Flammable materials
of concern include, but are not limited to, fuel, oil, hydraulic
fluid, wiring, magnesium, and many components of the
cabin interior. Therefore, if such a condition is occurring in
service, the uncorrected risk should be assessed to determine
whether the condition is reasonably expected to result in one
or more serious injuries. If it is, then the condition is unsafe
and must be corrected.
A8-10

9/8/03 AC 39-8
FAILURE CONDITION CONSIDERED POTENTIALLY UNSAFE
Uncontained Powerplant or
APU Fire (continued)
Hazard ratios: Case ruptures:
Time period 1982-2000
Turboprops: 12 events; 0 level 3, 4 or 5
LBPR TFs: 27 events; 2 level 3; 1 level 4; 1 level 5
HBPR TFs: 17 events; 2 level 3; 0 level 4 or 5
TP LBPR HBPR
level 3+ HR - .148 .118
level 4+ HR - .074 -
level 5 HR - .037 -
-------------------------------------------------------------------
Case burnthroughs:
Time period 1982-2000
Turboprops: 9 events; 2 level 3; 0 level 4 or 5
LBPR TFs: 9 events; 0 level 3, 4 or 5
HBPR TFs: 71 events; 1 level 3; 0 level 4 or 5
TP LBPR HBPR
level 3+ HR .222 - .014
A8-11
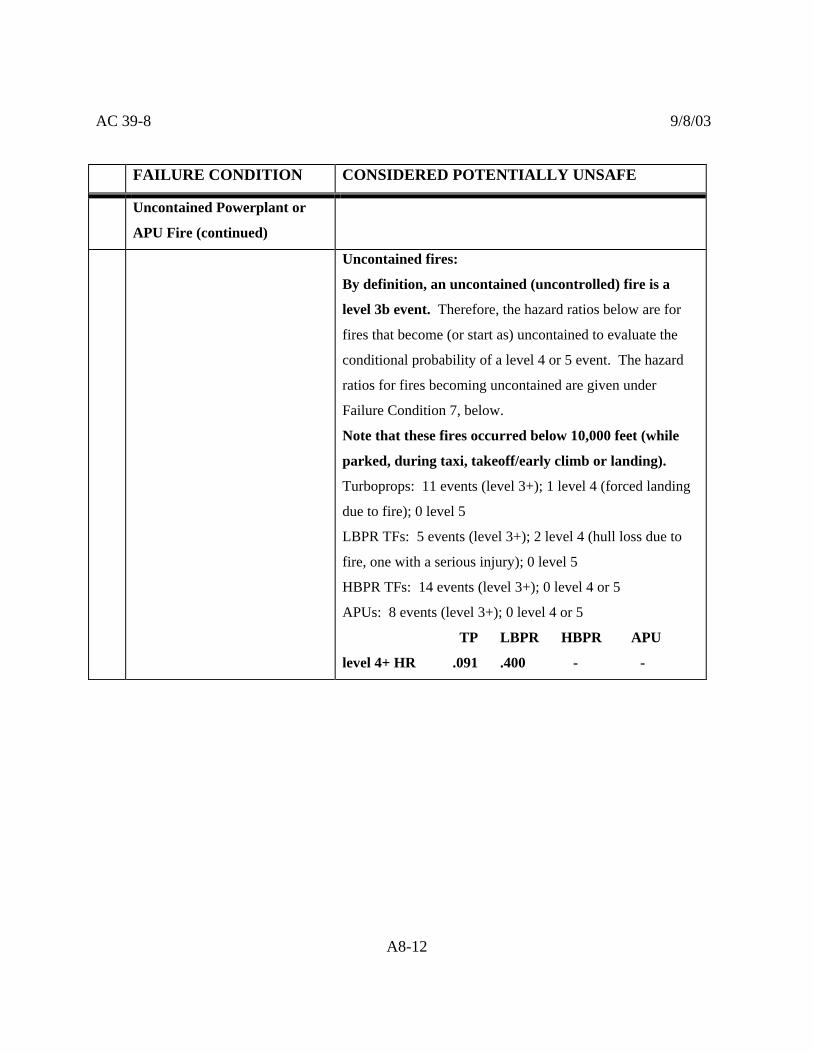
AC 39-8 9/8/03
FAILURE CONDITION CONSIDERED POTENTIALLY UNSAFE
Uncontained Powerplant or
APU Fire (continued)
Uncontained fires:
By definition, an uncontained (uncontrolled) fire is a
level 3b event. Therefore, the hazard ratios below are for
fires that become (or start as) uncontained to evaluate the
conditional probability of a level 4 or 5 event. The hazard
ratios for fires becoming uncontained are given under
Failure Condition 7, below.
Note that these fires occurred below 10,000 feet (while
parked, during taxi, takeoff/early climb or landing).
Turboprops: 11 events (level 3+); 1 level 4 (forced landing
due to fire); 0 level 5
LBPR TFs: 5 events (level 3+); 2 level 4 (hull loss due to
fire, one with a serious injury); 0 level 5
HBPR TFs: 14 events (level 3+); 0 level 4 or 5
APUs: 8 events (level 3+); 0 level 4 or 5
TP LBPR HBPR APU
level 4+ HR .091 .400 - -
A8-12

9/8/03 AC 39-8
FAILURE CONDITION CONSIDERED POTENTIALLY UNSAFE
7 Fires Within Engine or APU
Fire Zones
If a subsequent occurrence could reasonably be expected to
be uncontained. The potential fire intensity or duration may
exceed fire zone containment criteria. Furthermore, latent
failures or foreseeable crew errors could usually cause fire
containment to be ineffective. Therefore, if such a condition
is occurring in service, the uncorrected risk should be
assessed to determine whether the condition is reasonably
expected to result in one or more serious injuries. If it is,
then the condition is unsafe and must be corrected.
Hazard ratios: In general, the effects of a fire contained within a fire zone
are much more benign than the uncontained fires, which are
covered in #6, above. The hazard ratios below are for fires
that propagate out of the fire zone. They do not include
events where the fire protection system was defeated by an
uncontainment that subsequently caused a fire.
Fires within a fire zone
Turboprops: 20 events; 4 level 3; 1 level 4; 0 level 5
LBPR TFs: 12 events; 1 level 3; 0 level 4 or 5
HBPR TFs: 90 events; 7 level 3; 0 level 4 or 5
APUs: 47 events; 8 level 3; 0 level 4 or 5
TP LBPR HBPR APU
level 3+ HR .250 .083 .078 .170
level 4+ HR .050 - - -
A8-13

AC 39-8 9/8/03
FAILURE CONDITION CONSIDERED POTENTIALLY UNSAFE
Fires Within Engine or APU
Fire Zones (continued)
Tailpipe fires:
Turboprops: 8 events (suspected under-reporting), 1 level 3
(uncontained fire); 0 level 4 or 5
Turbofans: 215 events; 1 level 3; 0 level 4 or 5
APUs: 28 events; 1 level 3 (one report of assumed
uncontained fire); 0 level 4 or 5
TP TF APU
level 3+ HR .125* .005 .036
* likely conservative due to under-reporting
8 Nacelle, Pylon, or APU
Compartment “Overheat”
Includes: Engine or APU Bleed
Air Duct Failure; Loss of
Thermal Insulation, etc.
If the resulting heating, pressurization, or debris could
impact primary aircraft structure, critical system functions,
or critical flight crew functions such that continued safe
flight and landing at an airport would be prevented.
If Overheat could cause additional potential unsafe failure
conditions (e.g., uncontained engine fire).
If the resulting heating, pressurization, or debris could leave
the aircraft vulnerable to a foreseeable subsequent failure or
crew error that would prevent continued safe flight and
landing at an airport.
A8-14

9/8/03 AC 39-8
FAILURE CONDITION CONSIDERED POTENTIALLY UNSAFE
Nacelle, Pylon, or APU
Compartment “Overheat”
(continued)
Hazard ratios: All engine types: 972 reported air leaks/nacelle, etc.,
overheats (significant under-reporting); 0 level 3, 4 or 5
APUs: 242 reported overheats (under-reporting); 0 level 3,
4 or 5
Engine APU
level 3+ HR <~ .001 <.004
9 Engine or APU Exhaust Gas
Impingement
For the same reasons identified for Nacelle, Pylon, or APU
Compartment “Overheat”.
Hazard ratios: Data not reported. No known significant events.
A8-15

AC 39-8 9/8/03
FAILURE CONDITION CONSIDERED POTENTIALLY UNSAFE
10 Errant Magnitude or Direction
of Thrust Within Certified
Engine Operating Limits
Includes any errant thrust
resulting from system faults or
crew errors, whether detected or
undetected (e.g., over/under
fueling, engine shutdown, errant
propeller control, errant thrust
reverser deployment, inlet flow
separation, compressor stall,
hazardously misleading
indications, autofeather system
failures, etc.)
If the resultant increase, loss, or asymmetry of airplane
thrust render the aircraft incapable of continued safe flight
and landing at an airport. Total loss of thrust is the most
common example of a potentially catastrophic failure
condition in this category. However, relatively small
undetected thrust losses (over approx. 2-3 percent of
airplane thrust) at powerset can significantly impact the
required runway distances and therefore, the ability to
perform safe takeoffs or aborts. Asymmetric thrust caused
by a thrust run-up or an inadvertent thrust reversal on one
engine could cause loss of aircraft directional control. Even
symmetric overthrust conditions could be potentially
catastrophic if they occur at an inopportune time or lead to
the failure of multiple engines. Errant changes in thrust that
affect multiple engines are typically considered a potential
unsafe condition. Multiple engine events that occur as a
result of bird, ice, or other foreign object ingestion should be
reviewed for any design implications with regard to
assumed powerloss percent and frequency of occurrence.
A8-16

9/8/03 AC 39-8
FAILURE CONDITION CONSIDERED POTENTIALLY UNSAFE
Errant Magnitude or Direction
of Thrust (continued)
Hazard ratios: Multiple engine small undetected thrust loss:
Data not reportable by nature of the event. No known
significant events.
------------------------------------------------------------------
Asymmetric thrust - throttle split:
Data not reported. Unrecognized throttle split has led to 2
level 5 events during the time period (one during early
climb, one during descent), both on HBPR turbofans.
A8-17

AC 39-8 9/8/03
FAILURE CONDITION CONSIDERED POTENTIALLY UNSAFE
Errant Magnitude or Direction
of Thrust Within Certified
Engine Operating Limits
(continued)
Asymmetric thrust – reverser deployment/inflight beta:
Time period 1982-2000
Turboprops: 4 reported events of inflight beta; 1 level 4; 3
level 5 (Note that these events are considered crew error
due to inflight selection of beta mode. The rate of non-
serious events due to inflight beta usage is unknown.)
Turbofans: includes significant partial deployments
LBPR TFs: 18 events; 1 level 3; 1 level 4; 0 level 5
HBPR TFs: 34 events; 8 level 3; 0 level 4; 2 level 5
TP LBPR HBPR
level 3+ HR 1.000 .111 .294
level 4+ HR 1.000* .056 .059
level 5 HR .750* - .059
* likely conservative due to under-reporting of base events
Additionally, see the April 15th, 1992 AIA Committee
report on “Criteria for Assessing Transport Turbojet Fleet
Thrust Reverser System Safety”.
-------------------------------------------------------------------
Asymmetric thrust – single engine reverser non-
deployment/no beta on landing:
Turboprops: 6 reported events (suspected significant under-
reporting); 4 level 3; 0 level 4 or 5
Turbofans: 760 events (suspected under-reporting); 2 level
3; 2 level 4; 0 level 5
TP TF
level 3+ HR - .005
level 4+ HR - .003
level 5 HR - -
A8-18

9/8/03 AC 39-8
FAILURE CONDITION CONSIDERED POTENTIALLY UNSAFE
Errant Magnitude or Direction
of Thrust Within Certified
Engine Operating Limits
(continued)
Single engine IFSD/Powerloss:
Turboprops: Base data not reported. There was 1 level 4
(during approach) and 5 level 5 (1 takeoff, 1 rejected
takeoff, 1 cruise, 1 approach, 1 approach/go-around)
PSM+ICR events in the time period.
Note the data does not include propeller events reported
under “Errant propeller control”, below.
Turbofans: 13,000 events in the time period. (This is
under-reported due to incomplete participation.) During the
same time period, there were 3 level 4 (2 during approach, 1
unknown regime) and 4 level 5 (1 takeoff, 1 RTO, 1
descent, 1 approach/go-around) PSM+ICR events following
engine IFSD or powerloss. There were also 5 reported level
3 (1 takeoff, 3 rejected takeoffs, 1 approach) PSM+ICR
events.
Note that due to level 3 PSM+ICR events likely being
under-reported, hazard ratios are only presented for level 4+
events.
Turbofans:
level 4+ HR <.001
level 5 HR <.001
A8-19

AC 39-8 9/8/03
FAILURE CONDITION CONSIDERED POTENTIALLY UNSAFE
Errant Magnitude or Direction
of Thrust Within Certified
Engine Operating Limits
(continued)
Overthrust:
Base data not reported.
Turboprops: 1 level 3 reported event (continued overspeed
approach.) This event is considered a Propulsion System
Malfunction Plus Inappropriate Crew Response (PSM+ICR)
event.
Turbofans: 1 level 4 event (high-speed rejected takeoff/hull
loss) in the data period. There are different opinions as to
whether or not this event should be considered a Propulsion
System Malfunction Plus Inappropriate Crew Response
(PSM+ICR) event.
------------------------------------------------------------------
Errant propeller control:
76 events (suspected under-reporting); 1 level 3 (full reverse
selected with pitchlocked propeller); 1 level 4 (hull loss after
highspeed abort); 0 level 5. These are considered PSM+ICR
events.
level 3+ HR .026
level 4+ HR .013*
* likely conservative due to under-reporting of base events
A8-20

9/8/03 AC 39-8
Hazard ratios – Multiple-engine events:
TP LBPR HBPR ALL 3 4 5 ALL 3 4 5 ALL 3 4 5
Fuel *
Environmental ** 12 4 1 2 7 4 0 1 36 6 0 0 .583 .250 .167 . 714 .143 .143 .167
Maintenance 0 0 0 0 0 0 0 0 7 2 3 0 .714 .429
Autothrottle 0 0 0 0 0 0 0 0 3 0 0 0
Other/unknown 1 0 1 0 7 4 1 1 26 6 0 0 1.000 1.000 .857 .286 .143 .231
* Under Failure Condition #16, below
** Icing, turbulence/stability, rain/hail, lightning, bird ingestion
A8-21

AC 39-8 9/8/03
Hazard ratios - Total Powerloss:
TP LBPR HBPR ALL 3 4 5 ALL 3 4 5 ALL 3 4 5
Fuel * 9 0 6 3 5 0 3 2 3 0 3 0 1.000 1.000 .333 1.000 1.000 .400 1.000 1.000
Environmental ** 9 3 1 2 1 0 0 1 5 4 0 0 .667 .333 .222 1.000 1.000 1.000 .800
Oil system maintenance
0
0 0 0 0 0 0 0
3
0 3 0
1.000 1.000
Other/unknown 1 0 1 0 3 2 1 0 8 2 0 0 1.000 1.000 1.000 .333 .250
* Exhaustion, mismanagement or contamination (applicable events from #16, below)
** Icing, turbulence/stability, rain/hail, lightning
Note that oil system maintenance level 4 events were powered imminent landings.
Hazard ratios – Ratio of level 5 to level 4+ events given non-recovered total powerloss: A. From table above, data 1992-2000
TPs: 5 level 5 out of 13 level 4+ = .385
TFs: 3 level 5 out of 10 level 4+ = .300
LBPR: 3 level 5 out of 7 level 4+ = .429
HBPR: 0 level 5 out of 3 level 4+ =
B. Data period 1982 – 2000
TPs: 8 level 5 out of 35 level 4+ = .229
TFs: 10 level 5 out of 21 level 4+ = .476
LBPR: 9 level 5 out of 14 level 4+ = .643
HBPR: 1 level 5 out of 7 level 4+ = .143
A8-22

9/8/03 AC 39-8
FAILURE CONDITION CONSIDERED POTENTIALLY UNSAFE
11 Engine or APU Overspeed If it could lead to an Uncontained Engine Rotor Failure.
If it could lead to an unsafe change in the magnitude of
thrust.
Hazard ratios: Turboprops: Data not reported.
Turbofans: 447 reported overspeeds
401 control system failures – 0 uncontainments; none were
reported above 120 percent redline (some unknown)
46 torque path failures – 23 uncontainments; 0 level 3,
4 or 5
APUs: 63 reported overspeeds
4 due to de-ice fluid ingestion – 1 uncontainment
10 torque path failures – 0 uncontainments
49 control system failures – 0 uncontaiments
Uncontainment HR (NOT level 3; multiply this HR by
the level 3+ hazard ratios under Failure Condition #2,
above):
TF APU
Control system failure overspeeds: <.003 <.020
Torque path failure overspeeds: .500 -
De-ice fluid ingestion overspeeds: - .250
A8-23

AC 39-8 9/8/03
FAILURE CONDITION CONSIDERED POTENTIALLY UNSAFE
12 Hazardously Misleading
Powerplant or APU Indications
If an inappropriate, errant or missing indication is
reasonably expected to elicit a hazardous crew response,
including inaction.
See: Errant Changes in the Magnitude or Direction of Thrust
Within Certified Operating Limits; Engine or APU
Overspeed; and Uncontained Engine Fire. Misleading
displays can create other potentially unsafe conditions (e.g.,
if a fire or overlimit condition on one engine is indicated as
being on a different engine, the affected engine will not get
the needed crew attention and a good engine is likely to be
shutdown. If the primary powersetting parameter on all
engines reads low at powerset, this can significantly impact
the required runway distances and therefore, the ability to
perform safe takeoffs or aborts. If all main engine displays
are lost and the engine controls do not have inherent limits
protection, then changing flight conditions can result in
unaccommodated overlimit conditions on all engines.
Misleading fuel quantity indications can lead to potentially
unsafe conditions associated with fuel mismanagement.)
A8-24

9/8/03 AC 39-8
FAILURE CONDITION CONSIDERED POTENTIALLY UNSAFE
Hazardously Misleading
Powerplant or APU Indications
(continued)
Hazard ratios: Turboprops: 268 reported events (under-reporting); 0 level
3 or 4; 1 level 5 (false oil pressure warning; engine throttled;
airplane configuration not properly handled; high-drag go-
around led to crash). Note that the false indication itself did
not lead directly to the accident. Improper handling of the
airplane’s energy state with one engine at idle and propeller
not feathered.
Turbofans: Over 9000 reported events (under-reporting), of
which approximately 7000 were false indications; 0 level 3,
4 or 5. (While there were no high level events during the
data period, one prior level 5 event occurred when the crew
disagreed over the interpretation of erroneous engine
indications and takeoff was continued with inadequate
thrust.)
Note that Propulsion System Malfunction plus Inappropriate
Crew Response (PSM+ICR) level 3 and lower events are
likely under-reported.
TP TF
level 4+ HR .004* <<.001
level 5 HR .004* <<.001
* likely conservative due to under-reporting of base events
A8-25
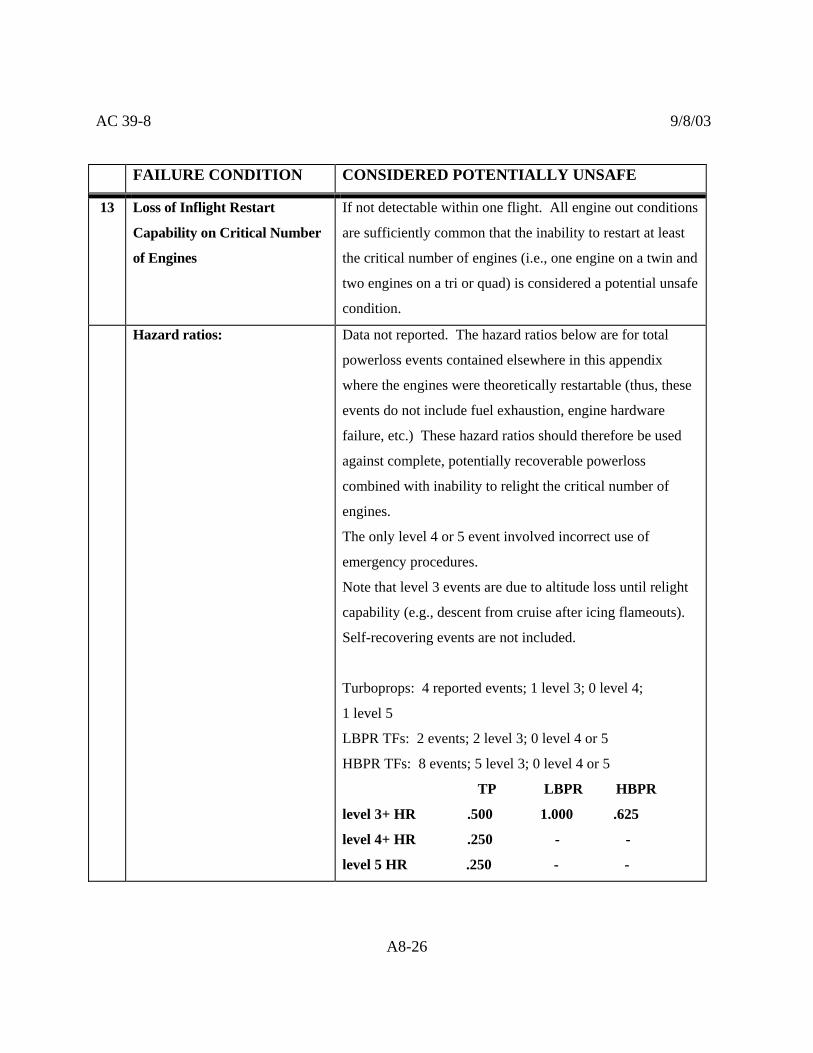
AC 39-8 9/8/03
FAILURE CONDITION CONSIDERED POTENTIALLY UNSAFE
13 Loss of Inflight Restart
Capability on Critical Number
of Engines
If not detectable within one flight. All engine out conditions
are sufficiently common that the inability to restart at least
the critical number of engines (i.e., one engine on a twin and
two engines on a tri or quad) is considered a potential unsafe
condition.
Hazard ratios: Data not reported. The hazard ratios below are for total
powerloss events contained elsewhere in this appendix
where the engines were theoretically restartable (thus, these
events do not include fuel exhaustion, engine hardware
failure, etc.) These hazard ratios should therefore be used
against complete, potentially recoverable powerloss
combined with inability to relight the critical number of
engines.
The only level 4 or 5 event involved incorrect use of
emergency procedures.
Note that level 3 events are due to altitude loss until relight
capability (e.g., descent from cruise after icing flameouts).
Self-recovering events are not included.
Turboprops: 4 reported events; 1 level 3; 0 level 4;
1 level 5
LBPR TFs: 2 events; 2 level 3; 0 level 4 or 5
HBPR TFs: 8 events; 5 level 3; 0 level 4 or 5
TP LBPR HBPR
level 3+ HR .500 1.000 .625
level 4+ HR .250 - -
level 5 HR .250 - -
A8-26

9/8/03 AC 39-8
FAILURE CONDITION CONSIDERED POTENTIALLY UNSAFE
14 Excessive Fuel Tank
Differential Pressures
Includes failures and errors
associated with refueling,
defueling, fuel transfer, fuel
jettison, fuel feed, fuel tanks, etc.
If the resulting differential pressure could impact primary
structure, critical system functions, or critical flight crew
functions such that continued safe flight and landing at an
airport would be prevented (errant refueling, defueling, fuel
vent failures, fuel tank vapor ignition, etc., could result in
differential pressures across a fuel tank wall that lead to
failure of primary structure or critical systems.)
If excessive fuel tank differential pressures could cause
additional potential unsafe conditions (resulting fuel leaks
could lead to uncontained fire, equipment contamination,
vapors in the cabin, etc.)
Hazard ratios: Data not reported. No known significant events due to fire,
contamination or vapors. 2 level 5 fuel tank
explosions/ruptures within the time period.
15 Fuel Load Imbalance
Includes failures and errors
associated with refueling,
defueling, fuel transfer, fuel
jettison, fuel feed, fuel tanks, etc.
If the resulting imbalance could impact primary structure,
aircraft handling qualities, performance, or range such that
continued safe flight and landing at an airport is prevented
(errant refueling, defueling, fuel transfer, leaking or trapped
fuel, vent failures, etc., could cause critical changes in
aircraft longitudinal or lateral CG, or both).
Hazard ratios: Data not reported. No significant events known due to fuel
load imbalance/CG issues.
A8-27

AC 39-8 9/8/03
FAILURE CONDITION CONSIDERED POTENTIALLY UNSAFE
16 Loss of Adequate Engine
Fuel Feed
Includes failures and errors
associated with refueling,
defueling, fuel transfer, fuel
jettison, fuel feed, fuel tanks,
etc., which can lead to total
or partial fuel starvation
If the fuel feed and thrust required for continued safe flight and
landing cannot always be restored in the altitude available (total
fuel starvation can occur due to leaking or trapped fuel,
inadequate initial fuel loading, over jettisoning, fuel boost or
feed failures, etc.)
Any other time the failure affects multiple engines.
Hazard ratios – Multiple Engine Fuel Problems:
TP LBPR HBPR ALL 3 4 5 ALL 3 4 5 ALL 3 4 5
Fuel contamination
*
0 0 2 1 0 0 0
4
0 1 0
* * * .250 .250
Fuel mismanagement
*
0 1 0 2 0 1 0
14
1 0 0
* * * .500 .500 .071
Fuel exhaustion
6
0 5 1 4 0 2 2
2
0 2 0
1.000 1.000 .167 1.000 1.000 .500 1.000 1.000
* Incomplete reporting. Note that fuel exhaustion leads to at least a level 4a (forced landing). Fuel contamination/mismanagement affecting multiple engines is sometimes recoverable; hence the hazard ratios are less than 1.0.
A8-28

9/8/03 AC 39-8
FAILURE CONDITION CONSIDERED POTENTIALLY UNSAFE
17 Flammable Fluid Leakage If the resulting ignition, equipment or cockpit
contamination, etc., could impact primary aircraft structure,
critical system functions, or critical flight crew functions
such that continued safe flight and landing would be
prevented (e.g., leaking fuel onto critical equipment could
result in equipment malfunction or create an uncontained
fire condition; fuel vapor in the cockpit could significantly
impair crew abilities).
If vapors from the leakage could spread into the aircraft
cabin and causing serious injuries to occupants.
If leakage could create an additional potential unsafe
condition (fuel leakage can lead to loss of fuel feed, fuel
load imbalance; fuel vapor ignition can result in uncontained
fire, etc.)
Hazard ratios: Oil/hydraulic fluid leaks:
Does not include multi-engine oil leaks due to maintenance
error.
Turboprops: 405 reported events (incomplete reporting of
base events in database); 0 level 3, 4 or 5
Turbofans: 1796 reported fuel leaks; 0 level 3, 4 or 5
TP TF
level 3+ HR <.002* < .001
* conservative due to under-reporting of base events
A8-29

AC 39-8 9/8/03
FAILURE CONDITION CONSIDERED POTENTIALLY UNSAFE
17 Flammable Fluid Leakage
(continued)
Fuel leaks: All high-level events were due to fuel leakage.
All were related to uncontained fires, including 1 hull loss
(no fatalities) due to fire from a fuel leak. There were no
cases within the data period of forced landings (level 4a) due
to fuel exhaustion from a fuel leak; however, there has since
been such an instance.
Note that all the level 3 and higher fires (and possibly all
fires from fuel leaks) occurred below 10,000 feet
(ground, takeoff/early climb or landing).
Turboprops: 63 reported events (incomplete reporting of
base events in database); 3 reported level 3 (uncontained
fires); 0 level 4 or 5
Turbofans: 2756 reported fuel leaks; 14 level 3
(uncontained fire); 1 level 4 (hull loss due to fire); 0 level 5
TP TF
level 3+ HR .048* .005
level 4+ HR - <.001
level 5 HR - <.001
* conservative due to under-reporting of base events
A8-30

9/8/03 AC 39-8
FAILURE CONDITION CONSIDERED POTENTIALLY UNSAFE
18 Smoke or Toxic Products in the
Cabin
If smoke or toxic products could significantly impair the
health of any passenger or crew, the ability of any flight
crew member to perform their duties, or any critical aircraft
function (for example, cause critical contamination of a
system, corrosion of primary structure)
Hazard ratios: Several thousand reported events of engine or APU fumes
2 level 3 (significant distress/difficulty reading instruments)
reported; 0 level 4 or 5
level 3+ HR <.001
Note that non-propulsion-related smoke in the cockpit has
contributed to at least one level 5 event.
A8-31