acacia mining plc total economic and tax …/media/files/a/acacia/reports/2015/...acacia mining’s...
TRANSCRIPT

Acacia Mining plc total economic and tax contributions in Tanzania, 2014 Prepared for Acacia Mining plc April 2015

Acacia Mining’s total economic and tax contributions in Tanzania, 2014
(Page intentionally left blank)

Acacia Mining plc’s total economic and tax contributions in Tanzania, 2014
EY | i
Executive summary
This report provides estimates of Acacia Mining plc’s (Acacia Mining plc is hereinafter referred
to as Acacia) economic contribution in Tanzania. This is the third annual EY analysis of the
company’s economic contribution.1” The direct impacts are for Acacia’s operations in 2014; the
estimates of related economic activity in Tanzania use multipliers developed in EY’s previous
studies. Acacia owns and operates three gold mines in Tanzania: Bulyanhulu, Buzwagi, and
North Mara. The economic impact analysis described in this report finds that Acacia’s
Tanzanian entities support economic activity across a wide range of industries in Tanzania,
including thousands of jobs with suppliers and other businesses and millions of dollars of
government revenue.
Table ES-1 summarizes the key findings of the analysis. Acacia’s total direct, indirect, and
induced economic contribution in Tanzania in 2014 included nearly 54,000 jobs, approximately
US$459 million of labour income, and nearly US$678 million of value added (GDP). In total,
including direct, indirect, and induced taxes paid by Acacia, its employees, suppliers, and other
affected businesses, Acacia’s total tax contribution in 2014 was an estimated US$179 million.
The overall employment multiplier (including indirect and induced economic activity) is 12, which
can be interpreted as, for each direct Acacia employee, 11 additional jobs are supported in the
broader Tanzanian economy. This multiplier is consistent with the high output per worker
experienced in the mining industry.
In general, the economic and fiscal contributions estimated in this analysis can be expected to
change in proportion to changes in Acacia’s direct employment, labour income, and value
added in future years. The estimates would also be affected by changes in the nature of capital
investment expenditures or the industry distribution of Acacia’s supplier purchases.
Table ES-1 Estimated economic and fiscal contributions of Acacia in Tanzania, 2014
Millions of 2014 US dollars; total number of employees
Direct
Indirect & induced
Total
Wage employment 4,443 49,500 53,943
Labour income $141 $320 $459
Value added (GDP) $190 $488 $678
Tanzania taxes, net of anticipated VAT refunds $118 $61 $179
Note: Figures may not sum due to rounding. Including self-employed proprietors, the estimated total employment impact is 76,943 workers. Source: EY analysis based on Acacia data and publicly available economic data for Tanzania. Data provided by Acacia management were not independently audited by EY.
Specific findings of the analysis include the following:
► Acacia is a high-wage employer. In 2014, Acacia employed more than 4,400 workers in

Acacia Mining plc’s total economic and tax contributions in Tanzania, 2014
EY | ii
Tanzania and paid wages and benefits totaling US$141 million. On average, employees
received more than US$31,000 in wages and benefits.
► Acacia provides jobs to Tanzanian nationals. Of Acacia’s 4,443 full and part-time wage
employees in Tanzania, 4,161 (94%) were Tanzanian nationals, on average.2 The
proportion of Acacia employees who are Tanzanian nationals is consistent with other mining
companies in Tanzania.3 Tanzanian nationals employed by Acacia received an average
annual wage of nearly US$16,400 (26.7 million TSH)—which remained unchanged from
2013. The average annual wage for Tanzanian nationals employed by Acacia in 2014 was
higher than the average earnings of US$1,525 (2.5 million TSH) for Tanzanian workers
throughout the economy in 2014, and higher than the average wage of the Tanzanian
mining industry of approximately US$1,000 (1.6 million TSH).
► Acacia has a strong Tanzanian supply chain. In 2014, Acacia’s Tanzanian entities
purchased US$488 million of goods and services from other Tanzanian businesses for use
by its Tanzania operations. These purchases of Tanzanian goods and services accounted
for 71% of total supplier purchases made by Acacia’s Tanzanian entities in 2014, compared
to 58% in 2013. Of this amount, US$99 million was purchased from businesses located in
the same region as Acacia’s mines.
► Acacia’s supply-chain spending supported 30,500 indirect wage-earning jobs.
Acacia’s supplier spending supported jobs across all sectors of the Tanzanian economy,
with the most jobs concentrated in the trade, transportation, and other services sectors.
► Consumption spending by Acacia and supplier employees supported an additional
19,000 induced jobs. These jobs, related to consumption spending by Acacia and supplier
employees on food, clothing, housing, and other goods and services, supported jobs that
were concentrated in the agriculture and trade sectors.
► Acacia’s total contribution to Tanzanian GDP in 2014 was approximately US$678
million. This level of total GDP contribution is equivalent to approximately 2% of total
Tanzanian GDP in 2014. Overall, the mining sector contributed 3.3% to the Tanzanian GDP
in 2013.4
► Acacia paid more than US$65 million in taxes and royalties in Tanzania in 2014.
Approximately 63% of Acacia’s direct Tanzanian tax payments was related to corporate
income taxes and royalties, while the remaining 37% was related to unrecovered VAT,
customs & excise taxes, payroll taxes, and other levies. The amount of tax paid by Acacia
declined by approximately US$6 million (8%) from 2013 to 2014.
► Acacia’s total government revenue contribution per employee is approximately 20
times higher than the national average. Per employee, Acacia contributes US$14,700 of
direct taxes and royalties, compared to approximately US$700 per worker economy-wide.
► Acacia’s employees contribute additional tax revenue. In 2014, Acacia’s employees
paid an estimated US$53 million in taxes. The majority (72%) of the estimated employee tax

Acacia Mining plc’s total economic and tax contributions in Tanzania, 2014
EY | iii
impact results from individual income taxes and social security contributions paid by
employees. Employees also paid significant amounts of VAT, excise, and other taxes on
consumption spending.
► Acacia’s economic activity resulted in indirect and induced tax impacts of US$61
million, for a total tax contribution of US$179 million.
► Acacia invests in its local communities. In 2014, Acacia’s social investments in Tanzania
totaled US$10.9 million, supporting a variety of education, infrastructure, water and
sanitation initiatives, primarily in the communities surrounding Acacia’s mines. Of this
amount, US$8.5 million related to Acacia’s Maendeleo Fund.

Acacia Mining plc’s total economic and tax contributions in Tanzania, 2014
EY | iv
Contents
1. Introduction ......................................................................................................................... 1
2. Estimating Acacia’s total economic and tax contribution – study methodology and current
literature ............................................................................................................................. 3
2.1 Study methodology ...................................................................................................... 3
2.2 Studies of mining economic multiplier effects ............................................................... 6
3. Acacia’s direct contributions in Tanzania in 2014 ................................................................ 7
3.1 Gross value added (GDP) ............................................................................................ 7
3.2 Employment ................................................................................................................. 8
3.3 Employee compensation/labour income ......................................................................10
3.4 Tanzania taxes paid and collected ..............................................................................11
4. Acacia’s indirect and induced economic and tax contributions, 2014 .................................13
4.1 Acacia’s direct, indirect, and induced economic contributions .....................................13
4.2 Acacia’s direct, indirect, and induced tax contributions ...............................................18
5. Acacia’s social investments, 2014 ......................................................................................21
6. Study limitations .................................................................................................................23
7. Conclusion .........................................................................................................................25
Appendix. Acacia Economic and fiscal contribution comparison 2013 and 2014 .......................26
References ...............................................................................................................................27
Endnotes ...................................................................................................................................28

Acacia Mining’s total economic and tax contributions in Tanzania, 2014
EY | 1
Acacia’s total economic and fiscal contribution in Tanzania,
2014
1. Introduction
The economic impact of Acacia’s gold production extends beyond its mines and employees.
The following is an update of prior EY analyses based on detailed 2012 and 2013 economic and
operating information for Acacia. The following direct impacts are for Acacia's operations in
2014; the estimates of related economic activity in Tanzania use multipliers developed in the
2012 analysis.
Acacia was created from Barrick Gold Corporation in an initial public offering in 2010. Acacia
was known as African Barrick Gold until November 2014. Acacia owns and operates three gold
mines in Tanzania—Bulyanhulu, Buzwagi, and North Mara. These mines are in the Lake Zone
of Tanzania, located near Lake Victoria in the northwest region.5
Acacia acquired Aviva Mining Kenya Ltd (AMKL) from Aviva Corporation (Aviva) in October
2012, and thereby acquired AMKL’s interests in the West Kenya Project through the Lonmin
Joint Venture with AfriOre International, a subsidiary of South African-based platinum producer
Lonmin Plc. Acacia also acquired AMKL’s right to earn up to a 75% interest in a second joint
venture with Advance Gold Corporation. The licenses occupy 2,208 square kilometres of the
highly-prospective Ndori Greenstone belt in Kenya, which forms part of the Archaean Tanzanian
Craton. Previous exploration identified significant potential for gold, as well as copper, lead, and
zinc. The license areas have been divided into two large gold camps, known locally as the
Kakamega Dome Camp and the Lake Zone Camp.
Acacia’s oldest and largest mine, Bulyanhulu, has been in production since 2001 and produced
234,786 troy ounces of gold during 2014. Copper is produced as a co-product at both
Bulyanhulu and Buzwagi. Table 1 summarizes Acacia’s mine operations in Tanzania, including
2014 production and anticipated mine life.
Table 1 Overview of Acacia mines Gold amounts in troy ounces
First year of production
2014 production
Proven and probable reserves
Expected end of mine life
Bulyanhulu 2001 234,786 9,530,000 2045 (34 years)
Buzwagi 2009 210,063 898,000 2024 (5 years)
North Mara 2002 273,803 2,047,000 2019 (9 years)
Total
718,652 12,475,000
Source: Acacia data. Mine life dates were provided by Acacia Management. Data provided by Acacia were not
independently audited by EY.
In 2013, mining comprised 3.3% of Tanzanian GDP and employed over 15,000 workers,
supported by a gold mining sector that ranked fourth in Africa in terms of production volume.6

Acacia Mining’s total economic and tax contributions in Tanzania, 2014
EY | 2
Gold is the largest mineral commodity in Tanzania, with gold exports comprising 89% of the
value of total mineral exports in 2014.7 Figure 1 illustrates Acacia’s share of Tanzania gold
production from 1998 through 2014. Acacia opened three mines between 2001 and 2005. Over
the period, Tanzania’s gold mining sector was also rapidly expanding, with production
increasing nearly 75% over five years and 2005 production levels more than 11 times higher
than in 1998. Between 2001 and 2005, Acacia averaged 26% of total Tanzanian production.
Since 2006, Acacia has produced, on average, just over half of all of Tanzania’s gold.
Figure 1 Acacia and total Tanzanian gold production, 1998-2014 Millions of troy ounces
* 2014 total Tanzanian gold production data are not yet available. 2014 represents only Acacia gold production for the
year. 49% represents Acacia’s average share of Tanzanian gold production from 2005-2013.
Source: US Geological Survey; Acacia data. Data provided by Acacia management were not independently audited
by EY.
Mining is a highly capital-intensive sector requiring substantial up-front and ongoing capital
investments. Because of the long-term nature of mining investments, once a mine has achieved
consistent profitability, it can contribute to the local economy for years to come. Acacia's
Bulyanhulu mine, for instance, contains more than 9.5 million troy ounces of proven and
probable gold reserves. Due to the estimated long life of the Bulyanhulu mine, the economic
and fiscal benefits related to the mine’s operations will continue through that period.
The following sections detail Acacia’s direct contributions to the Tanzanian economy and its
citizens through its mine operations as well as additional related economic activity.
0.0
0.5
1.0
1.5
2.0
1998 1999 2000 2001 2002 2003 2004 2005 2006 2007 2008 2009 2010 2011 2012 2013 2014
Millio
ns o
f tr
oy o
un
ces
Acacia gold production Non-Acacia gold production in Tanzania
2001-2004
Acacia avg. prod.: 315,500 t oz Acacia avg. share: 23%
2005-2014* Acacia avg. prod.: 668,208 t oz
Acacia avg. share: 49%

Acacia Mining’s total economic and tax contributions in Tanzania, 2014
EY | 3
2. Estimating Acacia’s total economic and tax contribution – study
methodology and current literature
2.1 Study methodology
Acacia’s total economic contribution consists of three elements, described below.
1. Direct contribution. Acacia’s direct contribution includes the total number of wage
employees and amount of employee compensation (gross wages and salaries, employer
payroll taxes, and other employee costs) at its Tanzanian entities, including mines and
support offices. The direct contribution also includes the total amount of GDP attributed to
Acacia’s Tanzanian operations and tax payments by Acacia and Acacia employees.
2. Indirect contribution. The indirect contribution is the supplier-related Tanzanian economic
activity that results from Acacia’s purchases of goods and services, including spending on
contractors and social investments in local communities. Purchases from other Tanzanian
businesses providing engineering services, utilities, telecommunications, information
services, and other operating inputs support employment in these industries. In turn, these
suppliers purchase operating inputs, which support additional rounds of indirect economic
contributions.
3. Induced contribution. The induced economic contribution reflects the contribution from
employee spending. Employees at Acacia’s mines and support offices and employees at
other businesses indirectly affected by Acacia’s operations use a portion of their incomes to
purchase goods and services from Tanzanian businesses. These transactions support
employment at businesses such as retailers, restaurants, and service companies.
Figure 2 shows the three components of the total economic contribution. The left-hand side of
the diagram shows the components of Acacia’s direct contribution, including mining,
administrative, and exploration operations in Tanzania. Each of these activities creates
additional economic impacts through two primary channels: (1) domestic input purchases and
(2) payments to employees and proprietor income (labour income). Domestic input purchases
support additional indirect economic contributions as Acacia purchases goods and services
from Tanzanian businesses. The labour income earned by Acacia and supplier employees
creates induced effects resulting from consumer spending.

Acacia Mining’s total economic and tax contributions in Tanzania, 2014
EY | 4
Figure 2 Overview of the components of economic contribution
Components of Acacia’s direct contribution Multiplier drivers
Related economic activity
The magnitude of economic contribution in Tanzania is determined by several factors, including
supplier relationships with businesses in the country. This impact can be expressed using an
“economic multiplier” which is equal to the total economic impact per unit of direct impact. The
economic multipliers in this study were estimated using the 2007 Social Accounting Matrix
(SAM) for Tanzania, published by the Purdue University Global Trade Analysis Project (GTAP),
publicly available data reported by the Tanzanian National Bureau of Statistics (NBS), and
operations and supplier purchase information provided by Acacia. (A SAM represents all
economic flows in an economy, “taking into account the patterns of production and demand, and
various institutional relationships.”8)
Figure 3 details the relationships between the data inputs (including source information), steps
in the analysis, and the results that are described in this report.
Several key inputs to the economic and tax contribution analysis have been updated to reflect
Acacia’s 2014 operations, including employment, employee compensation, the level of supplier
purchases, and taxes paid.
The multipliers applied in the following analysis have not been re-estimated and are based on a
detailed analysis of Acacia’s operations and Tanzanian economic and tax data from 2012. For
further details please see the November 2013 EY report prepared for Acacia.
Acacia’s exploration activities
Acacia’s Tanzania administrative offices in
Dar es Salaam
Acacia’s TZ gold mines:
Bulyanhulu, Buzwagi, &
North Mara
Indirect effect (supplier-related)
TZ input purchases
TZ input purchases
TZ input purchases
Induced effect (consumption-related)
TZ labour income
TZ labour income
TZ labour income

Acacia Mining’s total economic and tax contributions in Tanzania, 2014
EY | 5
Figure 3 Diagram of analysis inputs, intermediate results, and outputs
J. 2014 ratios of taxes to economic activity
USD of tax collections per USD of economic activity (e.g.
personal income)
K. Total tax contribution Total tax contribution =
I + (G-F)*J
F. Direct economic contribution
2014 Acacia data on direct impacts (employment, employee compensation, sales, and input
purchases)
D. Derivation of Acacia
indirect & induced impacts
E. Estimation of “total
effects” multipliers
by industry, for gross value added (GDP), labour income,
and employment
C. 2014 Acacia supplier data
domestic and total supplier purchases by type of purchase
A. National input-output (I-O) & statistical data
TZ National Bureau of Statistics and the Purdue University Global Trade Analysis Project (GTAP)
B. National I-O table unadjusted multipliers
for each industry
G. Total economic contribution
Total economic contribution = E * F
I. Direct tax contribution
H. 2014 Acacia tax data Direct business taxes paid by
Acacia & income taxes paid by Acacia employees
Mu
ltip
lier
derivatio
n
Co
ntr
ibutio
n e
stim
ate
s
Key
Reported output
Intermediate step
Input

Acacia Mining’s total economic and tax contributions in Tanzania, 2014
EY | 6
2.2 Studies of mining economic multiplier effects
While there is not a significant body of Tanzanian economic impact analysis using economic
multipliers, several studies in Tanzania and in peer countries have been identified to inform this
analysis of Acacia’s contributions to the Tanzanian economy.
A review of Tanzania- and mining-related economic multiplier studies found a relatively small
range of mining direct and indirect output multipliers, varying from 1.0 to 2.0. Employment and
labour income multipliers estimated in the reviewed studies were distributed over a wider
range–from 1.3 to 11.1 for employment, and from 1.2 to 5.7 for labour income. Other literature
considered the implications for multiplier effects of agrarian-based economies and the mining
industry’s capital-intensive nature.
The most similar study to this analysis was of the economic contributions of a Ghanaian gold
mine, which estimated the direct, indirect, and induced economic contributions of gold mining
activities, based on the GTAP database of economic relationships.9 Further, the Ghana and
Tanzania economies share certain similarities, with predominantly agrarian economies and
large (or growing) mining sectors. The Ghana study found a total gold mining employment
multiplier of 28.4 and a labour income multiplier of 5.5.
Most of the current economic studies for Tanzania and comparison countries include only the
indirect (supplier-related) economic contribution. These studies report mining-sector
employment multipliers ranging from 1.3 to 21.0. In general, mining sector multipliers reported
for other countries in Africa tend to be higher than the multipliers reported for Tanzania. Some
studies of mining sector economic contributions in Tanzania cite the limited supply of locally-
produced operating inputs purchased by the Tanzanian mining industry as a contributing factor
to the low estimated indirect multipliers.
Of the eight economic multiplier studies examined, only two studies included estimates of the
induced (consumption-related) economic impacts. The Ghana study estimated that employment
related to induced activity comprised 26% of the total employment impact.10

Acacia Mining’s total economic and tax contributions in Tanzania, 2014
EY | 7
3. Acacia’s direct contributions in Tanzania in 2014
This section presents Acacia’s direct contributions to the Tanzanian economy in 2014 through
its operations and investment activities, presenting a snapshot of Acacia’s operations during the
year. Much of Acacia’s operations are annual impacts, producing economic activity during each
year of the mine’s life. Based on Acacia’s current projections, the company anticipates operating
its largest mine in Tanzania through at least 2045.
The economic and fiscal contributions presented in this report are described in terms of four key
indicators: (1) employment, (2) employee compensation/labour income, (3) gross value added
(GDP), and (4) tax payments. Each of these indicators is described in detail in the following
sections, illustrating how Acacia’s operations contribute directly to the Tanzanian economy.
Highlights of Acacia’s direct contribution include:
► Acacia’s Tanzanian entities were mostly staffed by Tanzanian workers—Tanzanian
nationals made up 94% of Acacia’s employees in Tanzania in 2014. This proportion is
consistent with the share of employees at other miners located in Tanzania who are
Tanzanian nationals.
► Acacia’s direct contribution to GDP in Tanzania was US$190 million in 2014—a 21% decline
from Acacia’s 2013 direct contribution to GDP of US$240 million. This decline reflected
lower employment and lower tax payments.
► The average annual gross wage received by Tanzanian nationals employed by Acacia was
approximately US$16,400 (26.6 million TSH)—far in excess of the overall Tanzanian
average gross wage for paid employees of approximately US$1,000 (1.6 million TSH).11
► In 2014, Acacia paid approximately US$65 million in Tanzanian taxes, including US$41
million of corporate income taxes and royalties, US$16 million of employer payroll taxes, and
US$8 million of indirect taxes, including anticipated unrecoverable VAT, customs duties,
excise taxes, and other levies.
3.1 Gross value added (GDP)
During 2014, Acacia’s operating expenditures totaled nearly US$878 million in payments to
employees as wages and benefits, to the government as taxes, and to communities as
purchases from local suppliers. The composition of Acacia’s expenditures in Tanzania is shown
in Figure 4.
Gross value added (reported as GDP) is the broadest measure of economic activity included in
this analysis. The sum of gross value added across all industries is equivalent to a country’s
GDP. Acacia’s contribution to GDP is the sum of its payments to labour, capital, and
government (indirect taxes). In 2014, Acacia’s direct GDP was an estimated US$190 million.

Acacia Mining’s total economic and tax contributions in Tanzania, 2014
EY | 8
Figure 4 Composition of Acacia’s expenditures, 2014
Millions of 2014 US dollars
Source: Acacia data. Data provided by Acacia management were not independently audited by EY.
3.2 Employment
The employment estimates are reported in terms of two major classifications of jobs: (1) wage
employment and (2) proprietors, described below.
1. Wage employment: As defined by the Tanzania NBS, wage employment includes regular
employees and casual workers. Regular employees are permanent and temporary
employees who have been employed on a weekly or monthly basis for more than one
month.12 Casual workers are defined as persons receiving daily wages.
2. Proprietors: Proprietors are self-employed individuals who own or manage a business or
other such establishment. Proprietors do not include subsistence farmers.
Acacia’s direct employment is the average number of Tanzanian and international wage
employees at Acacia’s Tanzania locations in 2014. These figures are based on the monthly
number of paid employees, provided by Acacia, and are shown in terms of total headcount, not
full-time equivalents (FTEs). In 2014, Acacia directly employed 4,443 wage employees in
Tanzania, accounting for 98% of Acacia’s total employment across all countries. Figure 5 shows
the geographic distribution of Acacia’s employment in Tanzania in 2014. The Bulyanhulu mine
has the largest share of employment, employing 52% of Acacia’s total workforce in Tanzania.
Corp. income tax, royalties, net VAT payments, and customs & excise taxes; $49mm (6%)
Suppliers, contractors & communities; $688mm (78%)
Employee payroll costs, incl. taxes; $141mm (16%)
Total
$878mm

Acacia Mining’s total economic and tax contributions in Tanzania, 2014
EY | 9
Figure 5 Average Acacia’s employment in Tanzania, by Tanzanian entity in 2014
Note: The Tulawaka site closed on July 30, 2013. The 2 employees shown in the figure are the average number of employees during the year. Figures may not appear to sum due to rounding of average monthly headcounts. Source: Acacia data. Data provided by Acacia management were not independently audited by EY.
On average, 94% (4,161 employees) of Acacia’s total 4,443 employees in Tanzania during 2014
were Tanzanian nationals. Studies of Tanzania’s governance and oversight of the mining sector
have cited the perception of limited job opportunities for Tanzanian nationals at mining
operations due to the high number of international employees working on-site.13 However, this is
changing over time as Tanzania’s mining sector develops and companies continue to invest in
employee training, resulting in a more skilled domestic workforce and more job opportunities for
Tanzanians.14
According to a report published by the Tanzanian Ministry of Energy and Metals (MEM) in 2011,
Tanzanian nationals made up 90% of employment at both the Bulyanhulu and Buzwagi mines in
2009.15 During the period 2014, Acacia increased relative employment of Tanzanians at the
Bulyanhulu mine to 94%, while the percentage of Buzwagi employees who are Tanzanian has
increased to 96%.16 Over the past five years, the share of Acacia’s employees in Tanzania that
are Tanzanian nationals has increased from 90% to 94% while that of expatriates decreased
Dar es Salaam 127
Bulyanhulu 2,318
Buzwagi 901
North Mara 1,042
Exploration 53
Tulawaka
2

Acacia Mining’s total economic and tax contributions in Tanzania, 2014
EY | 10
from 10% to 6% in the same period. In other words, expatriates’ share of Acacia employment
declined by approximately 40% from 2010 to 2014.
The composition of Acacia’s employment in Tanzania from 2010 to 2014 is shown in Table 2.
Table 2 Composition of Acacia’s employment in Tanzania, 2010-2014
2010 2011 2012 2013 2014
Tanzanian nationals 4,184 4,650 4,953 4,691 4,161
Foreign nationals 490 538 517 394 283
Total Acacia employees in Tanzania 4,674 5,188 5,470 5,084 4,443
% Tanzanian nationals 90% 90% 91% 92% 94%
Source: Acacia data. Data provided by Acacia management were not independently audited by EY.
Note: 2014 data reflect average headcount across the entire year. As of year-end 2014, the share of
Acacia employees who were Tanzanian nationals had increased to 94.1%.
Acacia operations are also supported by a significant number of mining, engineering, security,
and construction contractors who work on-site at Acacia mines and facilities. In 2014, Acacia
reported US$92 million in contractor spending related to the 3,517 contractors working on-site at
Acacia’s mines, of which 3,320 (94%) were Tanzanian nationals. These contractors are
employed by other businesses (as opposed to independent contractors contracted as
individuals) and therefore these contracts are categorized as purchased services.
3.3 Employee compensation/labour income
Total employee compensation includes salaries, wages, and benefits. Salaries and wages are
defined as gross wages before deducting employee individual income tax. Benefits include
employer-contributed health insurance and retirement benefits, employer social security
contributions and payroll tax (skills and development levy), and the value of other employee
costs including training, meals, and travel. As shown in Figure 6, in 2014, Acacia’s employees in
Tanzania earned a total of US$141 million in compensation. This amount includes US$16
million of employer payroll taxes paid by Acacia in Tanzania, of which US$6 million was paid on
salaries to international employees. Further, according to data provided by Acacia, a significant
amount of individual income tax was paid by Tanzanian employees in 2014—US$21 million
(57% of individual income tax paid by all Acacia employees in Tanzania).
The average wage for Tanzanian nationals employed by Acacia in Tanzania was nearly
US$16,400 in 2014. Of total take-home wages paid by Acacia to employees in Tanzania, more
than half (54%) was paid to Tanzanian nationals.

Acacia Mining’s total economic and tax contributions in Tanzania, 2014
EY | 11
Figure 6 Composition of Acacia’s employee compensation in Tanzania, 2014
Millions of 2014 US dollars
Note: Employee taxes include individual income tax withholding and social security contributions. Employer payroll
taxes include employer social security contributions and skills and development levy payments.
Source: Acacia data. Data provided by Acacia management were not independently audited by EY.
3.4 Tanzania taxes paid and collected
Acacia’s tax contribution has three components: (1) direct taxes paid by Acacia, including
corporate income taxes and royalties, as well as indirect taxes on operations such as value-
added tax, payroll taxes, import duties and fuel levies; (2) individual income taxes paid by
Acacia’s employees; and (3) taxes withheld from suppliers and contractors and remitted by
Acacia on their behalf.
In 2014, Acacia paid US$141 million in Tanzanian taxes and royalties, as shown in Figure 7.
Corporate income taxes and royalties comprised 63% of taxes paid by Acacia (and, more
broadly, 37% of total taxes paid or collected by Acacia). Acacia paid $41 million in royalties and
paid no corporate income tax to the Tanzanian government. Under the Mining Tax Act of 2010,
Tanzania increased gold royalties from 3% to 4% and broadened the royalty base from net
value to gross sales (total revenue from domestic sales and exports).
Indirect taxes shown in Figure 7 include net VAT payments, fuel levies, environmental fees and
charges, and import duties. The net VAT payments included for Acacia are 2014 VAT payments
on inputs, net of expected refunds. Tanzania currently charges an 18% VAT for standard-rated
supplies. Exports of goods and services are subject to a 0% VAT. Fuel levies are assessed at
US$200,000 per site for Acacia properties.
Payroll taxes paid by Acacia in Figure 7 include social security contributions and skills and
development levy payments. Social security contributions are paid by both employers and
$0
$20
$40
$60
$80
$100
$120
$140
$160
Employee payroll taxes, $16mm
Employer taxes, $38mm
Take-home salaries & wages, $87mm
$141mm

Acacia Mining’s total economic and tax contributions in Tanzania, 2014
EY | 12
employees in Tanzania, with each contributing 10% of gross salary to the National Social
Security Fund.
In addition to the taxes paid by Acacia, Acacia withheld US$38 million on behalf of its
employees in 2015—an estimated US$12 million for employee social security contributions, and
more than US$25 million for individual income tax withholding. Individual income taxes are
assessed over five brackets, with a top marginal rate of 30%. Allowable deductions include
social security contributions and certain health care costs. At the average wage level earned by
Acacia employees, the average statutory individual income tax rate is 27%. The estimated
US$25 million of individual income taxes withheld by Acacia in 2014 was 27% of total taxable
employee earnings, in-line with the average statutory rate. Based on average wages in the
Tanzanian economy (US$1,525), the average nationwide statutory tax rate on individual income
is 4%. Acacia also withheld and remitted US$9 million in withholding taxes on behalf of its
suppliers.
Figure 7 Distribution of Acacia 2014 taxes paid or withheld
Millions of 2014 US dollars; total 2014 taxes paid or withheld by Acacia = $113 million
Note: Indirect taxes include anticipated unrecoverable VAT payments, import duties, fuel levies, environmental levies,
and other charges and fees. Payroll taxes paid by Acacia include employer social security contributions and skills and
development levy payments.
Source: Acacia data. Data provided by Acacia management were not independently audited by EY.
$9mm
$38mm
$8mm
$16mm
$41mm
Supplier spending withholding tax
Payroll taxes
Indirect tax
Payroll taxes paid by Acacia
Corporate income tax & royalties
Taxes paid by Acacia
Taxes withheld on behalf of employees
Tax collected and remitted by Acacia

Acacia Mining’s total economic and tax contributions in Tanzania, 2014
EY | 13
4. Acacia’s indirect and induced economic and tax contributions, 2014
Acacia’s contributions to the Tanzanian economy extend beyond the mine gates. As described
in Section 3, Acacia generates indirect and induced economic activity through its purchases
from Tanzanian suppliers and the local consumer spending of their employees. Further, this
activity results in additional taxable sales and income. Highlights of the total economic
contributions include:
► For every direct employee at Acacia’s mines and administrative offices in Tanzania, there
were approximately 11 paid employees and 5 self-employed individuals supported in the
broader economy. On average, these workers earned US$5,970 of labour income in 2014,
compared to an economy-wide average of US$1,525 (in 2014 US dollar terms) as reported
in the 2006 labour force survey.17
► Approximately 71% of the US$688 million of purchases of services and supplies made by
Acacia’s Tanzanian entities were from domestic suppliers.
► Approximately 92% of Acacia’s US$688 million of total procurement expenditures in 2014—
over US$633 million—were of a recurring nature, including operating input purchases and
sustaining capital investments. The remaining 8% was for investment in mine expansion and
development.
► Economic activity related to Acacia’s operations in Tanzania generated a total of nearly
US$179 million of tax payments by businesses and individuals.
4.1 Acacia’s direct, indirect, and induced economic contributions
In 2014, Acacia’s total economic contribution, including supplier and consumer spending
impacts, was an estimated US$678 million of GDP, of which US$460 million was labour income
(income earned by wage employees and proprietors), as shown in Table 3. Through supplier
purchases, Acacia’s activities generated US$290 million of indirect GDP, including US$180
million of labour income for an estimated 35,300 wage and self-employed workers in Tanzania.
Consumer spending by Acacia and supplier employees at local retailers, grocers, and other
businesses supported an estimated additional 37,200 wage employees and sole proprietors,
earning a total of US$138 million in labour income (averaging approximately US$3,700 per
worker; 6.1 million TSH).
The analysis presents employment impacts separately for wage employment and full
employment, which includes wage and self-employed workers. Depending on the types of
businesses from which suppliers and individuals purchase goods and services, the number of
jobs in each category may differ. For example, domestic purchases from large multinational
firms create wage employment opportunities in Tanzania, compared to additional demand for
local personal services, which are more likely to create opportunities for entrepreneurs.
Table 3 Acacia’s total economic contributions in Tanzania, 2014 Millions of 2014 US dollars; number of employees

Acacia Mining’s total economic and tax contributions in Tanzania, 2014
EY | 14
Direct contribution
Indirect contribution
(supplier spending)
Induced contribution
(employee spending)
Total contribution
Wage employment 4,443 30,500 19,000 53,943
Labour income $141 $180 $138 $459
Value added (GDP) $190 $290 $198 $678
Addendum: Full employment (Wage employment & proprietors) 4,443 35,300 37,200 76,943
Note: Direct employee headcount does not include contractors. Contractors are included as indirect contributions. Full employment includes wage employees and proprietors (self-employed individuals). Figures may not sum due to rounding. Source: EY analysis based on Acacia data. Data provided by Acacia management were not independently audited by EY.
In their economic benefits report, MEM states that mines have “significant potential to act as a
catalyst for local business development due to the demand it generates for goods and
services.”18 Acacia makes significant purchases of goods and services to support its annual
operations, much of which is from Tanzanian businesses. As shown in Figure 8, Acacia’s
Tanzanian entities purchased US$488 million of goods and services from within Tanzania
related to its operations, accounting for 71% of total input purchases. Of this amount, US$99
million was provided by suppliers that are located near the purchasing mine or in the closest
regional/major town. The remaining US$389 million was purchased from businesses operating
within Tanzania, but outside of the immediate impact area or closest regional/major town
surrounding the mine. Further, according to data provided by Acacia, 47% ($230 million) of the
US$488 million of Tanzanian purchases were purchased from Tanzanian-owned businesses.
Domestic purchases of goods and services generated rounds of supplier purchases, which
resulted in an estimated US$290 million of indirect GDP in Tanzania.
Acacia’s Tanzanian capital investments in 2014 are included in Acacia’s total Tanzania
procurement of US$488 million, shown in Figure 8. During 2014, Acacia invested nearly
US$194 million to develop new sites or expand existing projects. These expenditures included
capitalized exploration and evaluation costs and mine site development and expansion. Major
expansion projects create a one-time catalyst for the economy, creating temporary but important
jobs at the mine development site.

Acacia Mining’s total economic and tax contributions in Tanzania, 2014
EY | 15
Figure 8 Location of Acacia’s suppliers for operating inputs and capital expenditures,
2014
Total 2014 supplier purchases = US$688 million
Note: The immediate impact area, as defined by Acacia, includes the surrounding communities as well as the nearest regional or major town. Businesses within the immediate impact area are shown as “Same region as mine” purchases. Purchases from suppliers outside of the immediate impact area are shown as “Other TZ regions”. Source: Acacia data. Acacia data were not independently audited by EY.
The types of goods and services that Acacia’s Tanzanian entities purchases from Tanzanian
businesses create different impacts in the economy. The level of indirect impact primarily
depends on two factors: (1) the amount of goods or services that are purchased domestically
and (2) the average levels of output per worker for each industry. The total level of output per
worker in each industry reflects the dependence on labour for production. For example, the
mining sector is capital intensive and has a very high output per worker, compared to the
national average for all industries. Alternatively, most service sectors have low output per
worker because they rely on labour to produce their product and generate revenue. The
composition of purchases made by Acacia’s Tanzanian entities in 2014 is displayed in Figure 9,
classified by activity or product of the supplier. Purchases of machinery and equipment from
Tanzanian wholesalers are classified within the service sector as trade. Machinery and
equipment manufactured in Tanzania would be classified within the industrial sector.
Other TZ regions, $389mm
Same region as mine, $99mm
Tanzania, $488mm
South Africa, $51mm
International, $136mm
Rest of Africa $13mm

Acacia Mining’s total economic and tax contributions in Tanzania, 2014
EY | 16
Figure 9 Distribution of purchases of Tanzania-supplied goods and services by Acacia’s
Tanzanian entities, by sector, 2014
Total 2014 purchases from Tanzanian suppliers by Acacia’s Tanzanian entities = US$488million
Note: The industrial sector includes mining, manufacturing, utilities, and construction. The service sector includes trade, transportation, and communication; financial services; business and professional services; health, educations, and public administration; and other services. Source: EY analysis of data provided by Acacia. Acacia data were not independently audited by EY.
Figure 10 shows the distribution of the estimated direct, indirect, and induced wage employment
impacts by major industry sector. The majority of the indirect wage employment is within the
trade and transportation, financial services, and other services sectors. In 2014, approximately
8% of Acacia’s total purchases were for sustaining capital at Acacia’s mines and Tanzanian
offices. This investment includes replacement equipment, capitalized improvements to buildings
and facilities, and other sustaining capital. Domestic purchases of equipment are frequently
through a Tanzanian wholesaler selling equipment that was manufactured elsewhere and
imported into Tanzania. This activity generates employment in the wholesale trade industry,
classified as trade and transportation.
Acacia’s Tanzanian entities are supported by a significant number of mining, engineering,
security, and construction contractors who work on-site at Acacia mines and facilities. Contract
employment is classified as a purchased service and is included in the indirect wage
employment impact. In 2014, Acacia reported US$92 million in contractor spending related to
the 3,517 contractors working on-site at Acacia’s mines, of which 3,320 (94%) were Tanzanian
nationals.
Induced consumption-related employee spending reflects the household purchasing distribution
in Tanzania. The largest share of induced wage employment is in the agricultural sector.
According to the GTAP model, agriculture products make up nearly 62% of the total domestic
Agriculture, 2%
Industrial, 43% Service, 55%
Total
$488mm

Acacia Mining’s total economic and tax contributions in Tanzania, 2014
EY | 17
goods and services purchased by households. Induced jobs are also supported in the trade
sector (through spending at retail stores) and other services (which includes personal services,
entertainment, restaurants, and hotels), as well as for financial services, manufacturing, and
healthcare and education.
Figure 10 Distribution of estimated direct, indirect and induced wage employment, 2014
Note: The figure does not include the estimated number of proprietors in each industry. “Other services” includes
personal services, recreation and entertainment, and hospitality and food service. “Trade & transport” includes retail
and wholesale trade, transportation services, and communications services.
Source: EY analysis based on Acacia data. Data provided by Acacia management were not independently audited by
EY.
The estimated wage employment multiplier of 12 can be interpreted as, for each direct Acacia
employee, 11 wage employees are supported through indirect and induced economic activity,
totaling 12 employees overall. Including proprietors, the employment multiplier increases to 17
(i.e. for every one direct Acacia employee, there are an estimated 16 additional wage and self-
employed positions supported in the broader Tanzanian economy).
Figure 11 compares the estimated employment impacts for wage employment and full
employment, including proprietors. The majority of the indirect impact related to supplier
purchases is comprised of direct wage employees. The analysis assumes that the companies
that Acacia directly purchases goods and services from in Tanzania are not sole
proprietorships. However, the additional rounds of supplier purchases (Acacia’s direct suppliers
purchasing from other Tanzanian businesses) add an estimated 4,800 proprietors.
Self-employed labour accounts for 18,200 jobs out of the induced employment impact of 37,200
jobs. As employees spend their incomes in the local economy, it is likely that they purchase
-
2,000
4,000
6,000
8,000
10,000
12,000
Induced employment
Indirect employment
Direct employment, Acacia

Acacia Mining’s total economic and tax contributions in Tanzania, 2014
EY | 18
food and personal services from individuals who own their own businesses such as restaurants,
convenience stores, personal service businesses, and construction contractors.
Figure 11 Comparison of estimated employment impacts, 2014
Note: Full employment includes wage employees and proprietors (self-employed persons, excluding subsistence farmers). Source: EY analysis based on data provided by Acacia. Data provided by Acacia management were not independently audited by EY.
4.2 Acacia’s direct, indirect, and induced tax contributions
In 2014, Acacia paid US$65 million in Tanzanian taxes and royalties. In addition to paying an
estimated US$38 million in individual income taxes and social security contributions, Acacia’s
employees paid approximately US$15 million in other taxes and fees, including VAT and excise
taxes on their purchases. Taxes paid by Acacia and Acacia’s employees collectively make up
Acacia’s direct tax impact, totaling US$118 million in 2014.
Suppliers and businesses that sell to Acacia and supplier employees also pay taxes on their
sales and incomes related to the increased demand for their goods and services. Businesses
and individuals paid an estimated US$61 million in taxes related to indirect and induced
economic activity.
In Tanzania, tax payments were approximately 16% of total labor income (wages and benefits)
in 2014. In that year, VAT, customs duties, and excise taxes paid by businesses and individuals
totaled 6% of total labor income.19 Payroll taxes include social security and skills and
development levy payments. In 2014, these taxes totaled an estimated 1% of labor income.
4,443
30,500
19,000
53,943
35,300 37,200
76,943
0
10,000
20,000
30,000
40,000
50,000
60,000
70,000
80,000
90,000
Direct Indirect Induced Total
Wage employment
Full employment

Acacia Mining’s total economic and tax contributions in Tanzania, 2014
EY | 19
Table 4 Acacia’s total tax contribution, 2014
Millions of 2014 US dollars
Direct Tax
Paid by Acacia
Paid by Acacia
employees Indirect &
induced tax Total tax
Corporate income tax & royalties $41.3 $ -- $6.2 $47.5
Individual income tax -- 25.4 9.6 35.0
Value-added tax (VAT) 0.9 6.1 13.7 20.7
Customs & excise 5.6 7.3 16.6 29.6
Payroll taxes 15.8 12.5 2.0 30.3 Technical services withholding tax and other taxes & fees
1.6 1.4 12.5 15.5
Total taxes $65.3 $52.7 $60.7 $178.6
Note: The direct VAT paid by Acacia reported above is the estimated VAT paid on input purchases that will be unrecovered by Acacia through refunds. Payroll taxes include social security contributions and the skills & development levy. Technical services withholding taxes collected and remitted by Acacia are not included in the direct tax impacts. These taxes are included in the indirect tax impact, as the liability of the suppliers. “Other taxes and fees” include capital gains taxes, as well as business license fees, motor vehicle license, and other similar taxes and fees. Figures may not sum due to rounding. Source: EY analysis based on Acacia data. Data provided by Acacia management were not independently audited by EY.
Overall, tax payments by Acacia’s Tanzanian entities comprised 37% of the total estimated tax
impact, shown in Figure 12. Of the total, 23% were corporate income tax and royalty payments
paid by Acacia. Estimated unrecoverable VAT and customs and excise duties paid by Acacia
comprised a combined 4% of the total tax impact of $179 million. Other taxes paid by Acacia
included payroll taxes, fuel levies and taxes paid to local governments, totaling 10% of
estimated taxes overall.
In order to properly quantify the contribution of Acacia’s VAT payments to the Tanzanian
economy, this analysis assumes that Acacia’s direct VAT contribution consists only of those
VAT payments not recovered through refunds. Acacia estimates that VAT claims of nearly
$930,000 will be disallowed. This amount has increased since 2013, when unrecovered VAT
totaled nearly $620,000.

Acacia Mining’s total economic and tax contributions in Tanzania, 2014
EY | 20
Figure 12 Composition of Acacia’s total tax contribution from operations, 2014
Total 2014 tax impact = US$179 million
Note: Percentages shown are percentages of the total estimated tax impact of US$179 million. Figures may not appear to sum due to rounding. Source: EY analysis based on Acacia data and data published in Tanzania’s national accounts. Data provided by Acacia management were not independently audited by EY.
The US$61 million of taxes related to indirect and induced economic activity accounted for 34%
of the total tax impact. The US$9 million of tax withheld by Acacia on behalf of suppliers is
included as an indirect tax impact. Other indirect and induced tax impacts were estimated using
the ratios of Tanzania-wide tax collections to Tanzania personal income. Customs and excise
taxes made up the largest share of indirect and induced tax impacts at 27%. VAT comprised
23% of the total. Other indirect and induced taxes include taxes and fees such as business and
motor vehicle license fees, employer payroll taxes (including social security and the skills
development levy), and capital gains taxes.
Corporate income tax &
royalties 23%
Customs & VAT 4%
Other taxes 10%
Paid by Acacia employees
29%
Indirect and induced tax
34%
Acacia taxes 37%

Acacia Mining’s total economic and tax contributions in Tanzania, 2014
EY | 21
5. Acacia’s social investments, 2014
Beyond economic contributions, Acacia made substantial social investments that can have long-
lasting health, education, and infrastructure benefits in Tanzania. In 2014, Acacia invested a
total of US$10.9 million in its Tanzania corporate responsibility program with US$8.5 million
being spent on the Maendeleo Fund and US$2.4 million on wider community relations and mine
site community, as summarized in Table 5. Of the US$8.5 million Maendeleo Fund spending,
US$2.6 million (31%) was invested in infrastructure, US$2.5 million (30%) went towards
education programs, and US$1.3 million (15%) was used to improve water & sanitation access.
Beyond the Maendeleo Fund, Acacia invested an additional US$2.4 million in social programs,
for a total of US$10.9 million in social investment spending in 2014.
Table 5 Summary of Acacia’s 2014 social contributions in Tanzania
Thousands of 2014 US dollars
North Mara Buzwagi Tulawaka Bulyanhulu Corporate Discovery Total
Maendelo Fund spending
Donations $164 $3 $0 $0 $0 $137 $304 Education $1,857 $154 $57 $317 $127 - $2,513 Infrastructure $482 $2,066 $0 $0 $0 $35 $2,584 Water & Sanitation $730 $0 $39 $276 $0 $212 $1,257 Health $366 $0 $0 $0 $0 $403 $769 Livelihood support $632 $50 $18 - $27 - $726 Other $283 $0 - - $34 - $317
Total Maendeleo Fund spending $4,514 $2,273 $114 $592 $188 $787 $8,469 CSR site operation costs
- - - - - - $2,389
Total community investment $4,514 $2,273 $114 $592 $188 $787 $10,858
Note: Figures may not appear to sum due to rounding. “CSR site operation costs” include spending on Village Benefit
Implementation Agreements (VBIAs).
Source: EY analysis based on data provided by Acacia Data provided by Acacia management were not independently audited by EY.
This social investment spending is included in Acacia’s $488 million of supplier spending in
Tanzania and is captured in the resulting indirect and induced contributions. However, the long-
term impact of these investments resulting from, for example, access to medical facilities and
potable water are not estimated in this study.
Acacia’s Maendeleo Fund supports a wide variety of projects in Tanzania with a primary focus
being the communities that live around the Acacia mines and exploration sites. Some of these
projects have short-term, one time impacts. The fund was established in 2011 as part of
commitment to promoting sustainable development in Tanzania. Funding priority is given to
investments that support community development and capacity building, access to health,
education, water and environmental projects within communities surrounding our operations.

Acacia Mining’s total economic and tax contributions in Tanzania, 2014
EY | 22
Since its inception, the Acacia Maendeleo Fund has invested US$27.4 million in community
development initiatives across a range of areas including education, health, water and
Sanitation, infrastructure, and livelihoods. The following sections describe three of the largest
Maendeleo Fund projects in more detail.
Infrastructure: Infrastructure social investments were the largest single area of Maendeleo
Fund spending in Tanzania in 2014, at nearly US$2.6million.
During 2014, Acacia supported road maintenance in 6 villages in North Mara. In the Buzwagi
area, Acacia also carried out a Kahama roads project and invested in a community alternative
road project.
Education: Education social investments were the second largest single area of Maendeleo
Fund spending in Tanzania in 2014, at nearly US$2.5 million.
During 2014, Acacia supported infrastructure upgrades in schools within Bulyanhulu, North
Mara, Buzwagi and Tulawaka. This included construction and renovations of dormitories,
classrooms, laboratories, teacher houses and libraries. Acacia also participated regionally and
nationally in the CAN EDUCATE program and supported scholarships and sponsorships in
North Mara.
Water: Ensuring clean, safe water, quality, and access has been another area of emphasis in
Acacia’s social investment spending in Tanzania. Access to potable water is particularly
challenging in rural Tanzanian communities.
Acacia is focused on ensuring that communities around its mine sites have access to clean
water and safe drinking water. One example of Acacia’s work in this area is the Community pipe
water supply project and water boreholes program.
The impacts of social investments are difficult to quantify. While the direct contributions of
spending on water infrastructure—payments to construction workers and materials suppliers, for
instance—have estimable impacts that are reflected in the economic impact estimates, there
are also a variety of positive externalities created by Acacia’s social investment spending. The
improved education that a Tanzanian child receives may not be reflected in the Tanzanian
economy for many years. Likewise, it is difficult to determine the number of Tanzanians who can
now make homes in areas of Mara that have newfound access to fresh water. Acacia’s social
investment spending and other metrics provide the best indicators of benefits in the short term.
Quantifying the impact of social investments requires follow-up studies and the collection of
social baselines. This analysis does not attempt to quantify the socioeconomic and health
outcomes of Acacia’s social investments.

Acacia Mining’s total economic and tax contributions in Tanzania, 2014
EY | 23
6. Study limitations
Readers should be aware of several limitations of this analysis.
► Assumptions underlying key multiplier model inputs. The direct economic and tax
contributions reflect 2014 client data. Two key inputs to the multiplier analysis have been
held constant from the analysis of Acacia’s 2012 economic and tax contributions in
Tanzania: 1) economic input-output data for Tanzania and 2) Acacia’s industry distribution of
supplier purchases. Changes to the ratio of taxes paid to personal income would cause
proportionate changes in the estimates of taxes paid by Acacia employees, indirect taxes,
and induced taxes.
The 2012 aggregate supplier spending information provided by Acacia was, in some cases,
disaggregated into purchases from specific industries using the industry average
composition of mining industry inputs from the GTAP model. The distribution of input
purchases and import percentages by industry used in this analysis were based on 2012
information provided by Acacia and industry averages for the mining sector in the GTAP
model. Significant changes to Acacia’s distribution of supplier purchases would result in a
different industry distribution of indirect and induced employment, labor income, and value
added (GDP), depending on the labour- or capital-intensity of the supplier industry.
► Tanzania input-output model. This analysis relies on GTAP's 2007 SAM of the Tanzanian
economy, which is a product of the broader “Africa 2” database that models economies and
international trade flows in Africa and the rest of the world. The documentation underlying
GTAP economic modeling and the variety of studies based on GTAP information—including
the NGGL Ghana gold mining study that is comparable in scope and subject matter to this
analysis—suggest that the 2007 Tanzania data provide a strong foundation for this analysis.
Certain elements of the GTAP 2007 matrix are based on the Tanzanian 1992 input-output
table (the most recent comprehensive input-output matrix that was constructed from survey
data and published by the Tanzania NBS). This matrix has been extrapolated to 2007 using
2007 national accounts data.
► Supplier purchases from foreign-owned businesses operating in Tanzania. Acacia’s
supplier purchases in Tanzania include purchases from foreign businesses operating in
Tanzania. If these suppliers are simply domestic wholesalers of equipment that was
manufactured abroad, the indirect impact would be overstated for those suppliers because
the manufacturing activity did not occur in Tanzania.
► Classification of Acacia’s on-site contractors. Based on information provided by Acacia,
contractors working on-site for Tanzanian entities are mostly employed by separate supplier
firms, in roles not generally filled by direct Acacia employees. Because these workers are
employees of a service firm and not employed by Acacia as individuals working as
independent contractors, Acacia’s expenditures on service contracts are classified as non-
labour input purchases and not employee costs. As a result, the contractor employees are
captured within the indirect job estimate. The multiplier model is sensitive to the transfer of

Acacia Mining’s total economic and tax contributions in Tanzania, 2014
EY | 24
jobs between Acacia employees and contracted workers. Replacing Acacia employees with
contractors to complete the same work would increase the economic multipliers, shifting
jobs from direct to indirect, while reducing reliance on contractors would decrease the
economic multipliers (shifting jobs from indirect to direct). However, the total contribution
levels would be the same under either scenario.
► Formal versus informal economic sector activity. Employment data in Tanzania reflects
several types of employment, including formal wage and salary employees, self-employed
proprietors, unpaid family helpers, and subsistence farmers (or “traditional agriculture”). The
estimated employment multipliers are sensitive to the definition of employment. The primary
employment results presented in this analysis reflect only wage and salary employment but
if other types of employment are considered, the estimated employment impacts are larger
than those shown in this analysis.
► Residency assumption. The estimated induced contributions and tax impacts assume that
all employees of Acacia’s Tanzania operations live in Tanzania. This assumption means that
all labour income is saved or spent within the country (accounting for imports), and is fully
taxable within Tanzania.

Acacia Mining’s total economic and tax contributions in Tanzania, 2014
EY | 25
7. Conclusion
This report analyzes the total economic and tax contributions of Acacia’s operations and
investment activities in Tanzania during 2014. The report provides a snapshot of the economic
activity created by Acacia in terms of GDP, labour income, and employment. Because of the
size of Acacia’s Tanzanian operations and the importance of the mining sector to Tanzania’s
economy, the estimated contributions are substantial, with estimated total direct, indirect and
induced GDP equivalent to approximately 2% of Tanzania’s overall GDP in 2014.
This report finds that Acacia’s total economic contribution included nearly US$680 million of
GDP, of which approximately US$460 million was labour income earned by nearly 77,000 wage
employees and self-employed individuals. If Acacia’s Tanzanian entities continue to operate at
2014 levels in Tanzania, much of this economic activity would be anticipated to occur annually,
as recurring operating input purchases and capital investment spending comprised 92% of
Acacia’s total procurement spending during 2014.
During 2014, Acacia’s Tanzanian entities paid a total of US$65 million in Tanzanian taxes, with
Acacia employees paying an additional US$53 million on their incomes, purchases, and
property. Indirect and induced economic activity from Acacia’s operations resulted in an
estimated US$61 million in taxes. Acacia’s total government revenue contribution per employee
in 2014 was 20 times higher than the national average. Per employee, Acacia paid nearly
US$14,700 of direct taxes and royalties, compared to approximately US$700 per worker
economy-wide.
In 2014, Acacia’s social investments in Tanzania through its Maendeleo Fund totaled US$8.5
million, supporting a variety of education, infrastructure and water and sanitation initiatives,
primarily in the communities surrounding Acacia’s mines and throughout the Lake Zone of
Tanzania. The Maendeleo Fund concentrates on community development through the
construction of medical facilities, increased access to potable water, improved schools, and
other infrastructure and programming initiatives. Beyond its Maendeleo Fund spending, Acacia
made additional social investments of US$2.4 million, bringing its total social investment
spending in Tanzania in 2014 to US$10.9 million. This spending provides both one-time and
long-term benefits to the residents of these communities.
Acacia Mining’s total economic and tax contributions in Tanzania, 2014
EY | 26
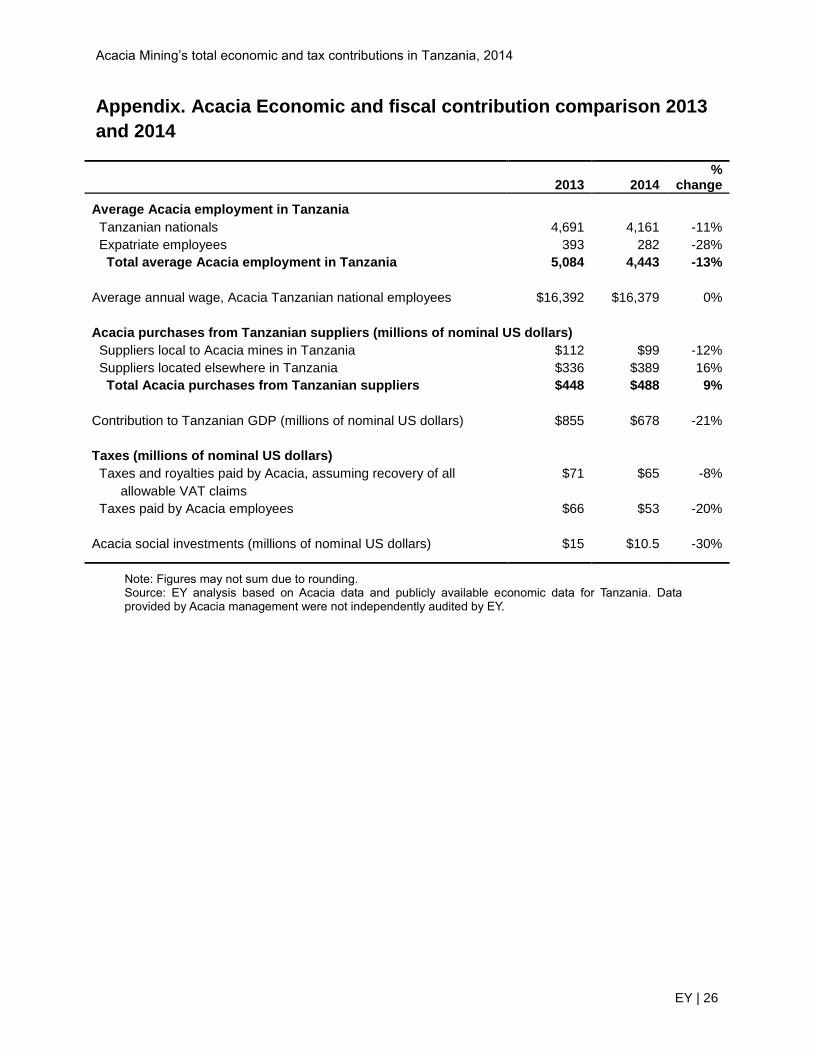
Appendix. Acacia Economic and fiscal contribution comparison 2013
and 2014
Note: Figures may not sum due to rounding. Source: EY analysis based on Acacia data and publicly available economic data for Tanzania. Data provided by Acacia management were not independently audited by EY.
2013 2014
% change
Average Acacia employment in Tanzania
Tanzanian nationals 4,691 4,161 -11%
Expatriate employees 393 282 -28%
Total average Acacia employment in Tanzania 5,084 4,443 -13%
Average annual wage, Acacia Tanzanian national employees $16,392 $16,379 0%
Acacia purchases from Tanzanian suppliers (millions of nominal US dollars)
Suppliers local to Acacia mines in Tanzania $112 $99 -12%
Suppliers located elsewhere in Tanzania $336 $389 16%
Total Acacia purchases from Tanzanian suppliers $448 $488 9%
Contribution to Tanzanian GDP (millions of nominal US dollars) $855 $678 -21%
Taxes (millions of nominal US dollars)
Taxes and royalties paid by Acacia, assuming recovery of all
allowable VAT claims
$71 $65 -8%
Taxes paid by Acacia employees $66 $53 -20%
Acacia social investments (millions of nominal US dollars) $15 $10.5 -30%

Acacia Mining’s total economic and tax contributions in Tanzania, 2014
EY | 27
References
“A Golden Opportunity?: How Tanzania is Failing to Benefit from Gold Mining.” Curtis, Mark and Tandu
Lissu. Commissioned by Christian Council of Tanzania (CCT), et al. 2009.“GTAP Data Bases: GTAP
Africa 2 Data Base.” May 31, 2013. https://www.gtap.agecon.purdue.edu/
databases/Africa/v2/default.asp.
Kapstein, Ethan and Rene Kim. "The Socioeconomic impact of Newmont Ghana Gold Limited."
Sponsored by Newmont Ghana Gold Limited. Prepared by Steward Redqueen. June 2011.
http://www.newmont.com/sites/default/files/Socio_Economic_Impact_of_Newmont_Ghana_Gold_July
_2011_0.pdf?bcsi_scan_7f73a9d1b05f4e20=jOfagWWqRO82y98WXEQ8QrxWvHckAAAAvfVLhQ==&
bcsi_scan_filename=Socio_Economic_Impact_of_Newmont_Ghana_Gold_July_2011_0.pdf.
“Tanzania Investment Benefits Study.” United Republic of Tanzania Ministry of Energy and Minerals.
Prepared by Oxford Policy Management. September 2011.
http://www.opml.co.uk/sites/opml/files/Investment%20Benefits%20Report%20for%20MEM.pdf.
Thurlow, James and Peter Wobst. “Poverty-Focused Social Accounting Matrices for Tanzania.”
International Food Policy Research Institute. March 2003.
http://www.ifpri.org/sites/default/files/publications/tmdp30.pdf.
Wobst, Peter. “A 1992 Social Accounting Matrix (SAM) for Tanzania.” International Food Policy Research
Institute. August 1998. http://www.ifpri.org/sites/default/files/publications/tmdp30.pdf.
“World Development Indicators.” The World Bank. 2013. http://data.worldbank.org/.

Acacia Mining’s total economic and tax contributions in Tanzania, 2014
EY | 28
Endnotes
1 Further to the approval of shareholders at its General Meeting held on 26 November 2014, African Barrick Gold plc
changed its name to Acacia Mining plc (LSE: ACA) with immediate effect. Trading in shares under the new name Acacia Mining plc started at the commencement of trading on 27 November 2014. The Company's International Securities Identification Number remains unchanged. 2 In this study, all employment figures are reported as total headcount, not as full-time equivalents (FTEs).
3 Tanzania Minerals Audit Agency
4 2014 Tanzania GDP data by industry are not yet available.
5 Tulawaka is owned as part of a joint venture with MDN Inc. in which Acacia has a 70% stake.
6 “Tanzania Economic Condition” National Bureau of Statistics Tanzania see p.12
7 “Tanzania Economic Condition” , National Bureau of Statistics Tanzania see p.197
8 Thurlow, James and Peter Wobst. “Poverty-Focused Social Accounting Matrices for Tanzania.” International Food
Policy Research Institute. March 2003. See p.i. 9 Kapstein, Ethan and Rene Kim. "The Socioeconomic impact of Newmont Ghana Gold Limited." Sponsored by
Newmont Ghana Gold Limited. Prepared by Steward Redqueen. June 2011. See p.31-32. 10
Kapstein, Ethan and Rene Kim. "The Socioeconomic impact of Newmont Ghana Gold Limited." Sponsored by Newmont Ghana Gold Limited. Prepared by Steward Redqueen. June 2011. See p.31-32. 11
The average wage of $16,400 for Tanzanians employed by Acacia in 2013 is includes take-home pay as well as payroll and income taxes paid by the employee (i.e. gross wages). For economy-wide Tanzania wage information, see p.82 of “2006 Integrated Labour Force Survey.” Tanzania National Bureau of Statistics. 12
“Employment and earnings survey: Analytical Report 2007.” Tanzania National Bureau of Statistics. November 2012. See p.1-2. 13
See: “Tanzania Investment Benefits Study.” United Republic of Tanzania Ministry of Energy and Minerals. Prepared by Oxford Policy Management. September 2011 and “A Golden Opportunity?: How Tanzania is Failing to Benefit from Gold Mining.” Curtis, Mark and Tandu Lissu. Commissioned by Christian Council of Tanzania (CCT), et al. 2009. 14
Acacia invested $4,438,000 in education initiatives in 2013. See Table 5. 15
See “Tanzania Investment Benefits Study”, p.54. 16
Employment data provided by Acacia 17
“2006 Integrated Labour Force Survey.” Tanzania National Bureau of Statistics. See p.82. Value is inflated to nominal 2014 terms using the Tanzania inflation rate. 18
See “Tanzania Investment Benefits Study”, p.59. 19
EY analysis based on Tanzania Revenue Authority data.