academic services office of field experiences annual ... more professional dispositions, the office...
TRANSCRIPT

Academic Services
Office of Field Experiences
Annual Report
2014-2015

PURDUE UNIVERSITY
COLLEGE OF EDUCATION
Academic Services
Office of Field Experiences
Annual Report
July 1, 2014 through June 30, 2015
Staff
Jim Gilligan – Assistant Director
Ed Wiercioch – Early Field Experiences Placement Coordinator
Dorothy Reed – Asst. Dean for Engagement
Report Written By Jennifer Barce and Ed Wiercioch

Office of Field Experiences
2014-2015 Annual Report
Overview
As part of the College of Education's Academic Services team, the Office of Field
Experiences arranges and coordinates clinical placements-early field experiences, student
teaching placements, student teaching internships, and graduate externships-for preservice
teachers in approximately 20 Teacher Education programs in the Colleges of Education,
Agriculture, Health and Human Sciences, Liberal Arts, Science, and Technology. Collaboration
with academic advisers, faculty, staff, university supervisors, P-12 educators and
administrators, curriculum directors, assistant superintendents, and superintendents is
essential to our success.
In an effort to provide more effective preparation for our preservice teachers and to foster in
them more professional dispositions, the Office of Field Experiences continued to provide the
following services.
In collaboration with the Office of Professional Preparation and Licensure, we
presented a comprehensive, 60-minute Teacher Education Orientation program to all
students enrolled in the four foundational Teacher Education courses.
We administered the approved Teacher Education Criminal Background Check policy,
which requires all students who enroll in a Teacher Education Program to complete an
annual extended criminal background check through a third-party vendor. This policy
was developed with the assistance of our P-12 partners.
To more effectively accommodate the needs of preservice teachers with documented
disabilities, we maintained-in conjunction with the staff of the Disability Resource
Center-a protocol for case conferences that bring together OFE staff, DRC staff,
program area faculty and staff, and the student to design an Accommodations
Memorandum that can be shared with a prospective cooperating teacher in order to
facilitate a successful student teaching placement.
Furthermore, the Office of Field Experiences continues to play an important role supporting the
development and implementation of Co-Teaching Models of Student Teaching in program
areas that have adopted (elementary) or are in the process of piloting (Agriculture, FACS) such
a model.
This report documents the work accomplished during the 2014-2015 academic year.
Table of Contents
Executive Summary……………………………………………………………………………………………........1
I. Early Field Experience
A. Introduction to Early Field Experience…………………………………………………………..3
B. Early Field Experience Placements (TCV-Corps) 2014-2015………………………….……..…4
C. Early Field Experience Placements (Non-TCV Corps) 2014-2015….…………....…………..…6
D. Diversity of Early Field Experience Placements 2014-2015………………………………….....8
E. EDCI 205 Student Appraisal Information 2014-2015………………………………………….10
F. EDPS 265 Student Appraisal Information 2014-2015………………………………………….11
1. EDPS 265 Student Appraisal Forms 2014-2015…………………………………………..12
II. Tuition Credit Voucher Program……………………………………………….……………….......14
III. Student Teaching Placement Statistics and Trends………………………………………………....16
A. Fall 2014 - Spring 2015 Placements by Program Area (Tables)……………………………….17
B. Fall 2014 - Spring 2015 Supervisor Data (Rank and Load) by Semester (Table)……………...18
C. Student Teaching Weeks and Clock Hours by Program Area…………………………….........20
IV. Student Teaching Placements………………………………………………………………………..21
A. Fall 2014 and Spring 2015 Placements by County, Corporation and Program…………...........22
V. Appendix: Demographic Data (Diversity Information) by School Corporation from the Indiana
DOE…………………………………………………………………………………………………23
Office of Field Experiences Annual Report 2014-2015
Executive Summary
Early Field Experiences
The Teacher Education Program partnered with 45 corporations (including four study abroad
options) and 94 schools in 2014-2015 for early field experience courses. The number of early
field experience placements decreased for the 7th consecutive year. The 1579 placements for the
2014-2015 academic year indicate a 2% decrease when compared to the previous year.
Enrollment in many program areas declined or was about the same during this time period. Many
principals who hosted early field placements were impressed with the quality of the Purdue
students who were placed in their school and wanted to continue the collaboration. They
appreciated the communication from Purdue regarding the placements and felt that the early field
placements were very beneficial to the teachers in their schools. The teachers were appreciative of
the opportunity to have some extra help in the classroom. Many teachers were impressed with the
students' professionalism, effort, and the creativity of the lessons the students taught.
Tuition Credit Voucher Program
The College of Education awarded 117 vouchers for the 2014-2015 academic year. This was a
decrease of 39 from the previous year. This is the 6th year in a row for the decrease. Enrollment
in Teacher Education continues to decline.
Student Teaching Placement Statistics and Trends
During the 2014-2015 academic year, the Office of Field Experiences sought and confirmed a total
of 309 student teaching placements; this number represents a decline of placements compared to
the 348 placements confirmed for the previous academic year (2013-2014).
1

Office of Field Experiences Annual Report 2014-2015
Executive Summary
The Office of Field Experiences urges the faculty and administration within the College of
Education and within all Teacher Education programs at Purdue to continue to develop
strategies and models that will facilitate our ability to continue to successfully secure student
teaching placements for all qualified preservice candidates. Our existing partnerships with
Chicago Public Schools and the Indiana Rural School Network; the College of Education's
new Strategic Partnership with Community Schools of Frankfort; and the prospect of
developing partnerships that will offer our teacher candidates the opportunity to student
teach abroad diversify the options available to our students. We are hopeful that these
programs and other innovative measures will produce increased enrollment in Teacher
Education programs so that we may meet the needs of Indiana's students not only in the
STEM disciplines but in all academic areas.
IV. Student Teaching Placements
For each semester of the 2014-2015 academic year, the highest percentage of student
teaching placements was arranged in schools and school corporations within Tippecanoe
County and in the seven counties surrounding Tippecanoe County. Thus, local placements
amounted to well over half of all placements in each semester. The remaining student
teaching placements occurred throughout the state of Indiana, as illustrated on the included
chart, which indicates the number of Early Field placements and student teaching
placements in each Indiana County for the 2014--2015 academic year.
V. Appendix: Demographic Data
This table includes demographic data regarding the racial, ethnic, and socio-economic
diversity of the schools where our preservice candidates completed their student teaching
placements and early field experiences. This data were collected from the Indiana Department
of Education website.
2
Introduction to Early Field Experiences
The Teacher Education Program partnered with 46 corporations (including four study abroad
options) and 91 schools in 2014-2015 for early field experience courses. Students are
placed in a wide range of corporations and schools for their early field experience placements
for varied lengths of time. The number of early field experience placements decreased for
the 7th consecutive year. The 1579 placements for the 2014-2015 academic year indicate a 2%
decrease from the previous year.
During each semester Ed Wiercioch communicates with administrators of the local schools to
coordinate the placements. He met with 37 administrators in local schools in 2015 to get input
on the progress of the field placements and to plan for the future years. Nearly every principal
was pleased with the Purdue students and all wanted to continue the collaboration. Many
noted that they were impressed with the quality of the students who were placed in their
school. They were pleased with the communication from Purdue regarding the placements and
felt that the early field placements were very beneficial to the teachers in their schools. The
teachers were appreciative of the opportunity to have some extra help in the classroom. Many
teachers were impressed with the students' professionalism, effort, and the creativity of the
lessons the students taught.
Once again, Ed Wiercioch was the school liaison for all of the EDCI 205 students. He
communicated with all host teachers on a regular basis to help ensure that the students
were progressing. Beginning in 2014 teachers signed up to host students (for EDCI 205 &
EDPS 265) via a Qualtrics survey. A group of teachers and principals reviewed this survey and
provided input before it was finalized. More than 80% of teachers preferred this method rather
thane-mailing an attachment. A Qualtrics survey for EDCI 205 was also created for the
Appraisal Forms that teacher's complete to assess student's classroom performance. A group
of teachers and principals also provided input to this Qualtrics survey before it was finalized.
Many teachers made positive comments regarding the Qualtrics surveys.
For the 11th year, host school administrators conducted an orientation for the EDCI 205 and
EDPS 265 students prior to their classroom visits.
The matrix on the succeeding pages indicates the host schools for the different courses for the
2014-2015 academic years. It shows the total number of placements for each course at each
school as well as the total placements for each school and corporation. The succeeding
information is divided into tuition credit voucher corporations and non-tuition credit voucher
corporations.
3

ED
CI
205
ED
PS
265
Blo
ck 3
Blo
ck 4
Blo
ck 5
ED
CI
422
ED
CI
424
ED
CI
425
ED
CI
426
ED
CI
428
ED
CI
429
ED
CI
432
ED
CI
433
ED
CI
434
ED
CI
444
ED
CI
532
ED
PS
461
ED
PS
610
ED
PS
695
HD
FS
405
HD
FS
406
HD
FS
408
HD
FS
409
IT 4
71
IT 4
72
To
tals
Benton Comm SC 25
Otterbein Elem 5 1 1 7
Benton Central Jr-Sr HS 15 1 2 18
Clinton Prairie SC 2
Clinton Prairie Jr-Sr HS 1 1 2
Comm Schs of Frank 44
Suncrest Elem 39 39
Frankfort HS 1 1 1 2 5
Delphi Comm SC 87
Delphi Elem 82 82
Delphi MS 1 1
Delphi HS 4 4
Diocese of Laf Cath 31
St. Lawrence Elem 22 22
St. Mary's 4 4 8
Central Cath Jr-Sr HS 1 1
Frontier SC 15
Frontier Elem 9 9
Frontier Jr-Sr HS 2 2 1 1 6
Lafayette SC 471
Linnwood Pre School 1 7 7 15
Earhart Elem 42 42
Edgelea Elem 2 2 4
Glen Acres Elem 30 20 50
Miami Elem 17 2 19
Miller Elem 40 2 42
Murdock Elem 5 5 10
Vinton Elem 78 1 79
Laf Sunnyside MS 44 2 4 2 52
Laf Tecumseh Jr HS 45 2 1 2 1 1 2 2 56
Jefferson HS 58 4 12 4 1 2 1 2 3 1 1 2 91
Oakland HS 4 6 1 11
Early Field Experience Placements TCV Corps 2014-2015
4

ED
CI
20
5
ED
PS
26
5
Blo
ck
3
Blo
ck
4
Blo
ck
5
ED
CI
42
1
ED
CI
42
2
ED
CI
42
4
ED
CI
42
5
ED
CI
42
6
ED
CI
42
8
ED
CI
42
9
ED
CI
43
2
ED
CI
43
3
ED
CI
43
4
ED
CI
44
4
ED
CI
53
2
ED
PS
46
1
ED
PS
69
5
HD
FS
40
5
HD
FS
40
8
IT 4
71
IT 4
72
To
tals
MSD Warren County 37
Pine Village Elem 28 28
Seeger Jr-Sr HS 2 1 1 2 3 9
New Community SC 76
New Community School 36 40 76
North Mont Comm SC 7
Northridge MS 1 1
North Montgomery HS 4 1 1 6
North White SC 38
North White Primary 31 31
North White Intermediate 7 7
Rossville Cons SD 8
Rossville HS 4 1 1 1 1 8
Tippecanoe SC 488
Battle Ground Elem 62 62
Burnett Creek Elem 62 2 64
Cole Elem 12 12
Hershey Elem 12 12
Klondike Elem 39 2 41
Mintonye Elem 37 37
Wea Ridge Elem 25 32 57
Woodland Elem 11 1 12
Wyandotte Elem 1 1 1 3
Battle Ground MS 7 2 2 1 12
East Tipp MS 1 1 1 3
Klondike MS 9 1 1 1 1 2 15
Middle Academy North 4 4
Southwestern MS 15 1 1 1 1 19
Wainwright MS 1 1 2
Wea Ridge MS 11 1 1 1 2 1 1 1 19
Harrison HS 37 4 1 1 1 1 3 2 4 2 56
McCutcheon HS 40 1 4 3 1 2 3 4 58
West Lafayette Comm SC 108
Cumberland Elem 46 1 47
Happy Hollow Elem 36 2 38
West Lafayette Jr-Sr HS 13 1 1 2 1 1 1 1 1 1 23
Early Field Experience Placements TCV Corps 2014-2015
5

Early Field Experience Placements Non TCV Corps 2014-2015
ED
CI 205
ED
CI 422
ED
CI 426
ED
CI 432
ED
CI 433
ED
CI 434
ED
CI 444
ED
PS
695
HD
FS
40
6
HD
FS
40
9
To
tals
Attica SC 1
Attica Jr-Sr HS 1 1
Brownsburg Com SC 2
Brownsburg East MS 1 1
Brownsburg HS 1 1
Carroll Consolidated SC 1
Carroll Jr-Sr HS 1 1
Chicago Public Schs 18
McAuliffe Elem 9 9
Kelvyn Park HS 9 9
Clinton Central SC 2
Clinton Central Jr-Sr HS 2 2
Crawforsville Comm Schs 5
Crawfordsville MS 1 2 3
Crawforsville HS 1 1 2
Danville Comm SC 1
Danville HS 1 1
Hamilton Southeastern Schs 1
Hamilton Southeastern HS 1 1
Indianapolis Public Schs 1
Crispus Attucks Medical Magnet 1 1
Lafayette Christian School 4
Lafayette Christian School 2 2 4
LaPorte Comm SC 1
LaPorte HS 1 1
Lebanon Comm SC 2
Lebanon HS 2 2
MSD of New Durham Township 1
Westville HS 1 1
MSD Pike Township 1
Pike HS 1 1
Northwestern Cons SC 1
Triton Central HS 1 16
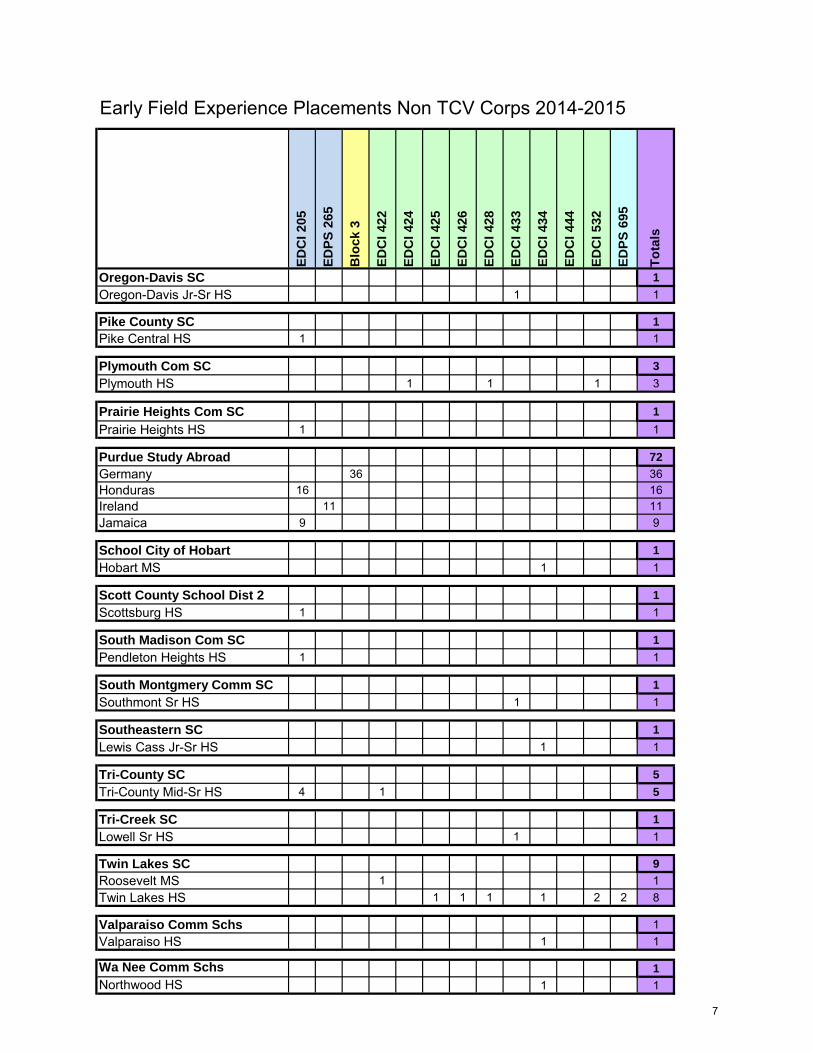
Early Field Experience Placements Non TCV Corps 2014-2015
ED
CI
20
5
ED
PS
26
5
Blo
ck
3
ED
CI
42
2
ED
CI
42
4
ED
CI
42
5
ED
CI
42
6
ED
CI
42
8
ED
CI
43
3
ED
CI
43
4
ED
CI
44
4
ED
CI
53
2
ED
PS
69
5
To
tals
Oregon-Davis SC 1
Oregon-Davis Jr-Sr HS 1 1
Pike County SC 1
Pike Central HS 1 1
Plymouth Com SC 3
Plymouth HS 1 1 1 3
Prairie Heights Com SC 1
Prairie Heights HS 1 1
Purdue Study Abroad 72
Germany 36 36
Honduras 16 16
Ireland 11 11
Jamaica 9 9
School City of Hobart 1
Hobart MS 1 1
Scott County School Dist 2 1
Scottsburg HS 1 1
South Madison Com SC 1
Pendleton Heights HS 1 1
South Montgmery Comm SC 1
Southmont Sr HS 1 1
Southeastern SC 1
Lewis Cass Jr-Sr HS 1 1
Tri-County SC 5
Tri-County Mid-Sr HS 4 1 5
Tri-Creek SC 1
Lowell Sr HS 1 1
Twin Lakes SC 9
Roosevelt MS 1 1
Twin Lakes HS 1 1 1 1 2 2 8
Valparaiso Comm Schs 1
Valparaiso HS 1 1
Wa Nee Comm Schs 1
Northwood HS 1 1
7

The Diversity of Early Field Experience Placements 2014-2015
The Office of Field Experiences makes a concerted effort to place students in diverse settings for
their Early Field Experiences. All students in the Teacher Education program are required to
complete 4 foundational courses including EDCI 205 and EDPS 265 before progressing to methods
courses. Placements for EDCI 205 (Exploring Teaching as a Career) are sought in schools that
are racially and socio-economically diverse.
There are study abroad options for students enrolled in EDCI 205, EDPS 265 and Block III. A
total of 54 students chose to participate in these study abroad options for the 2014-2015
academic year. This is an increase of 12 students from the previous year. The Study Abroad options
were at the following countries: Honduras or Jamaica (EDCI 205), Ireland (EDPS 265) and
Germany (Block III). Students who were enrolled in Block III had an experience overseas as well
as a local placement.
Sixteen EDCI 205 students took part in the Honduras study abroad option in 2014, and nine
students participated in the Jamaica study abroad course. Another unique EDCI 205 option is for
students to visit a school in Chicago for two days and spend a third day immersed in Chicago
culture. Eighteen students took advantage of this option.
Students in EDCI 205 typically visit a school site for two hours once a week for 8 weeks for the
Theory into Practice (TIP) component of the course. For the 2014-2015 academic year EDCI
205 students were placed in21 different schools. In2014-2015 approximately 58% of EDCI 205
students were placed at a school with more than 43% minority students. With regards to socio
economic status, 58% of students were placed at a school with a student population of which at
least 61% who qualified for free/reduced lunch.
EDPS 265 students are required to visit a school site for two hours once a week for 8 weeks for the
TIP component of the course. Students in this course can choose to complete a full day option
with five two hour visits, instead of the 8 weekly visits. The EDPS 265 schools are all different
from EDCI 205 schools. A sincere attempt is made to place these students in a different grade
level from their EDCI 205 placement. Elementary students are placed in varying grade levels
between EDCI 205 and EDPS 265. Secondary students are usually placed at grades 6-8 for one of
the courses and 9-12 for the other course. Physical Education and Art students are certified K-12
so the placements alternate between the elementary, middle school and high school. Students who
are enrolled in the dual licensure program (Elementary/Special Education) are generally placed in
a secondary special education setting for this course, since they will be placed in an elementary
school for blocks III-V. For the 2014-2015 academic years EDPS 265 students were placed in 19
different schools. Approximately 45% of these students were placed at a school with a minimum
of 22% minority population. Regarding socio-economic status, 71% of the EDPS 265 students
were placed at a school with a population in which at least 32% of the students qualified for
free/reduced lunch. Eleven students chose the study abroad EDPS 265 option in Ireland in 2014.
8

Literacy and Social Studies methods comprise Block III, which are the first two methods courses
for elementary education students. These students spend four hours per week in a local school for
2 weeks for this block. The Block III students in 2014-2015 were placed in 6 different schools.
The 18 students who completed a Block III study abroad in Germany spent some time in a local
school setting before their overseas experience. Approximately 40% of Block III students were
placed at a school with a minimum of 39% minority students. With regards to socio economic
status, 72% of students were placed at a school with a population where at least 41% of the
students qualified for free/reduced lunch.
Block IV encompasses two methods courses for elementary education students: Literacy in the
Elementary School II and Creating & Managing a Learning Environment. The students typically
are in local classroom for four hours per week for 12 weeks for these courses. In 2014- 2015
Block IV was hosted by three schools. Approximately 68% of Block IV students' placements were
at a school with a minimum of 49% minority students. All Schools had at least 38% minority
students. With regards to socio-economic status, 68% of the students were placed at schools where
at least 68% of the students qualified for free/reduced lunch, and all students were placed at schools
were at least 48% of the students qualified for free/reduced lunch.
Block V consisted of Math and Science methods and Teaching English as a New Language courses
for the 2014-2015 semester. The Math and Science courses have a shared TIP and are typically
placed in a school for 18 hours. Students in the Teaching English as a New Language course visit
a school site on 4 occasions for a total of 10 hours. Eight schools hosted this block.
Approximately 71% of the Block V students' placements were at schools with a minimum of 45%
minority students. More than 76% of the students were placed at schools where 72% of the
students qualified for free/reduced lunches. All schools had at least 39% of their students qualify
for free/reduced lunches.
Students enrolled in the secondary methods courses were placed in a variety of school settings
correlating with their particular field of study. The Early Field Experiences Placement
Coordinator assisted in placing students from the following areas: Engineering Technology
Teacher Education, English, Health and Physical Education, Math, Sciences and Special
Education.
9

EDCI 205 Student Appraisal Information 2014-2015
The EDCI 205 students are rated by local teachers for their performance in host teachers' classrooms.
The students were rated on a scale of 1-5 (5 =excellent, 4 = above average, 3 = average, 2 =below
average and 1 =poor) for four specific questions. The questions related to the students' observations,
assistance to the teacher, participation and reflection upon teaching as a career. The teachers continue
to assess the EDCI 205 students in high regards. More than 270 total responses were received from
the teachers during 2014-2015 academic year. The ratings from the fall 2014 semester yielded the
following averages: 4.59, 4.76, 4.30, and 4.29 respectively, with a mean overall rating of 4.48. The
ratings from the spring 2015 semester yielded the following averages: 4.54, 4.44, 4.41, and 4.21
respectively, with an overall mean rating of 4.40. The fall ratings are slightly higher than the spring
ratings. The teacher's rated the student's remarkably high in both semesters. Below is a compilation of
the aforementioned data.
All EDCI 205 Student Appraisal Forms Fall 2014
Forms Received/
Total Students
146/153 (95%)
Question #1
Observed
Question #2
Assisted
Question
#3 Participation
Question #4
Reflected
Overall
Total/
Average
# of responses 146 137 146 145 574
Average/student
4.59
4.76
4.30
4.29
4.48
All EDCI 205 Student Appraisal Forms Spring 2015
Forms Received/ Total Students
131/138 (95%)
Question #1
Observed
Question #2
Assisted
Question
#3
Participation
Question #4
Reflected
Overall Total/
Average
# of responses
131
131
131
131
524
Average/student 4.54 4.44 4.41 4.21 4.40
OFE and OPPL staff met with the EDCI 205 classes (and all students entering Teacher Education)
in August 2014 and January 2015 to provide a general overview of the Teacher Education program.
OFE focused on discussing the limited criminal history check, dispositions, field experiences and
student teaching.
10
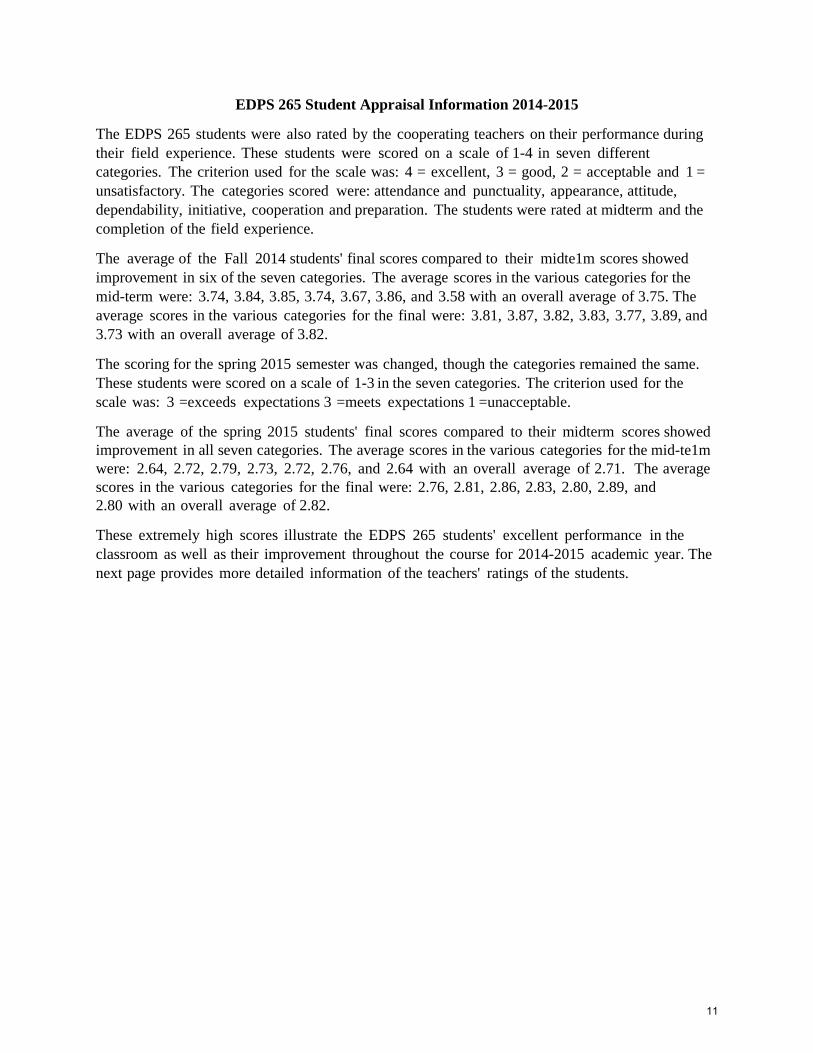
EDPS 265 Student Appraisal Information 2014-2015
The EDPS 265 students were also rated by the cooperating teachers on their performance during
their field experience. These students were scored on a scale of 1-4 in seven different
categories. The criterion used for the scale was: 4 = excellent, 3 = good, 2 = acceptable and 1 =
unsatisfactory. The categories scored were: attendance and punctuality, appearance, attitude,
dependability, initiative, cooperation and preparation. The students were rated at midterm and the
completion of the field experience.
The average of the Fall 2014 students' final scores compared to their midte1m scores showed
improvement in six of the seven categories. The average scores in the various categories for the
mid-term were: 3.74, 3.84, 3.85, 3.74, 3.67, 3.86, and 3.58 with an overall average of 3.75. The
average scores in the various categories for the final were: 3.81, 3.87, 3.82, 3.83, 3.77, 3.89, and
3.73 with an overall average of 3.82.
The scoring for the spring 2015 semester was changed, though the categories remained the same.
These students were scored on a scale of 1-3 in the seven categories. The criterion used for the
scale was: 3 =exceeds expectations 3 =meets expectations 1 =unacceptable.
The average of the spring 2015 students' final scores compared to their midterm scores showed
improvement in all seven categories. The average scores in the various categories for the mid-te1m
were: 2.64, 2.72, 2.79, 2.73, 2.72, 2.76, and 2.64 with an overall average of 2.71. The average
scores in the various categories for the final were: 2.76, 2.81, 2.86, 2.83, 2.80, 2.89, and
2.80 with an overall average of 2.82.
These extremely high scores illustrate the EDPS 265 students' excellent performance in the
classroom as well as their improvement throughout the course for 2014-2015 academic year. The
next page provides more detailed information of the teachers' ratings of the students.
11

EDPS 265 Student Appraisal Forms 2014-2015
Fall 2014
EDPS 265 Students were rated on a scale of 1-4 for seven specific questions:
Attendance and Punctuality, Appearance, Attitude, Dependability, Initiative, Cooperation and Preparation
SCALE= Excellent= 4 Good= 3 Acceptable= 2 Unsatisfactory= 1
276 Forms 97.2% of forms received
284 Placements
Attendance &
Punctuality
Appearance
Attitude
Dependability
Initiative
Cooperation
Preparation
Overall
Average
Mid Term
Average Score
3.74
3.84
3.85
3.74
3.67
3.86
3.58
3.75
Final
Average Score
3.81
3.87
3.82
3.83
3.77
3.89
3.73
3.82
Difference in
Midterm & Final
+.07
+.03
-.03
+.09
+.10
+.03
+.15
+.07
12
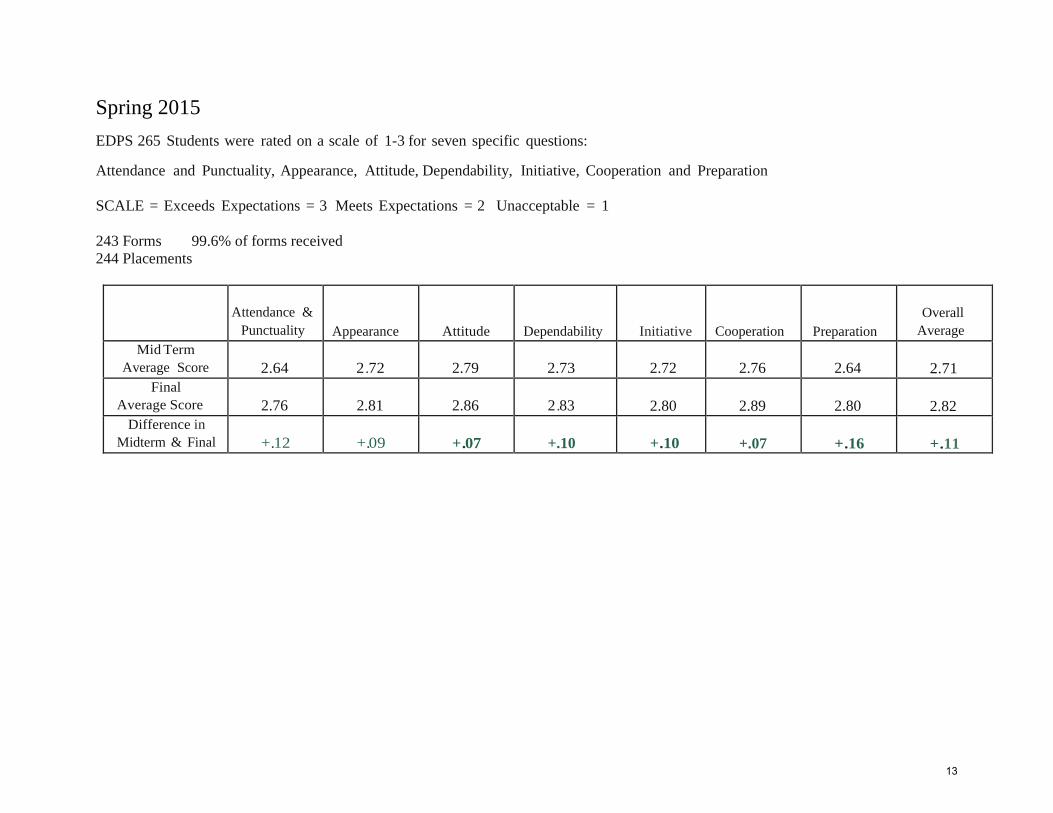
Spring 2015
EDPS 265 Students were rated on a scale of 1-3 for seven specific questions:
Attendance and Punctuality, Appearance, Attitude, Dependability, Initiative, Cooperation and Preparation
SCALE = Exceeds Expectations = 3 Meets Expectations = 2 Unacceptable = 1
243 Forms 99.6% of forms received
244 Placements
Attendance &
Punctuality
Appearance
Attitude
Dependability
Initiative
Cooperation
Preparation
Overall
Average
Mid Term
Average Score
2.64
2.72
2.79
2.73
2.72
2.76
2.64
2.71
Final
Average Score
2.76
2.81
2.86
2.83
2.80
2.89
2.80
2.82
Difference in
Midterm & Final
+.12
+.09
+.07
+.10
+.10
+.07
+.16
+.11
13

Tuition Credit Voucher Program
Introduction
The tuition credit voucher program is in its twenty-third year. It is a way of rewarding
school corporations' teachers for the mentorship they provide to Purdue students in early
field experience courses. A tuition credit voucher allows a teacher to take a class at Purdue
for free. Tuition credit vouchers are awarded annually in August to participating school
corporations. An individual tuition credit voucher is valid for two years when issued to the
respective school corporation. There are currently 15 participating school corporations.
Approved Courses
A course must meet certain field experience criteria in order to qualify as a tuition credit
voucher eligible course. Students in a specific course must visit the school for a minimum of 5
times and for a minimum of 10 hours per semester. Approval for a tuition credit voucher awarded
course is obtained through a proposal written by the Office of Field Experiences, based upon
input from the faculty member having the responsibility for the course. The Dean of the College
of Education makes the final determination of eligibility. There are approximately 35 courses
that meet this criterion, though all of the courses are not offered every semester and the field
experience component in a given course may change at times. For 2014-2015, 27 courses met
the criteria.
Formula for Rewarding Tuition Credit Vouchers
The number of tuition credit vouchers awarded to each school corporation is determined by a
specific formula. One semester hour of credit is awarded for every four placements at a particular
school. Therefore, at the end of the academic year, the number of placements at a particular
school is divided by four. This number is next divided by three, because tuition credit
vouchers are rewarded as three-credit hour vouchers. The whole number resulting from this
calculation represents the number of tuition credit vouchers awarded to a given school
corporation. The fraction left over from this final division is carried over and added to the
succeeding year's earned tuition credit vouchers.
Tuition Credit Voucher Distribution 2014-2015
The College of Education awarded 117 tuition credit vouchers for the 2014-2015 academic
year. This was a decrease of 9 from the previous year. This is the 6th year in a row that the
number of vouchers awarded has decreased. This is a reflection of the declining enrollment in
the Teacher Education programs.
The College of Education is fortunate to be able to provide this reward for cooperating
teachers. The table on the following page shows the total number of placements and tuition
credit vouchers that were distributed to each corporation for 2014-2015. In the summer of
2014 Ed Wiercioch met with 11 of the 14 local superintendents, where the corporations
earned Tuition Credit Vouchers. The purpose of these meetings was to share new information
about our Teacher Education program, to learn about specific corporation developments and
discuss ways to improve our partnerships.
14

2014-2015
School Corporation
Placements
TCV's
Earned
Carry-over
from 13-14
Total
14-15
TCV's
Earned
Tuition Credit Vouchers Earned 2014-2015
The table below indicates the total tuition credit voucher eligible placements for the 2014-2015
academic year and the number of tuition credit vouchers earned by the following participating
school corporations.
Benton Comm SC 25 2.08 0.69 2.77 2
Clinton Prairie SC 2 0.17 0.66 0.83 0
Comm Schools of Frankfort 44 3.67 0.00 3.67 3
Delphi Comm SC 87 7.25 0.14 7.39 7
Diocese of Laf Catholic 31 2.58 0.17 2.75 2
Frontier SC 15 1.25 0.16 1.41 1
Lafayette SC 471 39.25 0.24 39.49 39
MSD Warren County 37 3.08 0.20 3.28 3
New Community SC 76 6.33 0.74 7.07 7
N Montgomery Comm SC 7 0.58 0.14 0.72 0
North White SC 38 3.17 0.00 3.17 3
Rossville Cons School Dist 8 0.67 0.70 1.37 1
Tippecanoe SC 488 40.67 0.23 40.90 40
W Lafayette Comm SC 108 9.00 0.08 9.08 9
TOTALS 1437 117
15
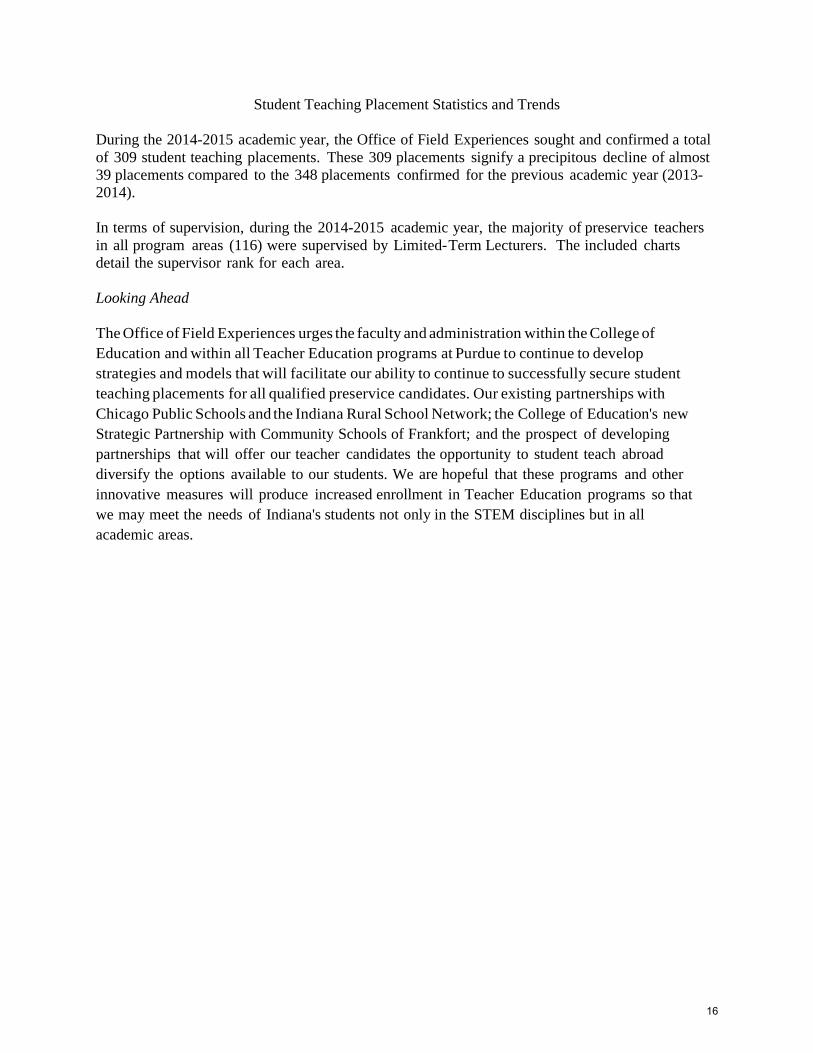
Student Teaching Placement Statistics and Trends
During the 2014-2015 academic year, the Office of Field Experiences sought and confirmed a total
of 309 student teaching placements. These 309 placements signify a precipitous decline of almost
39 placements compared to the 348 placements confirmed for the previous academic year (2013-
2014).
In terms of supervision, during the 2014-2015 academic year, the majority of preservice teachers
in all program areas (116) were supervised by Limited-Term Lecturers. The included charts
detail the supervisor rank for each area.
Looking Ahead
The Office of Field Experiences urges the faculty and administration within the College of
Education and within all Teacher Education programs at Purdue to continue to develop
strategies and models that will facilitate our ability to continue to successfully secure student
teaching placements for all qualified preservice candidates. Our existing partnerships with
Chicago Public Schools and the Indiana Rural School Network; the College of Education's new
Strategic Partnership with Community Schools of Frankfort; and the prospect of developing
partnerships that will offer our teacher candidates the opportunity to student teach abroad
diversify the options available to our students. We are hopeful that these programs and other
innovative measures will produce increased enrollment in Teacher Education programs so that
we may meet the needs of Indiana's students not only in the STEM disciplines but in all
academic areas.
16
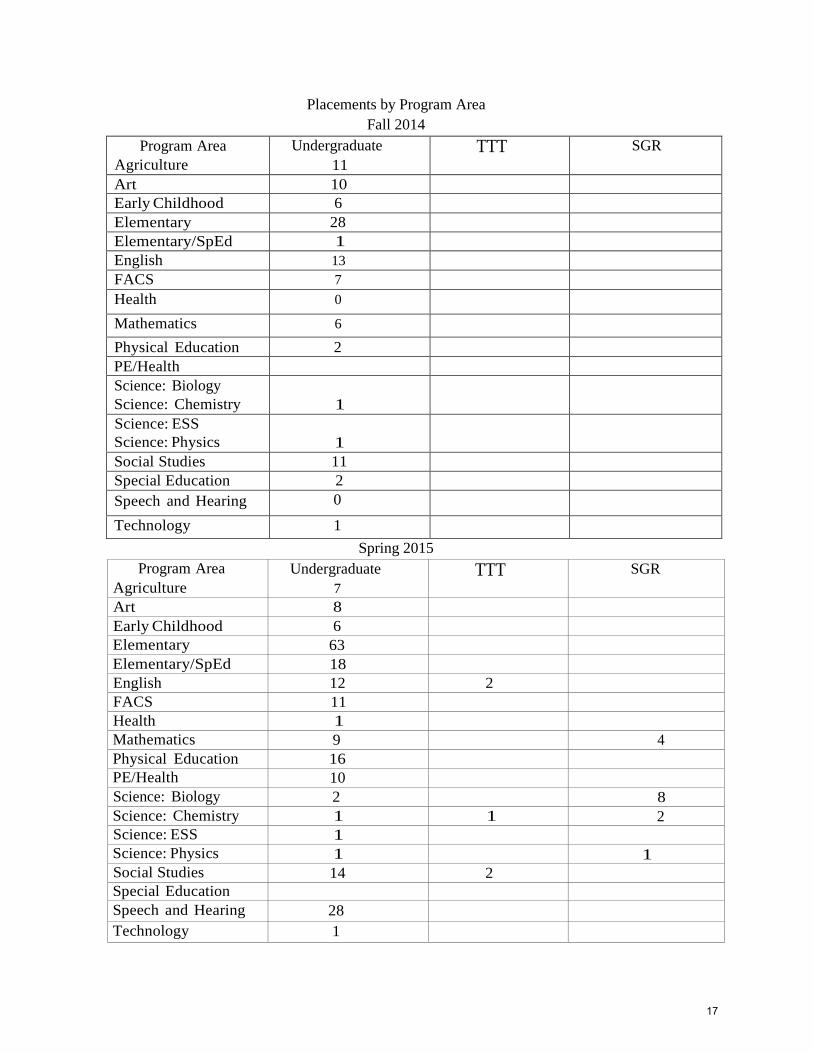
Placements by Program Area
Fall 2014
Program Area
Agriculture
Undergraduate
11
TTT SGR
Art 10
Early Childhood 6
Elementary 28
Elementary/SpEd 1
English 13
FACS
7
Health 0
Mathematics 6
Physical Education 2
PE/Health
Science: Biology
Science: Chemistry
1
Science: ESS
Science: Physics
1
Social Studies 11
Special Education 2
Speech and Hearing 0
Technology 1
Spring 2015
Program Area
Agriculture
Undergraduate
7
TTT SGR
Art 8
Early Childhood 6
Elementary 63
Elementary/SpEd 18
English 12 2
FACS 11
Health 1
Mathematics 9 4
Physical Education 16
PE/Health 10
Science: Biology 2 8
Science: Chemistry 1 1 2
Science: ESS 1
Science: Physics 1 1
Social Studies 14 2
Special Education
Speech and Hearing 28
Technology 1
17

Supervisor Rank by Number of Placements
Fall 2014
Program Area
Agriculture
Faculty
3
Limited Term
Lecturer/Adjunct
4
Graduate Student
4
Art 10
Early Childhood
Elementary
6 28
Elementary/SpEd
English
1
13
FACS 7
Health
Mathematics
1
5
Physical Education 2
PE/Health
Science: Biology
Science: Chemistry 1
Science: ESS
Science: Physics Social
Studies
1
11
Special Education
Speech and Hearing
2
Technology 1
18

Supervisor Rank by Number of Placements
Spring 2015
Program Area Faculty Limited Term
Lecturer/Adjunct
Graduate Student
Agriculture 6 1
Art 8
Early Childhood
Elementary
6 63
Elementary/SpEd
English
10
18
4
FACS 11
Health
Mathematics
1 6
7
Physical Education 16
PE/Health 10
Science: Biology
Science: Chemistry
10 2
Science: ESS 1
Science: Physics
Social Studies
2 16
Special Education
Speech and Hearing
28
Technology 1
19

Student Teaching Weeks and Clock Hours by Program Area
Program Area
Length of Student
Teaching Placement
(weeks)
Student Teaching
Clock Hours
Agriculture 12 480
Art 16 640
Early Childhood 15 600
Elementary 14 560
Engineering/Technology 16 640
English 10 400
Family & Consumer Sciences 16 640
Mathematics 10 400
Physical Education 12 480
Physical Education/Health 12 480
Science: Biology 10 400
Science: Chemistry 10 400
Science: Earth/Space Sciences 10 400
Science: Physics 10 400
Social Studies 10 400
Special Education 14 560
Speech & Hearing 10 480
Average 12.1 486.7
20
Student Teaching Placements
The tables on the following pages indicate the number of student teaching placements secured
by the Office of Field Experiences for the fall 2014 and spring 2015 semesters in each Teacher
Education Program. Placements by County shows the Early Field and Student Teaching
placements for the year.
For each semester, the most student teaching placements were arranged in schools and school
corporations within Tippecanoe County, 136 overall. Thus, local placements (defined as
placements within Tippecanoe County or the seven surrounding counties) amounted to well
over half of all placements in each semester. Of the 308 placements, 206 were in the local area.
See the Appendix of the current report for demographic data regarding the racial, ethnic, and
socio-economic diversity of the schools where our preservice candidates completed their
student teaching placements.
21

Placements by County 2014-2015
County Early Field Student Teaching Total
Allen 7 7
Benton 25 8 33
Boone 2 4 6
Carroll 88 5 93
Cass 1 1 2
Chicago Public Schs 18 5 23
Clinton 56 19 75
Decatur 2 2
Elkhart 1 1
Fountain 1 2 3
Germany 1 1
Hamilton 1 14 15
Harrison 1 1
Hendricks 3 13 16
Henry 1 1
Howard 2 2
Huntington 1 1
Jasper 1 1
Jay 1 1
Jennings 1 1
Johnson 2 2
Kosciusko 1 1
Lagrange 1 1 2
Lake 2 11 13
LaPorte 2 5 7
Madison 1 1
Marion 2 13 15
Marshall 3 4 7
Miami 1 1
Montgomery 13 14 27
Owen 2 2
Pike 1 1
Porter 1 2 3
Scott 1 1
Shelby 1 1
Starke 1 2 3
Study Abroad 72 72
Switzerland 1 1
Tippecanoe 1178 136 1314
Warren 37 4 41
Wabash 1 1
White 67 18 85
Whitley 1 1
Totals 1579 308 1887
22

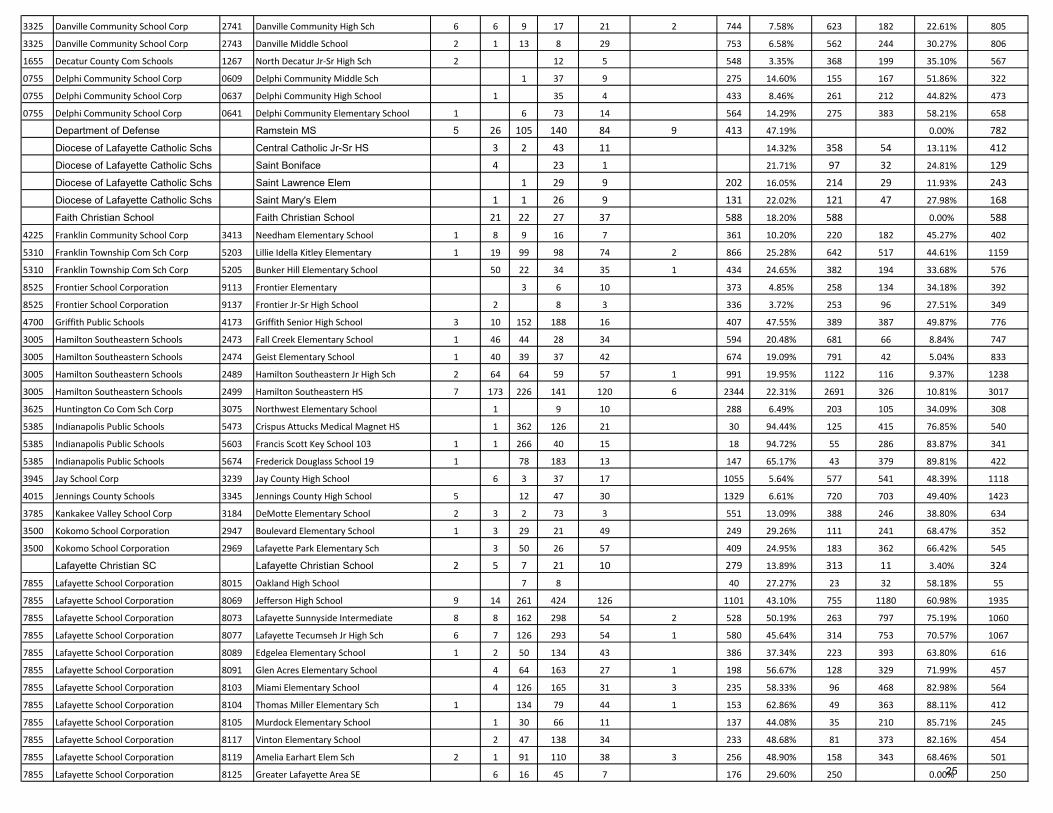
APPENDIX
Demographic Data 2014-2015
Teacher Education School Partners in Indiana
23

Corp
ID Corp Name Schl ID Schl Name
American
Indian Asian Black Hispanic Multiracial
Native Hawaiian/
Pacific Islander White % Non White
Paid
meals
Free/
Reduced
% Free/
Reduced Grand Total
Archdiocese of Indianapolis Cathedral HS 25 155 36 69 1006 21.96% 1298 0 0.00% 1298
Archdiocese of Indianapolis St. Matthews Catholic School 1 5 5 21 21 314 12.41% 362 65 15.22% 427
Archdiocese of Indianapolis St. Monica School 13 76 126 24 187 56.24% 307 118 27.76% 425
2435 Attica Consolidated Sch Corp 2053 Attica High School 2 2 8 8 342 5.52% 188 174 48.07% 362
2435 Attica Consolidated Sch Corp 2057 Attica Elementary School 2 3 15 7 433 5.87% 199 261 56.74% 460
3315 Avon Community School Corp 2726 River Birch Elementary 27 51 61 36 572 23.43% 578 169 22.62% 747
3315 Avon Community School Corp 2738 Cedar Elementary School 3 33 80 57 29 1 484 29.55% 496 191 27.80% 687
3315 Avon Community School Corp 2740 Hickory Elementary School 42 62 45 27 343 33.91% 374 145 27.94% 519
3315 Avon Community School Corp 2734 White Oak Elementary School 3 8 24 36 24 308 23.57% 288 115 28.54% 403
5380 Beech Grove City Schools 5449 Beech Grove Sr High School 2 5 53 58 43 729 18.09% 385 505 56.74% 890
0395 Benton Community School Corp 0421 Otterbein Elementary School 14 2 327 4.66% 205 138 40.23% 343
0395 Benton Community School Corp 0433 Boswell Elementary School 41 4 103 30.41% 40 108 72.97% 148
0395 Benton Community School Corp 0445 Benton Central Jr-Sr High Sch 2 4 6 68 9 1 782 10.32% 499 373 42.78% 872
0395 Benton Community School Corp 0446 Prairie Crossing Elementary Sch 1 1 7 29 17 446 10.98% 224 277 55.29% 501
5480 Bremen Public Schools 5941 Bremen Senior High School 2 4 3 93 11 385 22.69% 348 150 30.12% 498
3305 Brownsburg Community Sch Corp 2707 Brownsburg Early Childhood Center 5 15 12 11 152 22.05% 155 40 20.51% 195
3305 Brownsburg Community Sch Corp 2709 Brownsburg High School 5 56 267 94 87 3 1930 20.97% 1851 591 24.20% 2442
3305 Brownsburg Community Sch Corp 2714 Reagan Elementary 1 28 81 25 29 452 26.62% 459 157 25.49% 616
3305 Brownsburg Community Sch Corp 2720 Brownsburg East Middle School 31 145 35 43 1 780 24.64% 780 255 24.64% 1035
3455 C A Beard Memorial School Corp 2869 Knightstown High School 1 2 6 366 2.40% 243 132 35.20% 375
3060 Carmel Clay Schools 2505 Carmel High School 12 518 182 126 198 12 3782 21.70% 4321 509 10.54% 4830
3060 Carmel Clay Schools 2516 Mohawk Trails Elementary Sch 24 4 4 18 6 491 10.24% 520 27 4.94% 547
3060 Carmel Clay Schools 2518 Forest Dale Elementary School 38 25 20 58 522 21.27% 503 160 24.13% 663
3060 Carmel Clay Schools 2522 Towne Meadow Elementary Sch 1 91 31 10 44 2 518 25.68% 661 36 5.16% 697
3060 Carmel Clay Schools 2526 West Clay Elementary 137 16 10 49 2 498 30.06% 700 12 1.69% 712
0750 Carroll Consolidated Sch Corp 0621 Carroll Senior High School 6 1 10 3 323 5.83% 212 131 38.19% 343
Chicago Public Schs Belding Elem 1 30 46 297 13 8 205 65.83% 156 444 74.00% 600
Chicago Public Schs Carnegie Elem 1 576 6 4 6 98.99% 576 517 87.18% 593
Chicago Public Schs Hitch Elem 64 9 211 20 261 53.81% 177 388 68.67% 565
Chicago Public Schs Kelvyn Park HS 5 49 756 7 16 98.08% 43 790 94.84% 833
Chicago Public Schs McAuliffe Elem 38 664 9 17 97.66% 16 712 97.80% 728
Chicago Public Schs Norman A Bridge Elem 26 15 518 20 492 54.06% 224 847 79.08% 1071
4145 Clark-Pleasant Com School Corp 3421 Whiteland Community High Sch 4 101 37 60 56 1 1508 14.66% 1039 728 41.20% 1767
1150 Clinton Central School Corp 0957 Clinton Central Junior-Senior HS 3 5 5 446 2.83% 298 161 35.08% 459
1160 Clinton Prairie School Corp 0977 Clinton Prairie Jr-Sr HS 1 27 5 1 454 6.97% 322 166 34.02% 488
1160 Clinton Prairie School Corp 0981 Clinton Prairie Elem School 1 40 7 546 8.08% 327 267 44.95% 594
1170 Community Schools of Frankfort 0997 Frankfort Senior High School 3 4 319 23 482 42.00% 293 538 64.74% 831
1170 Community Schools of Frankfort 1014 Blue Ridge Primary Elementary Schl 1 2 4 270 1 229 54.83% 128 379 74.75% 507
1170 Community Schools of Frankfort 1020 Suncrest Elementary Sch 7 324 11 1 345 49.85% 116 572 83.14% 688
5855 Crawfordsville Com Schools 6277 Crawfordsville Sr High School 3 6 10 74 27 533 18.38% 306 347 53.14% 653
5855 Crawfordsville Com Schools 6281 Crawfordsville Middle School 2 8 7 87 14 420 21.93% 214 324 60.22% 538
5855 Crawfordsville Com Schools 6289 Mollie B Hoover Elem Sch 7 5 57 12 275 22.75% 121 235 66.01% 356
5855 Crawfordsville Com Schools 6293 Laura Hose Elementary School 5 10 86 4 315 25.00% 131 289 68.81% 42024
3325 Danville Community School Corp 2741 Danville Community High Sch 6 6 9 17 21 2 744 7.58% 623 182 22.61% 805
3325 Danville Community School Corp 2743 Danville Middle School 2 1 13 8 29 753 6.58% 562 244 30.27% 806
1655 Decatur County Com Schools 1267 North Decatur Jr-Sr High Sch 2 12 5 548 3.35% 368 199 35.10% 567
0755 Delphi Community School Corp 0609 Delphi Community Middle Sch 1 37 9 275 14.60% 155 167 51.86% 322
0755 Delphi Community School Corp 0637 Delphi Community High School 1 35 4 433 8.46% 261 212 44.82% 473
0755 Delphi Community School Corp 0641 Delphi Community Elementary School 1 6 73 14 564 14.29% 275 383 58.21% 658
Department of Defense Ramstein MS 5 26 105 140 84 9 413 47.19% 0.00% 782
Diocese of Lafayette Catholic Schs Central Catholic Jr-Sr HS 3 2 43 11 14.32% 358 54 13.11% 412
Diocese of Lafayette Catholic Schs Saint Boniface 4 23 1 21.71% 97 32 24.81% 129
Diocese of Lafayette Catholic Schs Saint Lawrence Elem 1 29 9 202 16.05% 214 29 11.93% 243
Diocese of Lafayette Catholic Schs Saint Mary's Elem 1 1 26 9 131 22.02% 121 47 27.98% 168
Faith Christian School Faith Christian School 21 22 27 37 588 18.20% 588 0.00% 588
4225 Franklin Community School Corp 3413 Needham Elementary School 1 8 9 16 7 361 10.20% 220 182 45.27% 402
5310 Franklin Township Com Sch Corp 5203 Lillie Idella Kitley Elementary 1 19 99 98 74 2 866 25.28% 642 517 44.61% 1159
5310 Franklin Township Com Sch Corp 5205 Bunker Hill Elementary School 50 22 34 35 1 434 24.65% 382 194 33.68% 576
8525 Frontier School Corporation 9113 Frontier Elementary 3 6 10 373 4.85% 258 134 34.18% 392
8525 Frontier School Corporation 9137 Frontier Jr-Sr High School 2 8 3 336 3.72% 253 96 27.51% 349
4700 Griffith Public Schools 4173 Griffith Senior High School 3 10 152 188 16 407 47.55% 389 387 49.87% 776
3005 Hamilton Southeastern Schools 2473 Fall Creek Elementary School 1 46 44 28 34 594 20.48% 681 66 8.84% 747
3005 Hamilton Southeastern Schools 2474 Geist Elementary School 1 40 39 37 42 674 19.09% 791 42 5.04% 833
3005 Hamilton Southeastern Schools 2489 Hamilton Southeastern Jr High Sch 2 64 64 59 57 1 991 19.95% 1122 116 9.37% 1238
3005 Hamilton Southeastern Schools 2499 Hamilton Southeastern HS 7 173 226 141 120 6 2344 22.31% 2691 326 10.81% 3017
3625 Huntington Co Com Sch Corp 3075 Northwest Elementary School 1 9 10 288 6.49% 203 105 34.09% 308
5385 Indianapolis Public Schools 5473 Crispus Attucks Medical Magnet HS 1 362 126 21 30 94.44% 125 415 76.85% 540
5385 Indianapolis Public Schools 5603 Francis Scott Key School 103 1 1 266 40 15 18 94.72% 55 286 83.87% 341
5385 Indianapolis Public Schools 5674 Frederick Douglass School 19 1 78 183 13 147 65.17% 43 379 89.81% 422
3945 Jay School Corp 3239 Jay County High School 6 3 37 17 1055 5.64% 577 541 48.39% 1118
4015 Jennings County Schools 3345 Jennings County High School 5 12 47 30 1329 6.61% 720 703 49.40% 1423
3785 Kankakee Valley School Corp 3184 DeMotte Elementary School 2 3 2 73 3 551 13.09% 388 246 38.80% 634
3500 Kokomo School Corporation 2947 Boulevard Elementary School 1 3 29 21 49 249 29.26% 111 241 68.47% 352
3500 Kokomo School Corporation 2969 Lafayette Park Elementary Sch 3 50 26 57 409 24.95% 183 362 66.42% 545
Lafayette Christian SC Lafayette Christian School 2 5 7 21 10 279 13.89% 313 11 3.40% 324
7855 Lafayette School Corporation 8015 Oakland High School 7 8 40 27.27% 23 32 58.18% 55
7855 Lafayette School Corporation 8069 Jefferson High School 9 14 261 424 126 1101 43.10% 755 1180 60.98% 1935
7855 Lafayette School Corporation 8073 Lafayette Sunnyside Intermediate 8 8 162 298 54 2 528 50.19% 263 797 75.19% 1060
7855 Lafayette School Corporation 8077 Lafayette Tecumseh Jr High Sch 6 7 126 293 54 1 580 45.64% 314 753 70.57% 1067
7855 Lafayette School Corporation 8089 Edgelea Elementary School 1 2 50 134 43 386 37.34% 223 393 63.80% 616
7855 Lafayette School Corporation 8091 Glen Acres Elementary School 4 64 163 27 1 198 56.67% 128 329 71.99% 457
7855 Lafayette School Corporation 8103 Miami Elementary School 4 126 165 31 3 235 58.33% 96 468 82.98% 564
7855 Lafayette School Corporation 8104 Thomas Miller Elementary Sch 1 134 79 44 1 153 62.86% 49 363 88.11% 412
7855 Lafayette School Corporation 8105 Murdock Elementary School 1 30 66 11 137 44.08% 35 210 85.71% 245
7855 Lafayette School Corporation 8117 Vinton Elementary School 2 47 138 34 233 48.68% 81 373 82.16% 454
7855 Lafayette School Corporation 8119 Amelia Earhart Elem Sch 2 1 91 110 38 3 256 48.90% 158 343 68.46% 501
7855 Lafayette School Corporation 8125 Greater Lafayette Area SE 6 16 45 7 176 29.60% 250 0.00% 25025

4615 Lake Central School Corp 3837 Kolling Elementary School 4 7 11 79 10 526 17.43% 579 58 9.11% 637
4615 Lake Central School Corp 3839 George Bibich Elementary Sch 7 11 70 11 353 21.90% 387 65 14.38% 452
4615 Lake Central School Corp 3840 James H Watson Elem Sch 12 21 82 24 359 27.91% 400 98 19.68% 498
4615 Lake Central School Corp 4351 Peifer Elementary School 3 5 35 105 16 325 33.54% 337 152 31.08% 489
4945 LaPorte Community School Corp 4741 LaPorte High School 3 18 53 261 112 3 1708 20.85% 1235 923 42.77% 2158
4945 LaPorte Community School Corp 4745 Paul F Boston Middle School 2 3 29 107 38 2 488 27.06% 324 345 51.57% 669
0665 Lebanon Community School Corp 0553 Lebanon Senior High School 9 13 47 26 920 9.36% 640 375 36.95% 1015
4860 M S D of New Durham Township 4701 Westville High School 3 3 16 21 10 415 11.32% 309 159 33.97% 468
5350 M S D Pike Township 5353 Pike High School 1 69 1987 563 211 1 327 89.65% 1194 1965 62.20% 3159
5350 M S D Pike Township 5357 Central Elementary School 17 439 159 48 62 91.45% 143 582 80.28% 725
0125 M S D Southwest Allen County Schls 0046 Whispering Meadow Elem Sch 45 31 31 32 3 323 30.54% 353 112 24.09% 465
0125 M S D Southwest Allen County Schls 0068 Haverhill Elementary School 2 1 11 11 15 337 10.61% 309 68 18.04% 377
8115 M S D Warren County 8733 Pine Village Elementary Sch 7 1 1 108 7.69% 80 37 31.62% 117
8115 M S D Warren County 8737 Seeger Memorial Jr-Sr HS 1 5 2 3 546 1.97% 358 199 35.73% 557
5615 Maconaquah School Corp 6012 Pipe Creek Elementary School 4 4 10 10 55 366 18.49% 131 318 70.82% 449
8045 Manchester Community Schools 8625 Manchester Jr-Sr High School 2 6 2 29 26 672 8.82% 396 341 46.27% 737
9340 New Community School 1538 New Community School 1 10 22 16 1 195 20.41% 113 132 53.88% 245
3070 Noblesville Schools 2529 North Elementary School 1 7 14 34 16 459 13.56% 349 182 34.27% 531
3070 Noblesville Schools 2539 Promise Road Elementary 48 58 43 15 514 24.19% 482 196 28.91% 678
3180 North Harrison Com School Corp 2629 North Harrison High School 2 2 1 12 4 639 3.18% 420 240 36.36% 660
5835 North Montgomery Com Sch Corp 6240 Pleasant Hill Elementary School 1 1 7 7 1 286 5.61% 171 132 43.56% 303
5835 North Montgomery Com Sch Corp 6243 Lester B Sommer Elem Sch 4 1 28 5 253 13.06% 155 136 46.74% 291
5835 North Montgomery Com Sch Corp 6244 Northridge Middle School 1 2 2 11 9 1 438 5.60% 278 186 40.09% 464
5835 North Montgomery Com Sch Corp 6271 North Montgomery High School 2 2 8 13 10 587 5.63% 420 202 32.48% 622
3295 North West Hendricks Schools 2725 Pittsboro Elementary 1 1 1 10 9 2 271 8.14% 230 65 22.03% 295
3295 North West Hendricks Schools 2731 Tri-West Senior High School 8 9 11 1 566 4.87% 499 96 16.13% 595
8515 North White School Corp 9119 North White Primary School 121 10 161 44.86% 82 210 71.92% 292
8515 North White School Corp 9122 North White Intermediate 1 55 9 108 37.57% 47 126 72.83% 173
0225 Northwest Allen County Schools 0095 Cedar Canyon Elementary Sch 19 7 24 21 451 13.60% 480 42 8.05% 522
7350 Northwestern Con School Corp 7689 Triton Central High School 7 8 10 433 5.46% 309 149 32.53% 458
7495 Oregon-Davis School Corp 7818 Oregon-Davis Elementary Sch 1 11 7 279 6.38% 125 173 58.05% 298
7495 Oregon-Davis School Corp 7831 Oregon-Davis Jr-Sr High School 15 7 276 7.38% 139 159 53.36% 298
5340 Perry Township Schools 5322 Mary Bryan Elementary Sch 166 30 71 48 1 469 40.25% 291 494 62.93% 785
6445 Pike County School Corp 6763 Pike Central High Sch 2 2 8 7 548 3.35% 353 214 37.74% 567
5485 Plymouth Community School Corp 5945 Plymouth High School 3 7 14 232 15 853 24.11% 542 582 51.78% 1124
5485 Plymouth Community School Corp 5961 Jefferson Elementary School 2 3 2 60 6 242 23.17% 119 196 62.22% 315
4515 Prairie Heights Com Sch Corp 3690 Prairie Heights Sr High Sch 12 3 3 16 9 409 9.51% 293 159 35.18% 452
1180 Rossville Con School District 1021 Rossville Middle/Senior High Sch 5 5 11 10 549 5.34% 445 135 23.28% 580
4710 School City of Hammond 4425 Henry W Eggers Elem/Md Sch 2 381 305 24 30 95.96% 51 691 93.13% 742
4730 School City of Hobart 4309 Hobart Middle School 2 2 65 221 29 618 34.04% 481 456 48.67% 937
4730 School City of Hobart 4327 Joan Martin Elementary School 3 2 47 158 26 514 31.47% 445 305 40.67% 750
4740 School Town of Munster 4333 Wilbur Wright Middle School 1 60 69 211 34 568 39.77% 763 180 19.09% 943
4740 School Town of Munster 4337 James B Eads Elementary Sch 1 36 53 125 31 297 45.30% 381 162 29.83% 543
7255 Scott County School District 2 7641 Scottsburg Senior High School 5 3 5 26 11 2 806 6.06% 481 377 43.94% 858
5255 South Madison Com Sch Corp 5053 Pendleton Heights High School 7 13 22 34 36 1 1296 8.02% 1002 407 28.89% 1409
26

5845 South Montgomery Com Sch Corp 6257 Southmont Sr High School 2 16 7 494 4.82% 344 175 33.72% 519
0815 Southeastern School Corp 0689 Lewis Cass Jr-Sr High School 2 6 6 37 14 662 8.94% 484 243 33.43% 727
6195 Spencer-Owen Community Schools 6597 Owen Valley Middle School 3 4 3 10 410 4.65% 207 223 51.86% 430
7775 Switzerland County School Corp 7993 Switzerland Co Senior High Sch 1 1 3 6 1 442 2.64% 256 198 43.61% 454
7865 Tippecanoe School Corp 8003 McCutcheon High School 3 7 73 214 74 1 1330 21.86% 1148 554 32.55% 1702
7865 Tippecanoe School Corp 8005 Mayflower Mill Elem Sch 7 83 48 35 1 369 32.04% 276 267 49.17% 543
7865 Tippecanoe School Corp 8006 Wyandotte Elementary 10 6 57 19 2 332 22.07% 322 104 24.41% 426
7865 Tippecanoe School Corp 8007 Hershey Elementary School 1 5 5 26 28 478 11.97% 401 142 26.15% 543
7865 Tippecanoe School Corp 8009 Mintonye Elementary School 2 1 29 11 408 9.53% 325 126 27.94% 451
7865 Tippecanoe School Corp 8017 Dayton Elementary School 1 3 13 73 18 282 27.69% 208 182 46.67% 390
7865 Tippecanoe School Corp 8019 Burnett Creek Elementary School 3 65 33 82 29 489 30.24% 475 226 32.24% 701
7865 Tippecanoe School Corp 8021 Wea Ridge Elementary School 4 11 34 107 27 1 466 28.31% 394 256 39.38% 650
7865 Tippecanoe School Corp 8024 Battle Ground Elem Sch 1 1 6 56 31 1 459 17.30% 326 229 41.26% 555
7865 Tippecanoe School Corp 8025 Battle Ground Middle School 2 18 14 52 23 467 18.92% 381 195 33.85% 576
7865 Tippecanoe School Corp 8026 Wainwright Middle School 1 5 52 8 249 20.95% 194 121 38.41% 315
7865 Tippecanoe School Corp 8029 William Henry Harrison High Sch 4 42 42 167 57 1463 17.58% 1338 437 24.62% 1775
7865 Tippecanoe School Corp 8033 East Tipp Middle School 12 1 35 11 406 12.69% 368 97 20.86% 465
7865 Tippecanoe School Corp 8035 James Cole Elementary School 1 1 20 5 215 11.16% 145 97 40.08% 242
7865 Tippecanoe School Corp 8041 Klondike Middle School 2 26 39 72 28 288 36.70% 274 181 39.78% 455
7865 Tippecanoe School Corp 8042 Klondike Elementary School 3 89 66 145 53 1 594 37.54% 492 459 48.26% 951
7865 Tippecanoe School Corp 8045 Southwestern Middle School 5 27 36 15 365 18.53% 295 153 34.15% 448
7865 Tippecanoe School Corp 8049 Wea Ridge Middle School 1 7 32 122 23 440 29.60% 369 256 40.96% 625
7865 Tippecanoe School Corp 8111 Woodland Elementary School 18 20 184 33 323 44.12% 241 337 58.30% 578
8535 Tri-County School Corp 9141 Tri-County Middle-Senior High 3 2 9 2 328 4.65% 226 118 34.30% 344
4645 Tri-Creek School Corporation 3865 Lowell Senior High School 4 2 15 106 20 1041 12.37% 930 258 21.72% 1188
8565 Twin Lakes School Corp 9149 Twin Lakes Senior High School 3 4 86 27 598 16.71% 418 300 41.78% 718
8565 Twin Lakes School Corp 9153 Roosevelt Middle Sch 3 2 2 70 33 491 18.30% 298 303 50.42% 601
8565 Twin Lakes School Corp 9163 Meadowlawn Elementary School 1 5 77 23 386 21.54% 222 270 54.88% 492
6560 Valparaiso Community Schools 6881 Valparaiso High School 9 45 71 158 72 1710 17.19% 1606 459 22.23% 2065
6560 Valparaiso Community Schools 6913 Memorial Elementary School 2 7 22 16 1 261 15.53% 253 56 18.12% 309
2285 Wa-Nee Community Schools 1737 North Wood High School 9 14 68 26 724 13.91% 601 240 28.54% 841
4345 Wawasee Community School Corp 3639 Wawasee High School 4 5 5 87 27 834 13.31% 656 306 31.81% 962
1885 Wes-Del Community Schools 1372 Wes-Del Middle/Senior High Sch 1 2 13 17 456 6.75% 280 209 42.74% 489
1885 Wes-Del Community Schools 1413 Wes-Del Elementary School 2 3 14 11 322 8.52% 172 180 51.14% 352
7875 West Lafayette Com School Corp 8129 West Lafayette Jr/Sr High Sch 206 53 53 55 714 33.95% 951 130 12.03% 1081
7875 West Lafayette Com School Corp 8135 Happy Hollow Elementary 127 20 26 26 310 39.10% 431 78 15.32% 509
7875 West Lafayette Com School Corp 8138 Cumberland Elementary School 1 152 38 41 41 381 41.74% 508 146 22.32% 654
3030 Westfield-Washington Schools 2495 Washington Woods Elementary School 1 5 7 78 27 273 30.18% 262 129 32.99% 391
3030 Westfield-Washington Schools 2496 Oak Trace Elementary Sch 15 12 8 30 514 11.23% 566 13 2.25% 579
0630 Zionsville Community Schools 0514 Eagle Elementary School 14 10 17 34 291 20.49% 329 37 10.11% 366
0630 Zionsville Community Schools 0517 Zionsville Pleasant View Elem Sch 26 4 15 35 734 9.83% 794 20 2.46% 814
0630 Zionsville Community Schools 0541 Union Elementary School 20 2 23 32 506 13.21% 561 22 3.77% 583
0630 Zionsville Community Schools 0542 Stonegate Elementary 22 5 32 20 1 387 17.13% 437 30 6.42% 467
27