academic underperformance in act schools: an analysis of ... · a macintosh and d wilkinson,...
TRANSCRIPT

1
Academic underperformance in ACT schools: An analysis of ACT school performance in NAPLAN over the period 2012 to 2016 Andrew Macintosh and Debra Wilkinson
ANU Law School
Working Paper
21 August 2018

2
Recommended citation:
A Macintosh and D Wilkinson, Academic underperformance in ACT schools: An analysis of ACT school performance in NAPLAN over the period 2012 to 2016 (The Australian National University, ANU Law School Working Paper, 2018).
Correspondence:
Professor Andrew Macintosh ANU Law School Ph: +61 2 6125 3832 Email: [email protected]
© The Australian National University.
This work is copyright. Apart from any use as permitted under the Copyright Act 1968, no part may be reproduced by any process without written permission from The Australian National University.
3
Table of Contents 1. Introduction ......................................................................................................... 4
2. Method ................................................................................................................ 6
2.1 Data source ................................................................................................... 6
2.2 ACT Schools ................................................................................................. 6
2.3 Comparison schools ...................................................................................... 7
2.4 Analytical Approach ...................................................................................... 8
3. Results ................................................................................................................ 8
3.1 Government schools ..................................................................................... 9
3.1.1 Five year averages – government schools ............................................. 9
3.1.2 Annual results – government schools ................................................... 10
3.1.3 Extent of underperformance across government schools ..................... 12
3.2 Non-government Schools ............................................................................ 16
3.2.1 Five year averages – non-government schools .................................... 16
3.2.2 Annual results – non-government schools ............................................ 17
3.2.3 Extent of underperformance across non-government schools .............. 19
4. Discussion ......................................................................................................... 22
5. Conclusions and recommendations .................................................................. 24

4
1. Introduction The National Assessment Program – Literacy and Numeracy (NAPLAN) is a national standardised literacy and numeracy test conducted four times over a student’s schooling life (Years 3, 5, 7 and 9).1 The program began in 2008 and is administered by the Australian Curriculum, Assessment and Reporting Authority (ACARA). Since 2010, NAPLAN results for each school have been published on the My School website.2
NAPLAN is intended to provide a comprehensive picture of the academic performance of Australian students in Years 3, 5, 7 and 9. All Australian students in these years are expected to complete the test. However, exemptions are available for students with a significant or complex disability and for students from a non-English speaking background who have been in Australia less than 12 months.3 In addition, students may be withdrawn if their parents object to the NAPLAN tests.
Politicians and others have often celebrated the performance of Australian Capital Territory (ACT) schools in NAPLAN on the basis their average results generally exceed those of other states and territories.4 As has been pointed out elsewhere, comparisons of this nature are invalid because they do not account for impact of student- and school-level socio-economic factors that affect academic performance.5 Domestic and international research has repeatedly demonstrated that the academic performance of students is influenced by their socio-economic background (i.e. the occupation and education level of parents and carers).6 Research has also shown that student performance is affected by school-level factors, including their remoteness and the composition of the student body.7 Owing to the influence of these factors, the NAPLAN performance of schools should only be compared with other schools that share similar socio-economic profiles.
1 The introduction of the NAPLAN in 2008 replaced a number of existing literacy and numeracy tests conducted at the state level such as the Achievement Improvement Monitor in Victoria and the English Language and Literacy Assessment and Secondary Numeracy Assessment Program in New South Wales (NSW). 2 See https://www.myschool.edu.au/ (16 August 2018). 3 Australian Curriculum and Reporting Authority (ACARA) (2016), ‘NAPLAN – participation’. Available at: https://www.nap.edu.au/information/faqs/naplan--participation (17 August 2018). 4 L. Cox (2013), ‘Canberra NAPLAN results show ACT best students in Australia’, The Canberra Times, 13 September; J. Burch (2014), ‘ACT remains top of the class in NAPLAN’, Media Release, ACT Government, 18 August; E. Macdonald (2015), ‘ACT kids improve already top NAPLAN results’, The Canberra Times, 5 August. 5 S. Lamb (2016). Government school performance in the ACT. Government of the Australian Capital Territory, Canberra; A. Macintosh, D. Wilkinson and A. Constable (2017). Leading the Nation? The NAPLAN performance of the ACT’s high socio-economic schools. The Australia Institute. 6 G. Marks, J. Cresswell and J. Ainley (2006), ‘Explaining socioeconomic inequalities in student achievement: The role of home and school factors’, Educational Research and Evaluation: An International Journal on Theory and Practice 12(2), 105-128; G. Considie and G. Zappalà (2002), ‘The influence of social and economic disadvantage in the academic performance of school students in Australia’, Journal of Sociology 38(2), 129-148; C. Carmichael, A. MacDonald and L. Mcfarland-Piazza (2014), ‘Predictors of numeracy performance in national testing programs: Insight from the longitudinal study of Australian children’, British Educational Research Journal 40(4), 637-659. 7 Considie and Zappalà, above n 6; Marks et al., above n 6; Carmichael et al., above n 6; A. Sutton and I. Soderstrom (1999), ‘Predicting Elementary & Secondary School Achievement With School-Related and Demographic Factors’, The Journal of Educational Research 92(6), 330-338.

5
When the NAPLAN results of ACT schools have been compared those from school groups with similar socio-economic profiles, their performance has appeared relatively weak.8 The current authors published a report in 2017 that compared the performance of high socio-economic status primary schools (government and non-government) in the ACT with statistically similar school groups, which identified a pattern of repeated underperformance over the period 2008 to 2016.9 The apparent underperformance was mostly attributable to government schools and was not consistent across subjects: ACT school performance was stronger in reading and weakest in writing, spelling and numeracy.
Also in 2017, the ACT Auditor-General published a report on performance information in ACT public schools, which, amongst other things, compared the performance of ACT government schools in 2015 and 2016 in Years 3, 5, 7 and 9 to statistically similar school groups.10 The Auditor-General made two main conclusions: that the majority of government schools’ NAPLAN results were lower than similar schools in Australia; and the apparent underperformance was most pronounced for low socio-economic schools.
Similar findings were made in a 2016 report by Professor Stephen Lamb of Victoria University, who was commissioned by the ACT Education Directorate to undertake an analysis of the academic performance of ACT government schools.11 The report analysed the comparative performance of ACT government schools in reading and numeracy in Years 5 and 9 in 2013. Lamb found that, after adjusting for the socio-economic status of the school population and context factors, ‘ACT government schools on average achieve negative results on every measure’ and that numeracy was the area of greatest concern. In his words:
… the Numeracy results are markedly below the rest of the country, compared to what would be expected based on the populations schools are serving in the ACT.12
His general conclusion was that the ‘real levels of performance in the ACT … is lower than expected (predicted) based on the student population and weaker than schools serving similar populations in other states’.13
These reports raise questions about the pervasiveness and causes of the apparent underperformance of ACT schools in NAPLAN. To shed further light on these issues, this report presents the results of an analysis that compared the NAPLAN performance of ACT primary and secondary schools to schools with similar socio-economic profiles. The analysis adds to the previous reports by covering all government and non-government school results for Years 3, 5, 7 and 9 over the period 2012 to 2016. To improve readability, the results presented here are confined to reading, writing and numeracy.
8 Lamb, above n 5; Macintosh et al., above n 5; ACT Auditor-General (2017). Performance Information in ACT Public Schools. Government of the Australian Capital Territory, Canberra. 9 Macintosh et al., above n 5. 10 ACT Auditor-General, above n 8. 11 Lamb, above n 5. 12 Lamb, above n 5, at p 4. 13 Lamb, above n 5, at p 4-5.

6
The remainder of this report is set out as follows. Section 2 provides details of the method. Section 3 presents the results. Section 4 discusses the results and Section 5 provides conclusions and recommendations.
2. Method
2.1 Data source
All data used in the analysis on school profiles and the NAPLAN performance of ACT schools were obtained from the My School website. Relevant data were obtained from the website over the period October 2017 to July 2018.
2.2 ACT Schools
All primary and secondary schools in the ACT that reported NAPLAN results over the period 2012-2016 were included in the analysis, with the exception of Jervis Bay School. The Jervis Bay School was excluded because it is located outside of the ACT (in the Jervis Bay Territory) and has a distinct socio-economic profile that is markedly different from other ACT schools. Table 1 provides an overview of the profile of the sampled schools by year level.
Table 1. Profile of sampled ACT schools
The sampled schools were divided into three socio-economic groupings using the Index of Community and Socio-educational Advantage (ICSEA). The ICSEA of a school is a numerical measure of its level of educational advantage, which accounts for student- and school-level factors that are known to influence academic performance. Broadly, the inputs to the ICSEA calculation consist of: (a) family background information provided to schools by families regarding parent or carer occupation and education (student-level factors); and (b) data concerning the remoteness of the school and the proportion of students identifying as Indigenous (school-level factors).14 The ICSEA values are calculated on a scale with a median and mean of 1000, a standard deviation of 100 and a typical range of between 500 (extreme educational disadvantage) and 1300 (very high educational
14 ACARA (2016), What does the ICSEA value mean? ACARA, Sydney.
Number of schools for Year 3 Government Non-government
95 57 38
Number of schools for Year 5 Government Non-government
96 57 39
Number of schools for Year 7 Government Non-government
38 19 19
Number of schools for Year 9 Government Non-government
37 19 18

7
advantage).15
For these purposes, the three school groupings (low, medium and high socio-economic status) were based on schools’ average ICSEA scores over the period 2012-2016. Schools were classified as low socio-economic status if their average ICSEA score was below 1050, medium socio-economic status if their average ICSEA score was equal to or greater than 1050 and less than 1120, and high socio-economic status if their average ICSEA score was equal to or greater than 1120. Table 2 provides an overview of the groupings and their average ICSEA scores. As these data demonstrate, ACT schools have high ICSEA scores relative to the national average. The five-year average ICSEA scores of the sampled ACT schools ranged from a low of 933 to a high of 1201, whereas the national average is 1000. There were only seven primary schools (all government schools) and five high schools (again, all government schools) whose average ICSEA scores for the study period were below the national average of 1000. Amongst primary schools, the average ICSEA score was 1078 for government schools and 1112 for non-government schools. For high schools, the average ICSEA score was 1049 for government schools and 1120 for non-government schools.
Table 2. Profile of socio-economic school groupings
Year 3 Year 5 Year 7 Year 9
SES group No. ICSEA* No. ICSEA* No. ICSEA* No. ICSEA*
Government
Low 19 1007 20 1009 10 1004 10 1004
Medium 20 1085 19 1085 6 1077 6 1076
High 18 1146 18 1146 3 1143 3 1143
Non-government
Low 3 1041 3 1041 NA NA NA NA
Medium 18 1092 17 1091 11 1090 10 1091
High 17 1144 19 1142 8 1159 8 1157 * The ICSEA scores were calculated as arithmetic means.
2.3 Comparison schools
To enable policy-makers and parents to make ‘fair and reasonable’ comparisons,16 the My School website provides a Statistically Similar Schools Group (SSSG) for each school using ICSEA scores. For any given school, its SSSG will consist of up to 60 government and non-government schools from across Australia that have similar ICSEA values.17 The results from the SSSGs for each of the sampled ACT schools were collated and used as the basis to analyse the relative performance of the sample schools.
15 ACARA (2015), Guide to understanding ICSEA (Index of Socio-educational Advantage) values: From 2013 onwards, ACARA, Sydney. 16 ACARA (2016), above n 14. 17 The number of schools in SSSGs is generally around 57-60 but is lower for schools with very low or very high ICSEA scores.

8
2.4 Analytical Approach
The NAPLAN performance of the sampled schools was evaluated on the basis of the mean results in Years 3, 5, 7 and 9 over the period 2012-2016. The mean results for the sampled schools were compared to the mean of the relevant SSSGs in the corresponding subjects. In devising the composite results for the low, medium and high socio-economic status groupings, the mean results were weighted on the basis of student enrolments. The weightings were applied to both the sampled schools and SSSGs results.
3. Results
Set out below are the results of the analysis for reading, writing and numeracy. The results are presented by school sector (government and non-government), year level, and socio-economic grouping, and in five-year averages and annual averages for each year in the study period. Section 3.1 presents the results for government schools and section 3.2 presents the results for non-government schools.
In presenting the results, a colour code has been used. The colour code is as follows.
Significantly above equivalent SSSG result
In Years 3 and 5, 21 or more points above the equivalent SSSG result In Years 7 and 9, 13 or more points above the equivalent SSSG result
Above equivalent SSSG result
In Years 3 and 5, 1-20 points above the equivalent SSSG result In Years 7 and 9, 1-12 points above the equivalent SSSG result
Same as the equivalent SSSG result
Below equivalent SSSG result
In Years 3 and 5, 1-20 points below the equivalent SSSG result In Years 7 and 9, 1-12 points below the equivalent SSSG result
Significantly below equivalent SSSG result
In Years 3 and 5, 21 or more points below the equivalent SSSG result In Years 7 and 9, 13 or more points below the equivalent SSSG result
The delineators of significance—21 or more points in Years 3 and 5 and 13 or more points in Years 7 and 9—were selected because they represent approximately 6 months of learning in primary and secondary school respectively.18 For example, if the mean result from an ACT school in Year 5 is 21
18 Based on analysis of expected progress in NAPLAN bands. See the ‘How to interpret’ section of the National Assessment Program website: https://www.nap.edu.au/results-and-reports/how-to-interpret (15 August 2018).

9
points above the equivalent result from the school’s SSSG, it suggests that, on average, the students at the ACT school are 6 months ahead of students at comparable schools (and vice versa).
3.1 Government schools
3.1.1 Five year averages – government schools
Table 3 presents the five-year weighted average results from government schools in Years 3, 5, 7 and 9 for the period 2012-2016 and the corresponding weighted average SSSG results. All of the five-year average results from the government schools were below or significantly below the equivalent five-year SSSG averages. The extent of the apparent underperformance was most acute in high schools and in writing and numeracy. The results suggest that, on average, government high school students in the ACT were 8-12 months behind students in comparable schools in writing and numeracy over the study period. The average government school reading results were still below those of the SSSGs but by a smaller margin than in the other subjects (i.e. the equivalent of 3-4 months behind compared to 8-12 months).
Table 3. Five-year weighted average results, government schools and SSSGs, 2012-2016, all government schools
Reading Writing Numeracy
ACT mean
SSSG mean
Diff.* ACT mean
SSSG mean
Diff.* ACT mean
SSSG mean
Diff.*
Yr 3 438 447 -9 412 430 -18 409 420 -11
Yr 5 504 513 -8 473 489 -16 494 508 -14
Yr 7 549 557 -8 506 529 -23 539 559 -19
Yr 9 587 595 -8 539 568 -30 585 604 -19 * Diff. = difference between the averages. Numbers may not add up due to rounding.
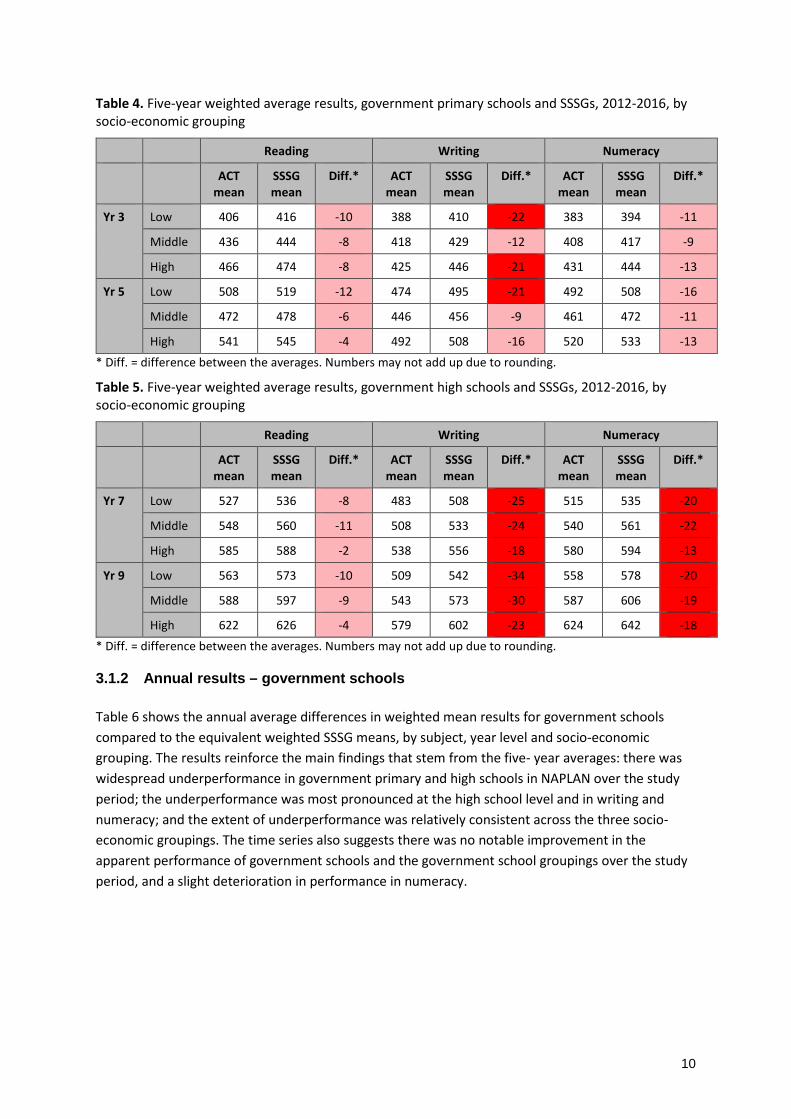
The results by socio-economic groupings show that all 36 of the five-year averages for the three groupings in government primary and high schools were below or significantly below the equivalent five-year SSSG averages (Tables 4 and 5). In 75% of cases, the relative results in the primary and high school low socio-economic groupings were weaker than those in the middle and high socio-economic groupings. However, the differences between the weighted results of the socio-economic groupings were relatively small. At the primary school level, the middle socio-economic group performed better over the study period relative to the comparative performance of the high and low socio-economic groups. At the high school level, the five-year averages of all three socio-economic groupings in writing and numeracy were significantly below the equivalent SSSG results. The differences at the high school level in writing and numeracy equate to between 6 and 16 months of learning relative to the average student performance at comparable schools. The reading results for the groupings were notably better than those in writing and numeracy at both the primary and high school levels. The degree of underperformance in numeracy was also notably less at the primary school level than at the high school level. Writing was the area of greatest relative underperformance.
10
Table 4. Five-year weighted average results, government primary schools and SSSGs, 2012-2016, by socio-economic grouping
Reading Writing Numeracy
ACT mean
SSSG mean
Diff.* ACT mean
SSSG mean
Diff.* ACT mean
SSSG mean
Diff.*
Yr 3 Low 406 416 -10 388 410 -22 383 394 -11
Middle 436 444 -8 418 429 -12 408 417 -9
High 466 474 -8 425 446 -21 431 444 -13
Yr 5 Low 508 519 -12 474 495 -21 492 508 -16
Middle 472 478 -6 446 456 -9 461 472 -11
High 541 545 -4 492 508 -16 520 533 -13 * Diff. = difference between the averages. Numbers may not add up due to rounding.
Table 5. Five-year weighted average results, government high schools and SSSGs, 2012-2016, by socio-economic grouping
Reading Writing Numeracy
ACT mean
SSSG mean
Diff.* ACT mean
SSSG mean
Diff.* ACT mean
SSSG mean
Diff.*
Yr 7 Low 527 536 -8 483 508 -25 515 535 -20
Middle 548 560 -11 508 533 -24 540 561 -22
High 585 588 -2 538 556 -18 580 594 -13
Yr 9 Low 563 573 -10 509 542 -34 558 578 -20
Middle 588 597 -9 543 573 -30 587 606 -19
High 622 626 -4 579 602 -23 624 642 -18 * Diff. = difference between the averages. Numbers may not add up due to rounding.
3.1.2 Annual results – government schools
Table 6 shows the annual average differences in weighted mean results for government schools compared to the equivalent weighted SSSG means, by subject, year level and socio-economic grouping. The results reinforce the main findings that stem from the five- year averages: there was widespread underperformance in government primary and high schools in NAPLAN over the study period; the underperformance was most pronounced at the high school level and in writing and numeracy; and the extent of underperformance was relatively consistent across the three socio-economic groupings. The time series also suggests there was no notable improvement in the apparent performance of government schools and the government school groupings over the study period, and a slight deterioration in performance in numeracy.

11
Table 6. Annual average differences in weighted mean results, government schools vs SSSGs, 2012-2016, by socio-economic groupings
Reading Writing Numeracy
2012 2013 2014 2015 2016 2012 2013 2014 2015 2016 2012 2013 2014 2015 2016
Yr 3 Low 1 -5 -18 -15 -14 -23 -24 -20 -22 -19 -3 -11 -18 -8 -13
Middle -3 -3 -8 -12 -16 -12 -7 -10 -13 -16 -4 -7 -11 -10 -13
High -1 -7 -10 -11 -9 -17 -20 -27 -23 -20 -13 -8 -15 -15 -14
Yr 5 Low -13 -10 -5 -12 -19 -13 -18 -22 -30 -23 -12 -18 -13 -16 -24
Middle 0 -8 -14 -2 -9 -1 -11 -10 -10 -14 4 -14 -15 -12 -17
High 10 -4 -8 -4 -11 -6 -16 -18 -17 -22 -4 -9 -16 -16 -21
Yr 7 Low -10 -8 -14 -5 -4 -27 -22 -24 -25 -24 -22 -19 -25 -18 -17
Middle -14 -12 -10 -12 -11 -30 -25 -17 -28 -21 -22 -21 -19 -24 -24
High -3 -2 3 -4 -5 -20 -24 -13 -13 -20 -9 -9 -10 -18 -20
Yr 9 Low -4 -9 -10 -13 -16 -31 -33 -31 -38 -35 -10 -27 -20 -20 -24
Middle -13 -7 -11 -9 -6 -40 -24 -30 -31 -24 -16 -21 -21 -19 -17
High 1 -7 -10 -2 -2 -21 -27 -33 -21 -15 -15 -18 -23 -19 -16
12
3.1.3 Extent of underperformance across government schools
The five-year and annual averages suggest there was a significant problem with the performance of ACT government schools in NAPLAN over the study period. The results by socio-economic grouping suggest the underperformance was widespread across government schools rather than being the result of acute underperformance in a smaller cohort or cohorts of schools. To further investigate this issue, an analysis was undertaken on the extent of underperformance across government schools using two approaches:
• calculating the number of schools where more than 2/3rds (66%) of the average results in each subject and year level were below the equivalent SSSG results; and
• using box and whisker plots to show the distribution of the differences in average results for the sampled ACT government schools relative to their SSSGs.
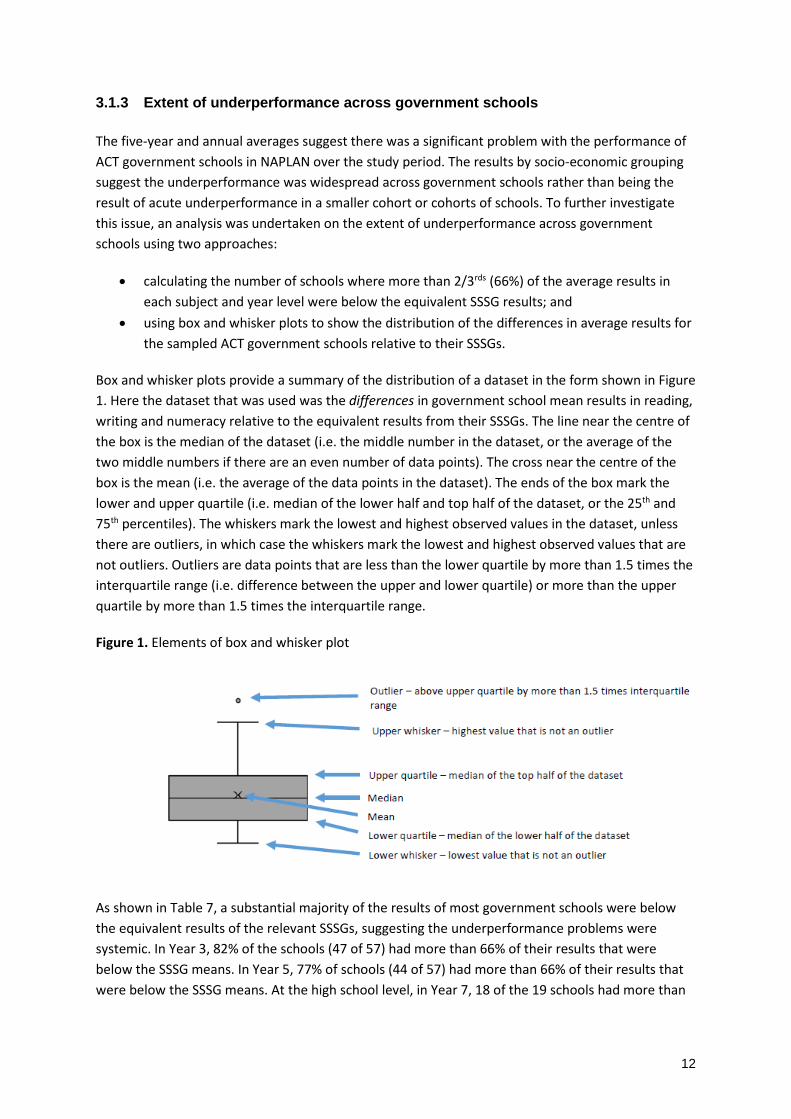
Box and whisker plots provide a summary of the distribution of a dataset in the form shown in Figure 1. Here the dataset that was used was the differences in government school mean results in reading, writing and numeracy relative to the equivalent results from their SSSGs. The line near the centre of the box is the median of the dataset (i.e. the middle number in the dataset, or the average of the two middle numbers if there are an even number of data points). The cross near the centre of the box is the mean (i.e. the average of the data points in the dataset). The ends of the box mark the lower and upper quartile (i.e. median of the lower half and top half of the dataset, or the 25th and 75th percentiles). The whiskers mark the lowest and highest observed values in the dataset, unless there are outliers, in which case the whiskers mark the lowest and highest observed values that are not outliers. Outliers are data points that are less than the lower quartile by more than 1.5 times the interquartile range (i.e. difference between the upper and lower quartile) or more than the upper quartile by more than 1.5 times the interquartile range.
Figure 1. Elements of box and whisker plot
As shown in Table 7, a substantial majority of the results of most government schools were below the equivalent results of the relevant SSSGs, suggesting the underperformance problems were systemic. In Year 3, 82% of the schools (47 of 57) had more than 66% of their results that were below the SSSG means. In Year 5, 77% of schools (44 of 57) had more than 66% of their results that were below the SSSG means. At the high school level, in Year 7, 18 of the 19 schools had more than

13
66% of their results that were below the SSSG means. In Year 9, in all 19 government schools, more than 66% of their results over the study period were below the SSSG means.
Table 7. Number of government schools with greater than 66% of mean results below equivalent SSSG means, 2012-2016
Number of schools with >66% of mean results below SSSG mean
No. % of schools in year
Yr 3 47 82%
Yr 5 44 77%
Yr 7 18 95%
Yr 9 19 100%
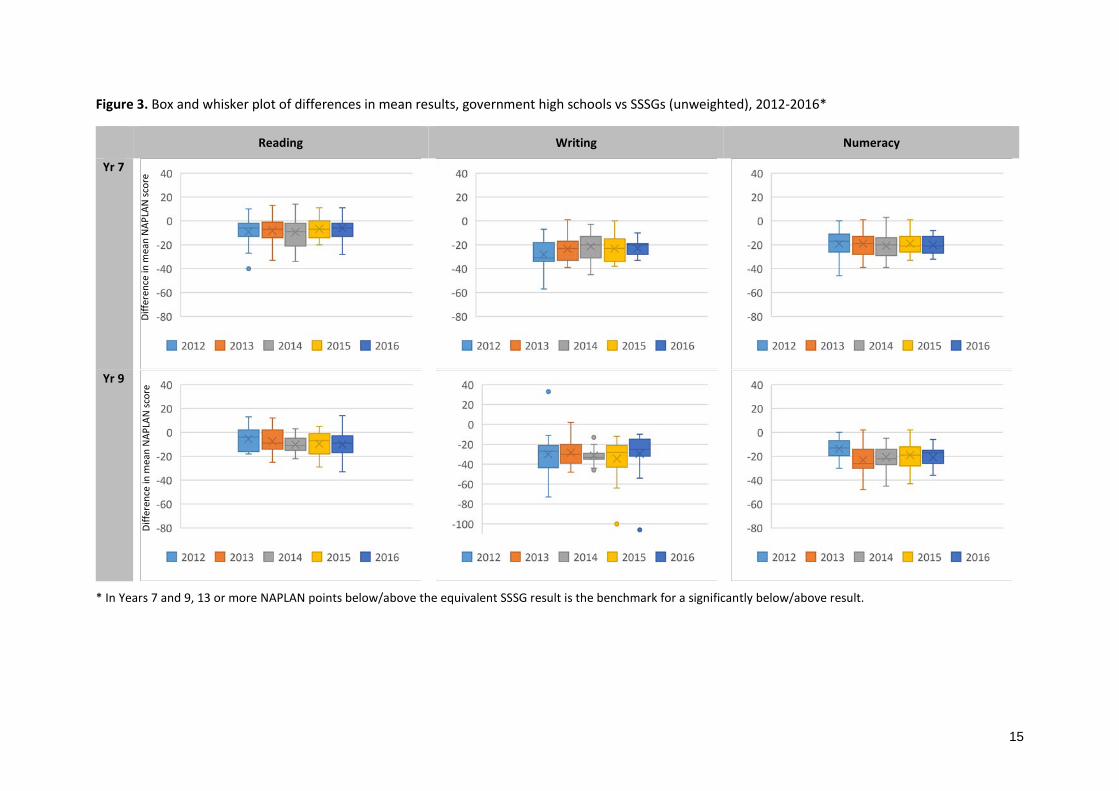
The box and whisker plots of individual school SSSG differences also suggest the apparent underperformance was widespread across the government school system (Figures 2 and 3). Other than in reading, the upper quartile of the differences in almost all years in writing and numeracy were negative. The fact that the upper quartile is negative signifies that 75% of the government school results were below those of the equivalent SSSG means. At the high school level, in writing and numeracy, in most years, almost the entire distribution was negative. That is, in Years 7 and 9, over the period 2012-2016, almost all mean results from the 19 government high schools were below the equivalent mean results from the SSSGs, often significantly so. The results suggest that across the study period there was systemic underperformance by government schools in NAPLAN.

14
Figure 2. Box and whisker plot of differences in mean results, government primary schools vs SSSGs (unweighted), 2012-2016*
Reading Writing Numeracy
Yr 3
Yr 5
* In Years 3 and 5, 21 or more NAPLAN points below/above the equivalent SSSG result is the benchmark for a significantly below/above result.
Diffe
renc
e in
mea
n N
APLA
N sc
ore
Diffe
renc
e in
mea
n N
APLA
N sc
ore
15
Figure 3. Box and whisker plot of differences in mean results, government high schools vs SSSGs (unweighted), 2012-2016*
Reading Writing Numeracy
Yr 7
Yr 9
* In Years 7 and 9, 13 or more NAPLAN points below/above the equivalent SSSG result is the benchmark for a significantly below/above result.
Diffe
renc
e in
mea
n N
APLA
N sc
ore
Diffe
renc
e in
mea
n N
APLA
N sc
ore
16
3.2 Non-government Schools
3.2.1 Five year averages – non-government schools
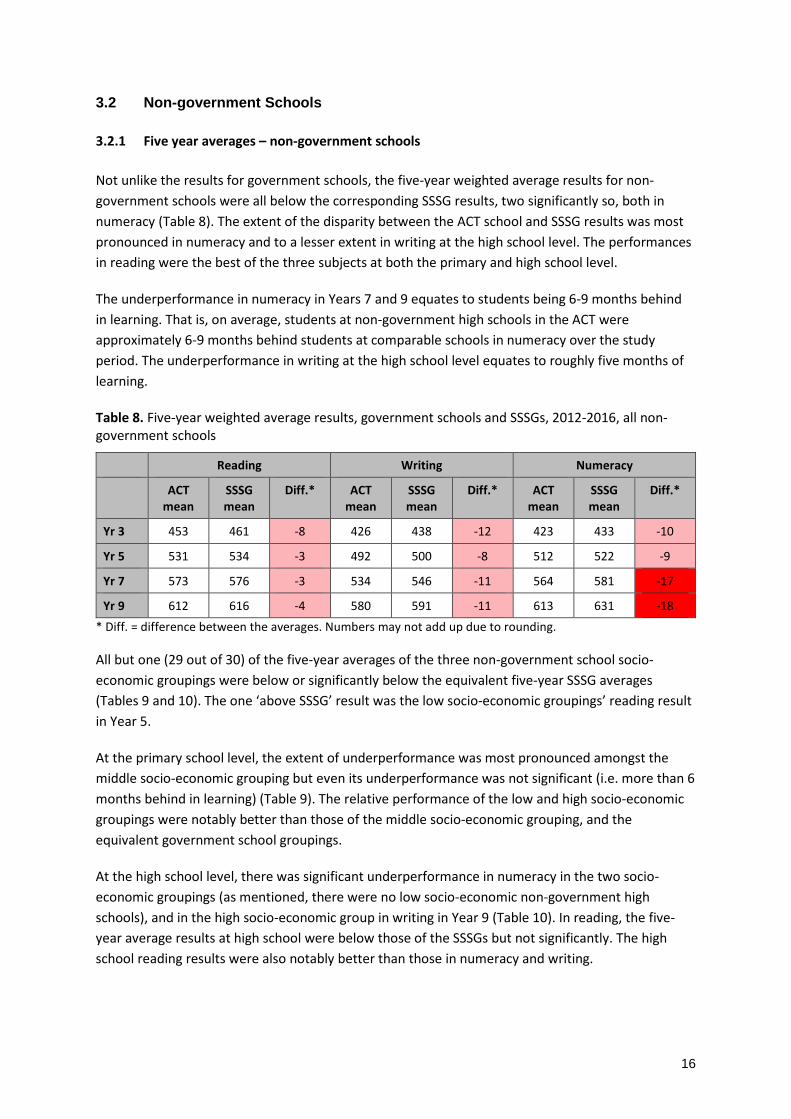
Not unlike the results for government schools, the five-year weighted average results for non-government schools were all below the corresponding SSSG results, two significantly so, both in numeracy (Table 8). The extent of the disparity between the ACT school and SSSG results was most pronounced in numeracy and to a lesser extent in writing at the high school level. The performances in reading were the best of the three subjects at both the primary and high school level.
The underperformance in numeracy in Years 7 and 9 equates to students being 6-9 months behind in learning. That is, on average, students at non-government high schools in the ACT were approximately 6-9 months behind students at comparable schools in numeracy over the study period. The underperformance in writing at the high school level equates to roughly five months of learning.
Table 8. Five-year weighted average results, government schools and SSSGs, 2012-2016, all non-government schools
Reading Writing Numeracy
ACT mean
SSSG mean
Diff.* ACT mean
SSSG mean
Diff.* ACT mean
SSSG mean
Diff.*
Yr 3 453 461 -8 426 438 -12 423 433 -10
Yr 5 531 534 -3 492 500 -8 512 522 -9
Yr 7 573 576 -3 534 546 -11 564 581 -17
Yr 9 612 616 -4 580 591 -11 613 631 -18 * Diff. = difference between the averages. Numbers may not add up due to rounding.
All but one (29 out of 30) of the five-year averages of the three non-government school socio-economic groupings were below or significantly below the equivalent five-year SSSG averages (Tables 9 and 10). The one ‘above SSSG’ result was the low socio-economic groupings’ reading result in Year 5.
At the primary school level, the extent of underperformance was most pronounced amongst the middle socio-economic grouping but even its underperformance was not significant (i.e. more than 6 months behind in learning) (Table 9). The relative performance of the low and high socio-economic groupings were notably better than those of the middle socio-economic grouping, and the equivalent government school groupings.
At the high school level, there was significant underperformance in numeracy in the two socio-economic groupings (as mentioned, there were no low socio-economic non-government high schools), and in the high socio-economic group in writing in Year 9 (Table 10). In reading, the five-year average results at high school were below those of the SSSGs but not significantly. The high school reading results were also notably better than those in numeracy and writing.

17
Table 9. Five-year weighted average results, non-government primary schools and SSSGs, 2012-2016, by socio-economic grouping
Reading Writing Numeracy
ACT mean
SSSG mean
Diff.* ACT mean
SSSG mean
Diff.* ACT mean
SSSG mean
Diff.*
Yr 3 Low 427 429 -2 413 419 -7 399 405 -6
Middle 434 445 -11 411 428 -17 404 418 -14
High 471 478 -7 440 448 -8 440 447 -8
Yr 5 Low 506 504 2 476 479 -3 488 493 -5
Middle 514 520 -6 477 491 -14 493 508 -15
High 545 546 -1 504 509 -5 528 534 -6 * Diff. = difference between the averages. Numbers may not add up due to rounding.
Table 10. Five year weighted average results, non-government high schools and SSSGs, 2012-2016, by socio-economic grouping
Reading Writing Numeracy
ACT mean
SSSG mean
Diff.* ACT mean
SSSG mean
Diff.* ACT mean
SSSG mean
Diff.*
Yr 7 Low** NA
Middle 557 560 -3 522 533 -11 545 562 -16
High 591 595 -3 548 561 -12 586 604 -17
Yr 9 Low** NA
Middle 600 603 -2 568 576 -9 594 610 -17
High 625 630 -5 594 607 -13 634 652 -18 * Diff. = difference between the averages. Numbers may not add up due to rounding. ** No non-government high schools met the criteria for inclusion in the low socio-economic grouping.
3.2.2 Annual results – non-government schools
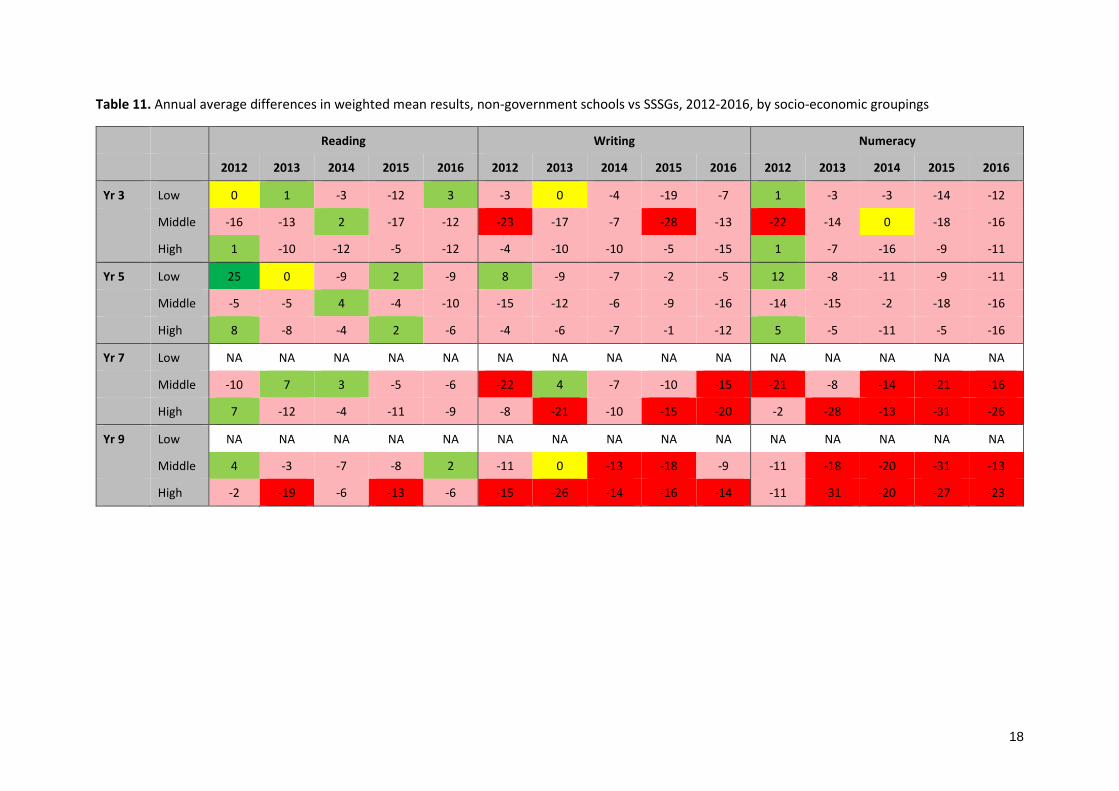
Like the five-year averages, the annual average results (differences in weighted means) raise questions about the NAPLAN performance of non-government schools, particularly in writing and numeracy at the high school level (Table 11). The reading results were reasonably comparable with the SSSG means across the study period and socio-economic groupings, except in the high socio-economic group in Year 9. In writing and numeracy, the data suggest there is a material underperformance issue.
At the primary school level, all annual average results in the three socio-economic groupings in writing and numeracy over the period 2013-2016 were below those of the SSSGs bar two; both of which were the same as the SSSG means. While the average differences largely represented less than 6 months of learning, the consistency of the underperformance raise questions that warrant further investigation. At the high school level, 28 of the 40 mean results from the two socio-economic groupings over the period 2012-2016 were significantly below the equivalent SSSG results and, if anything, the comparative performance of the ACT schools deteriorated over the study period.
18
Table 11. Annual average differences in weighted mean results, non-government schools vs SSSGs, 2012-2016, by socio-economic groupings
Reading Writing Numeracy
2012 2013 2014 2015 2016 2012 2013 2014 2015 2016 2012 2013 2014 2015 2016
Yr 3 Low 0 1 -3 -12 3 -3 0 -4 -19 -7 1 -3 -3 -14 -12
Middle -16 -13 2 -17 -12 -23 -17 -7 -28 -13 -22 -14 0 -18 -16
High 1 -10 -12 -5 -12 -4 -10 -10 -5 -15 1 -7 -16 -9 -11
Yr 5 Low 25 0 -9 2 -9 8 -9 -7 -2 -5 12 -8 -11 -9 -11
Middle -5 -5 4 -4 -10 -15 -12 -6 -9 -16 -14 -15 -2 -18 -16
High 8 -8 -4 2 -6 -4 -6 -7 -1 -12 5 -5 -11 -5 -16
Yr 7 Low NA NA NA NA NA NA NA NA NA NA NA NA NA NA NA
Middle -10 7 3 -5 -6 -22 4 -7 -10 -15 -21 -8 -14 -21 -16
High 7 -12 -4 -11 -9 -8 -21 -10 -15 -20 -2 -28 -13 -31 -26
Yr 9 Low NA NA NA NA NA NA NA NA NA NA NA NA NA NA NA
Middle 4 -3 -7 -8 2 -11 0 -13 -18 -9 -11 -18 -20 -31 -13
High -2 -19 -6 -13 -6 -15 -26 -14 -16 -14 -11 -31 -20 -27 -23

19
3.2.3 Extent of underperformance across non-government schools
As with the government schools, the extent of underperformance across non-government schools was evaluated using the 2/3rds benchmark (the proportion of schools where more than 66% of the average results in each subject and year level were below the equivalent SSSG results) and box and whisker plots to show the distribution of the differences in average results for the sampled non-government schools relative to their SSSGs.
In more than 70% of non-government schools in each year level, 66% or more of their average results were below the equivalent SSSG results (Table 12). In Years 3 and 5, this was the case in 29 of the 38 (76%) schools and 29 of 39 schools (74%) respectively. In Years 7 and 9, in 15 of 19 schools (79%) and 13 of 18 schools (72%) respectively, more than 66% of results were below the equivalent SSSG results. These results suggest that, while the apparent underperformance was not as widespread as in the government sector, there is still a substantial proportion of non-government schools in the ACT that are not performing at a level that is on par with comparable schools.
Table 12. Number of non-government schools with greater than 66% of mean results below equivalent SSSG means, 2012-2016
Number of schools with >66% of mean results below SSSG mean
No. % of schools in year
Yr 3 29 76%
Yr 5 29 74%
Yr 7 15 79%
Yr 9 13 72%
The box and whisker plots of individual school SSSG differences reinforce this finding (Figures 4 and 5). The upper quartile of the differences in results was near zero or negative in many years, particularly in numeracy. The results in numeracy are of considerable concern, with most of the results being significantly below the equivalent SSSG results.

20
Figure 4. Box and whisker plot of differences in mean results, non-government primary schools vs SSSGs (unweighted), 2012-2016*
Reading Writing Numeracy
Yr 3
Yr 5
* In Years 3 and 5, 21 or more NAPLAN points below/above the equivalent SSSG result is the benchmark for a significantly below/above result.
Diffe
renc
e in
mea
n N
APLA
N sc
ore
Diffe
renc
e in
mea
n N
APLA
N sc
ore

21
Figure 5. Box and whisker plot of differences in mean results, non-government high schools vs SSSGs (unweighted), 2012-2016*
Reading Writing Numeracy
Yr 7
Yr 9
* In Years 7 and 9, 13 or more NAPLAN points below/above the equivalent SSSG result is the benchmark for a significantly below/above result.
Diffe
renc
e in
mea
n N
APLA
N sc
ore
Diffe
renc
e n
mea
n N
APLA
N sc
ore

22
4. Discussion
The analysis of the relative NAPLAN performance of government and non-government schools in the ACT supports the following conclusions.
For government schools:
• there was systemic underperformance in government primary and high schools in NAPLAN over the period 2012-2016;
• the underperformance was most pronounced at the high school level and in writing and numeracy;
• the underperformance was relatively consistent across low, middle and high socio-economic schools; and
• the performance of government schools did not show any signs of improvement over the study period, if anything, there was a slight deterioration in performance in numeracy.
For non-government schools:
• there was reasonably widespread underperformance in non-government primary and high schools in NAPLAN over the period 2012-2016;
• the underperformance was most pronounced at the high school level and in numeracy and to a lesser extent writing;
• the underperformance amongst primary non-government schools was not acute but the consistency of the lag behind comparable school results warrants further investigation; and
• at the high school level, there was significant underperformance in numeracy and writing in a substantial number of schools throughout the study period.
Across the ACT school sector, there was an alarming number of schools where the students were, on average, more than 6 months behind the levels of learning of students in other comparable schools. The underperformance was most pronounced in government schools but there was also a material issue at non-government schools. For both government and non-government schools, the extent of underperformance was greatest at the high school level, and in numeracy and writing. Notably, NAPLAN performance was consistently better in reading than the other two subjects.
The ACT Government has been aware of the underperformance of government schools in NAPLAN since at least 2015. The findings here suggest the problems are more widespread than previously thought, extending across the socio-economic spectrum and to non-government schools.
There are a range of possible explanations for the observed underperformance of ACT government and non-government schools in NAPLAN over the study period. These include:
• differences in teaching practices in ACT schools;

23
• differences in the attributes and skills of teachers in ACT schools; • errors in the ICSEA values and SSSG groupings, which are resulting in ACT schools
being compared to schools that have significantly different socio-economic profiles; • differences in the academic expectations in ACT schools; • a greater emphasis being placed on NAPLAN performance and coaching in schools in
other jurisdictions; and • differences in resourcing between ACT schools and those in their SSSGs.
Without further information, it is not possible to reach firm conclusions on which of the potential causes are most material.
There is a need for a government inquiry to be undertaken to determine why ACT schools in the government and non-government sectors are underperforming in NAPLAN relative to their SSSGs, and to devise solutions to the identified problems.
In its 2016 election platform, the ACT Labor Party pledged to undertake an ‘innovative teaching method trial’, stating:
A re-elected ACT Labor government will establish a project to more comprehensively investigate the effectiveness of alternative teaching methods, including teacher-led education, and to assess whether these approaches can improve ACT student outcomes – particularly for those from low socio-economic backgrounds or who speak English as a second language. … As well as providing appropriate school resourcing, it is important to always consider and trial evidence-based new teaching methods and ideas, to continually improve student outcomes.19
To date, this project does not appear to have been initiated. Given the extent of underperformance in NAPLAN, there is a need for trials of evidence-based teaching methods to be initiated in ACT schools as soon as possible.
There is a considerable body of research that already proves that teacher-led approaches (often referred to as ‘direct instruction’) are effective.20 The benefit of the trials is that they could demonstrate to stakeholders in the ACT education system that these approaches work and that they can be readily adopted by teachers. The trials could be commenced on a voluntary basis in government and non-government schools while an inquiry into the causes of the underperformance is ongoing. The fact the underperformance spans both
19 ACT Labor (2016), Supporting Parents and Students: Making Sure Every Student Can Be Their Best. ACT Labor. 20 J. Hattie (2009). Visual Learning: A Synthesis of Over 800 Meta-Analyses Relating to Achievement. Routledge; Education Consumers Foundation (2011). Direct Instruction: What the Research Says. Education Consumers Foundation; F. McMullen and A. Madelaine (2014), ‘Why is there so much resistance to Direct Instruction?’, Australian Journal of Learning Difficulties 19(2), 137-151; NSW Centre for Education Statistics and Evaluation (2015). What works best: Evidence-based practices to help improve NSW student performance, NSW Government; P. Kirschner, J. Sweller and R. Clark (2006) ‘Why minimal guidance during instruction does not work: An analysis of the failure of constructivist, discovery, problem-based, experiential, and inquiry-based teaching’, Educational Psychologist 41(2), 75-86.

24
government and non-government schools provides an opportunity for cross-sectoral cooperation on the diagnoses of the problems and identification and implementation of solutions.
As the analysis presented here demonstrates, NAPLAN is a powerful tool for identifying differences in the academic performance of comparable schools. It can also help in diagnosing the causes of identified differences, in devising solutions to problems, in tracking the impacts of teaching and policy interventions, and in identifying and learning from the successes of high performing schools. Despite offering manifest benefits, the ACT Government has called for NAPLAN to be scrapped and sought to recruit other jurisdictions to the cause. Abandoning NAPLAN would undermine the capacity of teachers, policymakers and researchers to serve students and the broader community in the provision of education services. Rather than abandoning NAPLAN, we recommend greater efforts be devoted to devising better ways of utilising NAPLAN data to assist teaches and students.
5. Conclusions and recommendations
The analysis presented here suggests ACT schools consistently underperformed in NAPLAN tests over the period 2012-2016. The underperformance was most pronounced in government schools but there was also a material performance issue at non-government schools. For both government and non-government schools, the extent of underperformance was greatest at the high school level, and in numeracy and writing. NAPLAN performance was consistently better in reading than the other two subjects. The reasons for this apparent underperformance are unclear and warrant further inquiry.
On the basis of the findings, we recommend:
• the ACT Government initiate a public inquiry, in collaboration with the government and non-government school sectors, into the causes of the observed underperformance in NAPLAN;
• the ACT Government undertake a voluntary trial of teacher-led approaches in government and non-government schools, which includes rigorous and ongoing analysis of the effects of alternative teaching methods on student outcomes; and
• the ACT Government investigate ways it can better utilise NAPLAN data to improve student outcomes.

ANU Law School 5 Fellows Road, Acton ACT 2601