acc report: shale gas and new petrochemicals investment ... · shale gas and new petrochemicals...
TRANSCRIPT

Shale Gas and New Petrochemicals Investment: Benefits for the Economy, Jobs, and US Manufacturing
Economics & Statistics American Chemistry Council March 2011

Table of Contents
Executive Summary 1
Introduction 3
Energy Use and the Chemical Industry 4
The Development of Shale Gas 7
Shale Gas and Industry Competitiveness 12
Methodology and Assumptions 18
Added Output and Job Creation 21
Tax Revenues 23
Future Research 24
Conclusions 24
ACC’s Economics & Statistics Department 25
Appendix Tables 26

1
Executive Summary
Chemistry transforms raw materials into the products and processes that make modern life possible. America’s chemical industry relies on energy derived from natural gas not only to heat and power our facilities, but also as a raw material, or “feedstock,” to develop the thousands of products that make American lives better, healthier, and safer. Access to vast, new supplies of natural gas from previously untapped shale deposits is one of the most exciting domestic energy developments of the past 50 years. After years of high, volatile natural gas prices, the new economics of shale gas are a “game changer,” creating a competitive advantage for U.S. petrochemical manufacturers, leading to greater U.S. investment and industry growth. America’s chemical companies use ethane, a natural gas liquid derived from shale gas, as a feedstock in numerous applications. Its relatively low price gives U.S. manufacturers an advantage over many competitors around the world that rely on naphtha, a more expensive, oil-based feedstock. Growth in domestic shale gas production is helping to reduce U.S. natural gas prices and create a more stable supply of natural gas and ethane. In its new report, Shale Gas and New Petrochemicals Investment: Benefits for the Economy, Jobs and US Manufacturing, the American Chemistry Council (ACC) uncovered a tremendous opportunity for shale gas to strengthen U.S. manufacturing, boost economic output and create jobs. ACC analyzed the impact of a hypothetical, but realistic 25 percent increase in ethane supply on growth in the petrochemical sector. It found that the increase would generate:
17,000 new knowledge-intensive, high-paying jobs in the U.S. chemical industry
395,000 additional jobs outside the chemical industry (165,000 jobs in other industries that are related to the increase in U.S. chemical production and 230,000 jobs from new capital investment by the chemical industry)
$4.4 billion more in federal, state, and local tax revenue, annually ($43.9 billion over 10 years)
A $32.8 billion increase in U.S. chemical production
$16.2 billion in capital investment by the chemical industry to build new petrochemical and derivatives capacity
$132.4 billion in U.S. economic output ($83.4 billion related to increased chemical production (including additional supplier and induced impacts) plus $49.0 billion related to capital investment by the U.S. chemical industry)
The scenario outlined in ACC’s report is corroborated by trends in the chemical industry. ACC member companies, including The Dow Chemical Company, Shell Chemical, LyondellBasell, Bayer MaterialScience and others have announced new investments in U.S. petrochemical capacity to benefit from available resources and grow their chemical businesses. Some of these
2
investments are being made in areas of the country that have been hardest-hit by declines in manufacturing, improving the outlook in economically depressed areas of the country. Further development of the nation’s shale gas and ethane can drive an even greater expansion in domestic petrochemical capacity, provided that policymakers avoid unreasonable restrictions on supply. ACC supports a comprehensive energy policy that promotes energy efficiency and conservation, energy diversity, and expanded domestic oil and natural gas supply, onshore and offshore. The United States must ensure that our regulatory policies allow us to capitalize on shale gas as a vital energy source and manufacturing feedstock, while protecting our water supplies and environment.
3
Introduction This report presents the results of the analysis conducted to quantify the economic impact of the additional production of petrochemicals and downstream chemical products stimulated by an increase in ethane availability. With the development of new shale gas resources, the US petrochemical industry is announcing significant expansions of petrochemical capacity, reversing a decade-long decline. The petrochemical industry is unique in that it consumes energy as a raw material in addition to using energy for fuel and power. With vast new supplies of natural gas liquids from largely untapped shale gas resources, including the Marcellus along the Appalachian mountain chain, a new competitive advantage is emerging for US petrochemical producers. At a time when the United States is facing persistent high unemployment and the loss of high paying manufacturing jobs, these new resources provide an opportunity for new jobs in the petrochemical sector. This report assumes a one-time $16.2 billion private investment over several years in new plant and equipment for manufacturing petrochemicals1. This investment will create jobs and additional output in other sectors of the economy and also will lead to a 25% increase in US petrochemicals capacity and $32.9 billion in additional chemical industry output. In addition to direct effects, indirect and induced effects from these added outputs will lead to an additional $50.6 billion gain elsewhere in the economy. It will create more than 17,000 jobs directly in the chemical industry. These are knowledge-intensive, high-paying jobs, the type of manufacturing jobs that policy-makers would welcome in this economy. In addition to chemical industry jobs, another 165,000 jobs would be created elsewhere in the economy from this chemical industry investment, totaling more than 182,000 jobs. The added jobs created and further output in turn would lead to a gain in federal, state and local tax collections, about $4.4 billion per year, or $43.9 billion over 10 years. Thus, based on a large private investment initiative driven by newly abundant domestic supplies of natural gas, a significant strengthening of the vital US petrochemical industry is possible. A reasonable regulatory regime will facilitate this development, while the wrong policy initiatives could derail this recovery and expansion and associated job creation. The scenario analyzed in this paper that considers a 25% increase in ethane is not merely a thought exercise. New investments in petrochemical capacity to utilize this resource advantage are already being made by chemical companies. The assumptions are reasonable and are consistent with public announcements by companies such as Dow Chemical, Shell Chemical, LyondellBasell and Bayer MaterialScience among others.
In addition to providing a productive and job-creating outlet for increased ethane supplies,
the development of additional cracking capacity has the indirect effect of supporting natural gas development. Because of the recent development of gas from shale formations, the
1 The $16.2 billion capital investment by the chemical industry is based on historical capital-output ratios developed from data
from the Census Bureau.
4
additional supply has pushed down the price of natural gas. Natural gas is an important fuel for home heating and is a vital input to many US manufacturers. Lower natural gas prices, however, also lower the return on investment for shale gas producers. Some shale gas formations, including the Eagle Ford and parts of the Marcellus are rich in natural gas liquids. By providing a market for the co-produced natural gas liquids, ethane in particular, shale gas production remains economic. Energy Use and the Chemical Industry The business of chemistry transforms natural raw materials from earth, water, and air into valuable products that enable safer and healthier lifestyles. Chemistry unlocks nature’s potential to improve the quality of life for a growing and prospering world population by creating materials used in a multitude of consumer, industrial and construction applications. The transformation of simple compounds into valuable and useful materials requires large amounts of energy. The business of chemistry is energy-intensive. This is especially the case for basic chemicals, as well as certain specialty chemical segments (e.g., industrial gases). The largest user of energy is the petrochemical and downstream chemical derivatives business. Inorganic chemicals and agricultural chemicals also are energy-intensive.
5
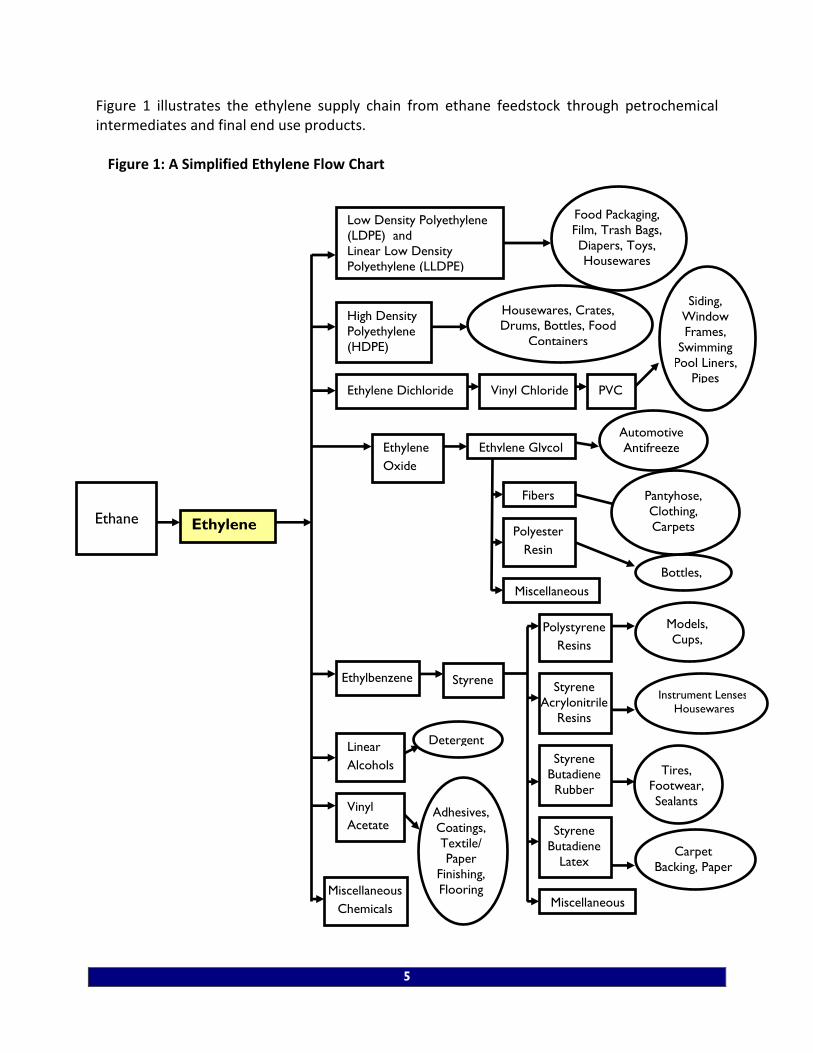
Figure 1 illustrates the ethylene supply chain from ethane feedstock through petrochemical intermediates and final end use products. Figure 1: A Simplified Ethylene Flow Chart
Bottles,
Film
Low Density Polyethylene
(LDPE) and
Linear Low Density
Polyethylene (LLDPE)
Ethylene
Ethane
Miscellaneous
Chemicals
Linear
Alcohols
Ethylbenzene
Fibers
Ethylene
Oxide
Food Packaging,
Film, Trash Bags,
Diapers, Toys,
Housewares
High Density
Polyethylene
(HDPE)
Housewares, Crates,
Drums, Bottles, Food
Containers
Ethylene Dichloride Vinyl Chloride PVC
Siding,
Window
Frames,
Swimming
Pool Liners,
Pipes
Ethylene Glycol Automotive
Antifreeze
Polyester
Resin
Miscellaneous
Pantyhose,
Clothing,
Carpets
Styrene
Polystyrene
Resins
Miscellaneous
Models,
Cups,
Insulation
Styrene
Acrylonitrile
Resins
Instrument Lenses,
Housewares
Styrene
Butadiene
Rubber
Tires,
Footwear,
Sealants
Styrene
Butadiene
Latex Carpet
Backing, Paper
Coatings
Detergent
Vinyl
Acetate Adhesives,
Coatings,
Textile/
Paper
Finishing,
Flooring
6
Unique among manufacturers, the business of chemistry relies upon energy inputs, not only as fuel and power for its operations, but also as raw materials in the manufacture of many of its products. For example, oil and natural gas are raw materials (termed “feedstocks”) for the manufacture of organic chemicals. Petroleum and natural gas contain hydrocarbon molecules that are split apart during processing and then recombined into useful chemistry products. Feedstock use is concentrated in bulk petrochemicals and fertilizers. There are several methods of separating or “cracking” the large hydrocarbon chains found in fossil fuels (natural gas and petroleum). Natural gas is processed to produce methane and natural gas liquids (NGLs) that are contained in the natural gas. These natural gas liquids include ethane, propane, and butane, and are produced mostly via natural gas processing. That is, stripping the NGLs out of the natural gas (which is mostly methane) that is shipped to consumers via pipelines. This largely occurs in the Gulf Coast region and is the major reason the US petrochemicals industry developed in that region. Ethane is a saturated C2 light hydrocarbon; a colorless and odorless gas. It is the primary raw material used as a feedstock in the production of ethylene and competes with other steam cracker feedstocks. Propane is also used as a feedstock but it is more widely used as a fuel. Butane is another NGL feedstock. Petroleum is refined to produce a variety of petroleum products, including naphtha and gas oil, which are the primary heavy liquid feedstocks. Naphtha is a generic term for hydrocarbon mixtures that distill at a boiling range between 70°C and 190°C. The major components include normal and isoparaffins, naphthenes and other aromatics. Light or paraffinic naphtha is the preferred feedstock for steam cracking to produce ethylene, while heavier grades are preferred for gasoline manufacture. Gas oil is another distillate of petroleum. It is an important feedstock for production of middle distillate fuels—kerosene jet fuel, diesel fuel and heating oil—usually after desulfurization. Some gas oil is used as olefin feedstock. Naphtha, gas oil, ethane, propane and butane are processed in large vessels or “crackers”, which are heated and pressurized to crack the hydrocarbon chains into smaller ones. These smaller hydrocarbons are the gaseous petrochemical feedstocks used to make the products of chemistry. In the US petrochemical industry, the organic chemicals with the largest production volumes are methanol, ethylene, propylene, butadiene, benzene, toluene and xylenes. Ethylene, propylene and butadiene are collectively known as olefins, which belong to a class of unsaturated aliphatic hydrocarbons. Olefins contain one or more double bonds, which make them chemically reactive. Benzene, toluene and xylenes are commonly referred to as aromatics, which are unsaturated cyclic hydrocarbons containing one or more rings. Another key petrochemical feedstock -- methane -- is directly converted from the methane in natural gas and does not undergo the cracking process. Methane is directly converted into methanol and ammonia. Olefins, aromatics and methanol are generally referred to as primary petrochemicals, and are the chemical starting point for plastics, pharmaceuticals, electronic materials, fertilizers, and thousands of other products that improve the lives of a growing population.
7
Ethane and propane derived from natural gas liquids are the primary feedstocks used in the United States to produce ethylene, a building block chemical used in thousands of products, such as adhesives, tires, plastics, and more. To illustrate how ethylene is used in the economy, a simplified flow chart is presented in Figure 1. While propane has additional non-feedstock uses, the primary use for ethane is to produce petrochemicals;, in particular, ethylene. Thus, if the ethane supply in the US increases by 25%, it is reasonable to assume that, all things being equal, ethylene supply will also increase by 25%. Ethane is difficult to transport, so it is unlikely that the majority of excess ethane supply would be exported out of the United States. As a result, it is also reasonable to assume that the additional ethane supply will be consumed domestically by the petrochemical sector to produce ethylene. In turn, the additional ethylene and other materials produced from the ethylene are expected to be consumed downstream, for example, by plastic resin producers. This report presents the results of an analysis that quantified the economic impact of the additional production of petrochemicals and downstream chemical products. The report also examines the economic impact of the investment in new plant and equipment needed to enable the petrochemical and derivatives sectors to take advantage of the increased ethane supply. Because the focus of this analysis is the impact of a 25% increase in ethane availability, this analysis does not capture any additional activity that could be generated if methanol and ammonia production were to return or increase to prior levels due to the increased availability of natural gas.
Increased ethane production is already occurring as gas processors build the infrastructure to process and distribute production from shale gas formations. According to the Energy Information Administration (EIA), ethane supply has already grown by roughly 20%. Chemical producers are starting to take advantage of these new ethane supplies with crackers running at 95% of capacity, and several large chemical companies have announced plans to build additional capacity. And because the price of ethane is low relative to oil-based feedstocks used in other parts of the world, US-based chemical manufacturers are contributing to strong exports of petrochemical derivatives and plastics. In 2010, exports in basic chemicals and plastics were up 28% from 2009. The trade surplus in basic chemicals and plastic surged to a record $16.4 billion.
The Development of Shale Gas One of the more interesting developments in the last five years has been the dynamic shift in
natural gas markets. Between the mid-1960s and the mid-2000s, proved natural gas reserves in the United States fell by one-third, the result of restrictions on drilling and other supply constraints. Starting in the 1990s, government promoted the use of natural gas as a clean fuel, and with fixed supply and rising demand from electric utilities, a natural gas supply shortage occurred, causing prices to rise from an average of $1.92 per thousand cubic feet in the 1990s to $7.33 in 2005. Rising prices were exacerbated by the effects of hurricanes Katrina and Rita in
8
2005, which sent prices over $12.00 per thousand cubic feet for several months due to damage to gas production facilities.
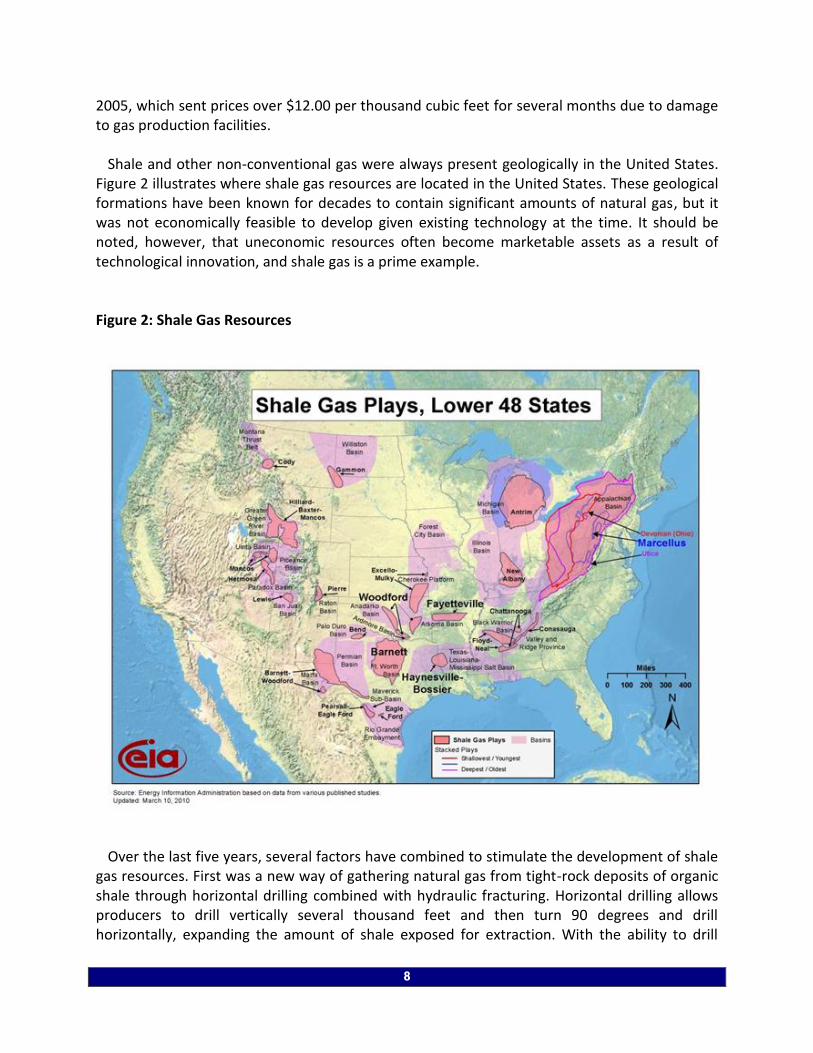
Shale and other non-conventional gas were always present geologically in the United States. Figure 2 illustrates where shale gas resources are located in the United States. These geological formations have been known for decades to contain significant amounts of natural gas, but it was not economically feasible to develop given existing technology at the time. It should be noted, however, that uneconomic resources often become marketable assets as a result of technological innovation, and shale gas is a prime example.
Figure 2: Shale Gas Resources
Over the last five years, several factors have combined to stimulate the development of shale
gas resources. First was a new way of gathering natural gas from tight-rock deposits of organic shale through horizontal drilling combined with hydraulic fracturing. Horizontal drilling allows producers to drill vertically several thousand feet and then turn 90 degrees and drill horizontally, expanding the amount of shale exposed for extraction. With the ability to drill
9
horizontally, multiple wells from one drilling pad (much likes spokes on a wheel) are possible, resulting in a dramatic expansion of shale available for extraction, which significantly boosts productivity. A typical well might drill 1½ miles beneath the surface and then laterally 2,000-6,000 feet.
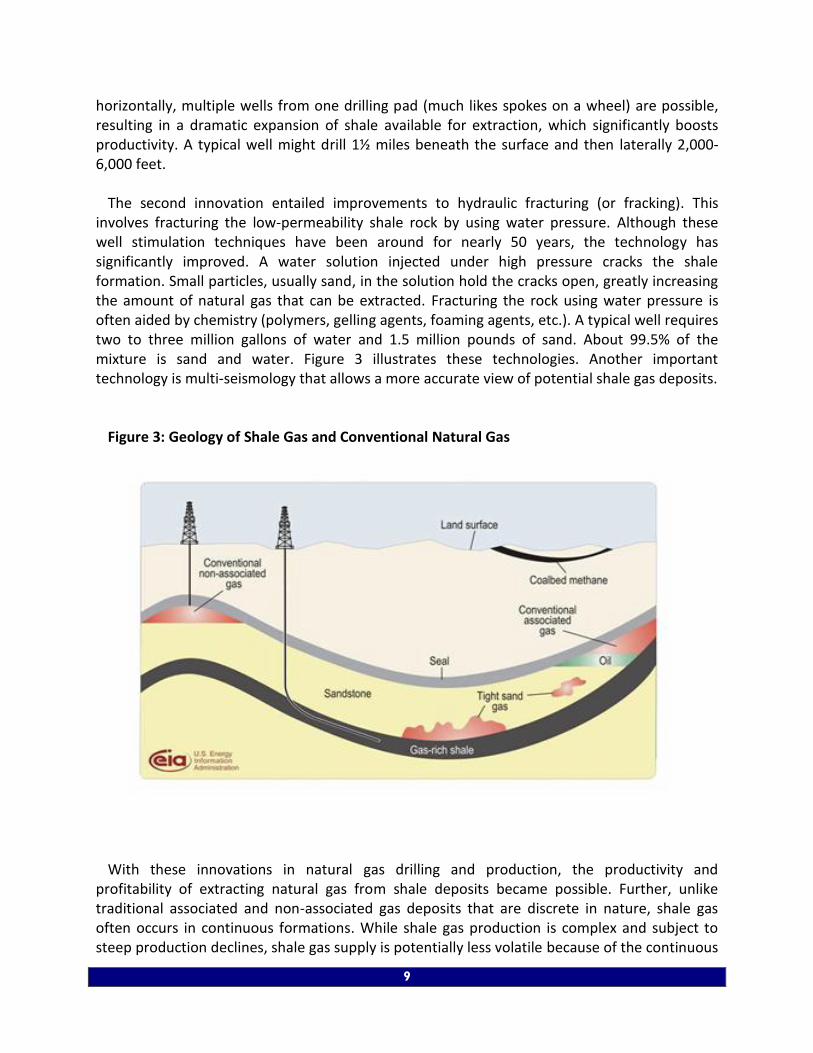
The second innovation entailed improvements to hydraulic fracturing (or fracking). This
involves fracturing the low-permeability shale rock by using water pressure. Although these well stimulation techniques have been around for nearly 50 years, the technology has significantly improved. A water solution injected under high pressure cracks the shale formation. Small particles, usually sand, in the solution hold the cracks open, greatly increasing the amount of natural gas that can be extracted. Fracturing the rock using water pressure is often aided by chemistry (polymers, gelling agents, foaming agents, etc.). A typical well requires two to three million gallons of water and 1.5 million pounds of sand. About 99.5% of the mixture is sand and water. Figure 3 illustrates these technologies. Another important technology is multi-seismology that allows a more accurate view of potential shale gas deposits.
Figure 3: Geology of Shale Gas and Conventional Natural Gas
With these innovations in natural gas drilling and production, the productivity and
profitability of extracting natural gas from shale deposits became possible. Further, unlike traditional associated and non-associated gas deposits that are discrete in nature, shale gas often occurs in continuous formations. While shale gas production is complex and subject to steep production declines, shale gas supply is potentially less volatile because of the continuous
10
nature of shale formations. Many industry observers suggest that the current state of shale gas operations are more closely analogous to manufacturing operations than traditional oil and gas exploration, development and production.
The United States is now estimated to possess 2,552 trillion cubic feet (TCF) of natural gas
reserves, 32% of which is shale gas (827 TCF) that no one knew how to extract economically as recently as five years ago. This translates into an additional supply of 36 years at current rates of consumption of about 23 TCF per year. Total US natural gas resources are estimated to be large enough to supply over 100 years of demand. In less than two years, the US has sharply reduced gas imports from Canada and liquefied natural gas (LNG) receipts. These new technical discoveries have vastly expanded reserves and will offset declines in conventional associated natural gas production.
To date, the Barnett, Haynesville, and Woodford basins have received the most attention. But
not all shale gas formations are identical: some have little or no NGLs. Haynesville is reported to be mostly dry, while Barnet has dry and rich NGL regions. The Eagle Ford shale formation in Texas is close to the existing petrochemical industry and infrastructure and portions are reported to be rich in ethane and other NGLs. The liquids content adds another layer of complexity and economic attractiveness to the shale gas growth story. More recently, the Marcellus basin (by some estimates the largest known shale deposit in the world) has witnessed significant development. Portions of this formation are rich in NGLs but at a distance from the Gulf Coast where much of the existing petrochemical industry exists. Significant development of infrastructure (pipelines, ethane recovery, etc.) would be needed and could also include investment in petrochemical and derivatives capacity. Thus, areas in western Pennsylvania, New York and/or West Virginia could become the next US petrochemical hub. The governor of West Virginia, for example, has recently formed the Marcellus to Manufacturing Task Force to harness business opportunities surrounding development of the Marcellus basin. In addition, the Eagle Ford shale formation in Texas is close in location to the US petrochemical industry (and infrastructure) in the Gulf Coast and reported to be rich in ethane and other NGLs. Better returns from extracting and marketing liquids could provide an added incentive for shale investment beyond profits arising from the thermal value of natural gas from shale deposits.
Higher prices for natural gas in the last decade (especially after hurricanes Katrina and Rita)
and the advances in horizontal drilling and hydraulic fracturing (i.e., chemistry in action) changed the dynamics for economic shale gas extraction. The latter technologies allowed extraction of shale gas at about $7.00 per thousand cubic feet, which was well below prices of natural gas during the time just after the hurricanes. With new economic viability, natural gas producers responded by drilling, setting off a “shale gas rush”, and as learning curve effects took hold, the cost to extract shale gas (including return on capital) fell, making even more supply (and demand) available at lower cost. Although the path was irregular, average daily consumption of natural gas rose from 60.3 billion cubic feet (BCF) per day in 2005 to 62.0 BCF per day in 2009. Moreover, since the mid-2000s, US-proved natural gas reserves have risen by one-third. In economists’ terms, the supply curve shifted to the right, resulting in lower prices
11
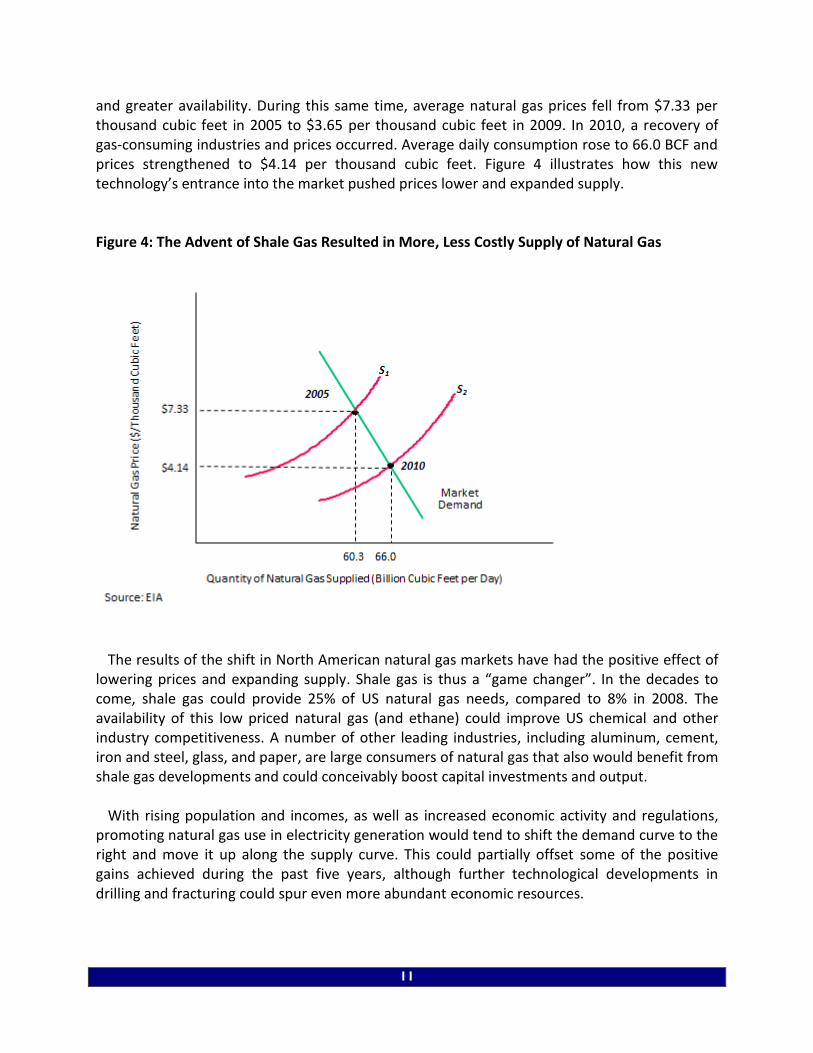
and greater availability. During this same time, average natural gas prices fell from $7.33 per thousand cubic feet in 2005 to $3.65 per thousand cubic feet in 2009. In 2010, a recovery of gas-consuming industries and prices occurred. Average daily consumption rose to 66.0 BCF and prices strengthened to $4.14 per thousand cubic feet. Figure 4 illustrates how this new technology’s entrance into the market pushed prices lower and expanded supply. Figure 4: The Advent of Shale Gas Resulted in More, Less Costly Supply of Natural Gas
The results of the shift in North American natural gas markets have had the positive effect of
lowering prices and expanding supply. Shale gas is thus a “game changer”. In the decades to come, shale gas could provide 25% of US natural gas needs, compared to 8% in 2008. The availability of this low priced natural gas (and ethane) could improve US chemical and other industry competitiveness. A number of other leading industries, including aluminum, cement, iron and steel, glass, and paper, are large consumers of natural gas that also would benefit from shale gas developments and could conceivably boost capital investments and output.
With rising population and incomes, as well as increased economic activity and regulations,
promoting natural gas use in electricity generation would tend to shift the demand curve to the right and move it up along the supply curve. This could partially offset some of the positive gains achieved during the past five years, although further technological developments in drilling and fracturing could spur even more abundant economic resources.
12
The use of hydraulic fracturing in conjunction with horizontal drilling has opened up resources in low permeability formations that would not be commercially viable without this technology, but there are some policy risks. Some public concern, however, has been raised regarding hydraulic fracturing due to the large volumes of water and potential contamination of underground aquifers used for drinking water, although fracking occurs well below drinking water resources. Limiting the use of hydraulic fracturing would impact natural gas production from low permeability reservoirs. Ill-conceived policies that restrict supply or artificially boost demand are also risks. Local bans or moratoria could present barriers to private sector investment. A final issue is the need for additional gathering, transport and processing infrastructure. The Marcellus and some other shale gas deposits are located outside the traditional natural gas supply infrastructure to access the shale gas.
The United States must ensure that our regulatory policies allow us to capitalize on shale gas
as a vital energy source and manufacturing feedstock, while protecting our water supplies and environment. We support state-level oversight of hydraulic fracturing, as state governments have the knowledge and experience to oversee hydraulic fracturing in their jurisdictions. We are committed to transparency regarding the disclosure of the chemical ingredients of hydraulic fracturing solutions, subject to the protection of proprietary information.
Shale Gas and Industry Competitiveness The developments in shale gas will engender the wider availability of low cost, domestic
energy. Because US petrochemicals predominantly use ethane and other natural gas liquids, the competitiveness of the industry is heavily dependent upon the price of these liquids and US natural gas, as well as the price of competitive feedstocks.
As a rough rule of thumb, when the ratio of the price of oil to the price of natural gas is more
than 7:1, the competitiveness of Gulf Coast-based petrochemicals and derivatives vis-à-vis other major producing regions is enhanced. In the United States, over 85% of ethylene, for example, is derived from natural gas liquids while in Western Europe over 70% is derived from naphtha, gas oil and other light distillate oil-based products.
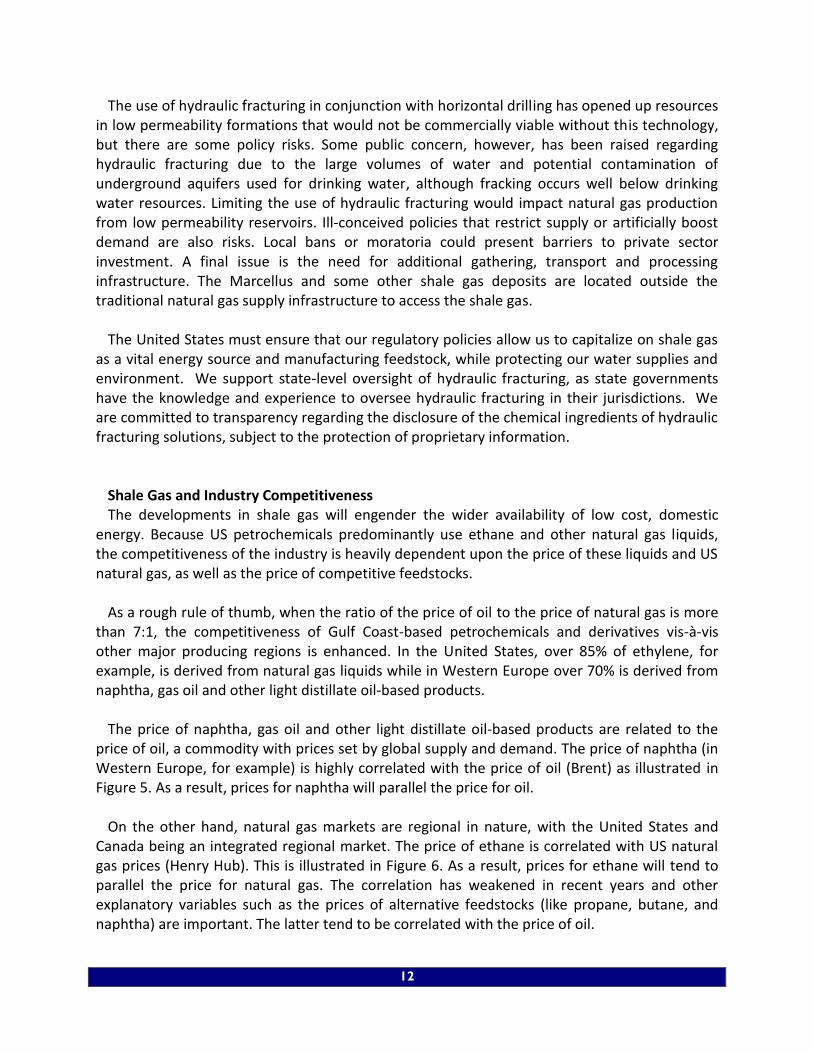
The price of naphtha, gas oil and other light distillate oil-based products are related to the
price of oil, a commodity with prices set by global supply and demand. The price of naphtha (in Western Europe, for example) is highly correlated with the price of oil (Brent) as illustrated in Figure 5. As a result, prices for naphtha will parallel the price for oil.
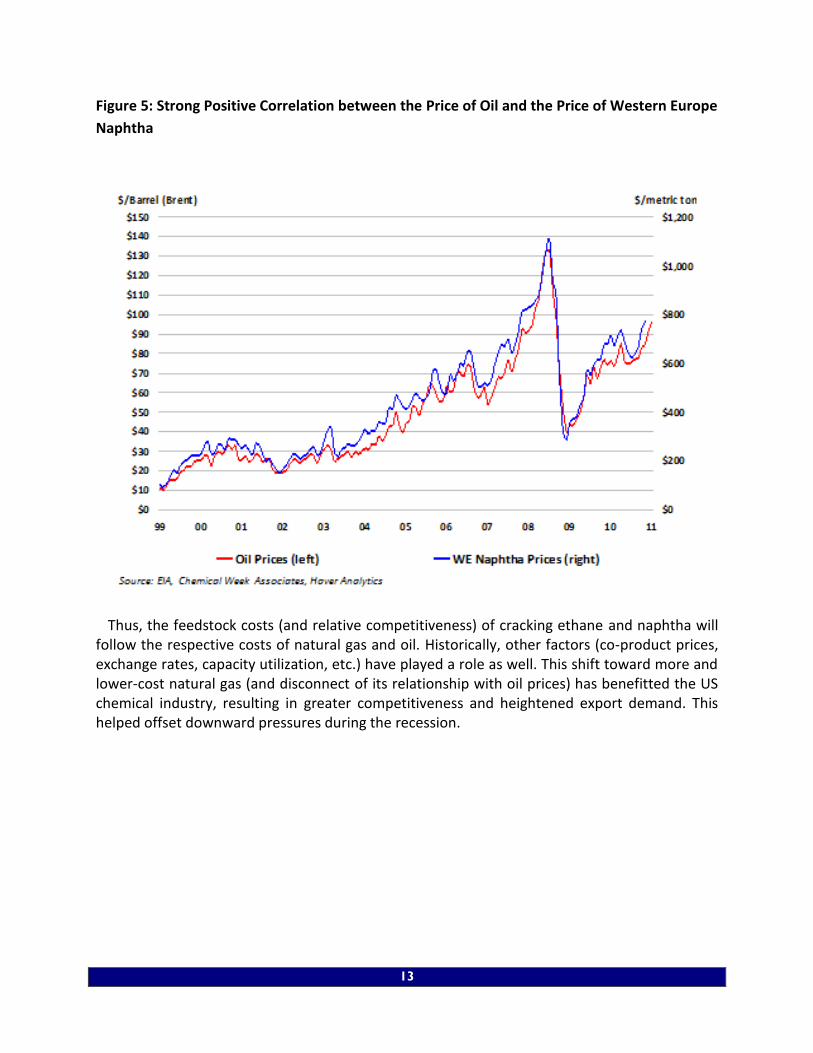
On the other hand, natural gas markets are regional in nature, with the United States and
Canada being an integrated regional market. The price of ethane is correlated with US natural gas prices (Henry Hub). This is illustrated in Figure 6. As a result, prices for ethane will tend to parallel the price for natural gas. The correlation has weakened in recent years and other explanatory variables such as the prices of alternative feedstocks (like propane, butane, and naphtha) are important. The latter tend to be correlated with the price of oil.
13
Figure 5: Strong Positive Correlation between the Price of Oil and the Price of Western Europe
Naphtha
Thus, the feedstock costs (and relative competitiveness) of cracking ethane and naphtha will
follow the respective costs of natural gas and oil. Historically, other factors (co-product prices, exchange rates, capacity utilization, etc.) have played a role as well. This shift toward more and lower-cost natural gas (and disconnect of its relationship with oil prices) has benefitted the US chemical industry, resulting in greater competitiveness and heightened export demand. This helped offset downward pressures during the recession.
14
Figure 6: Positive Correlation between the Price of US Ethane and the Price of Natural Gas
Figure 7 shows the long-term trend in the oil-to-gas ratio, from 1970 through 2015. The early-
2000s represent a period in which US petrochemicals were facing competitive challenges. This was in contrast to the 1970s and the period through early-1990s, when US natural gas prices were low and oil prices were high, the latter the result of the Gulf War. In the 1990s, US energy policy favored use of natural gas in electricity generation but did little to address supply. In late-2000, the first of several large price spikes occurred, resulting in higher US natural gas prices as US supply was constrained. This continued during the next five or so years, with subsequent natural gas price spikes pushing the oil-to-gas ratio down to levels associated with non-competitiveness. At that time there were numerous concerns about the long-term viability of the US petrochemical industry. Moreover, a number of plant closures occurred during this period and investment flowed to the Middle East and other “remote gas” locations.

15
Figure 7: Oil-to-Gas Ratio: A Proxy for US Gulf Coast Competitiveness
As noted, with several shale gas technological developments, learning curve effects, and the
hurricanes of 2005 (and subsequent spikes in natural gas prices) the oil-to-gas relationship began to change. With the development of low cost shale gas resources in the United States, the oil-to-gas ratio has improved, from a non-competitive ratio of 5.5:1 in 2003 and 6.3:1 in 2005 to 15.9:1 in 2009 and 17.9:1 in 2010. The current ratio is very favorable for US competitiveness and exports of petrochemicals, plastics and other derivatives. Abundant availability and economic viability of shale gas at prices suggests a continued crude oil-natural gas price disconnect. Moreover, forecasters at the EIA and energy consultants expect high oil-to-gas ratios to continue.
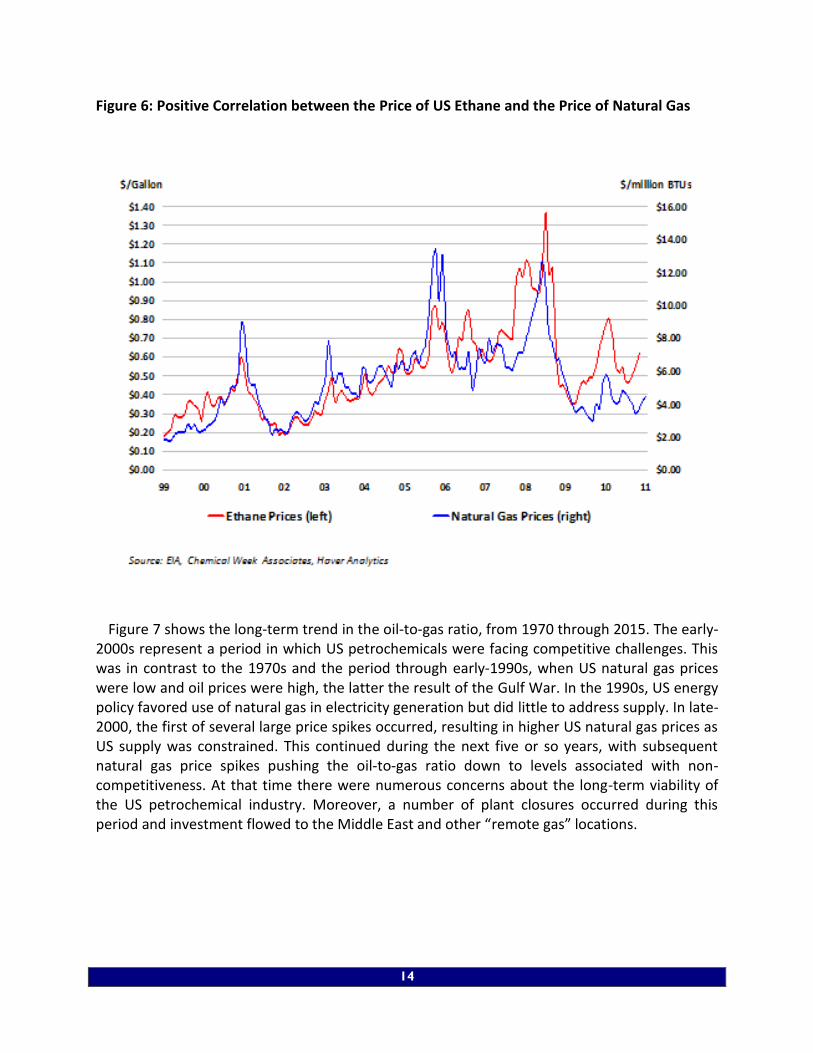
Figure 8 illustrates the changing dynamics of natural gas relative to oil from a more long-term
perspective. The chart measures the real price of oil (in constant 2009 dollars) relative to this oil-to-gas ratio for the years 1974 through 2010. Five-year moving averages are employed to better illustrate these trends. When the oil-to-gas ratio is high, US Gulf Coast petrochemicals are generally advantaged, as they largely were from 1974 through the late-1990s. But with the promotion of natural gas demand and supply constraints, the situation worsened last decade. Moreover, the real price of oil rose during the past 10 years, which led to advantages among remote locations with abundant natural gas, most notably in the Middle East. With the advent
16
of shale gas, the US petrochemical competitive position is once again evolving, returning closer to the situation which prevailed during the 1980s, when oil prices were relatively high compared to natural gas prices.
Figure 8: Real Price of Oil and Oil-to-Gas Ratio
Figure 9 illustrates a global petrochemical cost curve for 2010. Using data for 26 major
nations and sub-regions, the curve reflects the differences in plant capacity and feedstock slates and shows how the US has moved to a globally competitive position2. The scale is not included in Figure 9 as the figure is only intended to illustrate the short-run supply curve. The cost curve is built on the cumulative petrochemical capacity from the lowest cost producers (in the Middle East) to the highest cost producers (in Northeast Asia). While the Middle Eastern
2 Petrochemical costs vary depending on historical feedstock costs, by-product credits, cost of fuels and other utilities, hourly
wages and staffing levels, other variable operating costs, and fixed costs as well as differences in operating rates. The vertical axis reflects the cash (or variable) costs on a per pound basis while the horizontal axis reflects the corresponding capacity for the country or region.

17
facilities are substantially advantaged relative to the marginal producers their competitiveness is almost comparable to US ethane-based producers. In the 2010, the Northeast Asian and Western European producers appear to be the least competitive. The latter are not only high-cost producers but also have smaller facilities with an average age of around 35 years resulting in substantially higher maintenance spending relative to their global competitors. As recently as 2005, the United States ranked behind Western Europe. With the revolution in shale gas, US producers have moved down the cost curve and now, rank behind Canada and the Middle East.
Figure 9: Typical Petrochemical Cost Curve by Country/Region, 2010
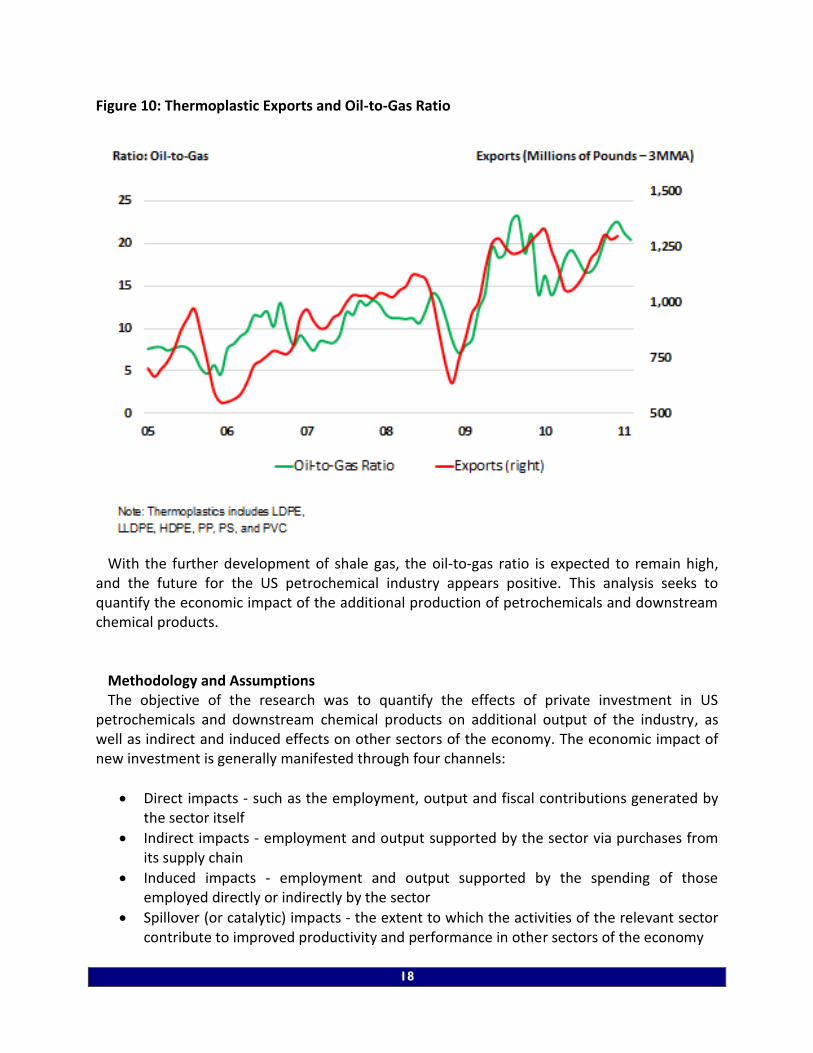
Figure 10 illustrates the competitive dynamics of petrochemicals and derivatives by examining the strong correlation between thermoplastic exports (as measured in millions of pounds) and the oil-to-gas ratio. As a result of shale gas (and weak industrial demand for gas), the US oil-to- gas ratio has been above 7:1 for several years. The ratio of oil prices to natural gas prices has been over 22:1 recently. This position is very favorable for US competitiveness and exports of petrochemicals, plastics and other derivatives. In 2010, the US Gulf Coast cost position improved so much that the region now is second only to the Middle East in terms of competitiveness. As a result, for example, US plastic exports are up nearly 10% due to this improved position. Furthermore, ethane supplies are tightening in the Middle East and are constrained. The era of low-cost feedstocks is over for some producing nations in that region. This will also aid US competitiveness and may induce capital investment in the United States.
$0.00
$0.10
$0.20
$0.30
$0.40
$0.50
$0.60
$0.70
$0.80
$0.90
$1.00
50 75 100 125 150 175 200 225 250 275 300 325Cumulative Supply Quantity (Billion Pounds)
Cash Costs ($/Pound)
Middle East
Canada
United States
China
Western Europe
Japan
Other Northeast Asia
Low
Low
High
High
18
Figure 10: Thermoplastic Exports and Oil-to-Gas Ratio
With the further development of shale gas, the oil-to-gas ratio is expected to remain high,
and the future for the US petrochemical industry appears positive. This analysis seeks to quantify the economic impact of the additional production of petrochemicals and downstream chemical products.
Methodology and Assumptions
The objective of the research was to quantify the effects of private investment in US petrochemicals and downstream chemical products on additional output of the industry, as well as indirect and induced effects on other sectors of the economy. The economic impact of new investment is generally manifested through four channels:
Direct impacts - such as the employment, output and fiscal contributions generated by the sector itself
Indirect impacts - employment and output supported by the sector via purchases from its supply chain
Induced impacts - employment and output supported by the spending of those employed directly or indirectly by the sector
Spillover (or catalytic) impacts - the extent to which the activities of the relevant sector contribute to improved productivity and performance in other sectors of the economy
19
The analysis focused on the first three channels. Spillover (or catalytic) effects would occur
from new investment in petrochemicals, but these positive externalities are difficult to quantify and thus were not examined in the analysis. These positive effects could include heightened export demand and the impacts on the chemical industry from renewed activity among domestic end-use customer industries. Due to model limitations, the impact on exports cannot be separately identified, but clearly, increased production of petrochemicals would likely lead to higher exports because of enhanced competitiveness.
In addition to added output, the effects on employment and tax revenues also were assessed.
To accomplish the goals of the analysis, a robust model of the direct, indirect and other economic effects is needed, as well as reasonable assumptions and parameters of the analysis. To estimate the economic impacts from increasing investment in US petrochemicals production, the IMPLAN model was used. The IMPLAN model is an input-output model based on a social accounting matrix that incorporates all flows within an economy. The IMPLAN model includes detailed flow information for 440 industries. As a result, it is possible to estimate the economic impact of a change in final demand for an industry at a relatively fine level of granularity. For a single change in final demand (i.e., change in industry spending), IMPLAN can generate estimates of the direct, indirect and induced economic impacts. Direct impacts refer to the response of the economy to the change in the final demand of a given industry to those directly involved in the activity. Indirect impacts (or supplier impacts) refer to the response of the economy to the change in the final demand of the industries that are dependent on the direct spending industries for their input. Induced impacts refer to the response of the economy to changes in household expenditure as a result of labor income generated by the direct and indirect effects.
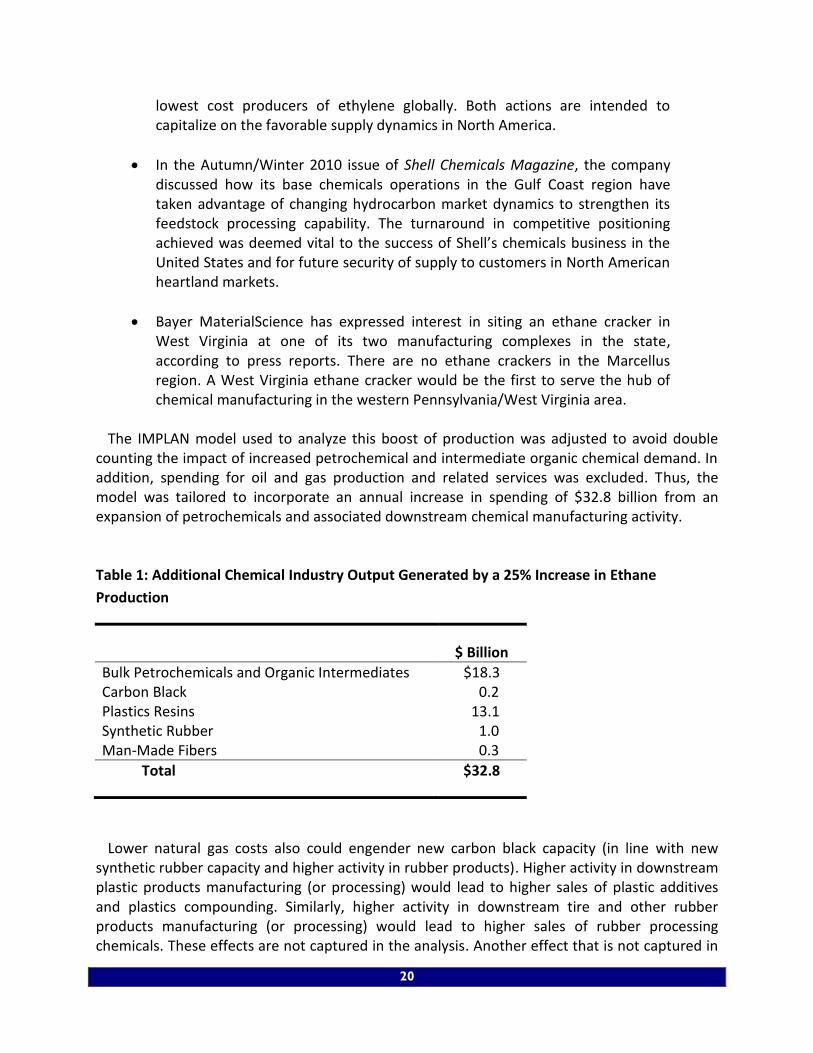
The analysis was broken into two parts: the one-time change in final demand that occurs during the initial capital investment phase when new plant and equipment are purchased and the ongoing change in final demand that occurs with a 25% increase in ethane production in the United States. It was assumed that production of ethylene and downstream plastics resins would experience a similar increase. Since 99% of all US ethane supply goes into ethylene production, and over 82% of ethylene goes into plastic resins, this linear relationship is a reasonable assumption. Other ethylene derivatives (synthetic rubber, polyolefins, etc.) production is expected to expand as well, but not by as much. Table 1 details the additional chemical industry output generated by a 25% increase in ethane production. The assumption that production of ethylene will increase is reasonable and consistent with public announcements by companies such as Dow Chemical, Shell Chemical, LyondellBasell and Bayer MaterialScience, among others.
In December 2010, Dow Chemical announced it will increase ethane cracking capability on the US Gulf Coast by 20% to 30% over the next two to three years, and is reviewing options for building a natural gas liquids (NGL) fractionator to secure ethane supplies. The latter provides a new source of NGL supplies, helping to position U.S. petrochemical companies as one of the
20
lowest cost producers of ethylene globally. Both actions are intended to capitalize on the favorable supply dynamics in North America.
In the Autumn/Winter 2010 issue of Shell Chemicals Magazine, the company discussed how its base chemicals operations in the Gulf Coast region have taken advantage of changing hydrocarbon market dynamics to strengthen its feedstock processing capability. The turnaround in competitive positioning achieved was deemed vital to the success of Shell’s chemicals business in the United States and for future security of supply to customers in North American heartland markets.
Bayer MaterialScience has expressed interest in siting an ethane cracker in West Virginia at one of its two manufacturing complexes in the state, according to press reports. There are no ethane crackers in the Marcellus region. A West Virginia ethane cracker would be the first to serve the hub of chemical manufacturing in the western Pennsylvania/West Virginia area.
The IMPLAN model used to analyze this boost of production was adjusted to avoid double
counting the impact of increased petrochemical and intermediate organic chemical demand. In addition, spending for oil and gas production and related services was excluded. Thus, the model was tailored to incorporate an annual increase in spending of $32.8 billion from an expansion of petrochemicals and associated downstream chemical manufacturing activity.
Table 1: Additional Chemical Industry Output Generated by a 25% Increase in Ethane
Production
$ Billion
Bulk Petrochemicals and Organic Intermediates $18.3 Carbon Black 0.2 Plastics Resins 13.1 Synthetic Rubber 1.0 Man-Made Fibers 0.3
Total $32.8
Lower natural gas costs also could engender new carbon black capacity (in line with new
synthetic rubber capacity and higher activity in rubber products). Higher activity in downstream plastic products manufacturing (or processing) would lead to higher sales of plastic additives and plastics compounding. Similarly, higher activity in downstream tire and other rubber products manufacturing (or processing) would lead to higher sales of rubber processing chemicals. These effects are not captured in the analysis. Another effect that is not captured in
21
the analysis is the improved competitive position which would result in higher chemical exports.
Because the model does not include the effects of the investment needed to produce the
added $32.8 billion output of petrochemicals that would be generated by the 25% increase in ethane supply, the value of the capital investment was separately estimated. Based on the economics and chemical engineering literature, typical capital-output ratios were estimated to range from 0.27:1 to 0.73:1. That is, $1.0 billion in added petrochemical and derivative output could require new capital investment ranging from $270 million to $730 million. Data sources for calculating these capital-output ratios include the Quarterly Financial Report prepared by the US Census Bureau, fixed asset and industry data from the Bureau of Economic Analysis (BEA), and the Corporation Sourcebook prepared by the Statistics of Income Division of the Internal Revenue Service. The capital-output ratio of 0.49:1 that was used was based on an average of ratios calculated. That is, $1.0 billion in added petrochemical and derivative output would require new capital investment on the order of $490 million. The scope of the analysis was limited to the chemical sector and did not include the investment or business activity generated by the extraction, recovery or infrastructure related to delivery of the ethane to chemical plants. It also did not include the effects from investment in development and production of shale gas nor pipeline and other infrastructure development.
The results of the analysis indicate that the added $32.8 billion output of petrochemicals and
derivatives would necessitate new capital investment of $16.2 billion. These investments could be a combination of debottlenecking, brownfield and greenfield projects. The composition by asset type for this capital investment was derived using the average historical mix for the chemical industry’s expenditures for fixed assets. The fixed asset data from the BEA was used. These assumed spending by asset type were assigned to the appropriate NAICS industry and the IMPLAN model was re-run to incorporate the effects of the new investment. Effects on added output, jobs, and tax revenues from the new investment spending were assumed to be a one-time impact and were modeled as such. Although the spending would likely occur over the period of three years, distinct phases in the project are likely, with engineering and design occurring early, followed by equipment procurement, and then construction and installation. Some overlap of construction activity is possible but assumed to be modest in scope.
Added Output and Job Creation The output and employment generated by additional ethane utilization in the petrochemical
and derivative industries is significant. The additional $32.8 billion in chemical industry activity would generate over 17,000 high-paying, desirable jobs in the chemical industry. Innovative, creative and pacesetting, the business of chemistry is one of the most knowledge-intensive industries in the manufacturing sector. “Knowledge worker” is a term that was originally coined by management guru, Peter Drucker, several decades ago. It refers to employees with university degrees/training whose principal tasks involve the development or application of specialized knowledge in the workplace. A study by Industry Canada showed that 38% of all

22
employees in the US business of chemistry have at a minimum, a university degree. This is nearly double the average in US manufacturing.
Table 2: Economic Impact from Expanded Production of Petrochemical and Derivatives from a 25% Increase in Ethane Production
Impact Type Employment Payroll
($ Billion) Output
($ Billion)
Direct Effect 17,017 $2.4 $32.8
Indirect Effect 79,870 6.6 36.9 Induced Effect 85,563 4.1 13.7
Total Effect 182,450 $13.1 $83.4
In addition, the increased use of ethane by the chemical industry would generate purchases
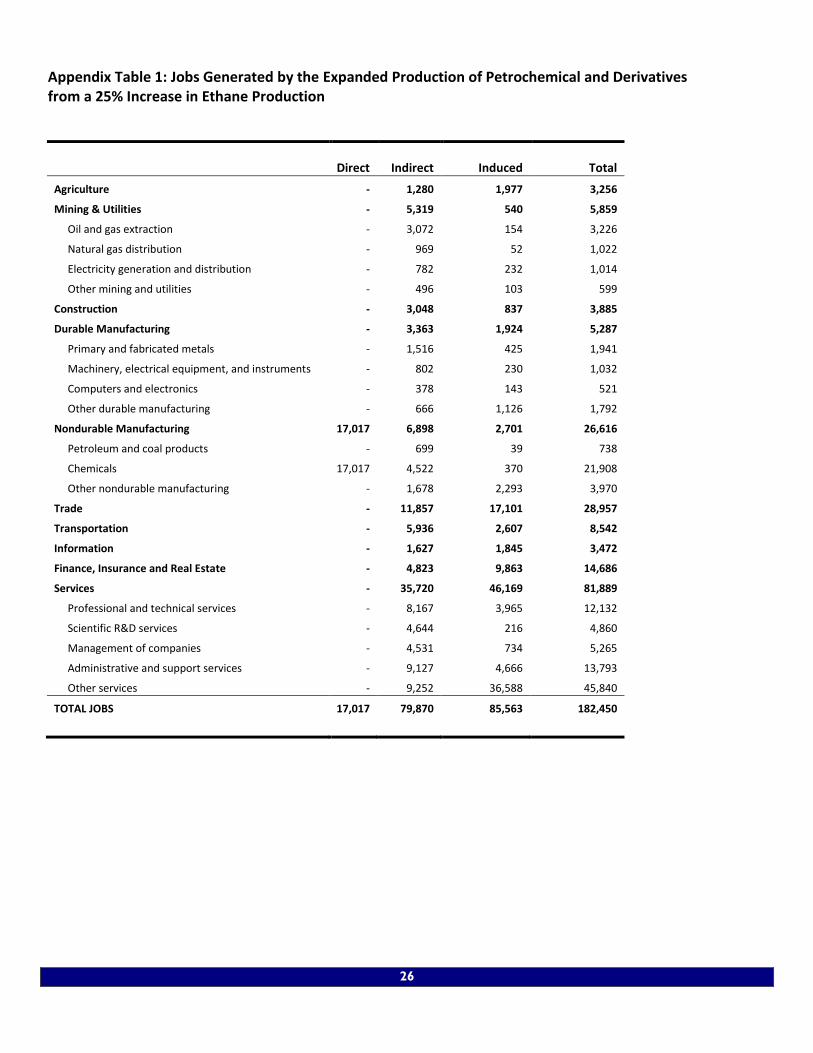
of raw materials, services, and other supplies throughout the supply chain. Thus, nearly another 80,000 indirect jobs would be supported by the boost in ethane production. Finally, the wages earned by new workers in the chemical industry and workers throughout the supply chain are spent on household purchases and taxes generating more than 85,000 jobs induced by the response of the economy to changes in household expenditure as a result of labor income generated by the direct and indirect effects. All told, the additional $32.8 billion in chemical industry output from a 25% increase in ethane production would generate $83.4 billion in output to the economy and more than 182,000 new jobs in the United States generating a payroll of $13.1 billion. This comes at a time when 15 million Americans are out of work. Moreover, the new jobs would primarily be in the private sector. A detailed table on jobs created by industry is presented in Appendix Table 1.
Table 3: Economic Impact from New Investment in Plant and Equipment
Impact Type Employment
Payroll
($ Billion)
Output
($ Billion)
Direct Effect 54,094 $4.3 $16.2 Indirect Effect 74,479 5.1 16.8 Induced Effect 100,549 4.8 16.1
Total Effect 229,122 $14.2 $49.0
Following a decade of contraction in the petrochemical sector, new plant and equipment
would be required to use the additional feedstock supplies. A one-time $16.2 billion investment
23
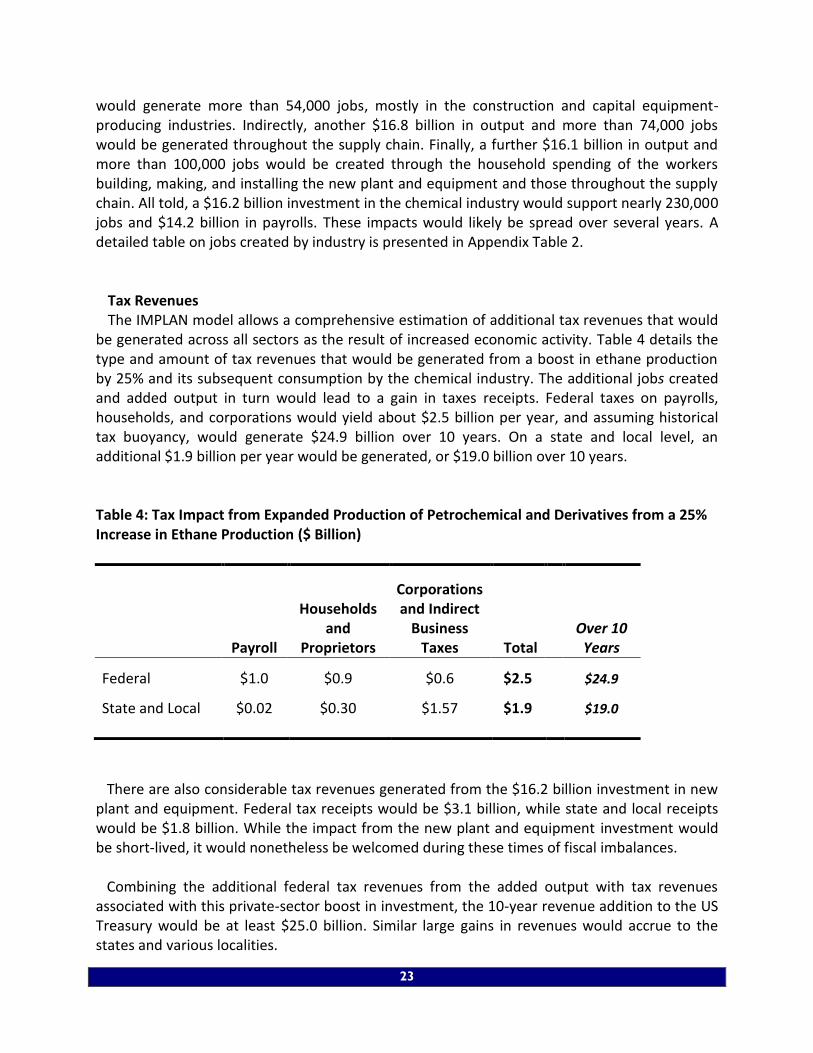
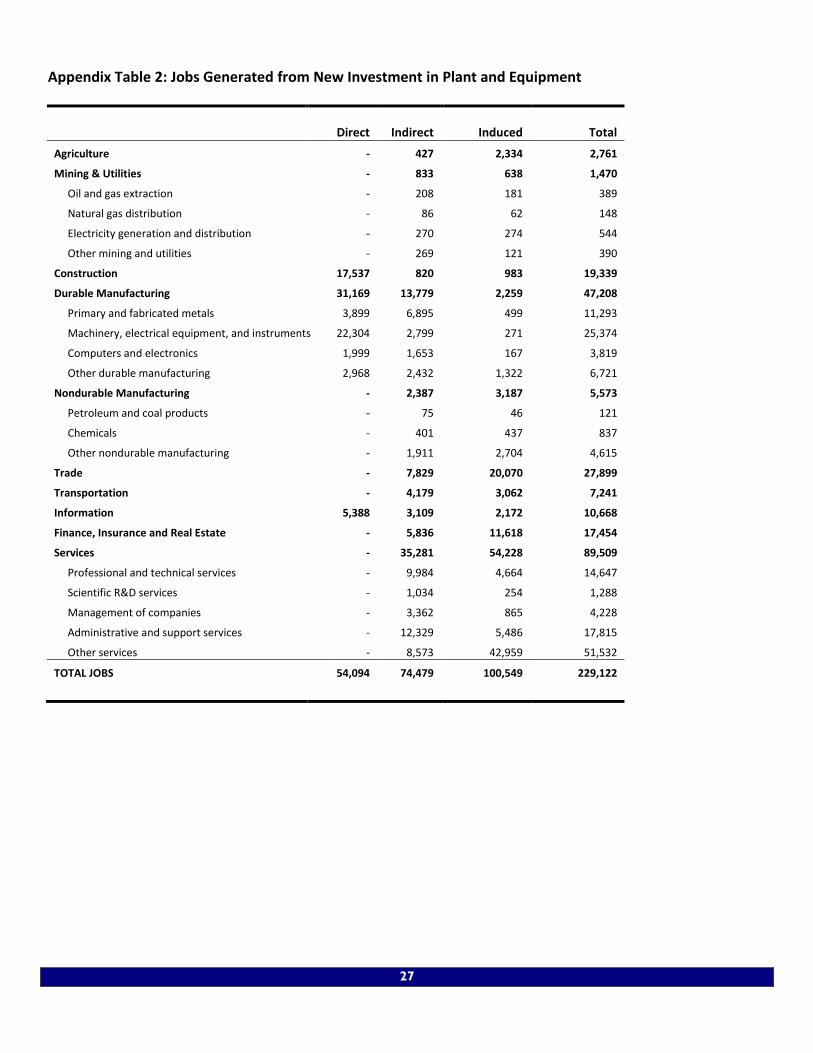
would generate more than 54,000 jobs, mostly in the construction and capital equipment-producing industries. Indirectly, another $16.8 billion in output and more than 74,000 jobs would be generated throughout the supply chain. Finally, a further $16.1 billion in output and more than 100,000 jobs would be created through the household spending of the workers building, making, and installing the new plant and equipment and those throughout the supply chain. All told, a $16.2 billion investment in the chemical industry would support nearly 230,000 jobs and $14.2 billion in payrolls. These impacts would likely be spread over several years. A detailed table on jobs created by industry is presented in Appendix Table 2.
Tax Revenues The IMPLAN model allows a comprehensive estimation of additional tax revenues that would
be generated across all sectors as the result of increased economic activity. Table 4 details the type and amount of tax revenues that would be generated from a boost in ethane production by 25% and its subsequent consumption by the chemical industry. The additional jobs created and added output in turn would lead to a gain in taxes receipts. Federal taxes on payrolls, households, and corporations would yield about $2.5 billion per year, and assuming historical tax buoyancy, would generate $24.9 billion over 10 years. On a state and local level, an additional $1.9 billion per year would be generated, or $19.0 billion over 10 years. Table 4: Tax Impact from Expanded Production of Petrochemical and Derivatives from a 25% Increase in Ethane Production ($ Billion)
Payroll
Households and
Proprietors
Corporations and Indirect
Business Taxes Total
Over 10 Years
Federal $1.0 $0.9 $0.6 $2.5
$24.9
State and Local $0.02 $0.30 $1.57 $1.9
$19.0
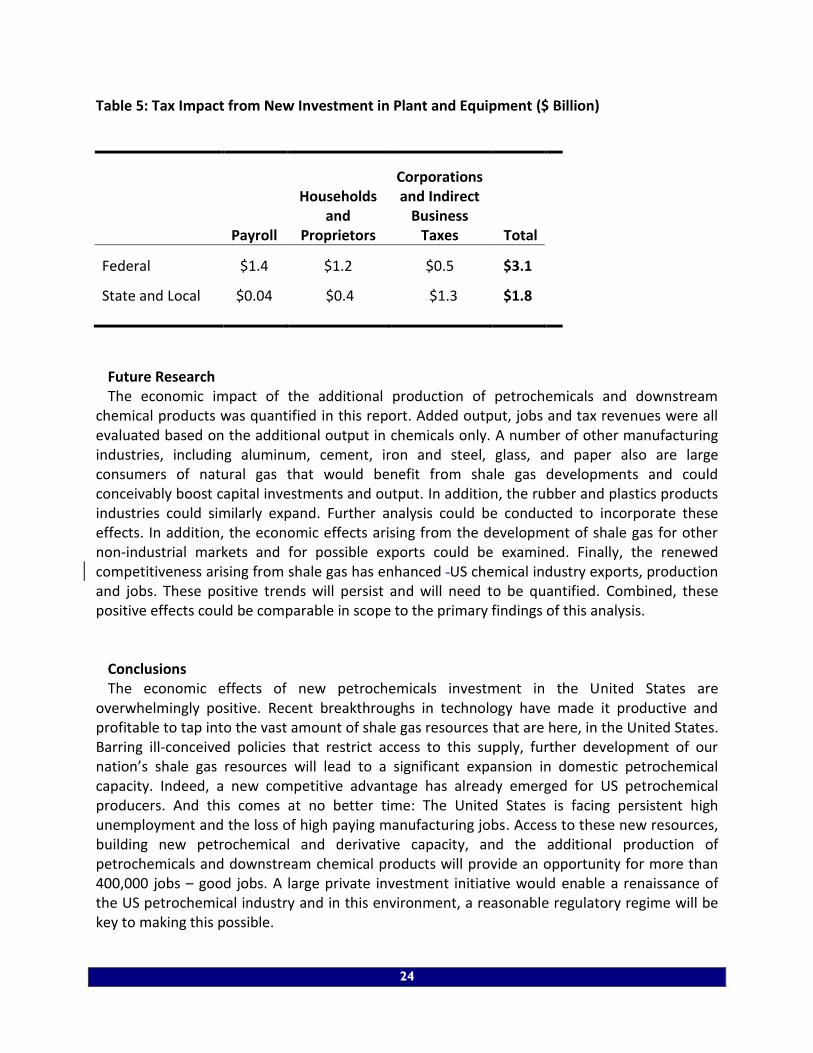
There are also considerable tax revenues generated from the $16.2 billion investment in new plant and equipment. Federal tax receipts would be $3.1 billion, while state and local receipts would be $1.8 billion. While the impact from the new plant and equipment investment would be short-lived, it would nonetheless be welcomed during these times of fiscal imbalances. Combining the additional federal tax revenues from the added output with tax revenues associated with this private-sector boost in investment, the 10-year revenue addition to the US Treasury would be at least $25.0 billion. Similar large gains in revenues would accrue to the states and various localities.
24
Table 5: Tax Impact from New Investment in Plant and Equipment ($ Billion)
Payroll
Households and
Proprietors
Corporations and Indirect
Business Taxes Total
Federal $1.4 $1.2 $0.5 $3.1
State and Local $0.04 $0.4 $1.3 $1.8
Future Research
The economic impact of the additional production of petrochemicals and downstream chemical products was quantified in this report. Added output, jobs and tax revenues were all evaluated based on the additional output in chemicals only. A number of other manufacturing industries, including aluminum, cement, iron and steel, glass, and paper also are large consumers of natural gas that would benefit from shale gas developments and could conceivably boost capital investments and output. In addition, the rubber and plastics products industries could similarly expand. Further analysis could be conducted to incorporate these effects. In addition, the economic effects arising from the development of shale gas for other non-industrial markets and for possible exports could be examined. Finally, the renewed competitiveness arising from shale gas has enhanced US chemical industry exports, production and jobs. These positive trends will persist and will need to be quantified. Combined, these positive effects could be comparable in scope to the primary findings of this analysis.
Conclusions
The economic effects of new petrochemicals investment in the United States are overwhelmingly positive. Recent breakthroughs in technology have made it productive and profitable to tap into the vast amount of shale gas resources that are here, in the United States. Barring ill-conceived policies that restrict access to this supply, further development of our nation’s shale gas resources will lead to a significant expansion in domestic petrochemical capacity. Indeed, a new competitive advantage has already emerged for US petrochemical producers. And this comes at no better time: The United States is facing persistent high unemployment and the loss of high paying manufacturing jobs. Access to these new resources, building new petrochemical and derivative capacity, and the additional production of petrochemicals and downstream chemical products will provide an opportunity for more than 400,000 jobs – good jobs. A large private investment initiative would enable a renaissance of the US petrochemical industry and in this environment, a reasonable regulatory regime will be key to making this possible.

25
ACC’s Economics & Statistics Department The Economics & Statistics Department provides a full range of statistical and economic advice and services for ACC and its members and other partners. The group works to improve overall ACC advocacy impact by providing statistics on American Chemistry as well as preparing information about the economic value and contributions of American Chemistry to our economy and society. They function as an in-house consultant, providing survey, economic analysis and other statistical expertise, as well as monitoring business conditions and changing industry dynamics. The group also offers extensive industry knowledge, a network of leading academic organizations and think tanks, and a dedication to making analysis relevant and comprehensible to a wide audience. Dr. Thomas Kevin Swift Chief Economist and Managing Director 202.249.6180 [email protected] Martha Gilchrist Moore Senior Director – Policy Analysis and Economics 202.249.6182 [email protected]
Emily Sanchez Director, Surveys & Statistics and Editor 202.249.6183 [email protected]
26
Appendix Table 1: Jobs Generated by the Expanded Production of Petrochemical and Derivatives from a 25% Increase in Ethane Production
Direct Indirect Induced Total
Agriculture - 1,280 1,977 3,256
Mining & Utilities - 5,319 540 5,859
Oil and gas extraction - 3,072 154 3,226
Natural gas distribution - 969 52 1,022
Electricity generation and distribution - 782 232 1,014
Other mining and utilities - 496 103 599
Construction - 3,048 837 3,885
Durable Manufacturing - 3,363 1,924 5,287
Primary and fabricated metals - 1,516 425 1,941
Machinery, electrical equipment, and instruments - 802 230 1,032
Computers and electronics - 378 143 521
Other durable manufacturing - 666 1,126 1,792
Nondurable Manufacturing 17,017 6,898 2,701 26,616
Petroleum and coal products - 699 39 738
Chemicals 17,017 4,522 370 21,908
Other nondurable manufacturing - 1,678 2,293 3,970
Trade - 11,857 17,101 28,957
Transportation - 5,936 2,607 8,542
Information - 1,627 1,845 3,472
Finance, Insurance and Real Estate - 4,823 9,863 14,686
Services - 35,720 46,169 81,889
Professional and technical services - 8,167 3,965 12,132
Scientific R&D services - 4,644 216 4,860
Management of companies - 4,531 734 5,265
Administrative and support services - 9,127 4,666 13,793
Other services - 9,252 36,588 45,840
TOTAL JOBS 17,017 79,870 85,563 182,450
27
Appendix Table 2: Jobs Generated from New Investment in Plant and Equipment
Direct Indirect Induced Total
Agriculture - 427 2,334 2,761
Mining & Utilities - 833 638 1,470
Oil and gas extraction - 208 181 389
Natural gas distribution - 86 62 148
Electricity generation and distribution - 270 274 544
Other mining and utilities - 269 121 390
Construction 17,537 820 983 19,339
Durable Manufacturing 31,169 13,779 2,259 47,208
Primary and fabricated metals 3,899 6,895 499 11,293
Machinery, electrical equipment, and instruments 22,304 2,799 271 25,374
Computers and electronics 1,999 1,653 167 3,819
Other durable manufacturing 2,968 2,432 1,322 6,721
Nondurable Manufacturing - 2,387 3,187 5,573
Petroleum and coal products - 75 46 121
Chemicals - 401 437 837
Other nondurable manufacturing - 1,911 2,704 4,615
Trade - 7,829 20,070 27,899
Transportation - 4,179 3,062 7,241
Information 5,388 3,109 2,172 10,668
Finance, Insurance and Real Estate - 5,836 11,618 17,454
Services - 35,281 54,228 89,509
Professional and technical services - 9,984 4,664 14,647
Scientific R&D services - 1,034 254 1,288
Management of companies - 3,362 865 4,228
Administrative and support services - 12,329 5,486 17,815
Other services - 8,573 42,959 51,532
TOTAL JOBS 54,094 74,479 100,549 229,122