accelerate your acquisition: how to rise above the noise and activate the donors you need
TRANSCRIPT
Accelerate Your Acquisition: How to Rise Above the Noise and Activate the Donors You Need with Curt Swindoll
Interact with us today!
@pursuant #pursuantwebinar
GoToMeeting® Chat

Acquisition: Why is it so important?
• Donor attrition = 55% • Potential donors are bombarded by 3,000+ ads per day • The Internet and Social Media age is noisy and distracting
• The “Attention” Economy
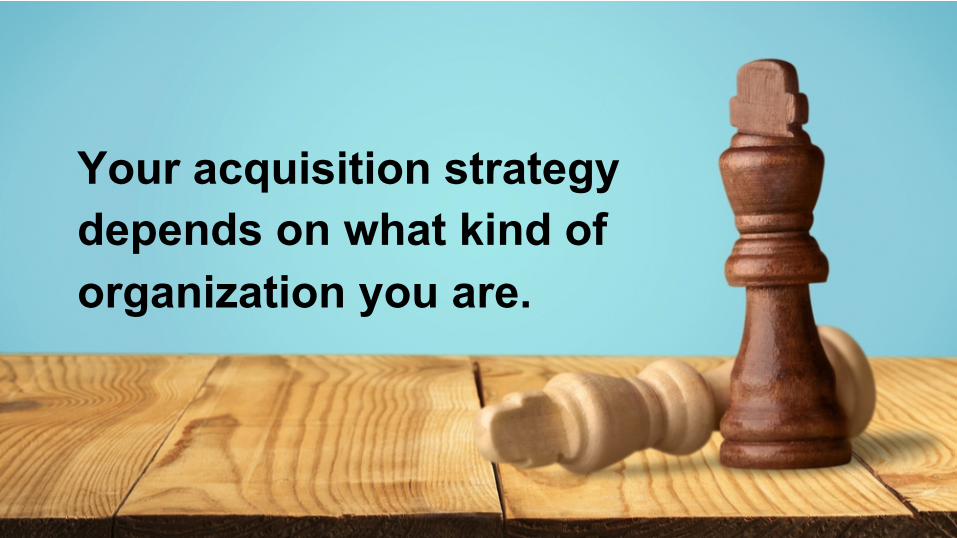
Your acquisition strategy depends on what kind of organization you are.

Open vs. Closed Loop Organizations
vs.

Open Loop Organizations Examples: Humanitarian organizations, some general NPOs
Donor Organization Beneficiary
Support Impact
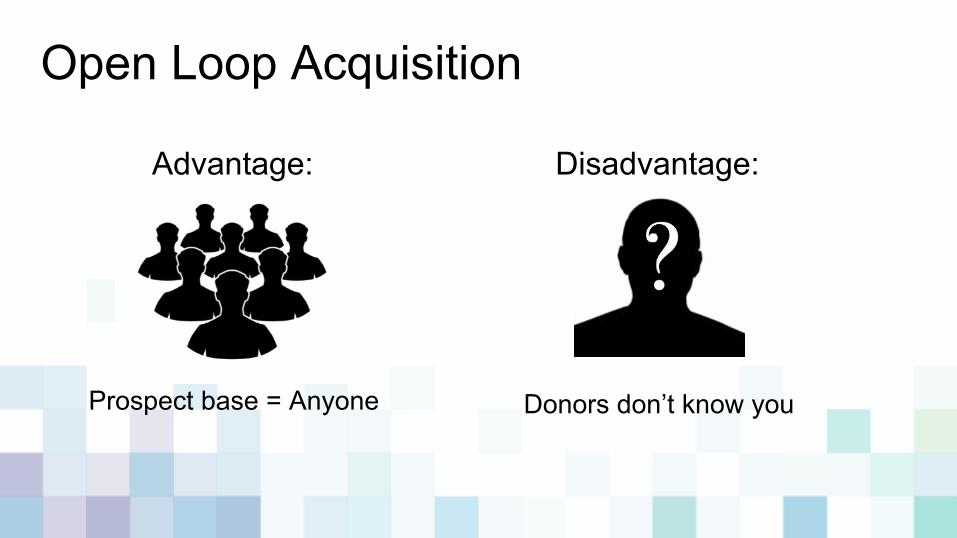
Open Loop Acquisition
Donors don’t know you Prospect base = Anyone
Advantage: Disadvantage:

Closed Loop Organizations Examples: Higher Ed institutions, some faith-based organizations and churches
Organization Beneficiary/Donor
Support
Impact

Closed Loop Acquisition
Prospects are largely limited to your base of
beneficiaries
Prospects have personally benefitted from your work
Advantage: Disadvantage:

5 Principles to Help Open Loop Organizations
Find More Donors

#1 Be intentional about impressions.
Impressions include ads, direct mail, presentations, volunteer experiences, word of mouth via peer or influencer, etc.
Where do your most-likely prospects hang out?
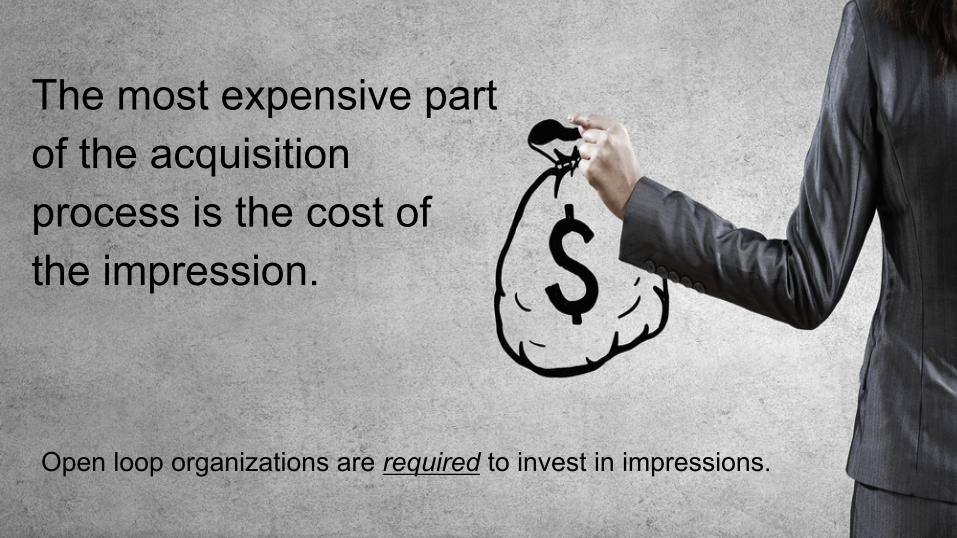
The most expensive part of the acquisition process is the cost of the impression.
Open loop organizations are required to invest in impressions.

Creating a Tribe Takes Creativity
• Connect your strategies to the nature of your work
• Leverage social media • Make news • Partner with compatible
organizations

Example of a strong impression: donor experiences the work and/or meets a beneficiary directly.
#2 Invest in immersive experiences.
Donor Beneficiary
Support Impact
Organization Donor Organization Beneficiary
Support Impact

But most donors will not be able to go to the beneficiaries…
...so “bring” the beneficiary to the donor.

Storytelling is the answer!
➢ A donor must connect intellectually and emotionally to the needs of an individual beneficiary.
➢ A story is a simulation of a real, live experience.
➢ The more immersive, the better. Give the donor a vicarious experience.

#3 Improve messaging with donor feedback.
➢ Survey ➢ Test ➢ Leverage social media

#4 Maximize the ask: 1. A donor ask should directly follow
experiencing what the organization does.
2. Be clear about the use of funds and your goals. Fund projects, if possible.
3. Help the donor understand what their gift will accomplish.
4. Capture contact and giving information in the moment.
5. Make it easy for them to commit to a recurring gift.
#5 Leverage Intellectual Property Donors are most likely to give when an organization has personal meaning or value to them.
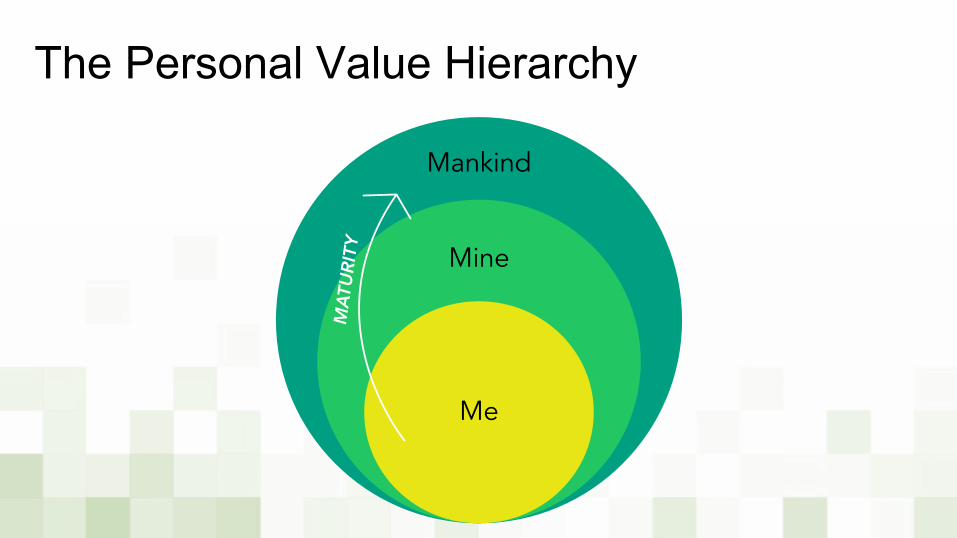
The Personal Value Hierarchy
8
5. LEVERAGE INTELLECTUAL PROPERTY
����ÀÃ�>Ài���ÃÌ����i�Þ�Ì��}�Ûi�Ì��>���À}>��â>Ì�����À���ÃÌ�ÌÕÌ����Ü�i��Ì�>Ì��À}>��â>Ì�����>Ã�«iÀÃ��>���i>���}��À�Û>�Õi�Ì��Ì�i�]�>�`��iÝÌ�Ì��«i�«�i�Ì�iÞ����Ü�vÀ�i�`Ã]�v>���Þ��i�LiÀî]�>�`�w�>��Þ�Ì��«i�«�i�Ì�iÞ��>Þ��iÛiÀ��iiÌ°�"�i�Ü>Þ�Ì�����ÕÃÌÀ>Ìi�Ì�>Ì�Û>�Õi��Ã�Ì��Ã\
�Ì�Ì>�iÃ�>��>ÌÕÀi�`���À�Ì��}�Ûi�«ÕÀi�Þ�Ì��ÃiÀÛi�Ì�i���ÌiÀiÃÌÃ��v�º�>����`°»�/�i�`i��}À>«��V�Ãi}�i�ÌÃ��v�º���iÀû�>�`�º�>ÌÕÀiû�ÜiÀiÉ>Ài���Ài����i�Þ�Ì��}�Ûi�«ÕÀi�Þ����Ì�i�ÃiÀÛ�Vi��v��>����`�Ì�>��Ì�i��i��8�«�«Õ�>Ì���°�iÀÌ>���Þ]�>���Ì��v��i��8�`���ÀÃ�}�Ûi�Ì���>�i�>�`�vviÀi�Vi����Ì�i�Ü�À�`]�LÕÌ��ÕÀ�iÝ«iÀ�i�Vi��Ã�Ì�>Ì�Ì��Ãi�}�vÌÃ�>Ài��vÌi����Ì�Û>Ìi`�LÞ�>�Ãi�Ãi��v�«iÀÃ��>����ÃÃ����>�`É�À�Ì�i�Ãi�Ãi��v�«iÀÃ��>���`i�Ì�vÞ�Ì�iÞ�}iÌ�vÀ���Li��}�V���iVÌi`�Ì��>�V>ÕÃi��À��À}>��â>Ì���°
�Ì��Ã�½Ì�ÃÕÀ«À�Ã��}]�Ì�i�]�Ì�>Ì�>VµÕ�À��}��>ÌÕÀi�`���ÀÃ�Ü�����}�Ì��}�Ûi�«ÕÀi�Þ�Ì��ÃiÀÛi��>����`��Ã�LiV��i���Ài�>�`���Ài�`�vwVÕ�Ì°���`ii`]��ÕÀ�ÃÕÀÛiÞÃ���VÀi>Ã��}�Þ�Ã��Ü�>�`iÃ�Ài�`���ÀÃ��>Ûi�
Ì���iiÌ��ii`Ã����Ì�i�À��Ü��V�Õ�ÌÀÞ����i®��ÛiÀ�Ì��Ãi�Ì�>Ì�iÝ�ÃÌ���ÌiÀ�>Ì���>��Þ��>����`®°�-����Ü�Ã��Õ�`��«i�����«��À}>��â>Ì���Ã�Àië��`
*ÕÀÃÕ>�̽Ã�V�>��i�}i�Ì���«i�����«�V��i�ÌÃ��Ã�Ì��V��Ã�`iÀ���Ü�Ì���iÛiÀ>}i�Ì�i�À���Ìi��iVÌÕ>��«À�«iÀÌÞ���Ì����Þ�Ì��>ÃÃ�ÃÌ��ÌÃ�Li�iwV�>À�iÃ]�LÕÌ�Ì��Li�iwÌ�Ì�i�À�`���ÀÃ�>Ã�Üi��°�7�>Ì��>Ûi�Þ�Õ��i>À�i`����Ì�i�ÃiÀÛ�Vi��v�Þ�ÕÀ�Li�iwV�>À�iÃ�Ì�>Ì���}�Ì�Li�Û>�Õ>L�i�Ì��Þ�ÕÀ�`���Àö���Ü���}�Ì�Þ�Õ�i`ÕV>Ìi�Ì�i���À�>««�Þ�Þ�ÕÀ�Õ��µÕi�Ã����Ã�Ì��>ÃÃ�ÃÌ�Ì�i��Ü�iÀiÛiÀ�Ì�iÞ�>Ài
��À�iÝ>�«�i]��v�Þ�ÕÀÃ��Ã�>��Õ�>��Ì>À�>���À}>��â>Ì����>``ÀiÃÃ��}��Õ�}iÀ]���Ü���}�Ì�Þ�Õ�i`ÕV>Ìi�Þ�ÕÀ�`���ÀÃ�>L�ÕÌ�Ì�i�V�>��i�}i��v��Õ�}iÀpiëiV�>��Þ��Õ�}iÀ����Ì�i�À�V���Õ��ÌÞ]��À�Ìi>V��Ì�i��Ã��iÌ���}�>L�ÕÌ�v��`�«À�`ÕVÌ���]��À��i�«��}�«i�«�i�Li�Ãi�v�ÃÕvwV�i�̶���Ü�V>��Þ�Õ��i�«�Ì�i��Ìi>V��Ì�i�À���`Ã�>L�ÕÌ��Õ�}iÀ¶���Ü�Ì�iÞ���}�Ì�Àië��`�Ì��Ì�i��Õ�}iÀ��ii`Ã�«ÀiÃi�Ì����Ì�i�À����iÌ�Ü�¶�7�>Ì��>Ûi�Þ�Õ��i>À�i`�Ì�À�Õ}��ÀiÃi>ÀV�¶�7�>Ì�>Ài�Ì�i�ÌÀi�`Ã�V���iVÌi`�Ì��Þ�ÕÀ�V>ÕÃi¶�7�>Ì�«À�L�i�Ã�>Ài�>ÃÃ�V�>Ìi`�Ü�Ì���Õ�}iÀ�>�`��>��ÕÌÀ�Ì���
/�i�«���Ì��Ã�Ì��>««ÀiV�>Ìi�Ì�i�Û>�Õi��v�Ü�>Ì�Þ�Õ����Ü]�>�`�Ì��ÕÃi�Ì�>Ì���v�À�>Ì����Ì��ÃiÀÛi�Þ�ÕÀ�`���ÀÃ�`�ÀiVÌ�Þ°��v�«À�ëiVÌ�Ûi�`���ÀÃ�Ãii���Ü�Ì�i�À�}�vÌÃ��i�«�Ì�i��«iÀÃ��>��Þ]�Ì�i�Õ��ÛiÀÃi��v�«�Ìi�Ì�>��`���ÀÃ�Ì��Þ�ÕÀ��À}>��â>Ì����À�ÃiÃ�`À>�>Ì�V>��Þ°����ivviVÌ]��Ì��i�«Ã�Þ�ÕÀ��À}>��â>Ì����vÕ�VÌ������Ài����i�>�V��Ãi`����«�vÕ�`À>�Ã��}��«iÀ>Ì���°
�i
���i
�>����`
MATU
RITY
Appreciate the value of what you know, and to use that information to benefit your donors.
5 Principles to Help Closed Loop Organizations
Find More Donors

Reminder:
Organization Beneficiary/Donor
Support
Impact
Universities
Hospitals
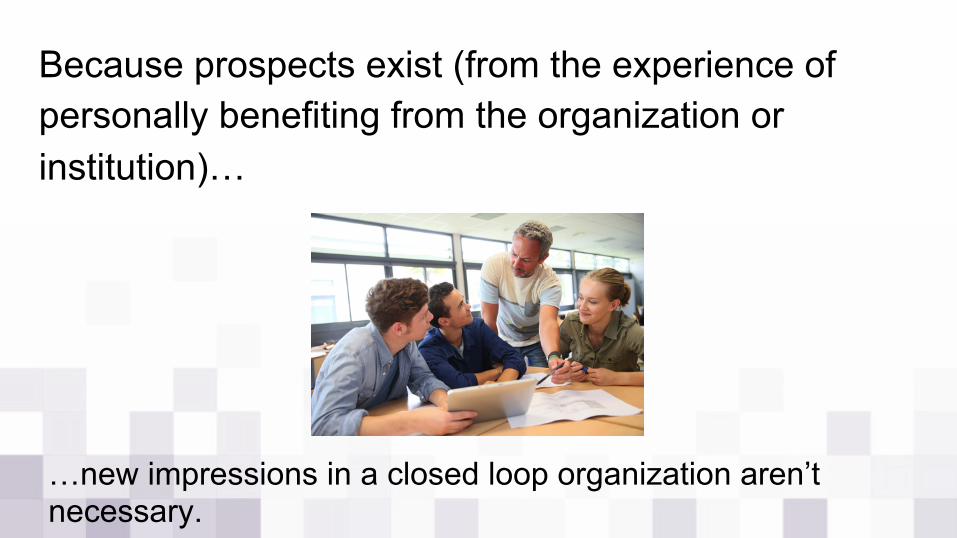
Because prospects exist (from the experience of personally benefiting from the organization or institution)…
…new impressions in a closed loop organization aren’t necessary.

But those impressions are frequently wasted…
…so we need to do a better job leveraging the impressions we already have versus investing in new ones.

#1 Cultivate a culture of philanthropy. ➢ Current beneficiaries may not have the capacity or willingness to give
now, but they will later. ➢ Early impressions must establish the importance of a long-term
relationship.

Cultivating philanthropy:
The greater the distance from being a beneficiary to being a donor, the stronger the culture of philanthropy needs to be.
Time it takes a beneficiary to become a donor
Importance of creating a philanthropic culture
Case for Support Need
Strategy Vision
Opportunity
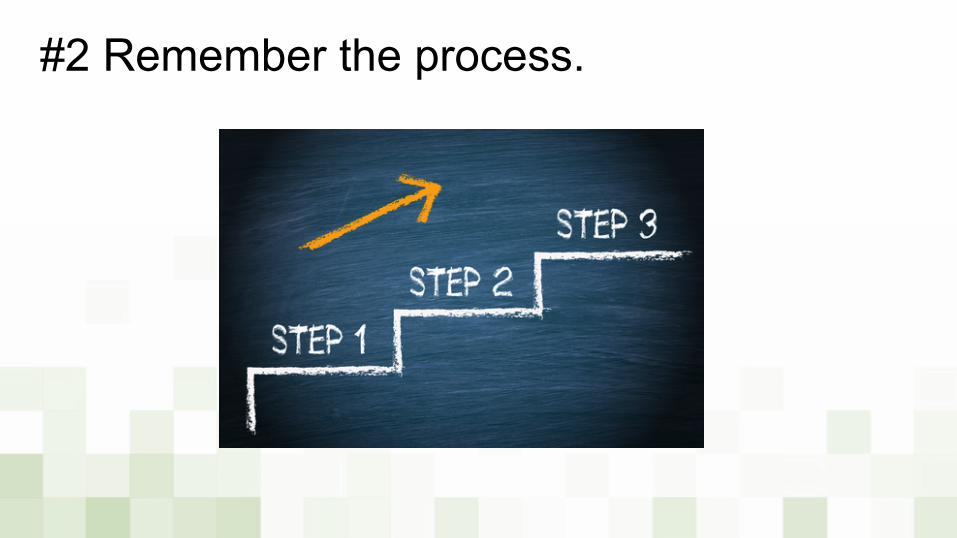
#2 Remember the process.

How to leverage an impression:
Impression → Connection → Engagement → Conversion → Sustainment

#3 Think transformational, not transactional Transaction Transformation
Convincing/manipulating donor Educating the donor
Relationship begins with a gift Relationship begins with an impression
Focused on the gift Focused on the relationship
Securing a gift Engaging in a memorable experience
Organization is the “hero” Donor is the “hero”
Short term results Maximizing lifetime value
Premiums are tchotchkes Premiums are educational and valuable
Donor turnover/churn Retaining donors
Gift ledgers Annual impact reports
Focus on efficiency Focus on value
#4 Provide value-rich content. ➢ No one wants to join your mailing list! They want a “value
exchange.” ➢ Begin asking today, “What do our beneficiaries value? What
information do we have that will educate, encourage, help, and support them?”

#5 Improve New Donor Retention with “Reminder Cards”.
Content on these cards should demonstrate the value in having an ongoing relationship with your organization.
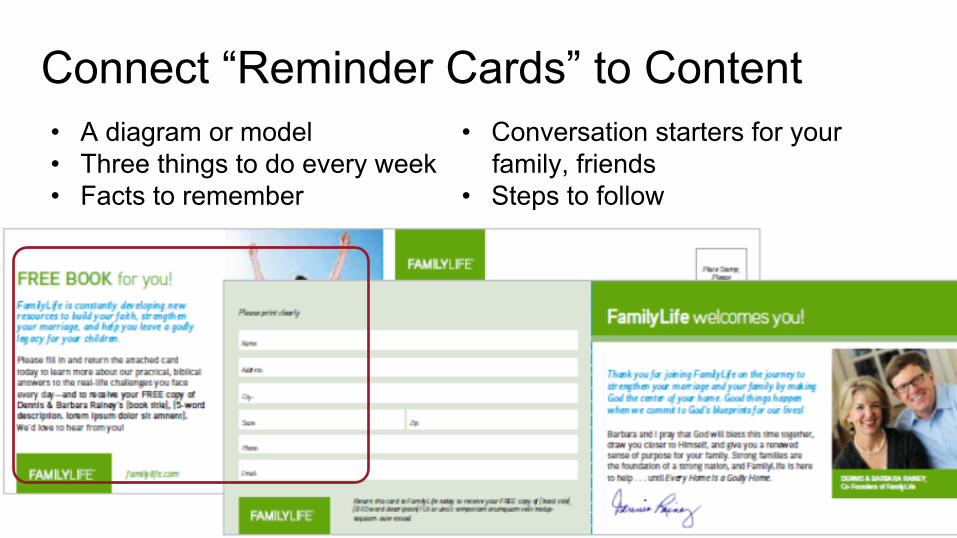
Connect “Reminder Cards” to Content • A diagram or model • Three things to do every week • Facts to remember
• Conversation starters for your family, friends
• Steps to follow
Action Steps to Accelerate Your Acquisition:
1. Determine the relationship between your donors and beneficiaries. 2. Identify areas needing attention or improvement. 3. Evaluate your onboarding process. What is the experience of being
a prospect or first-time donor? 4. Plan how you will address acquisition a step at a time. 5. Find creative ways to avoid the rising cost of quality impressions.
Leverage the impressions you already have!!!

Conclusion Acquisition success requires: ➢ Understanding the nature of your relationship with donors. ➢ A process that is aligned with that relationship. ➢ Does your cultivation process allow donors to slip through the
cracks? Any investment in acquisition is largely wasted if the cultivation process is poor.

How can we help? Pursuant’s GPS…
Key Multi-year 2010 2011 2012 2013 2012 vs. 2013 % 2013 2014 YTD Variance % Available Donors 3,857 3,882 3,928 3,930 2 0.05% 3,930 3,738 (192) -4.89%
Active Donors 3,152 3,213 3,267 3,156 (111) -3.40% 2,013 2,041 28 1.39%% Retained 81.72% 82.77% 83.17% 80.31% -2.87% -3.45% 51.22% 54.60% 3.38% 6.60%
Gifts 20,678 20,784 21,005 20,482 (523) -2.49% 4,948 5,098 150 3.03%Frequency 6.56 6.47 6.43 6.49 0.06 0.94% 2.46 2.50 0.04 1.62%
Gross Revenue 2,284,948.94$ 2,351,109.33$ 2,540,910.69$ 2,945,144.61$ 404,233.92$ 15.91% 433,692.29$ 532,655.41$ 98,963.12$ 22.82%Average Gift Amount 110.50$ 113.12$ 120.97$ 143.79$ 22.82$ 18.87% 87.65$ 104.48$ 16.83$ 19.21%
Revenue/Active Donor 724.92$ 731.75$ 777.75$ 933.19$ 155.44$ 19.99% 215.45$ 260.98$ 45.53$ 21.13%New Continuing 2010 2011 2012 2013 2012 vs. 2013 % 2013 2014 YTD Variance % Available Donors 707 1,063 775 933 158 20.39% 933 654 (279) -29.90%
Active Donors 301 413 328 286 (42) -12.80% 153 144 (9) -5.88%% Retained 42.57% 38.85% 42.32% 30.65% -11.67% -27.57% 16.40% 22.02% 5.62% 34.27%
Gifts 1,180 1,404 1,040 1,076 36 3.46% 272 270 (2) -0.74%Frequency 3.92 3.40 3.17 3.76 0.59 18.66% 1.78 1.88 0.10 5.47%
Gross Revenue 115,342.89$ 106,713.84$ 70,883.38$ 74,876.29$ 3,992.91$ 5.63% 15,338.28$ 16,757.39$ 1,419.11$ 9.25%Average Gift Amount 97.75$ 76.01$ 68.16$ 69.59$ 1.43$ 2.10% 56.39$ 62.06$ 5.67$ 10.06%
Revenue/Active Donor 383.20$ 258.39$ 216.11$ 261.81$ 45.70$ 21.15% 100.25$ 116.37$ 16.12$ 16.08%Reactivated Continuing 2010 2011 2012 2013 2012 vs. 2013 % 2013 2014 YTD Variance %
Available Donors 808 604 617 683 66 10.70% 683 519 (164) -24.01%Active Donors 429 302 335 296 (39) -11.64% 82 106 24 29.27%
% Retained 53.09% 50.00% 54.29% 43.34% -10.96% -20.18% 12.01% 20.42% 8.42% 70.12%Gifts 1,062 737 859 635 (224) -26.08% 125 176 51 40.80%
Frequency 2.48 2.44 2.56 2.15 -0.42 -16.34% 1.52 1.66 0.14 8.92%Gross Revenue 101,951.42$ 74,610.39$ 102,709.12$ 91,022.77$ (11,686.35)$ -11.38% 6,893.32$ 13,606.55$ 6,713.23$ 97.39%
Average Gift Amount 96.00$ 101.24$ 119.57$ 143.34$ 23.77$ 19.88% 55.15$ 77.31$ 22.16$ 40.19%Revenue/Active Donor 237.65$ 247.05$ 306.59$ 307.51$ 0.91$ 0.30% 84.06$ 128.36$ 44.30$ 52.70%
New Donors 2010 2011 2012 2013 2012 vs. 2013 % 2013 2014 YTD Variance % Acquired Donors 1,063 775 933 654 (279) -29.90% 117 187 70 59.83%
Multis 255 186 238 173 (65) -27.31% 16 27 11 68.75%% Multi 23.99% 24.00% 25.51% 26.45% 0.94% 3.70% 13.68% 14.44% 0.76% 5.58%
Gifts 1,725 1,247 1,472 1,171 (301) -20.45% 139 224 85 61.15%Frequency 1.62 1.61 1.58 1.79 0.21 13.49% 1.19 1.20 0.01 0.83%
Gross Revenue 158,599.60$ 327,415.36$ 144,621.69$ 112,588.10$ (32,033.59)$ -22.15% 10,164.35$ 15,602.57$ 5,438.22$ 53.50%Average Gift Amount 91.94$ 262.56$ 98.25$ 96.15$ (2.10)$ -2.14% 73.12$ 69.65$ (3.47)$ -4.75%
Revenue/Acquired Donor 149.20$ 422.47$ 155.01$ 172.15$ 17.15$ 11.06% 86.87$ 83.44$ (3.44)$ -3.96%
Lapsed (13-24) 2010 2011 2012 2013 2012 vs. 2013 % 2013 2014 YTD Variance % Available Donors 1,284 1,490 1,621 1,390 (231) -14.25% 1,390 1,808 418 30.07%
Active Donors 328 387 403 303 (100) -24.81% 80 117 37 46.25%% Reactivated 25.55% 25.97% 24.86% 21.80% -3.06% -12.32% 5.76% 6.47% 0.72% 12.44%
Gifts 515 656 643 531 (112) -17.42% 96 130 34 35.42%Frequency 1.57 1.70 1.60 1.75 0.16 9.84% 1.20 1.11 -0.09 -7.41%
Gross Revenue 267,944.90$ 95,717.17$ 94,170.80$ 572,019.71$ 477,848.91$ 507.43% 11,043.05$ 37,960.01$ 26,916.96$ 243.75%Average Gift Amount 520.28$ 145.91$ 146.46$ 1,077.25$ 930.79$ 635.55% 115.03$ 292.00$ 176.97$ 153.84%
Revenue/Active Donor 816.91$ 247.33$ 233.67$ 1,887.85$ 1,654.18$ 707.90% 138.04$ 324.44$ 186.41$ 135.04%Lapsed (25-60) 2010 2011 2012 2013 2012 vs. 2013 % 2013 2014 YTD Variance %
Available Donors 3,501 2,816 2,772 2,993 221 7.97% 2,993 3,110 117 3.91%Active Donors 213 163 205 177 (28) -13.66% 50 50 0 0.00%% Reactivated 6.08% 5.79% 7.40% 5.91% -1.48% -20.03% 1.67% 1.61% -0.06% -3.76%
Gifts 370 282 303 266 (37) -12.21% 52 57 5 9.62%Frequency 1.74 1.73 1.48 1.50 0.02 1.68% 1.04 1.14 0.10 9.62%
Gross Revenue 32,975.96$ 91,198.21$ 29,980.10$ 33,640.87$ 3,660.77$ 12.21% 6,215.61$ 15,188.68$ 8,973.07$ 144.36%Average Gift Amount 89.12$ 323.40$ 98.94$ 126.47$ 27.53$ 27.82% 119.53$ 266.47$ 146.94$ 122.93%
Revenue/Active Donor 154.82$ 559.50$ 146.24$ 190.06$ 43.82$ 29.96% 124.31$ 303.77$ 179.46$ 144.36%Long Lapsed (61+) 2010 2011 2012 2013 2012 vs. 2013 % 2013 2014 YTD Variance % Available Donors 3,577 4,942 5,859 6,576 717 12.24% 6,576 7,330 754 11.47%
Active Donors 63 67 75 39 (36) -48.00% 9 20 11 122.22%% Reactivated 1.76% 1.36% 1.28% 0.59% -0.69% -53.67% 0.14% 0.27% 0.14% 99.36%
Gifts 96 90 110 68 (42) -38.18% 11 24 13 118.18%Frequency 1.52 1.34 1.47 1.74 0.28 18.88% 1.22 1.20 -0.02 -1.82%
Gross Revenue 13,301.48$ 12,768.26$ 45,537.99$ 6,734.80$ (38,803.19)$ -85.21% 2,161.86$ 2,470.00$ 308.14$ 14.25%Average Gift Amount 138.56$ 141.87$ 413.98$ 99.04$ (314.94)$ -76.08% 196.53$ 102.92$ (93.62)$ -47.63%
Revenue/Active Donor 211.13$ 190.57$ 607.17$ 172.69$ (434.49)$ -71.56% 240.21$ 123.50$ (116.71)$ -48.59%
Totals 2010 2011 2012 2013 2012 vs. 2013 % 2013 2014 YTD Variance % Available Donors 14,797 15,572 16,505 17,159 654 3.96% 16,622 17,346 724 4.36%
Active Donors 5,549 5,320 5,546 4,911 (635) -11.45% 2,504 2,665 161 6.43%% Donors Giving 37.50% 34.16% 33.60% 28.62% -4.98% -14.82% 15.06% 15.36% 0.30% 1.99%
Gifts 25,626 25,200 25,432 24,229 (1,203) -4.73% 5,643 5,979 336 5.95%Frequency 4.62 4.74 4.59 4.93 0.35 7.59% 2.25 2.24 -0.01 -0.45%
Gross Revenue 2,975,065.19$ 3,059,532.56$ 3,028,813.77$ 3,836,027.15$ 807,213.38$ 26.65% 485,508.76$ 634,240.61$ 148,731.85$ 30.63%Average Gift Amount 116.10$ 121.41$ 119.09$ 158.32$ 39.23$ 32.94% 86.04$ 106.08$ 20.04$ 23.29%
Revenue/Active Donor 536.14$ 575.10$ 546.13$ 781.11$ 234.98$ 43.03% 193.89$ 237.99$ 44.10$ 0.00%
Year - to - Date (Jul - Sep)Year - to - Year
Sample Client
Universe: All Revenue; All Donors; All HPC
Donor Migration Report
Report Data date: XX/XX/20XX
Curre
ntNe
wLa
psed
Tota
l
Sample ClientSegment: Giving Level:
Segment: Partnership # Prospects
Planned Gift Prospects
Current Avg Gift*
Avg Lifetime Rev/Donor
Avg Lifetime Gifts/Donor
% Currently Assigned
Existing MajorBest 122 43 $4,765 $65,322 17 0%Likely 34 18 $2,143 $14,332 8 0%Capable 65 29 $2,465 $11,209 5 0%
Major UpgradeBest 141 24 $2,194 $6,555 2 0%Likely 45 7 $2,296 $21,366 3 0%Capable 27 5 $1,877 $3,221 2 0%
Mid-‐level UpgradeBest 274 157 $296 $4,541 1 0%Likely 101 17 $259 $11,725 6 0%Capable 243 155 $371 $3,499 2 0%
Total 1,052 455 $1,852 $15,752 5 0%*Average over last three years
Segment: Partnership # Prospects # Contactable
Appointment Rate
# of Appointments Close Rate # of Pledges
Current Avg Gift*
Upgrade Factor
Avg Annual Pledge Amt
Potential Avg 3Yr Pledge
Total 3Yr Increase**
Existing MajorBest 122 117 75% 88 50% 44 $4,765 6.0 $9,530 $28,590 $209,064Likely 34 29 65% 19 50% 9 $2,143 5.0 $3,572 $10,715 $13,465Capable 65 57 50% 29 50% 14 $2,465 4.0 $3,287 $9,860 $11,709
Major UpgradeBest 141 87 70% 61 50% 30 $2,194 7.5 $5,484 $16,452 $100,194Likely 45 32 60% 19 45% 9 $2,296 6.0 $4,591 $13,774 $19,835Capable 27 21 50% 11 40% 4 $1,877 5.0 $3,128 $9,385 $5,256
Mid-‐level UpgradeBest 274 260 70% 182 35% 64 $296 10.0 $988 $2,965 $44,063Likely 101 98 65% 64 33% 21 $259 8.0 $692 $2,075 $9,087Capable 243 232 60% 139 30% 42 $371 6.0 $743 $2,228 $15,508
Total 1,052 933 611 237 $1,852 $3,557 $10,672 $428,180*Average over last three years **Over current giving
Appointments per Gift Officer: 250 Gift Officers Needed: 2 ALL Prospect Potential
ALLPartnership
0
0.1
0.2
0.3
0.4
0.5
0.6
0.7
0.8
0.9
1
0 0.2 0.4 0.6 0.8 1
RFM Score
CPI Score
ALL Prospect Potential
BestExcellent giving history & are willing and able
LikelyExcellent giving history but less willing and able
CapableLower giving history
but are willing and able


Recommended Resources:
VISIT WWW.PURSUANT.COM/INTELLIGENT-FUNDRAISER

CHRIS TAFT Account Director [email protected] 214-866-7734
ALYSSA BOGER Director, Client Strategy [email protected]
Pursuant Webinars
Contact Chris today to begin your year-end planning.


Thank you!

Intelligent fundraising.