accelerate your business through search & native innovation
TRANSCRIPT

CO
PY
RIG
HT
© Y
AH
OO
2017
CO
PY
RIG
HT
© Y
AH
OO
2016
CO
PY
RIG
HT
© Y
AH
OO
2017
BRIAN HEDRICKDIRECTOR, PERFORMANCE STRATEGY
ACCELERATE YOUR BUSINESS THROUGH SEARCH & NATIVE INNOVATION
1

CO
PY
RIG
HT
© Y
AH
OO
2017
CO
PY
RIG
HT
© Y
AH
OO
2017
2
Today’s presentation contains information that is confidential and proprietary to Yahoo
CONFIDENTIALITY & PRIVACY
All confidential information being shared today is subject
to terms and conditions of your non-disclosure agreement
(or other agreement that contains confidentiality
provisions) with Yahoo.
As a recognized leader in developing privacy-enhancing
tools for consumers and a member of the NAI and DAA,
Yahoo understands the importance of consumer trust and
privacy.
Yahoo and its partners provide transparency about our
data collection and use practices and extend several tools
to empower consumers to manage their experience. We
are also now among the first in the world to support Do
Not Track.

CO
PY
RIG
HT
© Y
AH
OO
2017
CO
PY
RIG
HT
© Y
AH
OO
2017
THE STATE OF MEDIA
3

CO
PY
RIG
HT
© Y
AH
OO
2017
CONTENT CONSUMPTION IS EVOLVING. DIGITAL DOMINATES TIME SPENT, BUT SMARTPHONES ALONE WILL BEGIN TO THREATEN TV’S PREVIOUS DOMINANCE
4
4:31 4:11 4:01
2:162:12 2:08
2:15 2:54 3:17
2013 2015 2017
AVG. TIME SPENT PER DAY IN (HOURS:MINS)
Source: eMarketer, September 2016
Smartphon
ePC
TV
Decline: -12%▼
Decline: -4%▼
Growth: +47%▲

CO
PY
RIG
HT
© Y
AH
OO
2017
TRADITIONAL TV WATCHING STILL PEAKS DURING PRIME TIME
6AM - 9AM 9AM – 12PM 12PM – 3PM 3PM – 6PM 6PM – 9PM 9PM – 12AM 12AM – 3AM 3AM – 6AM
% O
F T
V V
IEW
ER
SH
IP
Prime time
peak
8-9PM
Source: TV viewing levels for YTD, P13+, Nielsen, September 2015
W E E K D A Y
W E E K E N D
WEEKDAY VS. WEEKEND | TV RATINGS BY HOUR
5
CO
PY
RIG
HT
© Y
AH
OO
2017
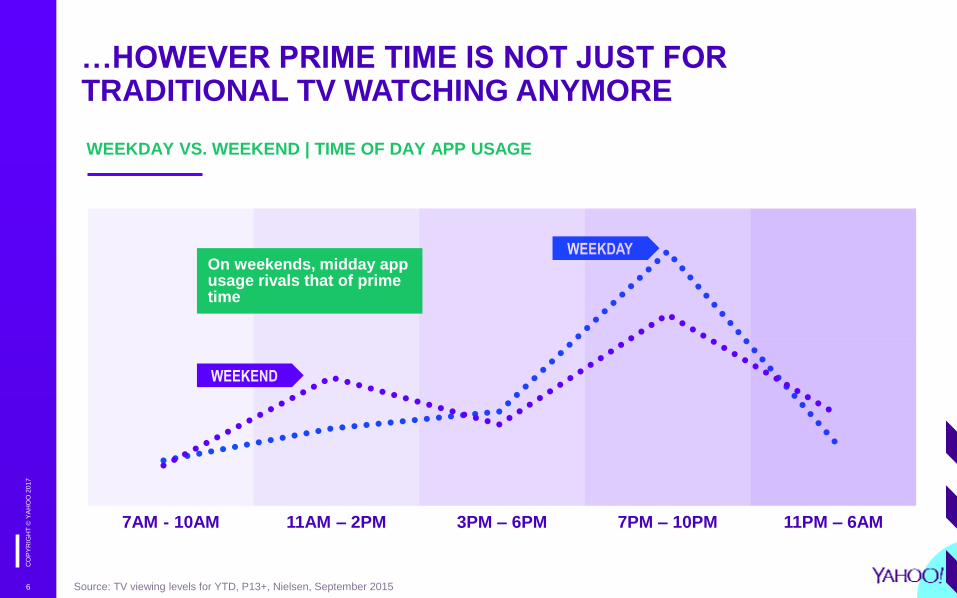
…HOWEVER PRIME TIME IS NOT JUST FOR TRADITIONAL TV WATCHING ANYMORE
Source: TV viewing levels for YTD, P13+, Nielsen, September 2015
WEEKDAY VS. WEEKEND | TIME OF DAY APP USAGE
% O
F T
OT
AL
AP
P S
ES
SIO
NS
WEEKDAY
WEEKEND
7AM - 10AM 11AM – 2PM 3PM – 6PM 7PM – 10PM 11PM – 6AM
On weekends, midday app usage rivals that of prime time
6

CO
PY
RIG
HT
© Y
AH
OO
2017
58%24%
16%2%
FULL
SAMPLE 55%
24%
19%
3%
MILLENNIALS
65%
24%
10% 1%
GEN X’ERS
TV + Laptop TV +
Phone
Phone + Laptop All 3
TV + LAPTOP IS THE MOST COMMON MULTITASKING METHOD
7Source: Nielsen Biometric Day in the Life

CO
PY
RIG
HT
© Y
AH
OO
2017
UNSURPRISINGLY, WITH THE PREVALENCE OF MULTITASKING DURING PRIME TIME, DEVICE SWITCHING IS MORE FREQUENT FOR BOTH GROUPS FROM 7-10PM
8Source: Nielsen Biometric Day in the Life
G E N X ’ E R S
9.2switches per
hour
M I L L E N N I A L S
8.7switches per
hour

CO
PY
RIG
HT
© Y
AH
OO
2017
MILLENNIALS ARE CONSIDERABLY MORE PROFICIENT THAN GEN X’ERS AT MULTI-TASKING DURING PRIME TIME
9
EMOTIONAL RESPONSE TO MULTITASKING- DURING PRIME TIME
Source: Nielsen Biometric Day in the Life
Gen X’ers respond the least emotionally to multitasking during prime
time, potentially making this a difficult audience to reach and engage
emotionally for advertisers.
64
53
32
40
32 3229
N/A
Gen X’ers
Millennials
TV + Laptop TV + Phone Laptop + Phone All 3

CO
PY
RIG
HT
© Y
AH
OO
2017
ALTHOUGH TV IS THE DEVICE USED THE MOST, SMARTPHONES ACTUALLY RECEIVE THE HIGHEST AMOUNT OF “PRIMARY ATTENTION”
10
PERCENT OF TIME USING DEVICE AS THE
PRIMARY DEVICE - DURING PRIME TIME
Source: Nielsen Biometric Day in the Life
94% of the time that a Smartphone is being
touched during these hours, it is being used
as the primary device.
SM
AR
TP
HO
NE
94%
TV
83%
LA
PT
OP
80%

CO
PY
RIG
HT
© Y
AH
OO
2017
CO
PY
RIG
HT
© Y
AH
OO
2017
DIGITAL IS WINNING THE BATTLE FOR CONSUMER ATTENTION WHEN IT COMES TO ADVERTISING
11
% OF TIME CONSUMER ATTENTION DIVERTED
TO ANOTHER DEVICE WHEN AD APPEARED
57% 15%25%
Source: Nielsen Biometric Day in the Life
CO
PY
RIG
HT
© Y
AH
OO
2017
CO
PY
RIG
HT
© Y
AH
OO
2017
12
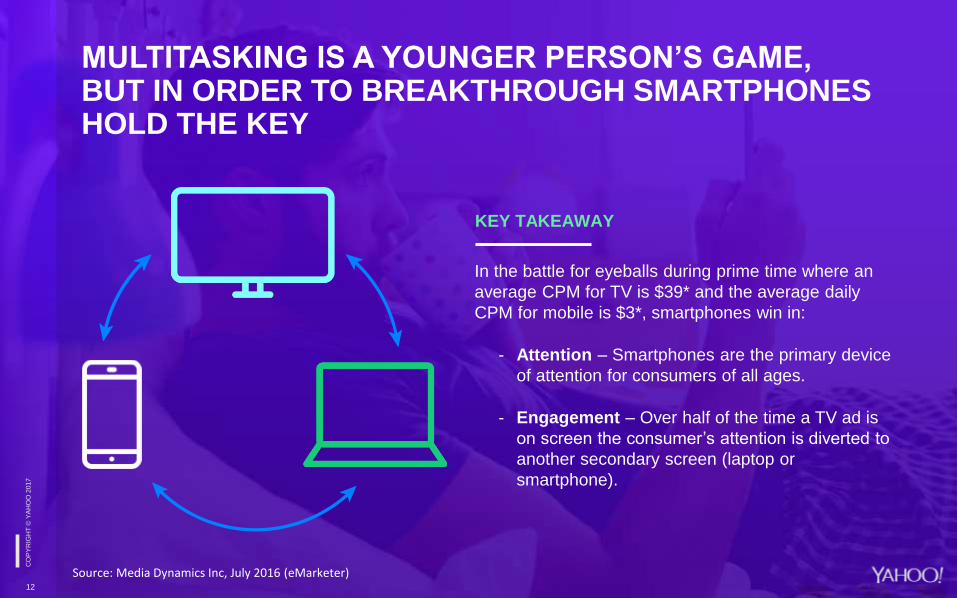
MULTITASKING IS A YOUNGER PERSON’S GAME, BUT IN ORDER TO BREAKTHROUGH SMARTPHONES HOLD THE KEY
In the battle for eyeballs during prime time where an
average CPM for TV is $39* and the average daily
CPM for mobile is $3*, smartphones win in:
- Attention – Smartphones are the primary device
of attention for consumers of all ages.
- Engagement – Over half of the time a TV ad is
on screen the consumer’s attention is diverted to
another secondary screen (laptop or
smartphone).
KEY TAKEAWAY
Source: Media Dynamics Inc, July 2016 (eMarketer)

CO
PY
RIG
HT
© Y
AH
OO
2017
MOBILE SHOPPERS WILL BE VIRTUALLY SYNONYMOUS WITH DIGITAL SHOPPERS BY 2020
13
184.4
220.2
100
200
2015 2016 2017 2018 2019 2020
US Mobile Shoppers (Millions)
88.5%
98.4%
70%
2016 2017 2018 2019 2020
US Mobile Shoppers as a Percent of
Digital Shoppers, 2016-2020
DEFINITION:
Ages 14+; mobile shoppers are internet users who have browsed,
researched or compared products digitally via any device during
the calendar year but have not necessarily bought digitally98.4%
Source: US Ecommerce Performance StatPack: Including Mobile Performance Yory Wurmser | December 23, 2016
CO
PY
RIG
HT
© Y
AH
OO
2017
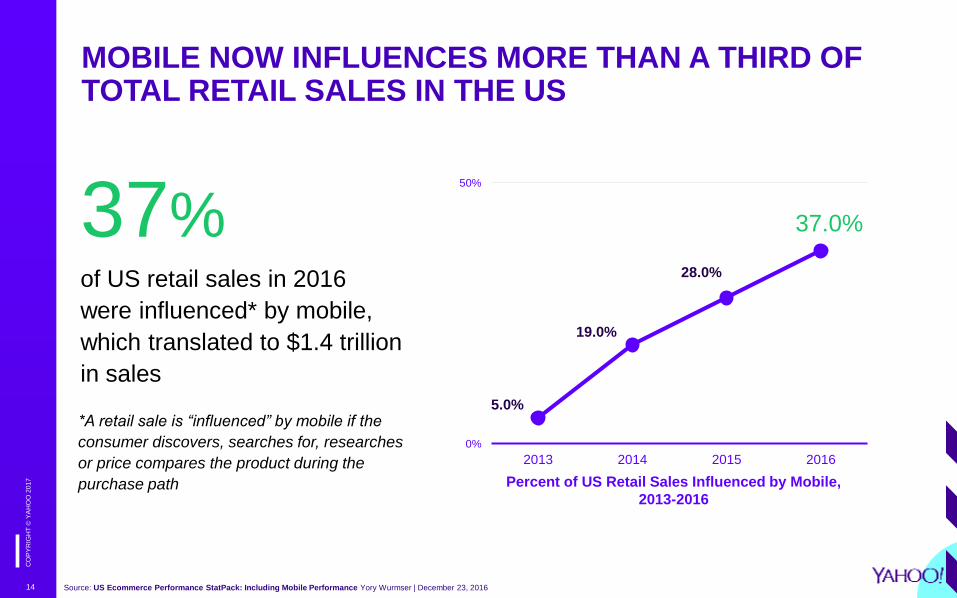
MOBILE NOW INFLUENCES MORE THAN A THIRD OF TOTAL RETAIL SALES IN THE US
14
*A retail sale is “influenced” by mobile if the
consumer discovers, searches for, researches
or price compares the product during the
purchase path
37%of US retail sales in 2016
were influenced* by mobile,
which translated to $1.4 trillion
in sales5.0%
19.0%
28.0%
[]
0%
50%
2013 2014 2015 2016
Percent of US Retail Sales Influenced by Mobile,
2013-2016
37.0%
Source: US Ecommerce Performance StatPack: Including Mobile Performance Yory Wurmser | December 23, 2016
CO
PY
RIG
HT
© Y
AH
OO
2017
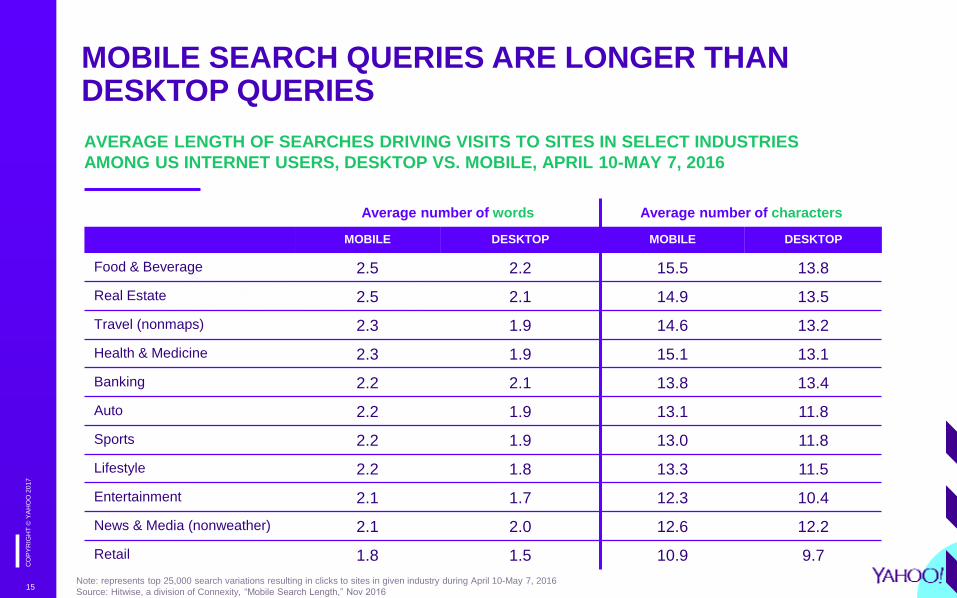
MOBILE SEARCH QUERIES ARE LONGER THAN DESKTOP QUERIES
15
AVERAGE LENGTH OF SEARCHES DRIVING VISITS TO SITES IN SELECT INDUSTRIES
AMONG US INTERNET USERS, DESKTOP VS. MOBILE, APRIL 10-MAY 7, 2016
Average number of words Average number of characters
MOBILE DESKTOP MOBILE DESKTOP
Food & Beverage 2.5 2.2 15.5 13.8
Real Estate 2.5 2.1 14.9 13.5
Travel (nonmaps) 2.3 1.9 14.6 13.2
Health & Medicine 2.3 1.9 15.1 13.1
Banking 2.2 2.1 13.8 13.4
Auto 2.2 1.9 13.1 11.8
Sports 2.2 1.9 13.0 11.8
Lifestyle 2.2 1.8 13.3 11.5
Entertainment 2.1 1.7 12.3 10.4
News & Media (nonweather) 2.1 2.0 12.6 12.2
Retail 1.8 1.5 10.9 9.7
Note: represents top 25,000 search variations resulting in clicks to sites in given industry during April 10-May 7, 2016
Source: Hitwise, a division of Connexity, “Mobile Search Length,” Nov 2016

CO
PY
RIG
HT
© Y
AH
OO
2017
ALTHOUGH MOBILE IS KEY, DESKTOP IS STILL IMPORTANT FOR CONVERSIONS
16
US RETAIL ECOMMERCE WEBSITE TRAFFIC VS. REVENUE
SHARE, BY DEVICE, Q2 2016 (% OF TOTAL)
Note: represents activity tracked by Adobe, broader industry metrics may vary
Source: Adobe, “2016 Mobile Retail Report; eMarketer calculations, Oct 25, 2016
Tablet
9%
Desktop
59%
Smartphone
32%
Traffic Share
Tablet
9%
Desktop
75%
Smartphone
16%
Revenue Share

CO
PY
RIG
HT
© Y
AH
OO
2017
THE REASON: SMARTPHONES LAG DESKTOPS AND TABLETS IN ADD-TO-CART AND CONVERSION RATES
17
US ADD-TO-CART VS TOTAL RETAIL ECOMMERCE
CONVERSION RATES, BY DEVICE, Q2 2016
Note: represents activity tracked by Adobe, broader industry metrics may vary; read as 1.0% of total smartphone
visits result in an order, while 16% of smartphone visitors who ad items to their cart make a purchase
Source: Adobe, “2016 Mobile Retail Report; eMarketer calculations, Oct 25, 2016
SMARTPHONE TABLET DESKTOP
Add-to-cart 16% 22% 26%
Total 1.0% 2.0% 2.8%
CO
PY
RIG
HT
© Y
AH
OO
2017
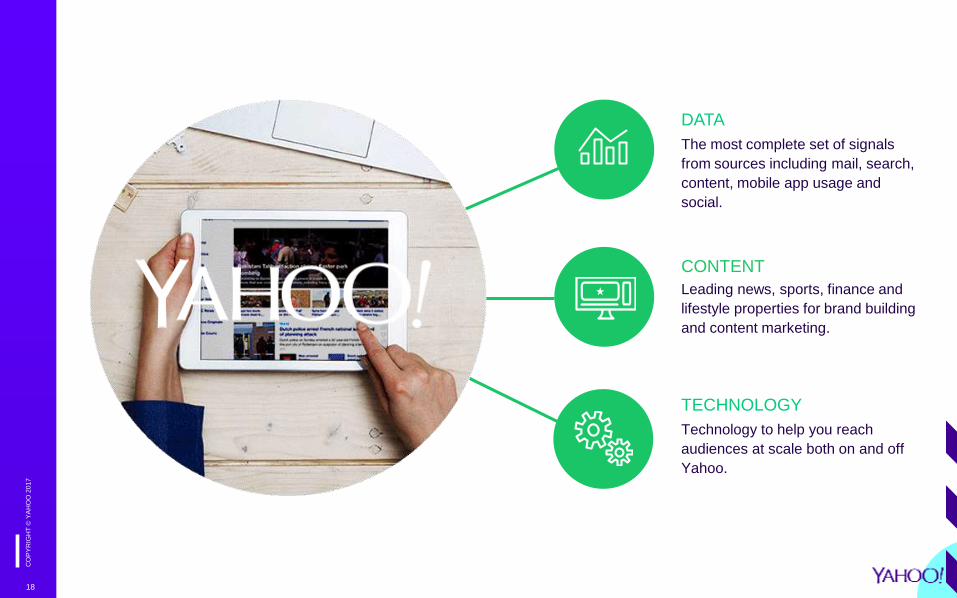
TECHNOLOGY
Technology to help you reach
audiences at scale both on and off
Yahoo.
DATA
The most complete set of signals
from sources including mail, search,
content, mobile app usage and
social.
CONTENT
Leading news, sports, finance and
lifestyle properties for brand building
and content marketing.
18

CO
PY
RIG
HT
© Y
AH
OO
2017
CO
PY
RIG
HT
© Y
AH
OO
2017
19
WHAT IS YAHOO GEMINI?
THE PERFORMANCE AND
RELEVANCE OF
SEARCH
+
THE EXTENSIVE SCALE
AND CREATIVITY OF
NATIVE
BUY MANAGE OPTIMIZE
CO
PY
RIG
HT
© Y
AH
OO
2017
CO
PY
RIG
HT
© Y
AH
OO
2017
20
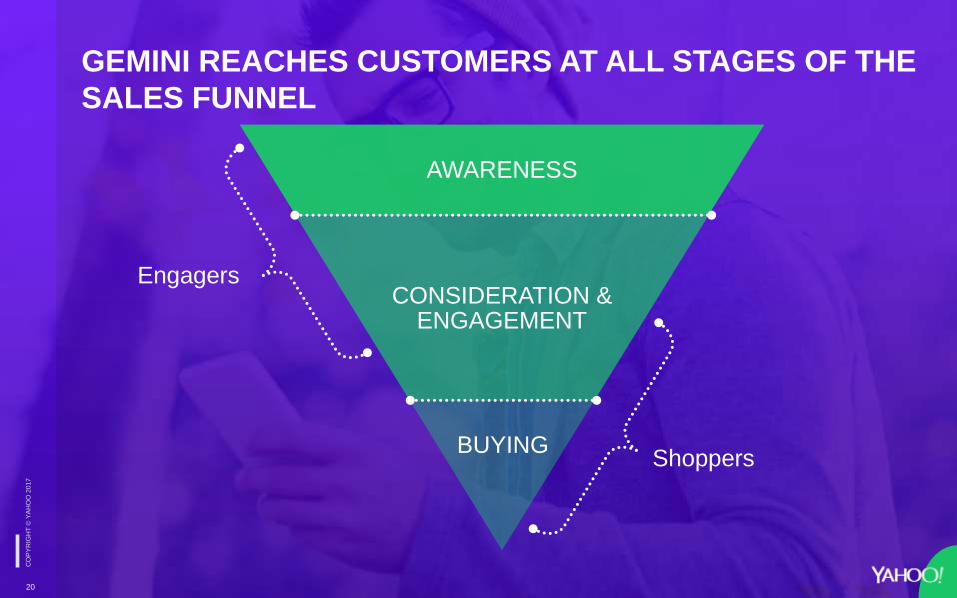
GEMINI REACHES CUSTOMERS AT ALL STAGES OF THE
SALES FUNNEL
AWARENESS
CONSIDERATION & ENGAGEMENT
BUYINGShoppers
Engagers

CO
PY
RIG
HT
© Y
AH
OO
2017
YAHOO IS CONNECTED TO CONSUMERS
AT EVERY POINT IN THEIR JOURNEY
165 BILLION DATA EVENTS
21
daily from 1 billion consumers visiting
our site each month
APPS
SEARCH
CONTENT
SOCIAL
Source: Yahoo internal data

CO
PY
RIG
HT
© Y
AH
OO
2017
22
POWERFUL DATA POINTS FOR A MORE COMPLETE
UNDERSTANDING OF YOUR AUDIENCE
LOCATION
from registration data
PREFERENCES FOR
TRAVEL, RETAIL & MORE
from email data
CROSS-DEVICE IDENTITYfrom mobile data
FAVORITE CONTENT
from web data & 720k apps
RECENT STORE VISITS
from mobile geolocation data
ON AND OFFLINE PURCHASES
from email data
PURCHASE INTENT
from search queries
PASSIONS & INTERESTS
from Tumblr

CO
PY
RIG
HT
© Y
AH
OO
2017
CO
PY
RIG
HT
© Y
AH
OO
2017
23
TARGET YOUR MOST VALUABLE AUDIENCE
WITH CUSTOM AUDIENCES
•Demographic
•Geographic
•Interest
YAHOO DATA
•Website actions
•Mobile device IDs
•Email list
•In app action
•Lookalike modeling
YOUR DATA
•Page visits
•Site visits
•Cart abandonment
SITE RETARGETING
•Custom segments
•Email lists
3rd PARTY DATA
= exclusive to

CO
PY
RIG
HT
© Y
AH
OO
2017
AMPLIFY YOUR EFFICIENCYApply Audience Targeting to Search to improve campaign efficiency
24
Advertisers in the pilot saw the
following results for their audience
targeted traffic:
CONVERSION
RATES
90%
200%CLICK THROUGH
RATES
COST PER
ACQUISTION
30%
*Audience traffic compared to non-audience trafficSource: Yahoo internal data
CO
PY
RIG
HT
© Y
AH
OO
2017
25
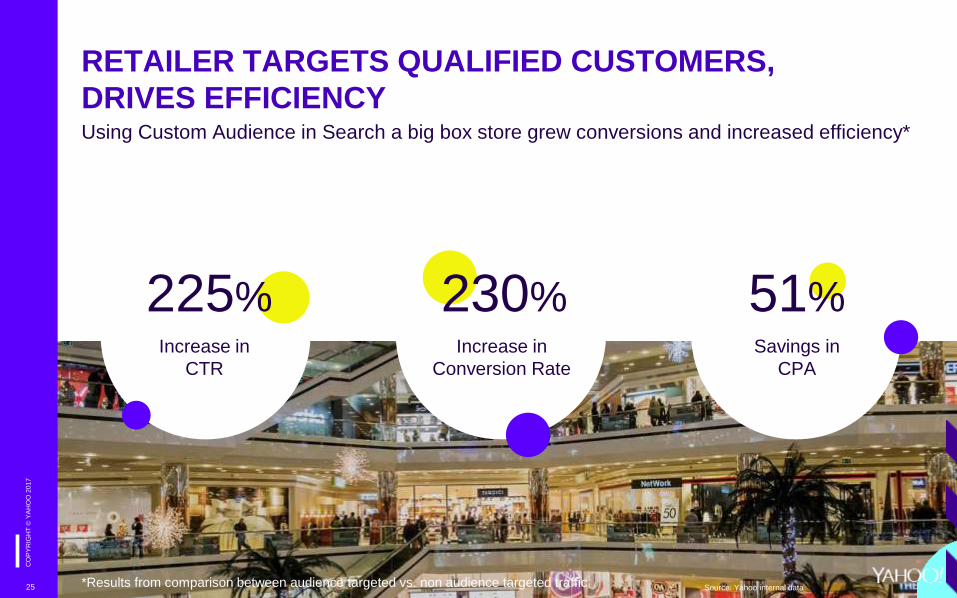
RETAILER TARGETS QUALIFIED CUSTOMERS,
DRIVES EFFICIENCY
CO
PY
RIG
HT
© Y
AH
OO
2017
Increase in
CTR
Increase in
Conversion Rate
Savings in
CPA
225% 51%230%
Using Custom Audience in Search a big box store grew conversions and increased efficiency*
*Results from comparison between audience targeted vs. non audience targeted traffic Source: Yahoo internal data

CO
PY
RIG
HT
© Y
AH
OO
2017
DRIVE MORE TRAFFIC WITH SEARCH ON NATIVEAdd an image to your search campaigns to maximize your impact on Yahoo Gemini. Extend
your reach and target customers that searched for your products on native supply with
Search on Native.
26
CPC
50%
CLICKS
20%
Hotels in San Francisco
Hotel DealsGreat prices in San Francisco
Source: Yahoo internal data

CO
PY
RIG
HT
© Y
AH
OO
2017
…WITH COMPREHENSIVE
MEASUREMENT TOOLS
Scalable, open and actionable
measurement to understand your
campaign impact.
…INTO ACTIONABLE
INSIGHTS & TARGETING
Turning data into insights that help
you better understand your
customers and prospects.
TURNING SUPERIOR DATA…
The most complete set of signals
from sources including mail, search,
content, mobile app usage and
social.
27

CO
PY
RIG
HT
© Y
AH
OO
2017
CO
PY
RIG
HT
© Y
AH
OO
2017
28
RECAP
PLAN FOR THE
MULTI-TASKER
LEVERAGE
DATA &
INSIGHTS TO
PLAY UP AND
DOWN THE
FUNNEL
DOUBLE DOWN
ON THE
MOBILE
EXPERIENCE
advertising.yahoo.com

CO
PY
RIG
HT
© Y
AH
OO
2017
CO
PY
RIG
HT
© Y
AH
OO
2016
CO
PY
RIG
HT
© Y
AH
OO
2017
THANK YOU
29