accelerating efficiency - automotive logistics€™s second largest road network ... chakan kanhe...
TRANSCRIPT

1 Copyright © 2012 Mahindra & Mahindra Ltd. All rights reserved. 1
Accelerating Efficiency – Inbound Logistics
9th November 2016
Devendra Bharambe Deputy General Manager, Mahindra & Mahindra Limited
2
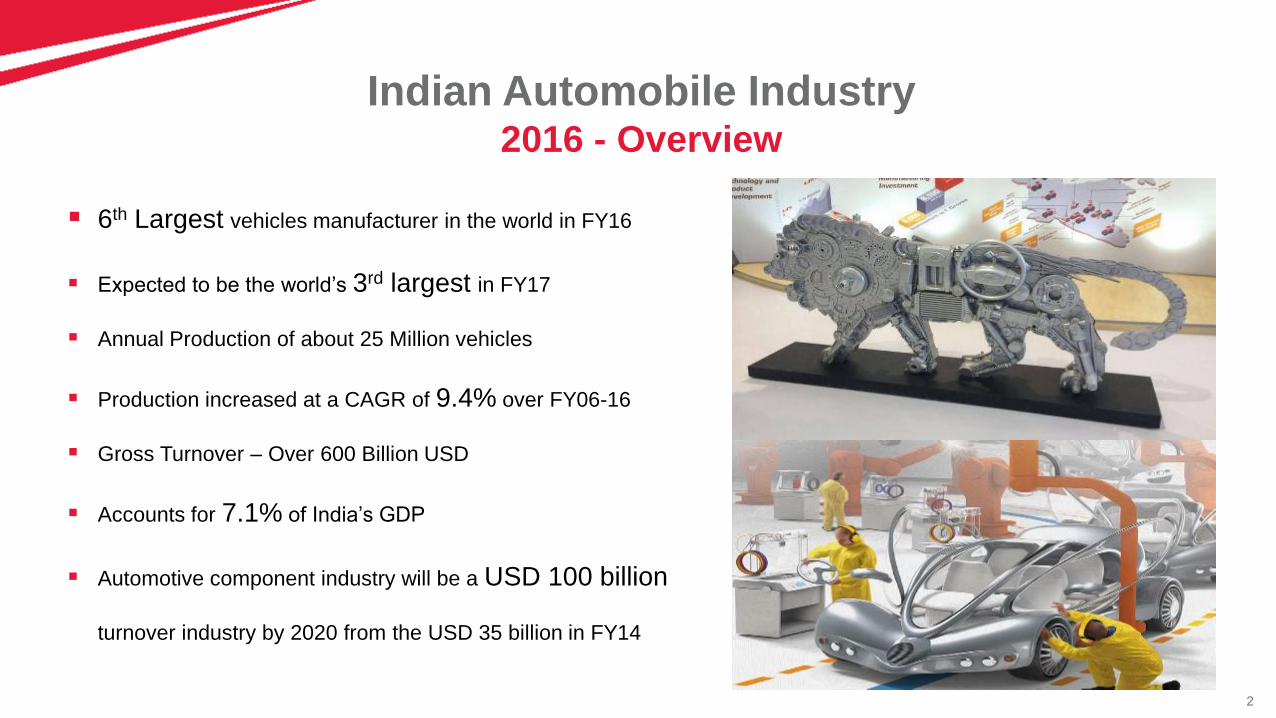
Indian Automobile Industry
6th Largest vehicles manufacturer in the world in FY16
Expected to be the world’s 3rd largest in FY17
Annual Production of about 25 Million vehicles
Production increased at a CAGR of 9.4% over FY06-16
Gross Turnover – Over 600 Billion USD
Accounts for 7.1% of India’s GDP
Automotive component industry will be a USD 100 billion
turnover industry by 2020 from the USD 35 billion in FY14
2016 - Overview

3
Logistics in India Quick Facts - Roads
World’s second largest road network (5.23 million km)
Carry nearly 65% of freight and 86% of passenger traffic
Average speed on Indian highways is less than three times the average speed on highways in
developed countries.
National highways form only 2% of the total roads by length and carry about 40% of the traffic
Out of total length of national highways:
27 % - single lane/intermediate lane
59 % - double-lane standard
14 % - four-lane/ six-lane/ eight lane standard

4
World’s 3rd largest rail network (66030 kms spread across 8500 stations)
2.45 lakh wagons, 63045 wagons and 10773 locomotives
Cater to 30 million passengers daily
1107 million tons of commercial freight transported via trains in FY16
Variety of goods such as mineral ores, iron & steel, fertilisers, petrochemicals
& agricultural produce
During FY07–16, revenues increased at a CAGR of 6.4 per cent to USD25.2
billion in FY16
Earnings of USD 16.9 billion from commodity freight traffic during FY16 (> 2/3rd
of railway’s revenues)
Logistics in India Quick Facts - Railways

5
Important rail networks are over-saturated
Rail tariffs are quite high: Indian Railways subsidizes passenger tariff at the expense of freight tariff, resulting in Indian rail freight
rates being amongst the highest in the world
Long and uncertain transit times & poor terminal quality
Less flexibility in carrying different types of goods: This is due to the unavailability of specialized wagons for each type of
product
Lower throughput and longer turn-around period.
Rail
Inadequate Road Network Coverage: National
Highways constitute just 2% of the Indian road network,
but carry 40% of the total traffic, resulting in severe
congestion
Poor road quality
High level of fragmentation of the trucking industry:
This leads to fierce competition, resulting in truck owners
trying to overload to recover their investments
Multiple check-points result in unnecessary delays
Over reliance on roads leads to increased costs, high
energy consumption and adversely impacts environment
Road
High Turnaround times: This is because of the congestion on
berths and slow evacuation of cargo which are unloaded at the
berths
Inadequate depth at the ports: Depth at many Indian ports is
inadequate, resulting in many large vessels choosing not to
dock at Indian ports
Coastal shipping is yet to take off: Inadequate port and land
infrastructure and a non-favourable tax regime has inhibited the
growth of this sector
Higher waiting times, high fuel costs and tariffs negatively
impact the air freight sector
Ports and Air Freight
Transportation in India – All’s Not Well
Lack of infrastructure for interconnectivity between different modes of transport

6
Lack of Availability of quality logistics professionals
Still practising manual operations for stock filing & warehouse
management
Low level of 3 PL usage in warehousing and transportation
functions. Only 55% of Indian companies use 3PL services compared
to 75% globally
Logistics professionals
Other Challenges
The Manual Process of Inbound Freight Management. Piecing
together information from internal paperwork to get info such as
tracking, Bill of lading, etc.
Lack of vehicle tracking systems in use, especially market vehicles.
Inadequate information systems in use to manage the complex
processes
Visibility and Traceability
Focus is on Outbound for customer service, meaning resources for
inbound are limited.
Companies develop routing guides and plans for suppliers but have
little control if they are followed and no way to enforce efficiently
Low Focus on Inbound
Inefficient capacity utilization of return trip
Back Haul

7
Inefficiencies leading to Higher Freight Cost Main engines for increasing GDP is to make logistics sector more efficient & productive
India’s spend as percentage of GDP is 13%, higher than that of US
This is despite the fact that cost of labor is significantly lesser in India
Road transport is 30 per cent more expensive in India
Rail and Waterways are 70 per cent more expensive in India
Transit times are higher owing to lower average speeds
Causes: Waiting times at toll stations, freeze in truck traffic during day, port turnaround times, low priority accorded to
freight trains, poor track infrastructure
Poor transportation equipment is also a major problem

8
1.Reduced freight costs and improved “bottom line”
2.Improvement in on-time deliveries
3.Reduction in purchasing lead times
4.Less handlings and damage
5.Lower inventory levels and reduced carrying costs
6.Providing maximum visibility into the process
7.Improvement in warehouse productivity
8.Increased customer service
Inbound Freight Objectives

9
Opportunities
Government initiative to add 40 km of new roads per day
Inter modal innovation and investment
Inland Waterways
Private infrastructure investment & privately operated rail transportation system
New ports
Goods & Service Tax
Packaging & Logistics as a curriculum – New courses in universities
Renewed focus on Infrastructure development

10
Opportunities
Technology & Logistics
Competitiveness and business improvement
Flexibility and accessibility
Increased intelligence
Enterprise Resource Planning (ERP)
Transportation Management System (TMS)
Warehouse Management System (WMS)
Software as a Service (SaaS)
GPS
RFID
Barcodes
Swipe Cards

11
Opportunities
‘Uberization’ of Logistics
Short Haul (Intra city, Intra zone)
Long Haul (Inter city, Inter zone)
Dedicated or Shared Warehousing

12 Copyright © 2012 Mahindra & Mahindra Ltd. All rights reserved. 12
Case Study
Mahindra Automotive Division
Inbound Logistics

13
Mahindra Group - A Brief
A diversified conglomerate with $17.8-billion
revenue
Among Top 10 Industrial Houses in India
Employs over 200,000 people across 100+
countries
Leadership position in Tractors, Utility
Vehicles, IT & Vacation Ownership

14
Mahindra & Mahindra Ltd.
Automotive Sector
6 Plants across India

15
Regional Stockyard Office (RSO)
Plant
Spares Parts Warehouse Haridwar
Kandivli
Nasik
Zaheerabad
Igatpuri
Chakan
Kanhe
• 5 Vehicle Manufacturing Plants
• 1 Engine Manufacturing Plant
• 350+ Suppliers, supplying
20000+ parts to plants & 50000+
parts to Spare part Division
• 26 Outbound Regional
Stockyards Office (RSO)
• 300+ Dealers
• One of the Complex Supply Chain & Logistics Systems in the Indian Automotive Industry
Supply Chain Complexity Distribution Network

16
IUTN 43%
Exworks 57%
FREIGHT SPENT
IUTN Exworks
Freight Spend – Auto Division
Ex-works space has more to explore on areas of consolidation & utilizations
IUTN – Inter Unit Transfer
Major Aggregates movements between the plants
Strategy – Dedicated Trucks (To & Fro)

17
Big Break through Ideas
1. Consolidation of load at high supplier density zones
2. Long haul movement through Big containers
3. Tracking / Visibility
4. Packaging Efficiencies
5. Synergy
6. Efficient Back Haul

18
Methodology Followed
Data collection in PFEP format (Plan for each part) which has logistics
& packaging details.
Zone wise load Segregation and setting priority for implementation.
Partnering with Mahindra Logistics for setting up crossdock
Selection of Cross dock location based on Supplier density
Defining Guidelines for operation
Completion of Operational SOP by fixing work times, supplier window
time
Commercial agreement

19
Auto Division Supplier Base
9 zones identified for consolidations.
Feasibility worked out for 6 zones.
70
M&M Auto plants
Supplier zones

20
Cross Dock Design - Example (Pune Cross Dock)
Data collection of parts with weight, volume and Avg. Daily Demand
Mapping Supplier density zones & cross dock location
Creating crossdock specific SOP suiting as per operations
Pune Cross dock
24 suppliers
19 suppliers
7 suppliers
4 suppliers
3 suppliers
4 suppliers Supplier Density Map

21
Local Milk Run Planning
No Supplier Name Plant Location Veh Type Coll.Time Act Wt Remarks1 Emdet Nasik Chakan 3:00 PM 900 KLG 60 BOX
2 Emdet Kandivli Chakan 3:00 PM 1050 70 BOX
3 Emdet Zaheerabad Chakan 3:00 PM 525 KG 35 BOX
4 Minda Ind Kandivli Chakan 4:00 PM 90 KG 18 BOX
5 Minda Ind Haridwar Chakan 4:00 PM 30 KG 6 BOX
6 Minda Ind. Nasik Chakan 4:00 PM 70 KG 14 BOX
7 Minda Ind. Zaheerabad Chakan - - Not ready
8 Swapnil Zaheerabad Chakan 6:00 PM 300 KG 10 BOX
9 Takshi Auto Haridwar Chakan - - Not ready
10 IAI Inds Bhivandi Chakan 2:00 PM 1 BOX /30 KG
11 Minda Stoneridge Nasik Chakan 5:00 PM 400 KG 2 PALLET
12 Jai sree swamy Zaheerabad Chinchwad - - Not ready
13 Saki plant-2 Zaheerabad Chinchwad 4:00 PM 500 KG BOX+TROLLY
14 Mayur Ind Nasik Bhosari 4:00 PM 300 KG 20 BOX
15 Precision Zaheerabad Moshi 5:00 PM 600 KG 35 BOX
16 Mahindra CIE Bhivandi Pimpari 709 1:00 PM 1T 864 box
17 Tata Toyo Bhivandi Hinjewadi 4:00 PM FTL Load 17 BOX
18 Pricol Kandivli Pirangut 2:00 PM 150 KG 15 BOX
19 Pricol Haridwar Pirangut 2:00 PM 90 KG 6 BOX
20 Mubea Zaheerabad Pirangute 709 Not confirmed
21 Grupo Zaheerabad Ranjangaon 909 6:00 PM - FTL LOAD
22 Carraro India Bhivandi Ranjangaon 1:00 PM 150 kg 1 Box
23 Exotech Nasik Ranjangaon 3:00 PM 625 KG 125 BOX
24 Lokesh Zaheerabad Ranjangaon 6:00 PM 350 KG 85 BOX
25 Amtek Zaheerabad Sanaswadi - - Material Not Ready
26 Divgi Zaheerabad Shirval - - Material Not Ready
27 KSPG AUTOMOTIVE Kandivli Takve 909 1:00 PM FTL Load 4 PALLET
28 VICTOR REINZ Kandivli Talegaon 407 2:00 PM FTL Load 2 Pallet
709
909
Auto Division Collection schedule for 30.09.2016 11am
1109
407
407

22
Visibility & System Control
1. Deployed Inbound Logistics System (ILS) & also Cross dock process mapped in SRM web portal (mSetu)
2. Captures Receipts and Dispatches from the cross dock based on ASNs created by Suppliers.
3. Provide Common visibility of Stock at cross dock, in-transit stock and ageing
4. Reduction of manual activities with improved accuracy

23
Enhance Track & Trace – GPS based

24
Long Haul Innovation & Synergy
FTL contracts and use of Scooter Body trucks needing Return Load from West to North
Innovative Aggregate Transportation for Long Distance
Providing Reverse Load for Scooter
Body Containers

25
Equipment Pooling for Returnable Packaging
Service Center
near Supplier
Service Center
near M&M Plant
Service Provider to issue Equipment
on need basis
M&M Plant
Service Provider to collect equipment
when empty
Supplier Plant
Part Supplies to
M&M Plant Payment of Rental Charges to
Service Provider for period of
usage
Mahindra

26
Process for Inbound parts with Equipment Pooling
Supplier
Unloading
Staking on Rack
Opening of Box
in W/H
Waste Disposal Re-Binning Issue on
Assy line
Activities Eliminated

27
Improving Efficiency of ‘Part to Pack’ & ‘Pack to Truck’
Rental FLC
Unitization & Containerization

28
Internal Synergy with other businesses
1. Joint facility usage for SBU outbound material & AD
inbound.
2. Dedicated containers movement between Bengaluru
& SBU warehouses in Kanhe / Bhiwandi.
Bengaluru Cross Dock Example
Reduction in transit time by 20%.
Dispatch frequency improved by 25%
AD Cross Dock usage for Inbound Logistics by Spares Business Unit

29
Network of Cross Docks Pan India Cross Docks
1. Nasik 2. Pune 3. Chennai 4. Gurgaon
Nasik (Mumbai+Vasai)
NASIK PLANT
KANDIVLI PLANT
ZAHEERABAD PLANT
HARIDWAR PLANT
NASIK CD
CHK PLANT
PUNE CD
Pune Aurangabad+
Miraj+Kolhapur
GURGAON CD
CHENNAI CD
North Delhi/NCR+
Parwanoo
Chennai Pondy+Trichy
SUPPLIER ZONES
IGT PLANT
Mumbai/Nasik
NASIK CD
Bengaluru
Mysore+Tumkur
NSK/HDW/ZHB

30
Benefits
Inventory reduction
(25% reduction)
Freight Savings
(8% Savings YOY) Improved Truck availability &visibility
(50% reduction in truck usage)
Simplicity in freight billing process
(90% reduction in freight invoice generation)
31
Disclaimer
Mahindra & Mahindra herein referred to as M&M, and its subsidiary companies provide a wide array of presentations and reports, with the contributions of various professionals.
These presentations and reports are for informational purposes and private circulation only and do not constitute an offer to buy or sell any securities mentioned therein. They do
not purport to be a complete description of the markets conditions or developments referred to in the material. While utmost care has been taken in preparing the above, we claim
no responsibility for their accuracy. We shall not be liable for any direct or indirect losses arising from the use thereof and the viewers are requested to use the information
contained herein at their own risk. These presentations and reports should not be reproduced, re-circulated, published in any media, website or otherwise, in any form or manner,
in part or as a whole, without the express consent in writing of M&M or its subsidiaries. Any unauthorized use, disclosure or public dissemination of information contained herein is
prohibited. Unless specifically noted, M&M or any of its subsidiary companies is not responsible for the content of these presentations and/or the opinions of the presenters.
Individual situations and local practices and standards may vary, so viewers and others utilizing information contained within a presentation are free to adopt differing standards
and approaches as they see fit. You may not repackage or sell the presentation. Products and names mentioned in materials or presentations are the property of their respective
owners and the mention of them does not constitute an endorsement by M&M or its subsidiary companies. Information contained in a presentation hosted or promoted by M&M is
provided “as is” without warranty of any kind, either expressed or implied, including any warranty of merchantability or fitness for a particular purpose. M&M or its subsidiary
companies assume no liability or responsibility for the contents of a presentation or the opinions expressed by the presenters. All expressions of opinion are subject to change
without notice.
Copyright © 2012 Mahindra & Mahindra Ltd. All rights reserved.
Thank you Visit us at www.mahindra.com

32