accelerating techniques in volume rendering of irregular data
TRANSCRIPT
Cornput. & Graphics, Vol. 21, No. 3, pp. 289-295, 1997 (0 1997 Elsevier Science Ltd. All rights reserved
Printed in Great Britain 0097m8493/97 $17.00+0.00
PII: soo97-8493(97)ooo@5-8 Computer Graphics in China
ACCELERATING TECHNIQUES IN VO:LUME RENDERING OF IRREGULAR DATA
WEN-CHENG WANG, DING-HONG ZHOU and EN-HUA WUt
Computer Science Laboratory, Institute of Software & CAD Laboratory, Institute of Computing Technology, Academia Sinica, P.O. Box 8718, Beijing 100080, China
e-mail: [email protected]
Abstract-Volume rendering of irregular data has become a challenging research topic in the area of scientific visualization in recent years. In comparison with regular data rendering, irregular data volume rendering faces many new problems. Because cells in an irregular volume have various shape and size, volume rendering by the raycasting method has more difficulty in calculating the intersection between rays and cells, and the projection method has even greater trouble in queuing up cells, in particular concave cells. To accelerate volume rendering of irregular data, this paper presents a hybrid method which possesses the advantages of both raycasting and projection methods. The main strategy in the method is using a polygon scan conversion algorithm in 3-D space to set up a ray path with high efficiency, and by establishing intersection links to allow the operation of color compos:tion to be locally conducted on-the- fly. As a result, it is possible to produce high quality images without the requirement of the heavy task for cell queuing up and complex ray intersection calculation. Q 1997 Elsevier Science Ltd
1. INTRODUCTION
Volume rendering of irregular data has become a quite challenging topic in the area of scientific visualization in recent years. Basically, there are two approaches to direct volume rendering of scientific data, raycasting [l-5] and projection [6- 111. In the former method, colors of pixels are calculated by shooting rays through the volume, producing images of high quality but with expensive calculation. In the latter, cells are mapped onto an image plane directly through projection, and the color of each pixel on the image plane is obtained by accumulating the effects of samples along the projection path. Generally speaking, this method produces less impressive images than those produced by raycasting but less calculation is required for this method [ 121.
Since the shape and size vary greatly for the cells in an irregular volume, many new problems come up while rendering irregular data [13-201. These pro- blems include. typically for example, cells queuing up for projection, the trouble of dealing with concave cells, the complexity of sampling and the intersection calculation of raycasting. As a result, those algo- rithms which work well for regular data often work poorly in the case of irregular data.
In recent years, much work has been done in improving irregular data volume rendering. In the method proposed by Fruhauf [18], the curvilinear volumes are transformed nonlinearly to regular volumes so that sampling and intersection calcula-
+ Author for correspondence.
tion can be made efficiently. Tabatabai et al. [19] introduce complex computation to warrant the precision of direct sampling in irregular volumes. Various methods [15-171 have been proposed for cell queuing up in the projection approach, among which Giertsen [ 171 proposed a scan plan method where the ordering of cells in 3-D space is decomposed into the ordering of polygons on scan planes. To avoid the idiosyncrasy of concave cells, the general method is to subdivide a concave cell into several convex cells Pll.
In this paper, a new method is presented by a combination of raycasting and projection methods. taking advantage of the projection method for speeding up the intersection calculation and the raycasting method for composition of colors pre- cisely. At the same time, several measures are adopted further to accelerate the volume rendering. Three techniques include:
l optimizing the rendering order of cells for merging the ray path segment by segment so that cells queuing up is unnecessary.
l establishing correspondence by tables between length and color transparencies for all materials so that repetitive computation could be saved during the process of color composition.
l calculating intersection by taking advantage of the coherence of projected areas and the polygon scan conversion approach.
The proposed method will be introduced in the following section, and the accelerating techniques will be discussed in Section 3. Finally. experimental
289
290 W.-C. Wang, D.-H. Zhou and E.-H. Wu
results are given to show the efficiency of the proposed method.
2. PROPOSED METHOD
Irregular data volumes can be organized in different structures. In this paper, the volumes discussed are organized in cells where each cell is a solid shape covered closely by plane facets. The data structure for the cells and facets may be described as
Cell: {cell-no; /*No. of the cell */
value ; /* value of data */
.Eacets[] ; /* ids for the facets */
} Cell-struct;
Plane facet: {facets-no; /*No. of the
facet */
verts[l; /*vertices of the
facet */
cell-id[l; /* ids of the cells
adjacent */
} Pace-struct;
The method we use is a combination of the projection and raycasting approach. At first, all the facets or polygons which compose the cells within the data volume are conceptually projected onto the screen space, by utilizing an algorithm similar to the scan conversion method of polygons in 3-D space. except that all the intersection points between the polygons and the current scan plane should be recorded in a link chain for each pixel. Along with the process of rendering cells one by one, the color and transparency stored within the link chain will be dynamically merged and accumulated along the ray from the view point of the projection. Consequently.
high quality images comparable to raycasting results can be achieved.
The procedure of the proposed method may be described in the following three steps.
2.1. First step
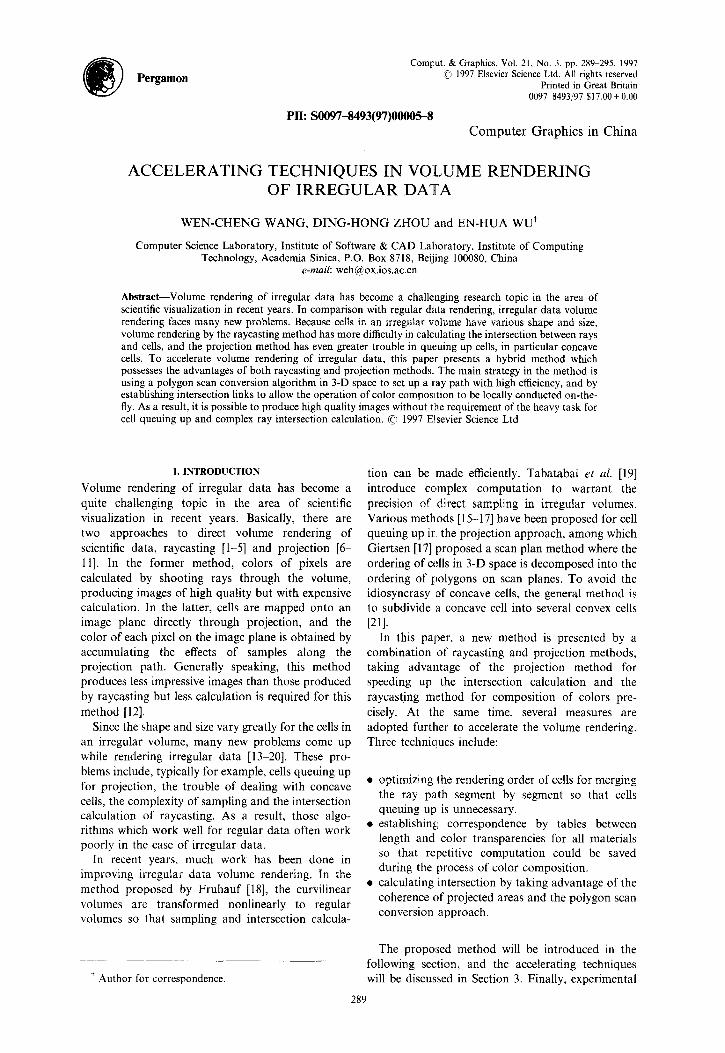
Arbitrarily select a cell from the volume and project all facets of the cell onto the image plane. As a result, each pixel will be affected by the facets an even number of times due to the nature of closeness of thl- cell. I f the cell is convex, each pixel in the projection area will be influenced by exactly two facet:,; otherwise, if the cell is concave, some pixels within the projection area may be influenced by more than two facets. To cite an example as shown in Fig. 1 by an orthogonal projection, a convex cell as shown on the left side is closely connected to a concave cell as shown on the right side in a volume. Now both cells are shown separately to facilitate our observation. Suppose a ray is shot from P, then pixel P will be influenced by two facets (ABC and BCNM) from the left cell (convex), and four facets (ACH, .4BC. BCED and DEFG) from the right cell (concave).
In order to facilitate the description of the rendering algorithm, we introduce a new concept of ‘path-distance’ which is defined as: for a parallel projection, the distance from a pixel P to a point Q is defins-d as the path-distance from the pixel P to a
facet S/, if a ray is shot from the pixel P and intersects with the facet Sn- at point Q; for a perspective projection. the distance from a viewpoint V to a point Q is defined as the path-distance from a pixel P to a facet Sk if a ray is shot from the
Screen Plane
Fig. 1
Volume rendering of irregular data 291
viewpoint V traversing through the pixel P and intersecting with the facet Sk at point Q.
After all the facets in a cell have been projected onto screen, all the path-distances related to a pixel must be sorted in an increasing order, represented as, for example tl, t2, f3, t4, . , t2j+l, t2i+2. It is easy to prove that the segments between each pair of the path-distances such as tl and t2, t3 and t4 are inside the cell.
A link is established for every pixel, with each link node associated with a traversing segment inside the cell, and all the nodes are queued up according to the values of their path-distances. The data structure for the link node as shown below also covers the accumulated color and transparency within the segment which has been merged so far.
Link node:
{ tmn; /* smaller path-distance corre-
spondinqtothetraversingseqment*/
t max;/* larger path-distance correspond-
ingtothetraversingsegment*/
facet,,in, facet,,,; /*facet-idsrelatedto
t m1nr tmax respectively*/
color; /* accumulated color within this
traversingsegment */
transparency; /* accumulated transpar-
encywithinthistraversinqsegment */
nextgointer; /*pointertothenextlink
node */
} Linknode-struct;
2.2. Second step Select another cell to be processed in the same way
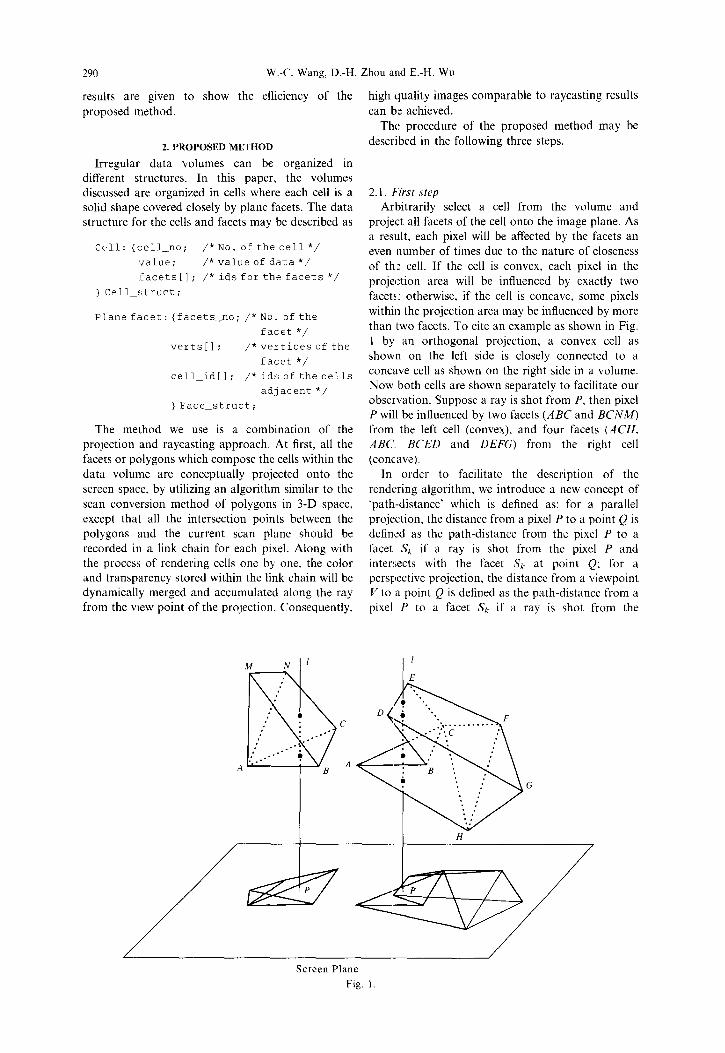
as introduced in the first step. For a pixel with a new link if its old link exists, both should be combined together, with some nodes possibly merged. Without loss of generality, an example is as shown in Fig. 2. Suppose the Old link already exists and the New link is just built up, then the combination operation will proceed as follows: for each node such as tlifl’ + tl,+J’ in the New link. comparison should be made with all the path-distances in the Old link (for example, a node tzi+r 4 t2j+2): if hi+, = t2,+2, both nodes are merged into one as tzj+i+l + t2,+2’, with their colors and transparencies composited at the same time; similarly, if tzi+2’ = t2j+l, both nodes are merged into one as tzi+l’ --f t2j+2, with their colors and transparencies composited similarly. Otherwise, the new node tzi+l’ + t2i+2’ is inserted in the Old link at a proper position according to the values of its path-distances.
Old
New
._.._
-....
Fig. 2.
As a matter of fact, New link is not required to be built in the inplementation, and the above operation is conducted on-the-fly for each new node.
2.3. Third st#cp The second step proceeds until all the cells in the
data volume are processed. Finally, all the links are checked for each pixel to see if final composition of colors is necessary. It is necessary only if a link has more than one node.
As described above, the new method integrates both projection and raycasting methods. with the help of the polygon scan conversion algorithm, the path-distances for the pixels within the projection area can be obtained quickly by using the projection method (see Section 3 in detail). By establishing intersection segment links, the difficult task of cell ordering is simplified as the merge and insert operations of nodes, and the trouble of concave cells is removed.
3.ACCELERATIONTECHNlQUES
To speed up the rendering process, three accelera- tion techniques are applied in the proposed method. Firstly. the order of cells’ projection is optimized to reduce the total length of the link nodes; secondly, calculation ‘of the path-distances for each pixel within a facet is simplified through the scan- conversion process; and thirdly, the correspondence between material-lengths and their colors, transpar- encies are stared to save repetitive computation while accumulating color for a segment.
3.1. Optimization of cells order of prqjection In order to reduce the total number of link nodes
during the process of volume rendering, it is desirable to make more merge than insert operations. Therefore, the projection order of cells is crucial. The measure we adopt is, always check the links to find the one with the largest number of nodes, then select a cell to render from all the candidates based on the number of fa.cets stored in the nodes of the link. In this way, the link would in general tend not to increase its nodes after the cell is rendered.
As describled in the last section, strict ordering of cells in our algorithm is unnecessary. However, a smart arrangement of cell storage is still desirable as far as rendering efficiency is concerned. For irregular data, various cells have different numbers of facets and various facets have different numbers of vertices, so different cells demand storage in different sizes. Therefore, WI: want the cells to be stored in such a way that they can be retrieved in the most efficient or simplest way, sequentially from the first to the last during the rendering process.
Based on the consideration above, we have the following criteria for the arrangement of cell storage:
l after a cell has been processed, the following cells to be chosen will be arranged according to their distances to the centre of the processed cell and the

292
Fig. 3.
connectivity property to the cell, from nearest to furthest gradually.
l after a concave cell is stored, the cells connected to the concave cell by the concave facets will be chosen first.
The criteria ensure that cells physically nearer to each other will be stored near to each other in their storage sequence, and therefore, while the cells are rendered straight by the storage sequence. their associated link nodes could be merged more fre- quently.
3.2. Cukulution of path-distances In the raycasting method, the intersection calcula-
tion between rays and facets is time-consuming. However, with the help of the polygon scan conversion algorithm [22, 231 in our method, the calculation of path-distances for the pixels within the area of polygon projection is quite efficient, based on those calculated at the vertices of the polygon. In the following, we discuss the strategies in this respect under the parallel and perspective projections, respectively.
3.1.1. FOP parallel projection. Without loss of generality, an example is shown in Fig. 3. Suppose Facet ABCD is projected in parallel onto the image plane. with the projected area of polygon A’B’C ‘D ‘. The path-distances for pixel A’, B’, C’, D’ to the facet ABCD can be calculated, as shown in the figure as t.(, tB. t(-, tD, respectively.
Fig. 4.
Because parallel lines in neighbour with a given interval have a constant difference of length, the path-distances for the pixels at the border of the polyg,Dn A’B’C’D’ can be computed through iterative additions. For example, suppose the interval between neighbouring pixels on the border A’D’ is m, the
r length of A D’ is t,4,D’; then r??*(tD- t,4)/t,4dD. is the constant difference of path-distances for the neigh- bouring pixels on the border A’D ‘. Therefore, only minor computation is required to be added into the stand.ard polygon scan conversion algorithm for calculating the individual path-distances for the pixels within the polygon A’B’C’D’ to the facet A BCD.
3.2 2. For perspective projection. For the perspec- tive Ilrojection, the process of calculating the path- distances is the same as introduced in Section 3.2.1 except that the method is different. An example is shown in Fig. 4.
Suppose a line AB on a facet is projected from a viewpoint V to produce its image on the line L on the screen. If a ray is shot from the viewpoint and intersects lines L and AB at points M and P, respectively. Set the coordinate system with its origin at the viewpoint and its z-axis upward as shown in
Fig. 5.
293
the figure, points P and it4 then have coordinates (-vP, )I,,, zP) and (xM, yM, I~), respectively.
To have efficient calculation for path-distances, a transformation is taken to map (x, y, z) onto (x’,y’,z’) by the following formula
x’ = x/z,
2” = I’/“,
2’ = -l/z,
As the above formula ensures a plane to plane transformation, and fiz) = -l/z is an increasing function for z > 0, it is guaranteed to obtain z’-values for every vertex by utilizing the parallel projection algorithm directly in the newly built coordinate space, for example, zP’ for point P.
Suppose the distance from V to M is nr, and tp represents the path-distance for point P, then
tp = zp * (m/Z,) = (-l/z>) * (m/Z,w)
Apparently, (m/zhf) is definite for every pixel once the viewpoint is positioned. Therefore, (m/zM) can be
saved to accelerate the calculation of path-distances for a ray in traversing through voxels.
3.3. Correspondence between material-lengths and colors and transparencies
Define the difference between t,,, and trlljn in a node as the material-length. In fact, the material- length determines the value of the accumulated color and transparency for a traversing segment associated with a node. Generally, it is very possible for equal material-lengths for every kind of material to appear repeatedly in a volume. Therefore, much time for color composition can be saved by storing the correspondence between material-lengths and colors and transparencies for all kinds of materials. Wilhelms and Gelder [ll] and Wang and Wu [24] introduce several efficient methods in accumulating colors and transparencies. In particular, authors of this paper p:-oposed a method [24] for accelerating color composition by setting up a consistent trans- parent ruler for all materials so that the composition operation could be simplified to a series of add operations.
In the new method, those arrays which store the correspondence are built up dynamically. Suppose a
Fig. I.
294 W.-C. Wang, D.-H. Zhou and E.-H. Wu
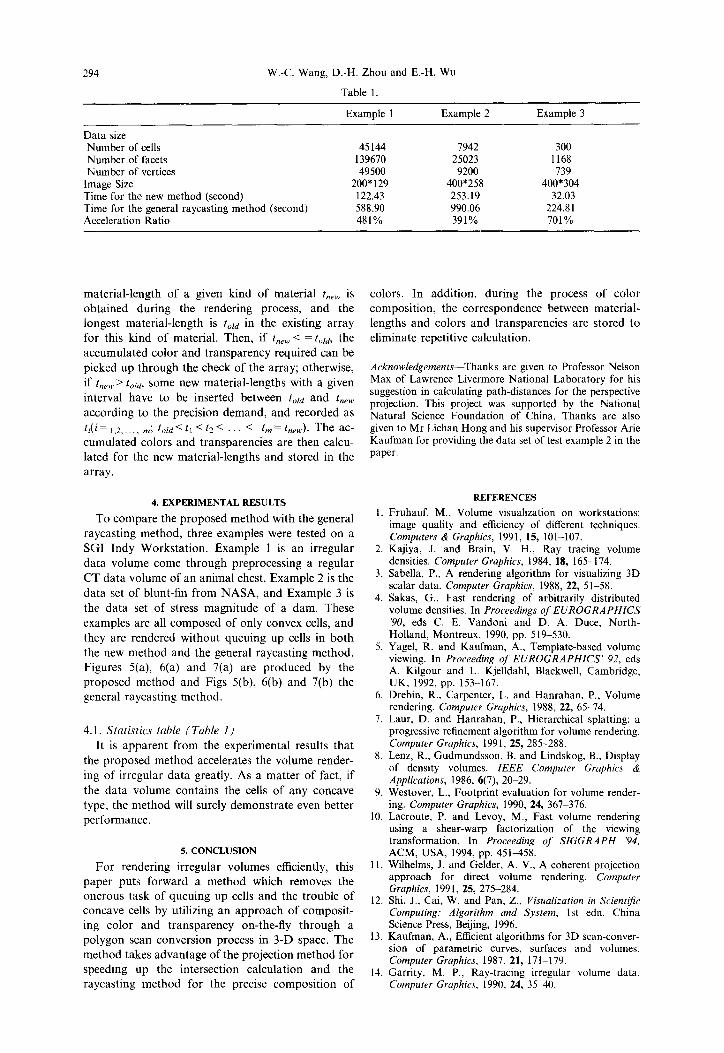
Table 1.
Example 1 Example 2 Example 3
Data size Number of cells 45144 1942 300 Number of facets 139670 25023 1168 Number of vertices 49500 9200 739
Image Size 200*129 400*258 400*304 Time for the new method (second) 122.43 253.19 32.03 Time for the general raycasting method (second) 588.90 990.06 224.81 Acceleration Ratio 481% 391% 701%
material-length of a given kind of material t,,, is obtained during the rendering process, and the longest material-length 1s toId in the existing array for this kind of material. Then, if t,,,, < = told, the accumulated color and transparency required can be picked up through the check of the array; otherwise,
if t,,,,. > told, some new material-lengths with a given interval have to be inserted between told and tnew, according to the precision demand, and recorded as
tXi= 1.2,.... k toId < tl < t2 < < t, = t,,,,). The ac- cumulated colors and transparencies are then calcu- lated for the new material-lengths and stored in the array.
4. EXPERIMENTAL RESULTS
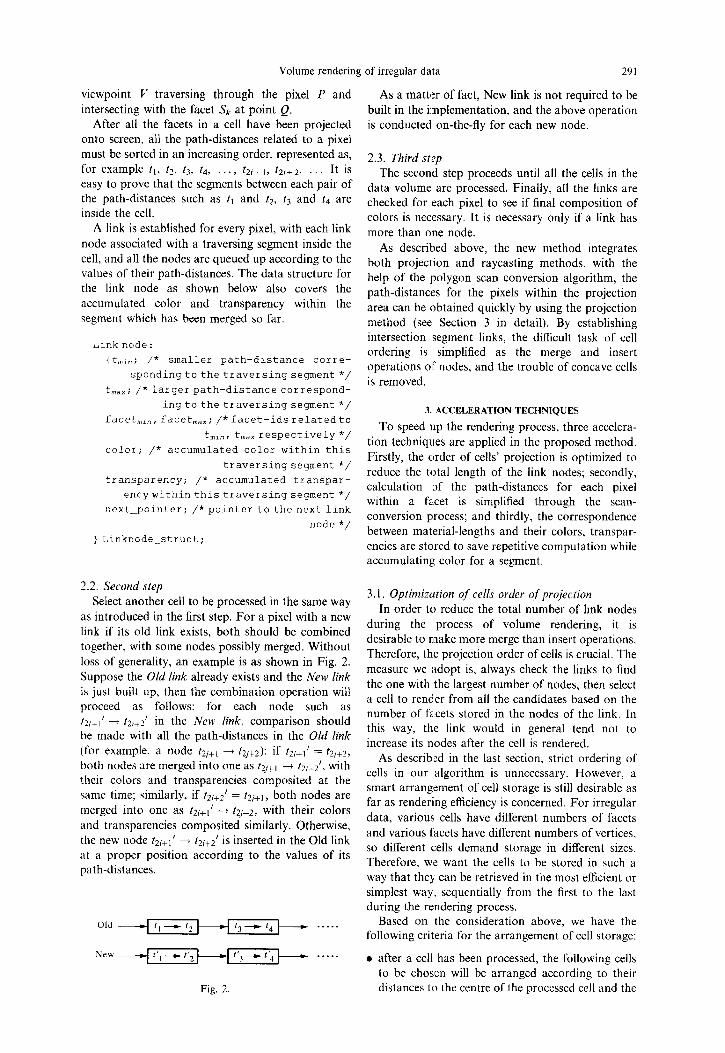
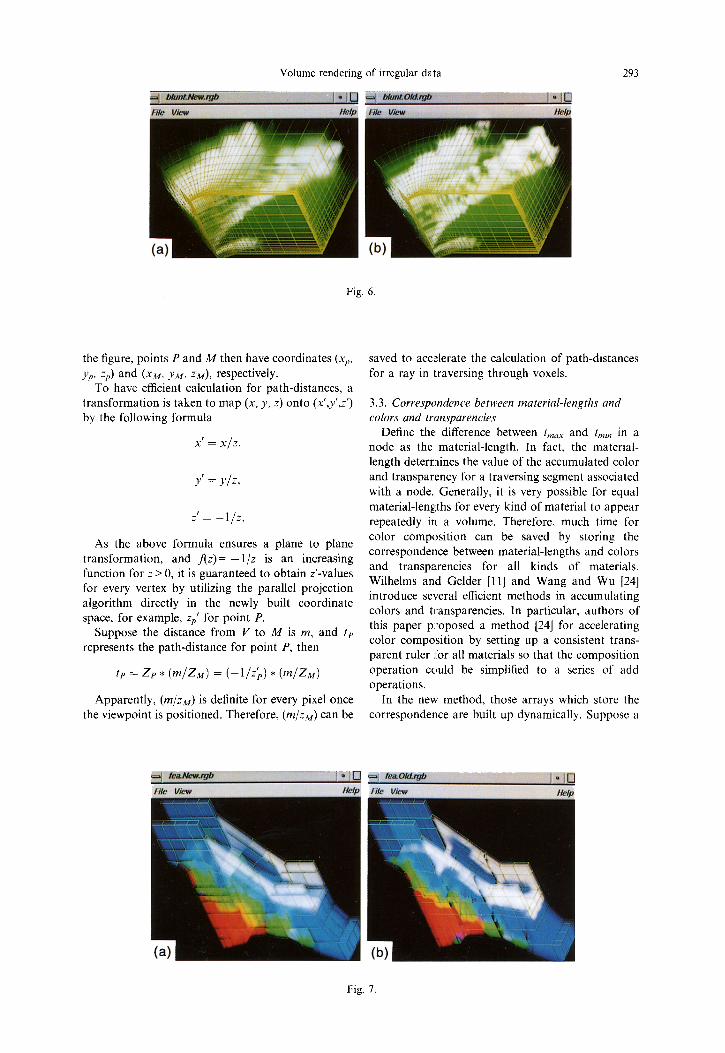
To compare the proposed method with the general raycasting method, three examples were tested on a SGI Indy Workstation. Example 1 is an irregular data volume come through preprocessing a regular CT data volume of an animal chest. Example 2 is the data set of blunt-fin from NASA, and Example 3 is the data set of stress magnitude of a dam. These examples are all composed of only convex cells, and they are rendered without queuing up cells in both the new method and the general raycasting method. Figures 5(a), 6(a) and 7(a) are produced by the proposed method and Figs 5(b), 6(b) and 7(b) the general raycasting method.
4.1. Statistics table (Table 1)
It is apparent from the experimental results that the proposed method accelerates the volume render- ing of irregular data greatly. As a matter of fact, if the data volume contains the cells of any concave type, the method will surely demonstrate even better performance.
5. CONCLUSION
For rendering irregular volumes efficiently, this paper puts forward a method which removes the onerous task of queuing up cells and the trouble of concave cells by utilizing an approach of composit- ing color and transparency on-the-fly through a polygon scan conversion process in 3-D space. The method takes advantage of the projection method for speeding up the intersection calculation and the raycasting method for the precise composition of
colors. In addition. during the process of color composition, the correspondence between material- lengths and colors and transparencies are stored to eliminate repetitive calculation.
AcknoMlledgements-Thanks are given to Professor Nelson Max of Lawrence Livermore National Laboratory for his suggestion in calculating path-distances for the perspective projection. This project was supported by the National Natural Science Foundation of China. Thanks are also given to Mr Lichan Hong and his supervisor Professor Arie Kaufman for providing the data set of test example 2 in the paper.
REFERENCES
1. Fruhauf. M., Volume visualization on workstations: image quality and efficiency of different techniques. Computers & Graphics, 1991, 15, 101-107.
2. Kajiya, J. and Brain, V. H., Ray tracing volume densities. Computer Graphics, 1984, 18, 165-174.
3. Sabella, P.. A rendering algorithm for visualizing 3D scalar data. Computer Graphics, 1988, 22, 51-58.
4. Sakas, G.. Fast rendering of arbitrarily distributed volume densities. In Proceedings of EUROGRAPHICS ‘90, eds C. E. Vandoni and D. A. Duce. North- Holland, Montreux, 1990. pp. 519-530.
5. Yagel, R. and Kaufman, A., Template-based volume viewing. In Proceeding of EUROGRAPHICS’ 92, eds A. Kilgour and L. Kjelldahl, Bbackwell, Cambridge. UK, 1992, pp. 153.-167.
6. Drebin, R., Carpenter, L. and Hanrahan. P., Volume rendering. Computer Graphics, 1988, 22, 65-74.
7. Laur, D. and Hanrahan, P., Hierarchical splatting: a progressive refinement algorithm for volume rendering. Computer Graphics, 1991, 25, 285-288.
8. Lenz, R., Gudmundsson. B. and Lindskog, B., Display of density volumes. IEEE Computer Graphics & Applications, 1986, 6(7), 20-29.
9. Westover, L., Footprint evaluation for volume render- ing. Computer Graphics, 1990, 24, 367-376.
10. Lacroute, P. and Levoy, M., Fast volume rendering using a shear-warp factorization of the viewing transformation. In Proceeding of SIGGRAPH ‘94, ACM, USA, 1994, pp. 451458.
1 I. Wilhelms, J. and Gelder, A. V., A coherent projection approach for direct volume rendering. Computer Graphics, 1991, 25, 275-284.
12. Shi, J., Cai, W. and Pan. Z., Visualization in Scientific Computing: Algorithm and System, 1st edn. China Science Press, Beijing, 1996.
13. Kaufman, A., Efficient algorithms for 3D scan-conver- sion of parametric curves, surfaces and volumes. Computer Graphics, 1987, 21, 171-179.
14. Garrity, M. P., Ray-tracing irregular volume data. Computer Graphics. 1990, 24, 3540.
Volume rendering of irregular data 295
15. Max, N.. Hanrahan, P. and Crawlis, R., Area and 20. Mao, X., Hong, L. and Kaufman. A., Splatting of volume coherence for efficient visualization of 3D curvilinea- volumes. In Proceedirrg of Visuultation ‘95. scalar functions. Computer Graphics, 1990. 24, 27-33. eds G. M Nielson and D. Silver, IEEE, U.S.A., 1995,
16. Williams. P. L., Visibility ordering meshed polyhedral. pp. 61-68 ACM Transuctions on Graphics, 1992, 11, 103-126. 21. Speray, D. and Kennon, S., Volume probes: interactive
17. Giertsen. C., Volume visualization of sparse irregular data exploration on arbitrary grids. Computer Graphics. meshes. IEEE Computer Graphics & Applications, 1992, 1990, 24(!‘), 5-12. 12, 4&4x. 22. Gordon, I)., Peterson, M. A. and Reynolds, R. A., Fast
18. Fruhauf. T., Raycasting of nonregularly structured polygon scan conversion with medical applications. volume data. In Proceedings of EUROGRAPHICS ‘94. IEEE Computer Graphics & Applications. 1994, 14(6), eds M. DEhlen and L. Kjielldahi, Blackwell, Oslo, 20-27. 1994, pp. 293-303. 23. Pineda, J.. A parallel algorithm for polygon raster-
19. Tabatabai. B.. Sessarego, E. A. and Mayer, H. F., ization. Computer Graphics, 1988, 22(4). 17-20. Volume rendering on non-regular grids. In Proceedings 24. Wang, W and Wu, E., Color composition in volume of EUROGRAPHCSP4. eds M. DrEhlen and L. rendering by using transparent degree ruler. Chinese Kjielldahl. Blackwell. Oslo. 1994, pp. 247-258. Journal qf’ Sqftwure, 1995. 6, 577-58 I.