acceleration of falling objects - memorial university · physics 1020 . experiment 3. ... in this...
TRANSCRIPT

Physics 1020 Experiment 3
Acceleration of Falling Objects
1

Physics 1020 Experiment 3
Acceleration of Falling Objects
Part I: Introduction
2
In this experiment you will study the motion of a falling ball which experiences constant acceleration. You will use a Motion Detector to measure the position of the ball as a function of time. The goals of this experiment are: 1. To represent the motion of an object through graphs of position, velocity,
and acceleration versus time. 2. To investigate the displacement versus time, velocity versus time, and
acceleration versus time graphs of a given motion. 3. To determine the value of the acceleration due to gravity g.
Physics 1020 Experiment 3
Acceleration of Falling Objects
Part II: Apparatus
3
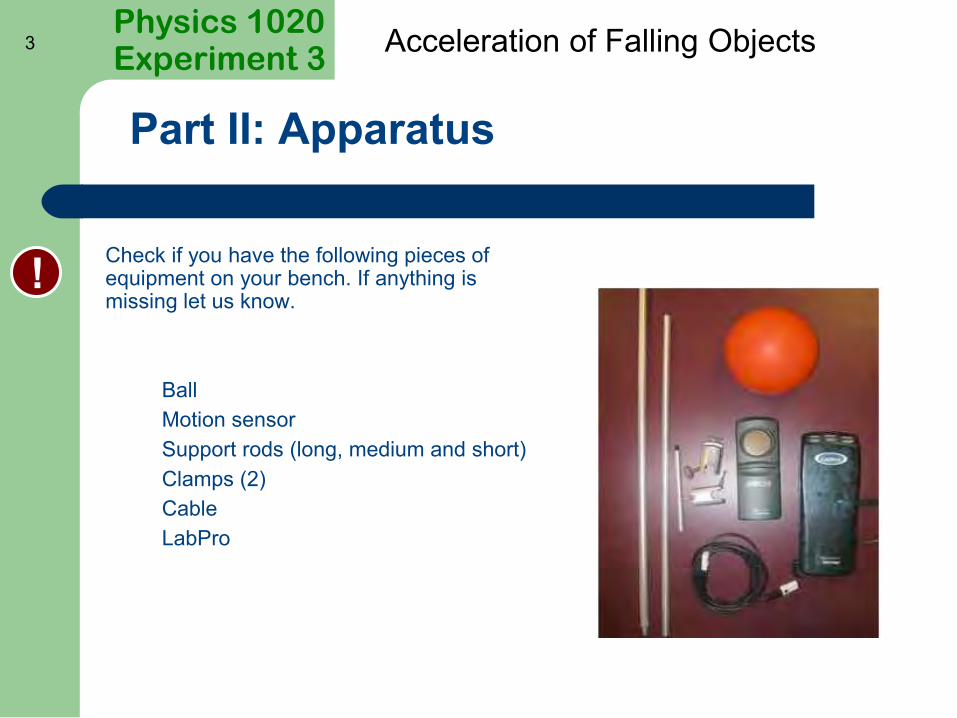
Check if you have the following pieces of equipment on your bench. If anything is missing let us know.
Ball Motion sensor Support rods (long, medium and short) Clamps (2) Cable LabPro
!

Physics 1020 Experiment 3
Acceleration of Falling Objects
Part II: Apparatus Setup
4
Assemble your apparatus as shown on the picture. Remember: The motion detector only records position within a range of 0.15 - 6 m. Be sure to remain within this range during the experiment.
Physics 1020 Experiment 3
Acceleration of Falling Objects
Part III: Data Acquisition
5
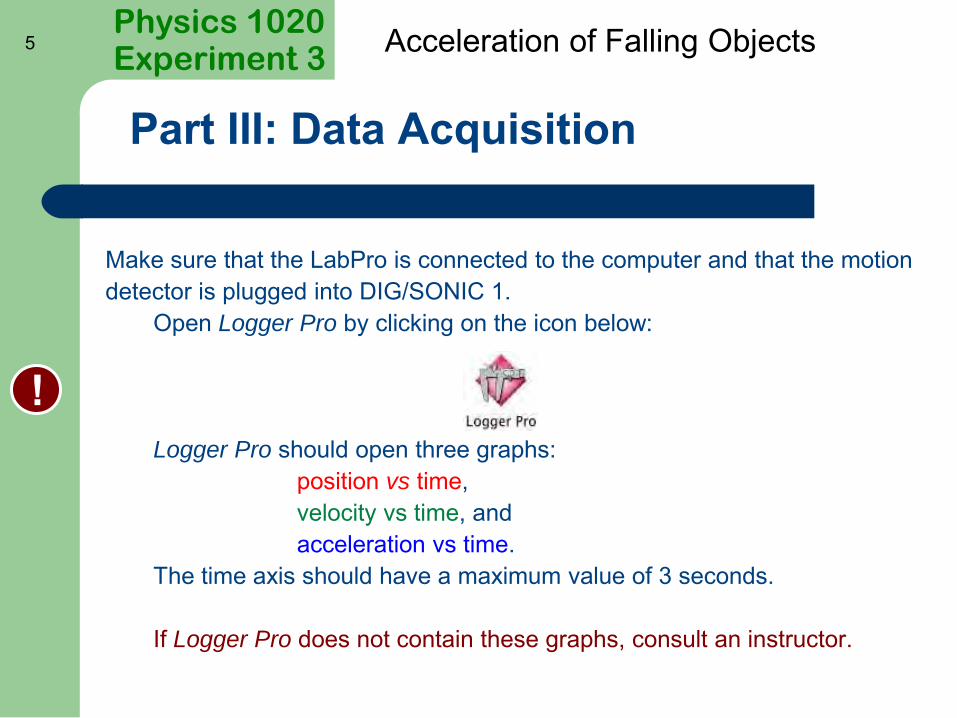
Make sure that the LabPro is connected to the computer and that the motion detector is plugged into DIG/SONIC 1. Open Logger Pro by clicking on the icon below: Logger Pro should open three graphs: position vs time, velocity vs time, and acceleration vs time. The time axis should have a maximum value of 3 seconds. If Logger Pro does not contain these graphs, consult an instructor.
!

Physics 1020 Experiment 3
Acceleration of Falling Objects
Part III: Data Acquisition
6
We want to measure the position of the ball relative to the table top, i.e. the
table top has to correspond to x = 0 m. To do this we need to “zero” our
motion detector. Follow those steps to achieve this:
1. Remove anything from the bench below motion detector.
2. In LoggerPro click “Experiment” and then “Zero”. You should hear the motion detector making a clicking sound for a few
seconds. Make sure you do not insert anything (e.g. your hand) between the
bench top and the motion detector when this happens.
!

Physics 1020 Experiment 3
Acceleration of Falling Objects
Part III: Data Acquisition
7
Collect your data by following the steps outlined below:
1. Hold the ball approximately 15 cm below the motion detector.
2. Click (or ask your partner to do that) the collect button in LoggerPro.
3. When you hear that clicking noise release the ball.
4. Wait until data collection stops. LoggerPro should now display three graphs representing the ball’s motion: position vs time, velocity vs time, and acceleration vs time. At this point the graphs normally need to be autoscaled. Click anywhere on the graph window to select it and then click the blue A in the toolbar. Do this for each of the three graphs. Examine your data. Are they reasonable? If not, repeat the experiment
or consult an instructor.
!

Physics 1020 Experiment 3
Acceleration of Falling Objects
Part IV: Data Analysis
8
When your data shows two clear bounces have an instructor check your graphs and initial your lab report.
QUESTION 1: Does the shape of your position vs time graph on LoggerPro match the graph from Prelab Question 1? Comment on any differences.
Add titles to all 3 graphs by double clicking on the white area, selecting “Graph Options” and typing in a suitable title in the “Title” field.
CP
Q
!
Autoscale graphs by first selecting the graph, then clicking the blue “A” inthe toolbar

Physics 1020 Experiment 3
Acceleration of Falling Objects
Part IV: Print your graphs
9
Print your graphs in landscape orientation by following these simple steps: 1. Click File then Page Setup.2. Select landscape orientation
and click OK.3. Click File then Print
(not Print Graph).4. Enter your names in the
Printing Options pop-upwindow and click OK.
5.IMPORTANT:In the Print window change number of copies to 2 (one for each partner) and Pages From: 1 to: 1.
P
Physics 1020 Experiment 3
Acceleration of Falling Objects
Part IV: Data Analysis
10
Staple your printed graph on appropriate page in your laboratory workbook. In LoggerPro, click the first graph to activate it and then go to Analyze menu and select Examine option. Turn on the Examine function for the other two graphs. On your printed graphs: ◉ Label the point that shows where the ball hits the table for the first time
on all 3 graphs as t1.
Moving your cursor on the screen to the correct point on the first graph should help with identifying the corresponding points on the other 2 graphs with the Examine function turned on.
LW
Physics 1020 Experiment 3
Acceleration of Falling Objects
Part IV: Data Analysis (cont.)
11
◉ On your position vs. time graph and your velocity vs time graph, circle one region where the ball is in free fall and moving down. Label this “A”
◉ On the same two graphs identify one region where the object is in free fall and moving up. Label this “B”.
◉ On all three graphs, circle the region where the motion changes from moving down to moving up. Label this “C”.
◉ On all three graphs, identify the region where the motion changes from moving up to moving down. Label this “D”
LW
LW
LW
LW
Physics 1020 Experiment 3
Acceleration of Falling Objects
Part IV: Data Analysis
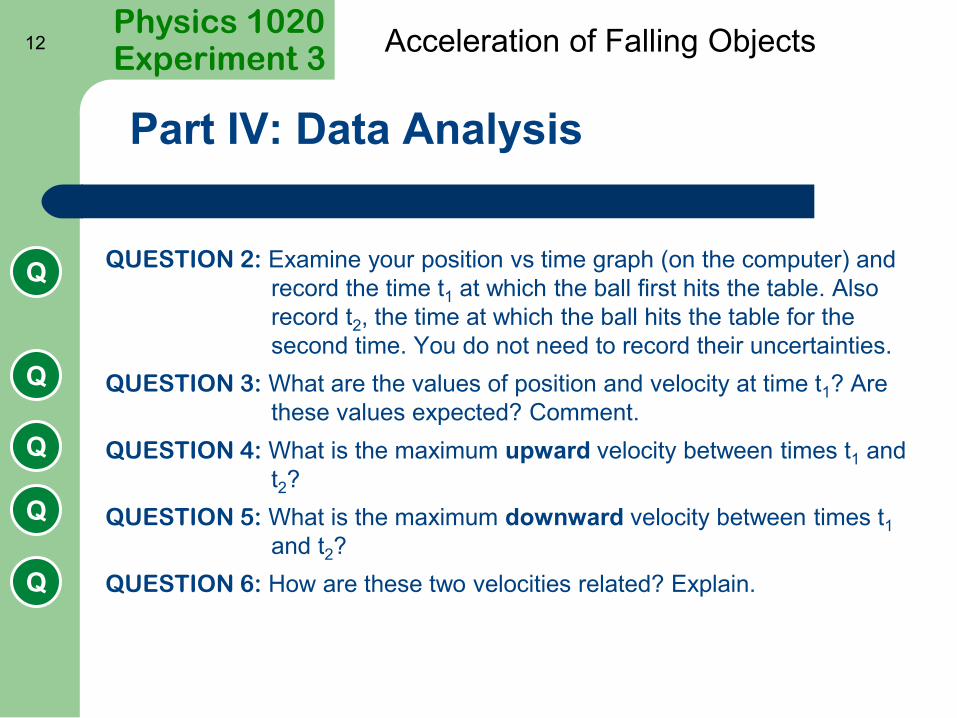
12
QUESTION 2: Examine your position vs time graph (on the computer) and record the time t1 at which the ball first hits the table. Also record t2, the time at which the ball hits the table for the second time. You do not need to record their uncertainties.
QUESTION 3: What are the values of position and velocity at time t1? Are these values expected? Comment.
QUESTION 4: What is the maximum upward velocity between times t1 and t2?
QUESTION 5: What is the maximum downward velocity between times t1 and t2?
QUESTION 6: How are these two velocities related? Explain. Q
Q
Q
Q
Q
Physics 1020 Experiment 3
Acceleration of Falling Objects
Part IV: Data Analysis
13
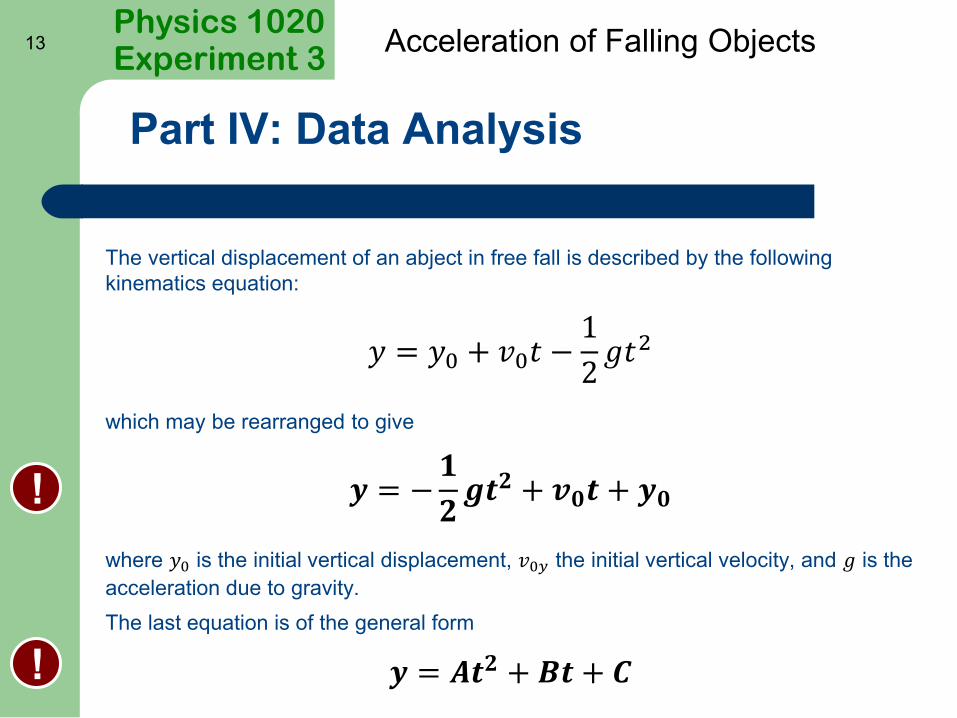
The vertical displacement of an abject in free fall is described by the following kinematics equation:
𝑦 = 𝑦0 + 𝑣0𝑡 −1
2𝑔𝑡2
which may be rearranged to give
𝒚 = −𝟏
𝟐𝒈𝒕𝟐 + 𝒗𝟎𝒕 + 𝒚𝟎
where 𝑦0 is the initial vertical displacement, 𝑣0𝑦 the initial vertical velocity, and 𝑔 is the acceleration due to gravity. The last equation is of the general form
𝒚 = 𝑨𝒕𝟐 +𝑩𝒕 + 𝑪
!
!
Physics 1020 Experiment 3
Acceleration of Falling Objects
Part IV: Data Analysis
14
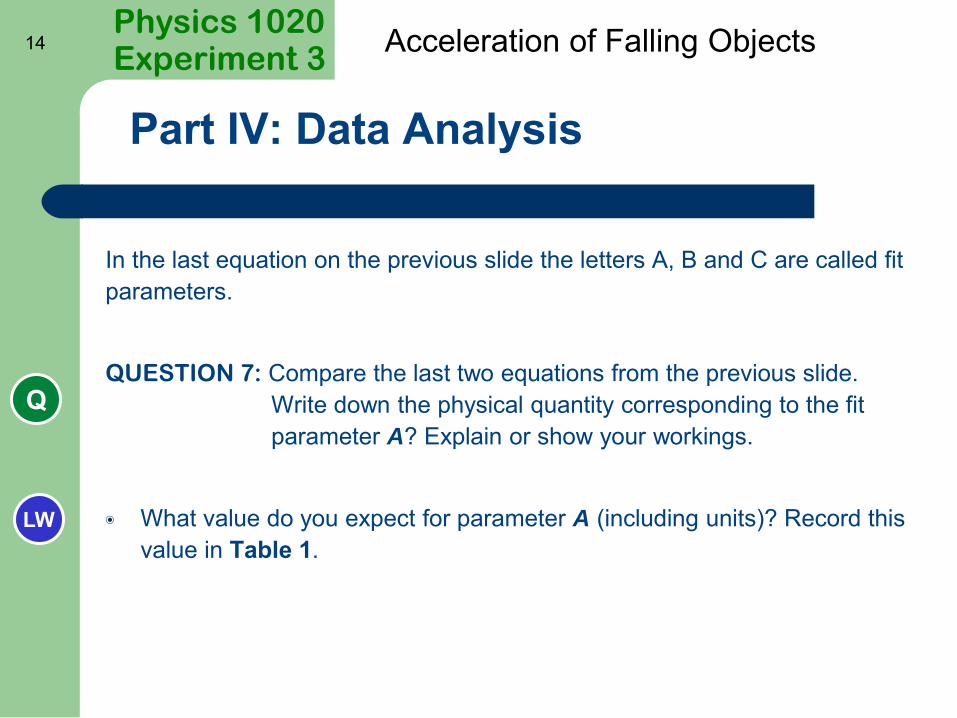
In the last equation on the previous slide the letters A, B and C are called fit parameters.
QUESTION 7: Compare the last two equations from the previous slide. Write down the physical quantity corresponding to the fit parameter A? Explain or show your workings.
◉ What value do you expect for parameter A (including units)? Record this value in Table 1.
Q
LW

Physics 1020 Experiment 3
Acceleration of Falling Objects
Part IV: Data Analysis
15
Follow the steps below to determine the value of the fit parameter A by performing curve fitting procedure in LoggerPro: 1. Click on your distance vs time graph
to activate it.2. Highlight the region between t1 and t2.3. Select Analyze and then Curve Fit.4. Under Options: Fit Type select
“Automatic”.5. Select Quadratic from the General
Equation list and click Try Fit.6. Click OK.
You should see a thin, dotted, black line going through your data points in the selected region. If that is not the case repeat the above
steps.
!

Physics 1020 Experiment 3
Acceleration of Falling Objects
Part IV: Data Analysis
16
The results of the fit, i.e. the values of all 3 fit parameters A, B and C, together with their absolute uncertainties should now be visible on your graph.
◉ Write down the value of the parameter A from the automatic fit in Table 1 of your lab book. Use proper significant digits rules for recording a quantity with its uncertainty.
QUESTION 8: Use the value of A you just found together with your answer to Question 7 to calculate the value of g (acceleration due to gravity) and its uncertainty. Show your workings. Follow the significant digits rules to write down your final answer.
NOTE: You should get a positive value
Q
LW

Physics 1020 Experiment 3
Acceleration of Falling Objects
Part IV: Data Analysis
17
The slope of the velocity vs time curve is the object’s acceleration. We will use a Linear Fit procedure to find that value from our data. To do so follow the steps below:
1. Click on your velocity vs time graph to activate it.
2. Highlight ONLY THE LINEAR PORTION of that graph between t1 and t2 (as shown opposite).
3. Go to Analyze menu and select Linear Fit.
4. Double click the results window which just appeared on your graph and select the “Show Uncertainties” option then click OK.
!
Physics 1020 Experiment 3
Acceleration of Falling Objects
Data Analysis
18
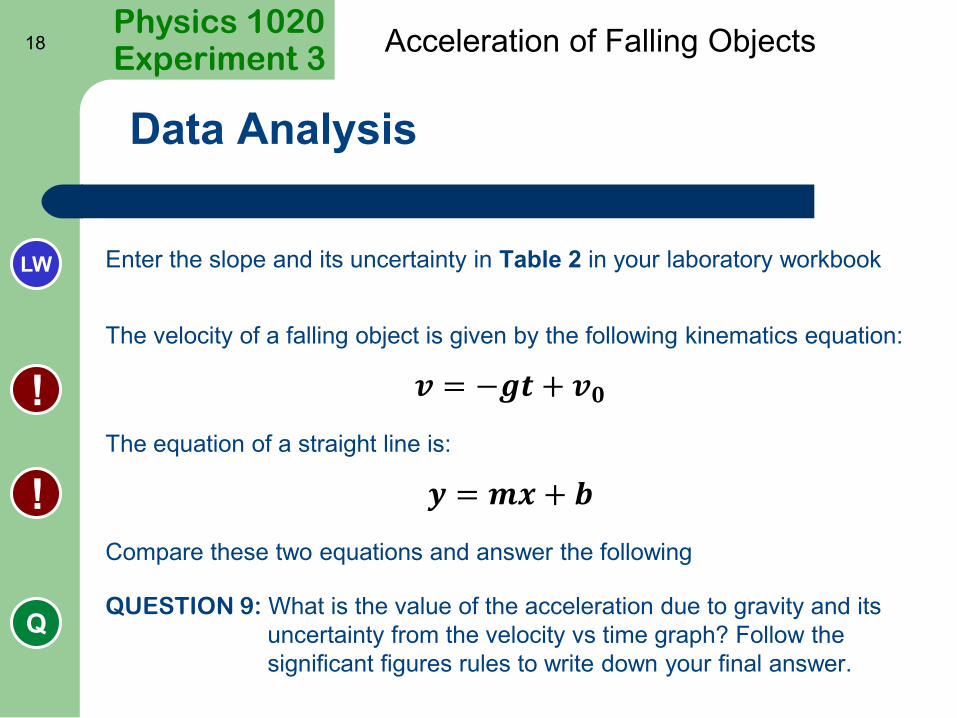
Enter the slope and its uncertainty in Table 2 in your laboratory workbook The velocity of a falling object is given by the following kinematics equation:
𝒗 = −𝒈𝒕 + 𝒗𝟎
The equation of a straight line is:
𝒚 = 𝒎𝒙 + 𝒃
Compare these two equations and answer the following
QUESTION 9: What is the value of the acceleration due to gravity and its uncertainty from the velocity vs time graph? Follow the significant figures rules to write down your final answer.
!
!
Q
LW

Physics 1020 Experiment 3
Acceleration of Falling Objects
Part IV: Data Analysis
19
We can also look at the acceleration vs time graph and determine what was the average acceleration of the ball when it was in free fall. To do this follow the steps outlined below:
1. Click on your acceleration vs time graph to activate it.
2. Highlight ONLY THE REGION OF CONSTANT ACCELERATION between times t1 and t2 (as shown).
3. Go to Analyze menu and select Statistics.
4. The average value (the mean) of the ball’s acceleration should show up on your graph.
!

Physics 1020 Experiment 3
Acceleration of Falling Objects
Part V: Data Analysis
20
Enter the Mean, Standard Deviation and Samples values from your graph in Table 3 in your Lab book.
Calculate Standard Error based on your results and enter it in Table 3.
QUESTION 10: What is the value of g and its uncertainty from the acceleration versus time graph?
Print your graph in Landscape orientation as before but with your analysis results (the white boxes on your graphs) clearly visible. Make 2 copies and
select Pages From: 1 to: 1. Attach it to your report opposite page 24.
Q
LW
LW
P
Physics 1020 Experiment 3
Acceleration of Falling Objects
Part V: Summary
21
QUESTION 11: Fill in Table 4 with each of your values of g, the uncertainties in each and the range of values for each. In the last column, indicate with “yes” or “no” whether the value of g agrees with the accepted value of 9.81 m/s2.
QUESTION 12: Identify two sources of uncertainty in this experiment and classify them as random or systematic.
• Make sure you attached your Prelab and your graphs on the
appropriate pages in your Lab book. • Place your lab book on appropriate shelf. • Don’t forget to sign out.
!
Q
Q