acceptability bias: the effects of treatment acceptability on visual analysis of graphed data
TRANSCRIPT
Journal of Psychopathology and Behavioral Assessment, Vol. 16, No. 1, 1994
Acceptability Bias: The Effects of Treatment Acceptability on Visual Analysis of Graphed Data
Charles L. Spirrison 1,2 and Lee T. M a u n e y 1
Accepted.. March 14, 1994
l, qgnettes depicting a mildly or severely self-abusive child with profound mental retardation who received either a differential reinforcement of other behavior or a contingent electric shock treatment were presented to 161 undergraduates. After subjects rated the acceptability of the given treatment on the Treatment Evaluation Inventory (TEl), they evaluated the efficacy of the given treatment based upon six AB data graphs. Visual analytic judgments were not significantly effected by type of treatment, severity of self-injurious behavior (SIB), or the treatment x SIB interaction. TEl scores differed significantly according to type of treatment. Simple and multiple correlations computed between TEI scores and graph evaluations provided evidence of acceptability bias, such that more favorable appraisals of treatment acceptability were related to perceptions of greater treatment effectiveness.
KEY WORDS: acceptability bias; Treatment Evaluation Inventory; self-injurious behavior; mental retardation.
INTRODUCTION
Graphic presentation of behavioral data is fundamental to single-sub- ject design. Rather than relying on statistical tests, the significance of sin- gle-subject data is typically assessed by visual analysis (Kratochwill & Brody, 1978). Visual analysis refers to the process of drawing inferences about an intervention effect based upon a visual examination of graph data. The ac- curacy of visual analysis has become a controversial issue (cf. Maytas &
1Department of Psychology, Mississippi State University, PO Drawer 6161, Mississippi State, Mississippi 39762-6161.
2To whom correspondence should be addressed.
85
0882-2689/94/0300-0085507.00/0 © 1994 Plenum Publishing Corporation
86 Spirrison and Mauney
Greenwood, 1990; Parsonson & Baer, 1986). Several studies have docu- mented low levels of agreement among judges who consider identical sets of graphed data (e.g., DeProspero & Cohen, 1979; Gottman & Glass, 1978; Ottenbacher, 1986, 1990). As Kazdin (1982) noted,
Perhaps the major issue pertains to the lack of concrete decision rules for determining whether a particular demonstration shows or fails to show a reliable effect. The process of visual inspection would seem to permit, if not actively encourage, subjectivity and inconsistency in the evaluation of intervention effects. (p. 239)
Some researchers have attempted to identify the conditions under which visual analysis produces poor interrater reliability (e.g., Maytas & Green- wood, 1990; Ottenbacher, 1990). Their efforts have emphasized the physical components of graphed data (e.g., mean shift across phases, serial depend- ency, variability among data points) and how these physical components affect the (in)consistency of inferences among judges. The study of graphic factors, the physical components of graphed data, allows one to identify structural features of graphs which pose threats to the validity of visual inference. In addition to these graphic factors, there are extragraphic con- textual factors which also hold the potential to influence adversely the re- liability of visual analysis.
In practice, visual analysis considers the data of specific clients, target behaviors, and treatments. If visual analysis is, to some extent, a subjective procedure, one could expect extragraphic considerations, such as the rater's impressions of the client, the client's malady, and the employed treatment, to influence the inferences drawn during visual analysis. The present in- vestigation considered whether one extragraphic factor, treatment accept- ability, had a demonstrable impact on visual analysis.
The treatment acceptability construct emerged in the late 1970s as an important consideration to applied behaviorists. Kazdin (1981) provided a definition: "Treatment acceptability refers to judgments by laypersons, clients, and others of whether treatment procedures are appropriate, fair, and reasonable for the problem or client" (p. 493). The treatment accept- ability construct has received considerable attention in the literature (e.g., Kazdin, 1980a, b, 1984; Frentz & Kelley, 1986; Singh, Watson, & Winton, 1987; Tarnowski, Mulick, & Rasnake, 1990). A review of this literature in- dicates that less restrictive interventions that are designed to increase adap- tive behavior (e.g., differential reinforcement of other/incompatible behavior, stimulus control) tend to be rated as more acceptable than the relatively more restrictive interventions that are employed to eliminate a maladaptive behavior (e.g., overcorredtion, physical restraint, and electric shock).
Acceptability Bias 87
In addition to treatment comparisons, several studies have also evalu- ated the impact of problem severity on treatment acceptability. Specifically, the depicted severity of the client's problem (e.g., mild vs. severe) is ma- nipulated and the effect on treatment acceptability evaluated. Findings have varied. Some researchers have noted a significant treatment x severity of problem interaction, such that the more restrictive treatments are seen as relatively more acceptable when applied to clients who exhibit severe prob- lems than when they are applied to clients with milder problems (e.g., Miltenberger, Lennox, & Erfanian, 1989, Tarnowski, Rasnake, Mulick, & Kelly, 1989). In other studies, however, the treatment x severity of problem interaction was not confirmed (e.g., Tarnowski, Mulick, & Rasnake, 1990, Kazdin, 1980a; Spirrison, Noland, & Savoie, 1992).
In the present study, the traditional treatment acceptability research paradigm (i.e., manipulation of treatment type and severity of problem be- havior vignette descriptions) was supplemented with a series of visual analy- sis tasks. This permitted a test of the effects of type of treatment (i.e., differential reinforcement of other behavior vs. contingent electric shock) and severity of problem behavior (i.e., mild vs. severe self-injurious behav- ior) on treatment acceptability and visual analysis evaluations. Of central interest, however, was whether the treatment acceptability and visual analy- sis judgments shared a significant amount of variance. That is, do notions about the acceptability of a given treatment influence the visual inferences drawn from graphed treatment data?
METHOD
Subjects
Subjects were 161 students enrolled in undergraduate psychology classes, some of whom earned extra credit for their participation. Subjects were treated in accord with APA ethical guidelines.
Procedure
Groups of subjects were assembled in a classroom. Following in- formed consent procedures, each subject received a packet which con- tained, in order, general instructions, one case and treatment description, one Treatment Evaluation Invenfory (TEI), graph instructions, and six sheets that each depicted as AB graph and a rating scale. The general in-
88 Spirrison and Mauney
structions advised subjects to express their own opinions and also asked that they not refer to their previous answers.
Materials
Case Descriptions. Case descriptions were of an l 1-year-old pro- foundly retarded boy, "John," who engaged in self-injurious behavior (SIB) (i.e., head-slapping). The SIB was depicted as either mild (i.e., facial bruises that "are not a significant health threat") or severe (hairline fractures of the head and nose that "are a significant health threat"). Half of the pack- ets indicated that John exhibited mild SIB; the other half, severe. Each case description was followed by one of two treatment descriptions.
Treatment Descriptions. Treatment descriptions presented either a differential reinforcement of other behavior (DRO) or a contingent elec- tric shock (CES) procedure. In the DRO condition, John was described as liking to play with blocks and draw with markers. Because John did not self-abuse while playing or drawing, staff members reinforced these activities with a small cup of fruit juice. In the CES condition, it was noted that each time John exhibited self-abuse, a staff member delivered "a safe but noticeable" 0.5 second shock to John's arm via a small battery oper- ated device. Half of the packets presented the DR O treatment; the other half, CES. Severity of SIB was evenly distributed across the treatment con- dition. Case and treatment descriptions were randomly assigned to sub- jects.
Treatment Evaluation Inventory. The Treatment Evaluation Inventory (TE D was developed by Kazdin (1980a) to assess the treatment accept- ability construct. The TEI, which is comprised of 15 7-point Likert-type items, asks respondents to rate the extent to which (a) the treatment is acceptable, (b) the respondent would be willing to carry out the treatment, (c) the treatment would be suitable for individuals having problems other than those specified, (d) the treatment is cruel or unfair, (e) the treatment is likely to be effective, and (f) the respondent likes the treatment proce- dure. Scores from the scale's individual items are added together to provide an index of general treatment acceptability. The TEI has been used in sev- eral investigations (e.g., Cavell, Frentz, & Kelley, 1986a, b; Frentz & Kelley, 1986; Kazdin, 1980a, b, 1981, 1984; Kazdin, French, & Sherick, 1981; Spir- rison et aL, 1992).
Graphs. Graph instructions preceded the graphs. These instructions explained that the six graphs depicted six possible outcomes of John's treat- ment, the A phase represented John's'SIB behavior before treatment, and the B phase reflected John's SIB behavior during treatment and noted,

Acceptability Bias 89
Each phase records the percentage of time John does not engage in self-injurious behavior. Therefore, the higher the lines in the graph, the better John is doing. Your job is to look at each graph to determine whether John's treatment increased the amount of time he did not engage in self-injurious behavior and then put an x in the space which best represents your answer.
Six AB design graphs were presented to subjects. Each graph occu- pied one sheet of paper. Graphs were essentially identical to those em- ployed by Ottenbacher (1990). For each graph, the A phase was labeled with a large "A" and the statement, "Before Treatment: Percentage of time John did no t engage in head slapping." Each B phase was labeled with a large "B" and the statement, "During Treatment: Percentage of time John did no t engage in head slapping." At the bottom of each graph was a 7- point Likert scale with the following anchors: 1, "Treatment is most defi- nitely very ineffective;" 4, "Cannot tell;" and 7, "Treatment is most definitely very effective." Within each test packet, the order of the graph presentation was randomized via a random numbers table.
A composite graph evaluation (CGE) score was computed for each subject based upon the subject's ratings of the six graphs. CGE scores were derived by adding together the ratings produced by the given subject for each of the six graphs. The possible range of CGE scores was 6 to 42. CGE scores were used in our analyses because we were interested in in- vestigating general effects of extragraphic factors on graphic analysis. Be- cause the six AB graphs represented a variety of possible outcomes and graphic characteristics (e.g., mean shift, variability, slope, level, overlap, and serial dependency), the CGE score served as a global measure of visual analytic impressions of AB graphs.
RESULTS
To test the impact of type of treatment and self-injurious behavior on treatment acceptability and graph evaluations, a 2 (treatment) x 2 (SIB) multivariate analysis of variance considered the TEI total score and CGE scores as dependent measures. Main effects for treatment were statistically significant IF(2, 156) = 49.98, p < .001]. The simple effects associated with the treatment main effect indicated that the composite graph evaluation scores were not significantly affected by treatment [F(1, 157) = 2.95, p = .09] but that the TEI total scores were [F(1, 157) = 99.29, p < .001]. The TEI ratings of DRO (M = 82.07) were significantly higher than those of CES (M = 56.76). The main effects for SIB [F(2, 156) = 1.40, p = .250] and the treatment x SIB interaction [F(2, 156) = 0.23, p = .792] were not statistically significant, nor were any of the associated simple effects.
90 Spirrison and Mauney
Pearson r correlation coefficients assessed the relationship between TEI scores and graph evaluation ratings. For the entire set of subjects, the correlation coefficient between TEI and CGE scores was statistically sig- nificant [r(159) = .30, p < .001, two-tailed]. Additional correlational analy- ses were conducted to assess whether the T E I - C G E relationships remained apparent within the treatment and SIB conditions. Within treatment and collapsing across SIB conditions, statistically significant relationships were found between TEI total scores and composite graph evaluations [for DRO, r(79) = .30, p = .006, two-tailed; for CES, r(78) = .27, p = .014, two-tailed]. Statistically significant relationships were also observed within the SIB conditions [for mild SIB, r(80) = .26, p = .016, two-tailed; for severe SIB, r(77) = .35, p = .002, two-tailed].
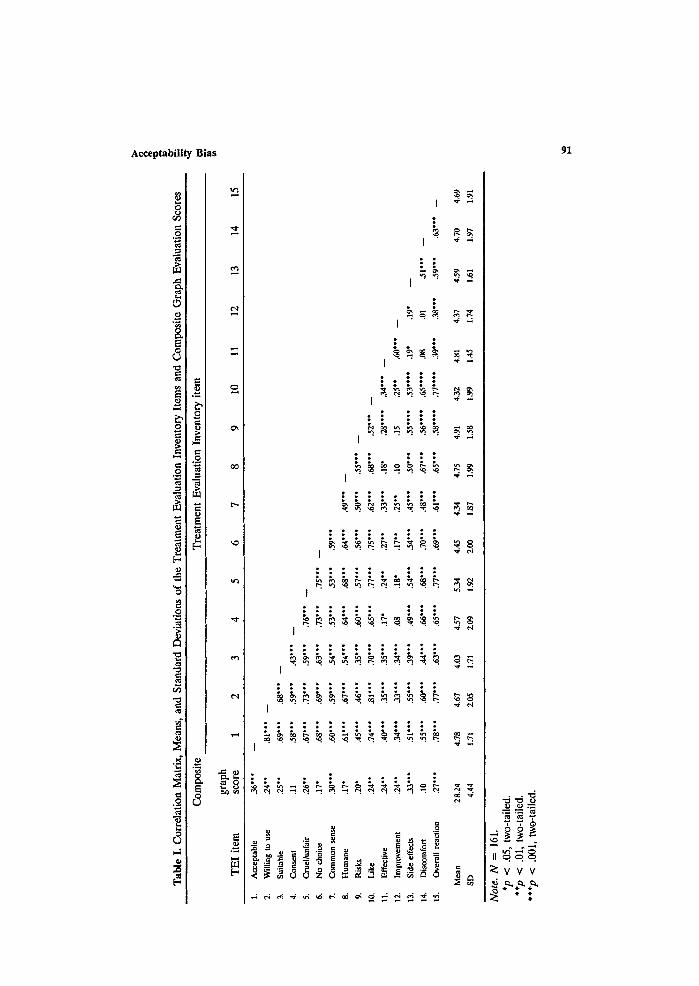
A standard multiple regression analysis was conducted to assess the extent to which the individual TEI items, in combination, were predictive of the composite graph evaluations. Table I presents the initial correlation matrix of the TEI items and CGE Scores. As can be seen in Table I, of the 15 TEI items, all but two (i.e., Items 4 and 14) were significantly as- sociated with CGE scores. The standard multiple regression indicated that the TEI items accounted for 27% (19% adjusted) of the variance of the CGE Scores and yielded an R that was significantly different from zero [R = .52; F(15, 145) = 3.49, p < .0001].
DISCUSSION
The process of visual analysis requires one to render a judgment about the efficacy of a treatment based upon visual inspection of graphed data. When visual analysis is employed, the judgement is, literally, in the eye of the beholder. The present study supports the general hypothesis that extragraphic factors influence visual analytic judgments. More specifically, the findings provide evidence of a phenomenon that we call acceptability bias. Acceptability bias refers to the impact of the visual analyst's percep- tion of the acceptability of a given treatment on the visual analyst's efficacy judgments of that given treatment. We presume that acceptability bias is systematic, such that more positive perceptions of treatment acceptability are related to more generous appraisals of t reatment efficacy, whereas more negative appraisals of acceptability are associated with more austere estimates of treatment efficacy.
In our data, graph evaluations were not significantly influenced by type of treatment ( D R O vs. CES), severity of SIB (mild vs. severe), or the treatment x SIB interaction. The treatment acceptability scores were sig- nificantly affected by type of treatment but not SIB or the treatment x SIB
,.7
Tab
le I
. C
orre
lati
on M
atri
x, M
eans
, an
d S
tand
ard
Dev
iati
ons
of t
he T
reat
men
t E
valu
atio
n In
vent
ory
Item
s an
d C
ompo
site
Gra
ph E
valu
atio
n Sc
ores
Com
posi
te
Tre
atm
ent
Eva
luat
ion
Inve
ntor
y it
em
m,
grap
h T
EI
item
sc
ore
1 2
3 4
5 6
7 8
9 10
11
12
13
14
15
1.
Acc
epta
ble
36**
* --
2.
Wil
ling
to
use
.24*
*
3.
Sui
tabl
e .2
5**
4.
Con
sent
.1
1
5,
Cru
el/u
nfai
r .2
6**
6.
No
cho
ice
.17"
7.
Co
mm
on
sen
se
.30*
**
8.
Hu
man
e .1
7"
9.
Ris
ks
.20*
10,
Lik
e ,2
4"*
11,
Eff
ecti
ve
.24*
*
12.
Impr
ovem
ent
.24*
*
13.
Sid
e ef
fect
s .3
3***
14.
Dis
com
fort
.1
0
15.
Ove
rall
rea
ctio
n .2
7***
Mea
n
28.2
4
SD
4.
44
.81'
**
--
.69*
**
.68"
**
--
.58*
**
.59*
**
.43*
**
--
.67*
**
.73*
**
.59*
**
.76*
**
--
.68*
**
.69*
**
.63*
**
.73"
**
.75*
**
--
.60"
**
.59"
**
.54"
**
.53"
**
.53"
**
.59"
**
• 1'
**
.67*
**
.54"
**
,64*
**
.68*
**
.64*
**
A9*
**
--
.45'
**
.46*
**
.35*
**
.60*
**
.57*
**
.56'
**
.50*
**
.55*
**
--
.74*
**
.81'
**
.70*
**
.65*
**
.77*
'*
.75*
**
.62*
**
.68*
**
.52*
**
--
.40*
**
.35*
**
.35*
**
.17"
.2
4**
.27*
* .3
3***
.1
8"
.28*
***
.34
°**
--
.34"
**
.33*
**
.34*
**
.08
.18'
.1
7"*
.25*
* .1
0 .1
5 .2
5**
.60*
**
.51"
**
.55"
**
.39*
**
.49"
**
.54*
**
,54"
**
.45*
**
.50"
**
.55"
***
.53'
***
.19'
.1
9"
--
.55
**°
.60*
**
.44*
**
.66*
**
.68"
**
.70"
**
.48*
**
.67*
**
.56*
***
.65*
***
.08
.01
.51"
**
--
.78"
**
.77*
**
.63"
**
.65"
**
.77"
**
.69"
**
.61"
**
.65"
**
,58'
***
,77"
***
.39"
**
.38*
**
.59*
**
.63*
**
--
4.78
4.
67
4.03
4.
57
5.34
4.
45
4.34
4.
75
4.91
4.
32
4.81
&
37
4.59
4.
70
4.69
1.71
2,
05
1.71
2.
09
1~2
ZOO
1.
87
1.99
1.
58
1.99
1.
45
1.74
1.
61
1.97
1.
91
Not
e. N
=
161.
*p
<
.05,
tw
o-ta
iled
. **
p <
.01,
tw
o-ta
iled.
**
*p
< .0
01,
two-
taile
d.
92 Spirrison and Mauney
interaction. Graph evaluation scores were, however, significantly related to treatment acceptability scores. Pearson r's computed between CGE and to- tal TEI scores were statistically significant across the entire subject popu- lation and within each of the treatment (collapsing across SIB) and SIB (collapsing across treatment) conditions. That acceptability bias was found within each treatment condition is particularly noteworthy. These relation- ships suggest that it is the individual judge's perception of the treatment's acceptability, and not the type of treatment per se, which influences visual analytic inferences.
Because there is some controversy as to whether the treatment ac- ceptability construct, in general, and the TEI, in particular, are unidimen- sional (e.g., Spirrison, 1992, Spirrison et al., 1992), we also analyzed TEI data at the item level. Of the 15 individual TEI items, 13 yielded significant Pearson r correlations (all in the positive direction) with the graph evalu- ation scores. Thus in our data, with the exception of perceptions about the need for client consent (i.e., Item 4) and the improbability of client dis- comfort during treatment (i.e., Item 14), all facets of the TEI item pool were significantly related to visual analytic judgments of treatment out- come. We speculate that features of our fictional client lessened the sali- ence of the consent and discomfort issues. It is difficult to obtain informed consent from profoundly retarded children. With SIB, the person already experiences self-inflicted discomfort.
The multiple regression procedure, in which CGE scores served as the dependent measure and the 15 TEl items served as independent vari- ables, illustrated that the TEI items, in combination, accounted for 27% (19% adjusted) of the variance associated with the graph evaluation scores. Thus, in our data, approximately one-quarter of the interjudge disagree- ment across the AB graphs was attributable to the judges' perceptions of the treatment. If visual analysis inspires subjectivity and inconsistency as Kazdin (1982) implies, it would appear that the acceptability bias (partially) directs this subjectivity and inconsistency.
Further research is required to ascertain the extent to which the ac- ceptability bias effect documented here generalizes to other graph formats and other subject populations. In our study, subjects evaluated graphs of the AB single-case design. We used the AB design in present study because this design is the most basic single subject configuration. We acknowledge that the AB Single-case design is not the most readily interpretable of the available single-case designs (e.g., ABA, ABAB, multiple baseline) and, thus, would be expected to produce greater amounts of interjudge disagree- ment than would other single-case design formats. Nevertheless, there is little reason to conclude that acceptability bias is not found in the visual analytic judgements of ABA, ABAB, and multiple baseline designs. AI-
Acceptability Bias 93
though the latter designs may yield lower overall levels of interjudge dis- agreement, it remains tenable that acceptability bias accounts for a signifi- cant amount of the disagreement variance. Stated another way, when judges are asked to rate their confidence in a treatment effect (e.g., on a Likert- style continuum), most graphs would be expected to yield less than perfect agreement among a number of judges. We posit that much of any level of disagreement among raters can be explained by the acceptability bias. Fur- ther research is required to test this hypothesis.
The question of who comprises the ideal subject population for fur- ther studies is an interesting one. Although one could argue that the in- terpretation of single-subject data should be conducted only by professionals who are well trained in graphic analysis, clearly this is not always the case. In many facilitates for people with mental retardation, for example, single- subject data graphs serve as documentation of treatment viability and jus- tification for the use of given interventions. Habilitation team members, quality assurance officers, outside surveyors, and parents often have the opportunity to review the treatment efficacy data regardless of whether they possess any special expertise in single-case methodology or graphic analysis. Because our subjects received only cursory information about the process of graphic analysis, our results would seem to be most applicable to other graphic analysis novices. Field research which employs both untrained (e.g., parents) and well-trained graphic analysts would allow for possible repli- cation of our findings within each group and, further, would provide an opportunity to analyze extragraphic sources of disagreement between the untrained and the well-trained.
ACKNOWLEDGMENT
The authors are grateful to Dr. Brian Neville for his review of an early draft of the manuscript.
REFERENCES
Cavell, T. A., Frentz, C. E., & Kelley, M. L. (1986a). Acceptability of paradoxical interventions: Some nonparadoxical findings. Professional Psychology: Research and Practice, 17, 519-523.
Cavell, T. A., Frentz, C. E., & Kelley, M. L. (1986b). Consumer acceptability of the single case withdrawal design: Penalty for early withdrawal? Behavior Therapy, 17, 82-87.
DeProspero, A., & Cohen, S. C. (1979). Inconsistent visual analysis of intrasubject data. Journal of Applied Behavior Analysis, 12, 573-579.
94 Spirrison and Mauney
Frentz, C. E., & Kelley, M. L. (1986). Parents' acceptance of reductive treatment methods: The influence of problem severity and perception of child behavior. Behavior Therapy, 17, 75-81.
Gottman, J. M., & Glass, G. V. (1978). Analysis of interrupted time-series experiments. In T. R. Kratochwill (Ed.), Single-subject research: Strategies for evaluating change (pp. 197-235). New York: Academic Press.
Kazdin, A. E. (I980a). Acceptability of alternative treatments for deviant child behavior. Journal of Applied Behavior Analysis, 13, 259-273.
Kazdin, A. E. (1980b). Acceptability of time-out from reinforcement procedures for disruptive child behavior. Behavior Therapy, 11, 329-344.
Kazdin, A. E. (1981). Acceptability of child treatment techniques: The influence of treatment efficacy and adverse side effects. Behavior Therapy, 12, 493-506.
Kazdin, A. E. (1982). Single-case research design: Methods for clinical and applied settings. New York: Oxford University Press.
Kazdin, A. E. (1984). Acceptability of aversive procedures and medication as treatment alternatives for deviant child behavior. Journal of Abnormal Child Psychology, 12, 289-302.
Kazdin, A. E., French, N. H , & Sherick, R. B. (1981). Acceptability of alternative treatments for children: Evaluations for inpatient children, parents, and staff. Journal of Consulting and Clinical Psychology, 49, 900-907.
Kratochwill, T. R., & Brody, G. H. (1978). Single-subject designs: A perspective on the controversy over employing statistical inference and implications for research and training in behavior modification. Behavior Modification, 2, 291-307.
Maytas, T. A., & Greenwood, K. M. (1990). Visual analysis of single-case time series: Effects of variability, serial dependence, and magnitude of intervention effects. Journal of Applied Behavior Analysis, 23, 341-351.
Miltenberger, R. G., Lennox, D. B., & Erfanian, N. (1989). Acceptability of alternative t reatments for persons with mental retardation: Ratings from institutional and community-based staff. American Journal on Mental Retardation, 93, 388-395.
Ottenbacher, K. (1986). Reliability and accuracy of visually analyzing graphed data from single-subject designs. American Journal of Occupational Therapy, 40, 464-469.
Ottenbacher, K. (1990). Visual Inspection of single-subject data: An empirical analysis. Mental Retardation, 28, 283-290.
Parsonson, B. S., & Baer, D. M. (1986). The graphic analysis of data. In A. Poling & R. W. Fuqua (Eds.), research methods in applied behavior analysis: Issues and advances (pp. 299-311). New York: Plenum Press.
Singh, N. N., Watson, J. E., & Winton, A. S. W. (1987). Parents' acceptability ratings of alternative treatments for use with mentally retarded children. Behavior Modification, 11, 17-26.
Spirrison, C. L. (1992). Measurement and meaning: The treatment acceptability construct and comments on Lundervold et al. (1991). Behavioral Residential Treatment, 7, 259-264.
Spirrison, C. L., Noland, K. A., & Savoie, L. B. (1992). Factor structure of the Treatment Evaluation Inventory: Implications for measurement of treatment acceptability. Journal of Psychopathology and Behavioral Assessment, 14, 65-79.
Tarnowski, K. J., Rasnake, L. K., Mulick, J. A., & Kelly, P. A. (1989). Acceptability of behavioral interventions for self-injurious behavior. American Journal on Mental Retardation, 93, 575-580.
Tarnowski, K. J., Mulick, J. A., & Rasnake, L. K. (1990). Acceptability of behavioral interventions for self-injurious behavior: Replication and interinstitutional comparison. American Journal on Mental Retardation, 95, 182-187.