accepted for meas. in radiat. - oklahoma state...
TRANSCRIPT

1 2 3 4 5 6 7 8 9 10 11 12 13 14 15 16 17 18 19 20 21 22 23 24 25 26 27 28 29 30 31 32 33 34 35 36 37 38 39 40 41 42 43 44 45 46 47 48 49 50 51 52 53 54 55 56 57 58 59 60 61 62 63 64 65
1
Luminescence properties of BeO optically stimulated luminescence (OSL)
detectors
Eduardo G. Yukihara
Physics Department, Oklahoma State University, Stillwater, OK 74078, USA
Contact information:
145 Physical Sciences II
Stillwater, OK 74078 USA
Phone: +1-405-744-6535
E-mail: [email protected]
*Manuscript
Accep
ted fo
r pub
licati
on
in Rad
iat. M
eas.
(2011
)

1 2 3 4 5 6 7 8 9 10 11 12 13 14 15 16 17 18 19 20 21 22 23 24 25 26 27 28 29 30 31 32 33 34 35 36 37 38 39 40 41 42 43 44 45 46 47 48 49 50 51 52 53 54 55 56 57 58 59 60 61 62 63 64 65
2
Luminescence properties of BeO optically stimulated luminescence (OSL)
detectors
Eduardo G. Yukihara
Physics Department, Oklahoma State University, Stillwater, OK 74078, USA
Abstract
The objective of this work is to investigate basic luminescence properties of BeO optically
stimulated luminescence (OSL) detectors, including the OSL emission and stimulation spectrum,
the lifetime of the luminescence centers contributing to the OSL signal, and the temperature
dependence of the luminescence lifetime and of the luminescence efficiency. The OSL
stimulation spectrum shows a continuous increase in OSL intensity with decreasing stimulation
wavelength. The emission spectrum indicates two OSL emission bands at ~310 nm and
~370 nm, the latter being the dominant OSL emission band. We also observed that the
luminescence centers associated with the OSL signal are strongly quenched above room
temperature, resulting in a reduction in luminescence lifetime from ~27 s at room temperature
down to ~800 ns at 140ºC. The activation energy for non-radiative decay of the luminescence
center was determined to be E = (0.568 ± 0.023) eV. The ~27 s luminescence lifetime observed
for BeO indicate that POSL technique may be used to improve the signal-to-noise ratio using
stimulation pulses of the order of microseconds. The information obtained in this study may help
further optimize the BeO dosimetry systems and provide guidance on the timing parameters to be
used for POSL measurements of this material.
Keywords: optically stimulated luminescence; BeO; lifetime measurements; time-resolved OSL;
thermal quenching; stimulation spectrum; excitation spectrum.
Accep
ted fo
r pub
licati
on
in Rad
iat. M
eas.
(2011
)

1 2 3 4 5 6 7 8 9 10 11 12 13 14 15 16 17 18 19 20 21 22 23 24 25 26 27 28 29 30 31 32 33 34 35 36 37 38 39 40 41 42 43 44 45 46 47 48 49 50 51 52 53 54 55 56 57 58 59 60 61 62 63 64 65
3
1. INTRODUCTION
Beryllium oxide (BeO) ceramic has long been known to be capable of storing energy
upon exposure to ionizing radiation (Albrecht and Mandeville, 1956; Mandeville and Albrecht,
1954). The energy is stored in the form of charge carriers trapped in defects in the crystalline
structure of BeO and can be released by thermal or optical stimulation, providing the basis for
use of the material as an ionizing radiation dosimeter. The material has been investigated as a
thermoluminescence (TL) dosimeter, but the TL signal was shown to be sensitive to light
(McKeever et al., 1995). Taking advantage of the material’s light sensitivity, a dosimetry system
based on BeO was developed using the optically stimulated luminescence (OSL) technique
(Sommer and Henniger, 2006; Sommer et al., 2007; Sommer et al., 2008). Favorable dosimetric
characteristics of BeO include high sensitivity to ionizing radiation, dose response linear over six
orders of magnitude (from ~5 Gy to ~5 Gy), and effective atomic number (Zeff = 7.2) similar to
human soft tissue (Zeff ~ 7.6). However, in spite of the growing importance of this material for
dosimetry applications, fundamental properties of BeO such as the emission spectrum under
optical stimulation and the lifetime of the OSL luminescence centers remain unknown.
The OSL technique consists of using light to stimulate a luminescence response from
materials previously exposed to ionizing radiation. The technique is currently used worldwide
for radiation dosimetry using carbon-doped aluminum oxide (Al2O3:C) as the detector material
(Bøtter-Jensen et al., 2003). The OSL technique has achieved commercial success because of the
unique combination of optical readout, which provides precise control over the stimulation, and
the properties of Al2O3:C. Al2O3:C has a high sensitivity to ionizing radiation and an OSL
response that is linear with dose over several orders of magnitude (Akselrod et al., 1998a). OSL
measurements are usually performed using constant stimulation intensity, which is called
Accep
ted fo
r pub
licati
on
in Rad
iat. M
eas.
(2011
)

1 2 3 4 5 6 7 8 9 10 11 12 13 14 15 16 17 18 19 20 21 22 23 24 25 26 27 28 29 30 31 32 33 34 35 36 37 38 39 40 41 42 43 44 45 46 47 48 49 50 51 52 53 54 55 56 57 58 59 60 61 62 63 64 65
4
continuous-wave OSL (CW-OSL). However, the optical readout allows the use of pulsed
stimulation and time-resolved detection of the OSL signal for better discrimination between
stimulation light and the OSL, resulting in improved signal-to-noise (McKeever et al., 1996).
This technique, which is called pulsed OSL (POSL), requires that the luminescence centers have
a luminescence lifetime longer than the light pulses used for stimulation (Akselrod and
McKeever, 1999). In spite of these attractive features, the effective atomic number of Al2O3:C
(Zeff = 11.3) and the lack of alternative OSL materials have been pointed out as disadvantages of
the OSL technique (McKeever and Moscovitch, 2003). The effective atomic number of Al2O3:C
causes the material to over-respond to low energy X-rays by a factor of up to ~3.5 (Bos, 2001).
In this context, BeO offers an alternative to Al2O3:C in OSL dosimetry.
The OSL properties of BeO were investigated in detail by Bulur and colleagues (Bulur
and Göksu, 1998; Bulur, 2007; Bulur and Yeltik, 2010). The material was already known to have
TL sensitivity comparable to LiF:Mg,Ti (Scarpa, 1970a, b). The low effective atomic number
(Zeff = 7.2), similar to soft tissue (Zeff = 7.3 – 7.6), means that correction factors for photon energy
response should be small (Bos, 2001). Using step-annealing experiments, Bulur and Göksu
(1998) showed that the OSL signal is associated with a trapping center that becomes unstable
around ~340ºC, although the main TL peaks affected by light exposure are at ~70ºC and 200ºC.
The OSL signal was shown to increase with decreasing stimulation wavelength with a maximum
around 435 nm. The OSL emission spectrum was not measured, so it was assumed to be similar
to the TL emission spectrum of BeO, which consists of a broad emission band peaking at 335 nm
(McKeever et al., 1995).
Bulur and colleagues observed the OSL emission to decrease with the readout
temperature, indicating the presence of thermal quenching (Bulur and Göksu, 1998; Bulur and
Accep
ted fo
r pub
licati
on
in Rad
iat. M
eas.
(2011
)

1 2 3 4 5 6 7 8 9 10 11 12 13 14 15 16 17 18 19 20 21 22 23 24 25 26 27 28 29 30 31 32 33 34 35 36 37 38 39 40 41 42 43 44 45 46 47 48 49 50 51 52 53 54 55 56 57 58 59 60 61 62 63 64 65
5
Yeltik, 2010). Thermal quenching is a reduction in luminescence efficiency with temperature,
one of the possible causes being the increase in the probability of non-radiative decays of the
luminescence centers from the excited to the ground states (Bøtter-Jensen et al., 2003). The
luminescence efficiency can be described by a function of the type:
)/exp(1
1)(
kTECT
(1)
where C is a constant, E is the thermal activation energy for the non-radiative process, k is the
Boltzmann constant, and T is the absolute temperature (Bøtter-Jensen et al., 2003). The
activation energies obtained by Bulur and Göksu (1998) were between 0.48 eV and 0.52 eV,
whereas Bulur and Yeltik (2010) obtained values between 0.55 eV and 0.59 eV.
More recent studies on BeO OSL detectors have been focused mainly on the dosimetric
properties (Sommer and Henniger, 2006; Sommer et al., 2007; Sommer et al., 2008). Important
information on the OSL emission spectrum and on properties of the luminescence centers such as
the luminescence lifetime remains unknown. This leaves open the question of whether or not
BeO can be used in combination with the POSL technique to obtain better signal-to-noise, and
timing parameters should be used. Moreover, the optical filters currently used in front of the
PMT (DUG11X, Schott AG) for discrimination between stimulation light and OSL emission
transmit below 370 nm, which seems ideal if the OSL emission band is in fact similar to the TL
emission band at 335 nm. However, this hypothesis has yet to be confirmed.
The objective of this work is to answer some of the open questions regarding the
luminescence properties of BeO detectors used in OSL dosimetry. This study includes OSL and
TL measurements, followed by an investigation of the OSL emission and stimulation spectrum.
The lifetime of the luminescence centers contributing to the OSL signal was measured at various
temperatures using a pulsed light source to confirm the presence of thermal quenching and obtain
Accep
ted fo
r pub
licati
on
in Rad
iat. M
eas.
(2011
)
1 2 3 4 5 6 7 8 9 10 11 12 13 14 15 16 17 18 19 20 21 22 23 24 25 26 27 28 29 30 31 32 33 34 35 36 37 38 39 40 41 42 43 44 45 46 47 48 49 50 51 52 53 54 55 56 57 58 59 60 61 62 63 64 65
6
an estimate of the parameters for the function describing the luminescence efficiency. Time-
resolved OSL emission spectra were also obtained. The information obtained in this study may
help further optimize the BeO dosimetry systems and provide guidance on the timing parameters
to be used in POSL measurements.
2. MATERIALS AND METHODS
2.1. Samples
The BeO samples used in this study are ~4.7 mm 4.7 mm 0.5 mm chips weighting
~32 mg each (Thermalox 995, Brush Ceramic Producs, Brush Wellman, Inc.). No special
thermal treatment was applied to the samples before use, only illumination with blue light in the
OSL reader or heating to 400ºC at 5ºC/s to empty the trapping centers before the experiments.
For comparison we also used Al2O3:C single crystals of ~5 mm in diameter by 0.9 mm
thickness grown at the Urals Polytechnical Institute (Russia), and Al2O3:C detectors of the same
type used in the LuxelTM
and InLightTM
dosimetry system (Landauer Inc.), which consists of
Al2O3:C powder embedded in polymer film having total thickness of 0.3 mm. In this study the
LuxelTM
detectors were cut in round pieces ~7 mm in diameter.
2.2. OSL and TL measurements
OSL measurements were carried out using a Risø TL/OSL-DA-15 reader (Risø National
Laboratory, Denmark) equipped with blue light emitting diodes (LEDs) for stimulation (peak
emission at 470 nm, ~30 mW/cm2 at the sample position) and a bi-alkali photomultiplier tube
(PMT) for light detection (9235QB, ET Enterprises Ltd., Uxbridge, UK) (Bøtter-Jensen, 1997).
UV transmitting broad-band glass filters (Hoya U-340, 7.5 mm total thickness, transmission
Accep
ted fo
r pub
licati
on
in Rad
iat. M
eas.
(2011
)

1 2 3 4 5 6 7 8 9 10 11 12 13 14 15 16 17 18 19 20 21 22 23 24 25 26 27 28 29 30 31 32 33 34 35 36 37 38 39 40 41 42 43 44 45 46 47 48 49 50 51 52 53 54 55 56 57 58 59 60 61 62 63 64 65
7
between 270 nm and 380 nm, Hoya Corporation) were used in front of the PMT to block the
stimulation light while transmitting part of the OSL signal from the samples.
TL measurements were carried out using the same equipment and optical filters. The
samples were heated at 5ºC/s in N2 atmosphere.
Irradiations for the OSL and TL measurements were carried out using a 90
Sr/90
Y beta
source built-in in the Risø reader delivering a dose rate of ~100 mGy/s.
2.3. OSL emission and excitation spectra
OSL emission and stimulation spectra were measured using a spectrofluorometer
(Fluorolog-3, Horiba Jobin-Yvon, Inc.) equipped with a 450 W xenon lamp excitation source and
a PMT (R928P, Hamamatsu Corporation) for light detection.
For measurement of OSL emission spectrum, the excitation monochromator was set to
550 nm and the emission monochromator was scanned from 200 nm to 450 nm in 1 nm steps
using 0.1 s integration time. The excitation and emission slits were set to 5 nm bandpass. A
longpass glass filter (Schott GG-475, 3mm thickness, Schott AG) was used in the excitation
window to prevent the 225 nm second-order harmonic light from reaching the sample. The
emission was corrected by the spectral response of the detection system using correction factors
(ratio between irradiance of a standard lamp by the measured lamp spectrum as a function of
wavelength) provided by the equipment manufacturer.
For measurement of the OSL stimulation spectrum, the excitation monochromator was
scanned from 700 nm to 420 nm in 1 nm step using 0.1 s integration time, while the emission
monochromator was set to 380 nm. The excitation and emission slits were again set to 5 nm
bandpass. A longpass glass filter (Schott WG-290, 3mm thickness, Schott AG) was used in the
excitation window to prevent the second harmonic in the UV range (210 nm – 290 nm) from
Accep
ted fo
r pub
licati
on
in Rad
iat. M
eas.
(2011
)

1 2 3 4 5 6 7 8 9 10 11 12 13 14 15 16 17 18 19 20 21 22 23 24 25 26 27 28 29 30 31 32 33 34 35 36 37 38 39 40 41 42 43 44 45 46 47 48 49 50 51 52 53 54 55 56 57 58 59 60 61 62 63 64 65
8
reaching the sample. The excitation intensity is monitored by the spectrofluorometer using a
photodiode. The signal from this photodiode was used to compensate for variations in the OSL
signal due to the spectrum of the stimulation source, i.e., the reported OSL stimulation spectrum
is the ratio between the OSL signal (S) and the voltage in the reference photodiode (R) versus
stimulation wavelength (this correction is done automatically by the spectrofluorometer).
The OSL emission and stimulation spectra were measured following irradiation, before
and after a 10 min illumination of the sample with the excitation monochromator at 470 nm. This
was intended to verify that the observed signal decreases due to emptying of the trapping centers,
as expected for an OSL emission.
2.4. Lifetime measurements
Lifetime measurements were carried out using a Risø TL/OSL-DA-15 reader identical to
the one described in Section 2.2, but modified for this kind of measurement. The samples were
stimulated with the 532 nm line from a Q-switched, diode-pumped solid state laser (Nd:YAG,
GSQAOM32-10, Intelite, Inc.) delivering pulses of <10 ns duration and ~10 J of energy. The
laser was operated at a frequency of 1 kHz. The laser light was coupled to a liquid light-guide
connected to the Risø reader to stimulate the sample. A long-pass filter (GG-495, Schott AG)
was used at the entrance of the light guide to prevent room light or other short-wavelength
components from reaching the sample. The PMT was connected to a multichannel scaler
(SR430, Stanford Research Systems, Inc.). A beam splitter was used to divert part of the beam to
a high-speed photo detector (DET 200, ThorLabs), whose signal was used to trigger the
multichannel scaler. Each luminescence decay curve was acquired for a total of 10,000 laser
pulses.
Accep
ted fo
r pub
licati
on
in Rad
iat. M
eas.
(2011
)

1 2 3 4 5 6 7 8 9 10 11 12 13 14 15 16 17 18 19 20 21 22 23 24 25 26 27 28 29 30 31 32 33 34 35 36 37 38 39 40 41 42 43 44 45 46 47 48 49 50 51 52 53 54 55 56 57 58 59 60 61 62 63 64 65
9
Luminescence decay curves were measured as a function of temperature using the same
heater used for the TL measurements. The sample was heated to the desired temperature at a
5ºC/s heating rate. The luminescence decay curve was measured after 30 s in the target
temperature to allow for thermal equilibrium to be reached. The luminescence lifetime was
determined by fitting the luminescence decay curve with an exponential decay of the type:
0)/exp( ytAy (2)
where y is the luminescence intensity, A is a constant, t is the time following the laser pulse, and
y0 is an offset.
2.5. RL measurements
RL emission spectra were measured using a 40 kV X-ray tube for excitation (40 kV
MagnumTM
X-ray tube, tungsten filament, silver transmission target, Moxtek Inc.) operating at
100 A of current. The RL from the sample was coupled to an optical fiber (1000 m core
diameter, transmission between 200 – 1100 nm) using a f/2 fused silica lens. The fiber was
connected to a CCD spectrometer (model USB2000, Ocean Optics, Inc.). The spectrometer has
an order-sorting detection filter to eliminate the second order interference light and ~7.2 nm
resolution. The spectra were corrected for the relative detection efficiency of the entire optical
system. This efficiency was determined by measuring the spectrum of a xenon lamp using both
the CCD spectrometer and a calibrated power meter and detector (power meter model 1830-C,
detector model 818-UV, Newport Corporation, Irvine, CA, USA).
Accep
ted fo
r pub
licati
on
in Rad
iat. M
eas.
(2011
)

1 2 3 4 5 6 7 8 9 10 11 12 13 14 15 16 17 18 19 20 21 22 23 24 25 26 27 28 29 30 31 32 33 34 35 36 37 38 39 40 41 42 43 44 45 46 47 48 49 50 51 52 53 54 55 56 57 58 59 60 61 62 63 64 65
10
2.6. Time-resolved emission spectrum
The time-resolved emission spectrum of BeO samples was also measured using the
spectrofluorometer described in Section 2.2 in combination with the pulsed laser described in
Section 2.4. The pulsed laser was used to stimulate the sample inside the spectrofluorometer,
while the emission monochromator was scanned from 450 nm to 200 nm. The
spectrofluorometer PMT was connected to a photon-counter (SR400, Stanford Research
Systems, Inc.) which counted the PMT pulses separately in two gated channels: channel A for
the signal from 1 s to 61 s after the laser pulses, and channel B for the signal from 1 ms to 46
ms after the laser pulses. The laser was operated at 20 Hz (50 ms interval between laser pulses).
The photon counter was triggered as described in Section 2.4.
3. RESULTS
3.1. OSL and TL signal
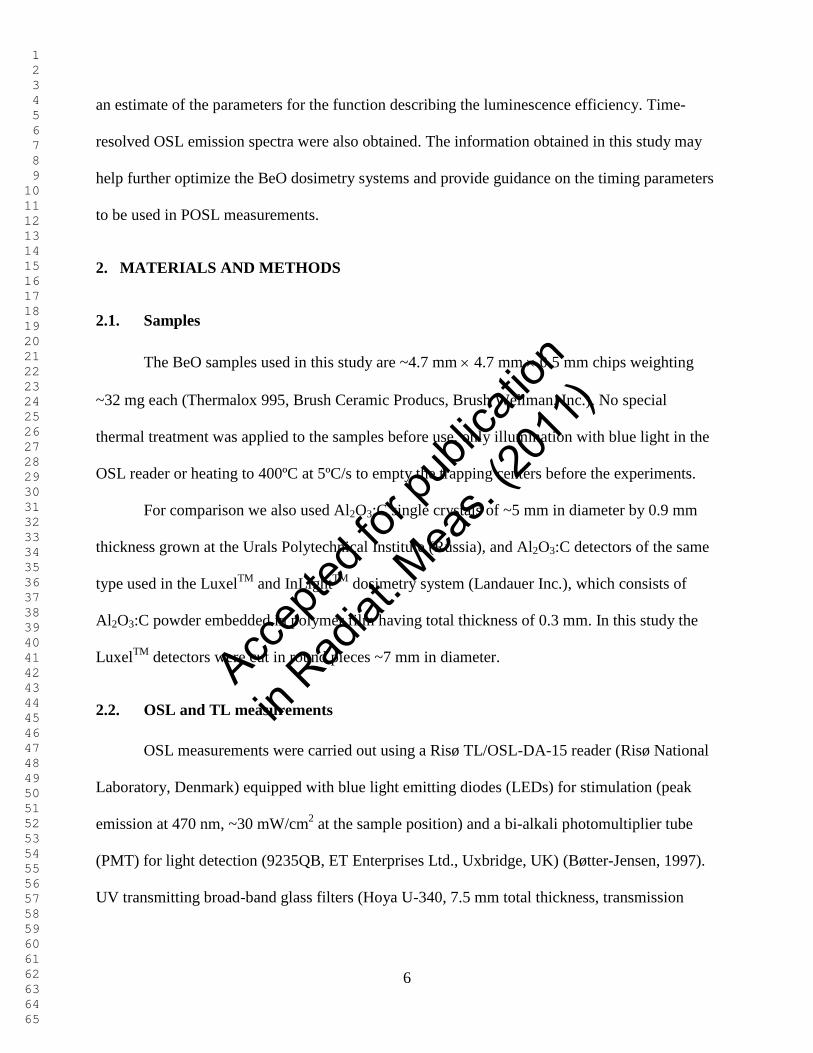
Figure 1a shows the OSL signal from BeO sample following irradiation with a dose of
~200 mGy, as well as the phosphorescence observed at room temperature following irradiation
with the same dose. One can observe that the phosphorescence component, which is mainly due
to emptying of shallow trapping centers in the material, is two orders of magnitude lower than
the OSL signal. Figure 1b shows the TL measurements following irradiation before and after the
OSL readout. Following irradiation (and before OSL readout), the TL curve consists of three
peaks at 70ºC, 195ºC, and 330ºC. If the detectors are irradiated and illuminated (during the OSL
readout) the 70ºC and 195ºC TL peaks are emptied, whereas the trapping centers associated with
the third TL peak (at 330ºC) do not seem to be significantly optically stimulated. However, as
pointed out by Bulur and Göksu (1998), the OSL signal is likely associated with a trapping
Accep
ted fo
r pub
licati
on
in Rad
iat. M
eas.
(2011
)

1 2 3 4 5 6 7 8 9 10 11 12 13 14 15 16 17 18 19 20 21 22 23 24 25 26 27 28 29 30 31 32 33 34 35 36 37 38 39 40 41 42 43 44 45 46 47 48 49 50 51 52 53 54 55 56 57 58 59 60 61 62 63 64 65
11
center that becomes unstable at ~340ºC. The light-sum of the OSL signal (total OSL emitted) is
5107 counts, whereas the light-sum of the TL signal is one order of magnitude lower, 210
6
counts. The discrepancy is evidence that the TL curve is affected by thermal quenching, which
may explain why no light-sensitive TL peak is observed over the temperature range in which the
OSL signal becomes unstable, around 340ºC.
Figure 2 presents typical OSL curves for the three samples, showing that the intensity of
the BeO OSL signal is of the same order of magnitude as the OSL signal from Al2O3:C. This
data represents only an order of magnitude comparison between three detectors of typical sizes
and mass as those used in actual dosimetric applications, not as absolute comparison between the
material’s OSL sensitivity. Firstly, one should keep in mind that the samples have different
masses and optical transmission properties. Al2O3:C single crystals have more mass and are more
transparent than BeO samples (Lembo et al., 1990). Secondly, the Al2O3:C content of the Luxel-
type samples is relatively small: the detectors used in this study have a mass of typically 20 mg,
but part of this mass is plastic. Thirdly, the average dose delivered to the detectors by the beta
source will be slightly different due to different sample thickness (lower for the thicker samples).
Lastly, the OSL reader used here is not optimized for either sample in terms of wavelength used
for stimulation and wavelength detected for measuring the OSL signal.
Figure 3a shows the emission spectrum of BeO following irradiation with ~360 Gy. The
figure presents uncorrected data before and after a 10 min light exposure to demonstrate that the
detected spectrum is in fact due to OSL. The spectrum corrected for the equipment detection
efficiency shows that the main OSL emission bands are at about 310 nm and 370 nm, the latter
being the dominant band. This result is in contrast to assumption that the same emission band
observed in TL is associated with the OSL signal (Sommer et al., 2008). The OSL emission
Accep
ted fo
r pub
licati
on
in Rad
iat. M
eas.
(2011
)

1 2 3 4 5 6 7 8 9 10 11 12 13 14 15 16 17 18 19 20 21 22 23 24 25 26 27 28 29 30 31 32 33 34 35 36 37 38 39 40 41 42 43 44 45 46 47 48 49 50 51 52 53 54 55 56 57 58 59 60 61 62 63 64 65
12
spectrum was also measured for a sample irradiated with ~50 Gy with identical results, except
for higher noise levels. The OSL emission spectrum could not be measured for lower doses with
our experimental setup.
The OSL stimulation spectrum of BeO is shown in Figure 3b. The OSL intensity
increases for decreasing stimulation wavelengths. Comparison between the initial spectrum
(following irradiation) and the spectrum after 10 min of illumination shows that the signal
observed is in fact associated with OSL. This overall OSL stimulation spectrum is in contrast
with the one reported by Bulur and Göksu (1998), which shows a peak at 435 nm. We could not
determine the reason for this discrepancy, but we do not believe it is related to correction factors:
(i) since the detection wavelength is fixed, there is no need to correct for the efficiency of the
detection system; and (ii) the reported stimulation spectrum is the ratio between the OSL
intensity (S) and the voltage in the reference photodiode (R), which according to the
manufacturer should correct for 90% of the dependence on the excitation intensity (indeed, the
characteristics peaks of the xenon lamp at ~467 nm do not appear in the stimulation spectrum,
showing that the correction is working properly). More detailed measurements may be necessary
to clarify this point.
The OSL emission spectrum is considerably different than the RL emission spectrum,
which has the main emission band at ~280 nm (Figure 4). When compared to the OSL emission
spectrum of BeO (Figure 3a) and the reported TL peak at 335 nm (McKeever et al., 1995), this
result indicates that different luminescence processes are taking place in BeO ceramics. The RL
emission may be caused by excitons produced during X-ray irradiation; if that is the case, the RL
emission band will not be observed during OSL stimulation. However, it is often the case that
exciton emission is quenched at room temperature (Rodnyi, 1997). More detailed investigations
Accep
ted fo
r pub
licati
on
in Rad
iat. M
eas.
(2011
)

1 2 3 4 5 6 7 8 9 10 11 12 13 14 15 16 17 18 19 20 21 22 23 24 25 26 27 28 29 30 31 32 33 34 35 36 37 38 39 40 41 42 43 44 45 46 47 48 49 50 51 52 53 54 55 56 57 58 59 60 61 62 63 64 65
13
(for example on the temperature dependence of this RL emission) are required to clarify this
issue.
3.2. Lifetime measurements and thermal quenching
The luminescence signal as a function of time following the laser pulse (luminescence
decay curve) is shown in Figure 5. Each laser pulse stimulates trapped charges from the trapping
centers and promotes recombination with trapped charges of the opposite sign, creating defects
in the excited state. The luminescence observed after each laser pulse is associated with radiative
decay of the luminescence centers from the excited state to the ground state. The luminescence
decay curve can be described with an exponential decay with a characteristic lifetime of ~27 s.
As shown in Figure 5, after heating to 400ºC the luminescence intensity decreased by three order
of magnitude, demonstrating that the signal is associated with radiation-induced trapped charges.
Figure 6 shows the luminescence decay curves following the laser pulse at three different
temperatures. The lifetime of the luminescence centers decreases with increasing temperatures.
This decrease is consistent with the Mott-Seitz model of thermal quenching, in which the
increasing in temperature leads to higher probability of non-radiative transitions from the excited
to the ground state of the luminescence centers and, consequently, reduced luminescence lifetime
and luminescence efficiency (Akselrod et al., 1998b). Considering the total probability of decay
from the excited state to the ground state of the luminescence centers = 1 and the probability
of radiative decay R = R1
and non-radiative decay NR = NR1
, we have:
NRR
111 (3)
If the probability of non-radiative decay is given by NR1
= 0exp(E/kT), the lifetime as a
function of temperature is given by:
Accep
ted fo
r pub
licati
on
in Rad
iat. M
eas.
(2011
)

1 2 3 4 5 6 7 8 9 10 11 12 13 14 15 16 17 18 19 20 21 22 23 24 25 26 27 28 29 30 31 32 33 34 35 36 37 38 39 40 41 42 43 44 45 46 47 48 49 50 51 52 53 54 55 56 57 58 59 60 61 62 63 64 65
14
)/exp(1
)(0 kTE
TR
R
(4)
where 0 is the pre-exponential factor, E is the thermal activation energy, k is the Boltzmann
constant, and T is the absolute temperature. The luminescence efficiency, given by the ratio of
the radiative decay probability to the total decay probability, should also be reduced according
to:
)/exp(1
1
)/exp()(
0 kTECkTET
R
R
NRR
R
(5)
where C is the ratio 0/R.
Figure 7a shows how the lifetime changes as a function of temperature. The data obtained
can be described by Equation (4) with parameters R = (28.6 ± 0.03) s, 0 = (9.5 ± 7.2)1012
s-1
,
and activation energy E = (0.568 ± 0.023) eV. Figure 7a includes some repeat points to
demonstrate the reproducibility of the experimental procedure. The value for the activation
energy obtained E is similar to previous values for the thermal quenching function obtained by
Bulur and colleagues (Bulur and Göksu, 1998; Bulur and Yeltik, 2010).
The luminescence efficiency as a function of temperature was obtained by plotting the
area under the luminescence decay curve, estimated both using the product of the fitted
parameters A and or directly from the experimental data, as a function of the measurement
temperature (Figure 7b). This data is similar to previous thermal quenching data by Bulur and
Yeltik (2010). The luminescence efficiency decreases with temperature in approximately the
same temperature region as the lifetime decrease. The agreement with the data in Figure 7a is not
perfect due to the influence of shallow traps, in this case the trapping center associated with the
70ºC TL peak. As the temperature increases, the luminescence efficiency of the luminescence
Accep
ted fo
r pub
licati
on
in Rad
iat. M
eas.
(2011
)

1 2 3 4 5 6 7 8 9 10 11 12 13 14 15 16 17 18 19 20 21 22 23 24 25 26 27 28 29 30 31 32 33 34 35 36 37 38 39 40 41 42 43 44 45 46 47 48 49 50 51 52 53 54 55 56 57 58 59 60 61 62 63 64 65
15
centers decreases; however, the shallow traps become less effective competitors, since the
probability of the trapped charges escaping from these traps to the delocalized bands increases
with temperature. The resultant OSL signal as a function of temperature is a combination of
these two phenomena, and therefore does not follow necessarily Equation (5). This has already
been discussed by other authors (Akselrod et al., 1998b; Bulur and Göksu, 1998). Nevertheless,
this data confirms that the decrease in luminescence lifetime is accompanied by a decrease in
luminescence efficiency.
3.3. Time-resolved emission spectrum
Based on the information obtained in the previous section, we measured the emission
spectrum of BeO following irradiation using time-discrimination to confirm the emission
spectrum associated with the 27 s component. The emission spectrum was measured for two
time intervals following the 10 ns laser pulses (see Section 2.6): photo-counter channel A was
used to measure the emission spectrum of the ~27 s component by detecting the emission from
1 s to 61 s after the laser pulses, whereas photon counter channel B was used to measure the
residual emission for slow components (detected from 1 ms to 46 ms after the laser pulses).
Figure 8 shows the emission spectrum observed in the two time channels. The data for
time channel A confirms that the emission spectrum associated with the ~27 s component
coincides with the OSL emission spectrum shown in Figure 3a, which was obtained using
continuous stimulation (CW-OSL). This signal is reduced by bleaching the sample with the
green laser, showing that the signal is associated with the OSL emission.
The signal from time channel B, which corresponds to the emission after the ~27 s
component had already decayed completely, shows a broader spectrum from 250 nm to 450 nm.
The spectrum is not reduced by bleaching, indicating it is not associated with OSL signal. It is
Accep
ted fo
r pub
licati
on
in Rad
iat. M
eas.
(2011
)

1 2 3 4 5 6 7 8 9 10 11 12 13 14 15 16 17 18 19 20 21 22 23 24 25 26 27 28 29 30 31 32 33 34 35 36 37 38 39 40 41 42 43 44 45 46 47 48 49 50 51 52 53 54 55 56 57 58 59 60 61 62 63 64 65
16
possible that this signal is due to phosphorescence emission. It should be noticed that the
integration interval for the signal in channel B (45 ms) is three orders of magnitude higher than
the integration interval for the signal in channel A (60 s), indicating that the ~27 s component
detected in channel A is orders of magnitude more intense than the phosphorescence component.
4. DISCUSSION
The data obtained in this study provide additional information on the luminescence
properties of BeO detectors currently being used in OSL dosimetry. The emission spectrum
indicates two OSL emission bands at ~310 nm and ~370 nm, the latter being the dominant OSL
emission band. This is in contrast with TL emission spectra data, which shows a dominant
emission band at 335 nm (McKeever et al., 1995). This result does not provide support to the
assumption that the OSL emission is identical to the TL emission (Sommer et al., 2008). The fact
that the OSL and TL emission spectra are different is not surprising, since we verified in this
study that the luminescence centers associated with the OSL signal are strongly quenched at the
temperature corresponding to the main TL peaks at 195ºC and 330ºC.
The OSL stimulation spectrum shows a continuous increase with decreasing
wavelengths, in contrast with previous results showing a peak in the stimulation spectrum at
~435 nm (Bulur and Göksu, 1998). The slit bandpass in this study is 5 nm, as compared to 10 nm
in the study by Bulur and Göksu (1998), so it is unlikely that the difference in the results are due
to a lack of resolution in our experiments. As discussed in Section 3.1, it is also not likely that
this difference is due to correction factors. Unfortunately, the present study does not allow for a
definitive conclusion on this issue and other independence studies will be necessary to clarify
this issue.
Accep
ted fo
r pub
licati
on
in Rad
iat. M
eas.
(2011
)

1 2 3 4 5 6 7 8 9 10 11 12 13 14 15 16 17 18 19 20 21 22 23 24 25 26 27 28 29 30 31 32 33 34 35 36 37 38 39 40 41 42 43 44 45 46 47 48 49 50 51 52 53 54 55 56 57 58 59 60 61 62 63 64 65
17
Lifetime measurements of the OSL signal of BeO indicate a lifetime of ~27 s at room
temperature. The luminescence lifetime decreases with temperature following Equation (4) with
parameters R = (28.6 ± 0.03) s, 0 = (9.5 ± 7.2)1012
s-1
, and activation energy E = (0.568 ±
0.023) eV. The decrease in luminescence lifetime is accompanied by a reduction in luminescence
efficiency. These results indicate that the thermal quenching observed in this material is
consistent with an increase in the probability of non-radiative decay from the excited to the
ground state of the luminescence centers. Time-resolved emission spectrum confirms that this
component is responsible for the OSL signal detected in Figure 3a.
The ~27 s luminescence lifetime observed for BeO indicate that POSL technique may
be used to improve the signal-to-noise ratio using stimulation pulses of the order of
microseconds. To estimate the best timing parameters, we calculated the efficiency of the POSL
technique for various pulsed stimulation frequencies and pulse widths. The POSL efficiency was
defined here as the ratio of OSL signal emitted in between laser pulses to the total OSL emitted.
This calculation was done analytically based on the differential equation describing the
concentration of luminescence centers m* in the excited state:
ten
tm
dt
tdm
0
** )()( (6)
where n0 is the initial concentration of trapped electrons, is the photoionization cross-section
for the electron trapping centers, and is the photon flux. The first term on the right side of the
equation represents the radiative decay of the luminescence centers, and the second term
represents the increase in the concentration of luminescence centers in the excited state due to
recombination with electrons stimulated from the traps (assuming a first-order process and no
retrapping). Solution for this equation is:
Accep
ted fo
r pub
licati
on
in Rad
iat. M
eas.
(2011
)

1 2 3 4 5 6 7 8 9 10 11 12 13 14 15 16 17 18 19 20 21 22 23 24 25 26 27 28 29 30 31 32 33 34 35 36 37 38 39 40 41 42 43 44 45 46 47 48 49 50 51 52 53 54 55 56 57 58 59 60 61 62 63 64 65
18
/
1
0/*
0
* )( ttt een
emtm
. (7)
The OSL intensity is given by dm*/dt with = 0.01 s-1
during optical stimulation and = 0 in
between stimulation. The value of = 0.01 s-1
represents a “weak stimulation”, i.e., the OSL
curve decaying to 1/e of its initial value in 100 s. Based on Equation (7) we calculated the
amount of light emitted by the detector during stimulation pulse and in between stimulation
pulses. The results of these calculations are shown in Table 1, where one can see that the
stimulation efficiency is relatively high for a pulse frequency of 10-40 kHz and stimulation
pulses of ~2.5 – 10 s. The efficiency will be even higher for shorter pulses. In principle, these
pulse widths can be achieved using LEDs as the stimulation source, which is a cost-effective
alternative to pulsed lasers. LED pulses with duration of ~2 s have been used for OSL
measurements (Denby et al., 2006). However, in actual experimental conditions the results may
differ due to the need to introduce a delay after the end of the stimulation pulse and the start of
the counters to allow for decay of the residual LED signal.
The defects responsible for the OSL emission bands at ~310 nm and ~370 nm are not
identified yet. The emission band at 3.4 eV (~365 nm) in additively-colored BeO has been
attributed to F-centers (oxygen vacancy with two electrons captured), while the emission band at
3.9 eV (320 nm) has been attributed to F+-centers (Pustovarov et al., 2001). However, our
studies indicate a radiative lifetime of R = 28.6 s, orders of magnitude lower than the
luminescence lifetime of F-centers in BeO, 700 ms for temperatures up to room temperature
(Gorbunov et al., 1987). Therefore, the results do not allow a conclusive association between the
OSL emission bands and particular defects in BeO. The RL emission band at 290 nm has also
not been identified.
Accep
ted fo
r pub
licati
on
in Rad
iat. M
eas.
(2011
)

1 2 3 4 5 6 7 8 9 10 11 12 13 14 15 16 17 18 19 20 21 22 23 24 25 26 27 28 29 30 31 32 33 34 35 36 37 38 39 40 41 42 43 44 45 46 47 48 49 50 51 52 53 54 55 56 57 58 59 60 61 62 63 64 65
19
5. CONCLUSIONS
The data obtained in this study shows that the OSL emission spectrum of BeO consists of
two bands at ~310 nm and ~370 nm, the latter being the dominant OSL emission band. The OSL
stimulation spectrum shows a continuous increase with decreasing wavelengths. Lifetime
measurements indicate that the OSL signal has a luminescence lifetime of ~27 s at room
temperature. The luminescence lifetime decreases with temperature following Equation (4) with
parameters R = (28.6 ± 0.03) s, 0 = (9.5 ± 7.2)1012
s-1
, and activation energy E = (0.568 ±
0.023) eV. The decrease in luminescence lifetime is accompanied by a reduction in luminescence
efficiency. Based on the lifetime of the luminescence centers, we estimate that the POSL
technique can be effective to discriminate between stimulation light and OSL emission using
stimulation pulses of ~2.5 – 10 s. The defects responsible for the OSL emission bands at
~310 nm and ~370 nm or the RL emission band at ~290 nm could not be identified yet. The
short luminescence lifetime of the ~370 nm band (27 s) is not consistent with the luminescence
lifetime of F-center emission in BeO.
ACKNOWLEDGEMENTS
The author thanks Brusch Ceramic Products (Brush Wellman Inc.) for kindly providing
the BeO ceramic samples used in the present study, and Landauer Inc. for the Al2O3:C Luxel
detectors used for comparison.
Accep
ted fo
r pub
licati
on
in Rad
iat. M
eas.
(2011
)

1 2 3 4 5 6 7 8 9 10 11 12 13 14 15 16 17 18 19 20 21 22 23 24 25 26 27 28 29 30 31 32 33 34 35 36 37 38 39 40 41 42 43 44 45 46 47 48 49 50 51 52 53 54 55 56 57 58 59 60 61 62 63 64 65
20
TABLE CAPTIONS
Table 1. POSL efficiency, defined as the ratio between the OSL emitted in between the
stimulation pulses and the total OSL emitted, for various stimulation pulse frequencies and pulse
widths. See main text for details on the calculations.
FIGURE CAPTIONS
Figure 1. (a) OSL and phosphorescence signals of BeO following irradiation with a dose of
~200 mGy; (b) TL curve of BeO following irradiation with a dose of ~200 mGy, before and after
OSL readout.
Figure 2. OSL curve of BeO in comparison to two different types of Al2O3:C detector, following
irradiation with a dose of ~200 mGy. An aperture was used to reduce the intensity of the OSL
signal to prevent saturation of the PMT. This data is intended only as an order of magnitude
comparison (see text for more discussion).
Figure 3. (a) OSL emission spectrum of BeO for stimulation with 550 nm light, and (b) OSL
stimulation spectrum of BeO for detection at 380 nm. The OSL emission and stimulation spectra
were measured before and after 10 min stimulation with 470 nm light to confirm that the signal
is bleached as expected for an OSL signal. The spectra were corrected for the efficiency of the
detection system using correction factors provided by the equipment manufacturer and shown in
the graph.
Accep
ted fo
r pub
licati
on
in Rad
iat. M
eas.
(2011
)

1 2 3 4 5 6 7 8 9 10 11 12 13 14 15 16 17 18 19 20 21 22 23 24 25 26 27 28 29 30 31 32 33 34 35 36 37 38 39 40 41 42 43 44 45 46 47 48 49 50 51 52 53 54 55 56 57 58 59 60 61 62 63 64 65
21
Figure 4. RL emission spectrum of BeO under X-ray irradiation before and after correction for
the spectral sensitivity of the detection system (shown in the figure).
Figure 5. Luminescence decay of BeO after 10 ns laser pulses following irradiation with ~1 Gy
and subsequent heating to 400ºC (at 5ºC/s).
Figure 6. Luminescence decay of BeO after 10 ns laser pulses at various temperatures, following
irradiation with ~1 Gy.
Figure 7. (a) Luminescence lifetime of BeO at various temperatures; (b) OSL signal as a function
of the temperature (estimated as the product of the parameters A and obtaining from fitting
Equation 2 to the luminescence decay, or directly from the experimental data). The data includes
repeat points to shows that the lifetime measurements are unaffected by depletion of the OSL
signal due to the repeated measurements. As seen in (b), for the 70ºC repeated data point, the
level of depletion during this experiment is small.
Figure 8. Time-resolved emission spectrum from BeO following irradiation with ~360 Gy. The
graph shows the emission during two windows following 10 ns laser stimulation: a fast
component detected from 1 s to 61 s, and a slow component from 1 ms to 46 ms. Notice that
only the fast component decays after bleaching.
Accep
ted fo
r pub
licati
on
in Rad
iat. M
eas.
(2011
)

1 2 3 4 5 6 7 8 9 10 11 12 13 14 15 16 17 18 19 20 21 22 23 24 25 26 27 28 29 30 31 32 33 34 35 36 37 38 39 40 41 42 43 44 45 46 47 48 49 50 51 52 53 54 55 56 57 58 59 60 61 62 63 64 65
22
REFERENCES
Akselrod, M.S., Lucas, A.C., Polf, J.C. and Mckeever, S.W.S., 1998a. Optically stimulated
luminescence of Al2O3. Radiat. Meas. 29, 391-399.
Akselrod, M.S., Agersnap Larsen, N., Whitley, V.H. and McKeever, S.W.S., 1998b. Thermal
quenching of F-center luminescence in Al2O3:C. J. Appl. Phys. 84, 3364-3373.
Akselrod, M.S. and McKeever, S.W.S., 1999. A radiation dosimetry method using pulsed
optically stimulated luminescence. Radiat. Prot. Dosim. 81, 167-176.
Albrecht, H.O. and Mandeville, C.E., 1956. Storage of energy in beryllium oxide. Phys. Rev.
101, 1250-1252.
Bos, A.J.J., 2001. High sensitivity thermoluminescence dosimetry. Nucl. Instrum Methods. Phys.
Res. B 184, 3-28.
Bøtter-Jensen, L., 1997. Luminescence techniques: instrumentation and methods. Radiat. Meas.
27, 749-768.
Bøtter-Jensen, L., Agersnap Larsen, N., Markey, B.G. and McKeever, S.W.S., 1997. Al2O3:C as
a sensitive OSL dosemeter for rapid assessment of environmental photon dose rates.
Radiat. Meas. 27, 295-298.
Bøtter-Jensen, L., McKeever, S.W.S. and Wintle, A.G., 2003. Optically Stimulated
Luminescence Dosimetry. Elsevier, Amsterdam.
Bulur, E. and Göksu, H.Y., 1998. OSL from BeO ceramics: new observations from an old
material. Radiat. Meas. 29, 639-650.
Bulur, E., 2007. Photo-transferred luminescence from BeO ceramics. Radiat. Meas. 42, 334-340.
Bulur, E. and Yeltik, A., 2010. Optically stimulated luminescence from BeO ceramics: An LM-
OSL study. Radiat. Meas. 45.
Denby, P.M., Bøtter-Jensen, L., Murray, A.S., Thomsen, K.J. and Moska, P., 2006. Application
of pulsed OSL to the separation of the luminescence components from a mixed
quartz/feldspar sample. Radiat. Meas. 41, 774-779.
Gorbunov, S.V., Kruzhalov, A.V. and Springis, M.J., 1987. Optical properties of the F-center in
beryllium oxide. Phys. Status Solidi B 141, 293-301.
Lembo, L., Pimpinella, M. and Mukherjee, B., 1990. Self optical attenuation coefficient of TL
glow in BeO detectors. Radiat. Prot. Dosim. 33, 43-45.
Mandeville, C.E. and Albrecht, H.O., 1954. Luminescence of beryllium oxide. Phys. Rev. 94,
494-495.
McKeever, S.W.S., Moscovitch, M. and Townsend, P.D., 1995. Thermoluminescence dosimetry
materials: properties and uses. Nuclear Technology Publishing, Ashford.
McKeever, S.W.S., Akselrod, M.S. and Markey, B.G., 1996. Pulsed optically stimulated
luminescence dosimetry using -Al2O3:C. Radiat. Prot. Dosim. 65, 267-272.
McKeever, S.W.S. and Moscovitch, M., 2003. On the advantages and disadvantages of optically
stimulated luminescence dosimetry and thermoluminescence dosimetry. Radiat. Prot.
Dosim. 104, 263-270.
Pustovarov, V.A., Ivanov, V.Y., Kirm, M., Korotaev, A.V., Kruzhalov, A.V., Zimmerer, G. and
Zinin, E.I., 2001. Time-resolved luminescent VUV spectroscopy of F- and F+-centres in
single BeO crystals. Nucl. Instrum Methods. Phys. Res. A 470, 353-357.
Rodnyi, P.A., 1997. Physical processes in inorganic scintillators. CRC Press, Boca Raton.
Accep
ted fo
r pub
licati
on
in Rad
iat. M
eas.
(2011
)

1 2 3 4 5 6 7 8 9 10 11 12 13 14 15 16 17 18 19 20 21 22 23 24 25 26 27 28 29 30 31 32 33 34 35 36 37 38 39 40 41 42 43 44 45 46 47 48 49 50 51 52 53 54 55 56 57 58 59 60 61 62 63 64 65
23
Scarpa, G., 1970a. Dosimetric use of beryllium oxide as a thermoluminescent material - a
preliminary study. Phys. Med. Biol. 15, 667-&.
Scarpa, G., 1970b. A study on dosimetric properties of beyllium oxide. Health Phys. 19, 91-&.
Sommer, M. and Henniger, J., 2006. Investigation of a BeO-based optically stimulated
luminescence dosimeter. Radiat. Prot. Dosim. 119, 394-397.
Sommer, M., Freudenberg, R. and Henniger, J., 2007. New aspects of a BeO-based optically
stimulated luminescence dosimeter. Radiat. Meas. 42, 617-620.
Sommer, M., Jahn, A. and Henniger, J., 2008. Beryllium oxide as optically stimulated
luminescence dosimeter. Radiat. Meas. 43, 353-356.
Whitley, V.H. and McKeever, S.W.S., 2000. Photoionization of deep centers in Al2O3. J. Appl.
Phys. 87, 249-256.
Accep
ted fo
r pub
licati
on
in Rad
iat. M
eas.
(2011
)

Frequency Interval
between pulses
Pulse width Efficiency
1 kHz 1 ms 100 s 26%
10 kHz 100 s 10 s 83%
40 kHz 25 s 2.5 s 98%
Table 1
Accep
ted fo
r pub
licati
on
in Rad
iat. M
eas.
(2011
)
0 20 40 60 80 100 120103
104
105
106
(a)
phosphorescence
OSL
OS
L in
tens
ity (
cps)
Time (s)
Figure1a
Accep
ted fo
r pub
licati
on
in Rad
iat. M
eas.
(2011
)

0 100 200 300 4000
10
20
30
40(b)
after OSL
before OSL
TL
inte
nsity
(10
3 cou
nts
per
0.2
s)
Temperature (ºC)
Figure1b
Accep
ted fo
r pub
licati
on
in Rad
iat. M
eas.
(2011
)

0 10 20 30 40 50 600.0
0.5
1.0
1.5
2.0
7mm diam. Luxel detectorBeO
Al2O3:C single crystal
OS
L in
tens
ity (a
rb. u
nits
)
Time (s)
Figure2
Accep
ted fo
r pub
licati
on
in Rad
iat. M
eas.
(2011
)

200 250 300 350 400 4500
20
40
60
80
100
120
140
correction factor
after 10 min(uncorrected)
(a)
initial (uncorrected)
initial (corrected)
OS
L in
tens
ity (a
rb. u
nits
)
emission wavelength (nm)
0
1
2
3
4
5
correction factor (arb. units)
Figure3a
Accep
ted fo
r pub
licati
on
in Rad
iat. M
eas.
(2011
)

400 450 500 550 600 650 7000
1
2
3
4
5
difference
after 10 min
initial
(b)O
SL
inte
nsity
(arb
. uni
ts)
stimulation wavelength (nm)
Figure3b
Accep
ted fo
r pub
licati
on
in Rad
iat. M
eas.
(2011
)

200 300 400 500 600 700 8000.0
0.2
0.4
0.6
0.8
1.0
1.2
RL
inte
nsity
(nor
mal
ized
)
Wavelength (nm)
uncorrected corrected
0
2
4
6
Detection efficiency (arb. units)
Figure4
Accep
ted fo
r pub
licati
on
in Rad
iat. M
eas.
(2011
)

0 20 40 60 80 100 120 140 160100
101
102
103
heated to 400ºC
irradiated
OS
L in
tens
ity (
arb.
uni
ts)
Time (s)
Figure5
Accep
ted fo
r pub
licati
on
in Rad
iat. M
eas.
(2011
)

0 20 40 60 80 100 120 140 16010-3
10-2
10-1
100
100ºC
60ºC
RT
OS
L in
tens
ity (
arb.
un
its)
Time (s)
Figure6
Accep
ted fo
r pub
licati
on
in Rad
iat. M
eas.
(2011
)

20 40 60 80 100 120 1400
5
10
15
20
25
30(a)
R = (28.6 ± 0.03) s
0 = (9.5 ± 7.2) x 1012 s-1
E = (0.568 ± 0.023) eV
Life
time
(s)
Temperature (ºC)
Figure7a
Accep
ted fo
r pub
licati
on
in Rad
iat. M
eas.
(2011
)

20 40 60 80 100 120 1400.0
0.2
0.4
0.6
0.8
1.0
1.2
A τ Integrated intensity
(b)O
SL s
igna
l (ar
b. u
nits
)
Temperature (ºC)
Figure7b
Accep
ted fo
r pub
licati
on
in Rad
iat. M
eas.
(2011
)

200 250 300 350 400 4500
1
2
3
4
5
bleaching
Channel B(1ms - 46 ms)
Channel A(1 s - 61 s)
OS
L in
tens
ity (
103 c
ount
s)
Wavelength (nm)
Figure8
Accep
ted fo
r pub
licati
on
in Rad
iat. M
eas.
(2011
)