access to dental providers in pennsylvania o r p o r at i o n research report access to dental...
TRANSCRIPT

C O R P O R A T I O N
Research Report
Access to Dental Providers in PennsylvaniaExploration of the County-Level Distribution of Dental Providers and Populations in 2013
Matthew D. Baird, Michelle K. Baird, Joseph V. Vesely
Prepared for the Pennsylvania Department of Health

Limited Print and Electronic Distribution Rights
This document and trademark(s) contained herein are protected by law. This representation of RAND intellectual property is provided for noncommercial use only. Unauthorized posting of this publication online is prohibited. Permission is given to duplicate this document for personal use only, as long as it is unaltered and complete. Permission is required from RAND to reproduce, or reuse in another form, any of its research documents for commercial use. For information on reprint and linking permissions, please visit www.rand.org/pubs/permissions.html.
The RAND Corporation is a research organization that develops solutions to public policy challenges to help make communities throughout the world safer and more secure, healthier and more prosperous. RAND is nonprofit, nonpartisan, and committed to the public interest.
RAND’s publications do not necessarily reflect the opinions of its research clients and sponsors.
Support RANDMake a tax-deductible charitable contribution at
www.rand.org/giving/contribute
www.rand.org
For more information on this publication, visit www.rand.org/t/rr1351
Published by the RAND Corporation, Santa Monica, Calif.
© Copyright 2016 RAND Corporation
R® is a registered trademark.

iii
Summary
Ensuring access to dental care, particularly for children, is a significant policy concern in the United States. Many factors affect access on both the provider and patient sides. This report examines one important factor in the ability to access dental care: the distribution and availability of dental health providers. We assess these characteristics of providers across the counties of Pennsylvania, primarily using data from the 2013 Survey of Dentists and Dental Hygienists administered by the Pennsylvania Department of Health (Bureau of Health Planning, 2014).
The U.S. Department of Health and Human Services has established a general guideline that a ratio of less than one full-time–equivalent (FTE) dentist per 5,000 people is a shortage. To identify possible dental provider shortages in Pennsylvania counties, we assess ten indicators of access to dental providers: number of FTE dentists per 1,000 people; number of FTE general, pediatric, and geriatric dentists per 1,000 people; number of FTE dental specialists per 1,000 people; number of FTE hygienists per 1,000 people; number of FTE public health dental hygiene practitioners (PHDHPs) per 1,000 people; number of FTE dental professionals per 1,000 people; number of FTE dentists accepting Medicaid per 1,000 Medicaid enrollees; number of FTE pediatric dentists per 1,000 children under age 10; number of FTE pediatric dentists accepting Medicaid patients per 1,000 Children’s Health Insurance Program (CHIP) enrollees under age 10; and number of Head Start enrollments per CHIP enrollee. Head Start ensures that children brush their teeth at least daily during the program; children often receive dental screenings and examinations on site as well.
We find significant variation in our indicators across Pennsylvania counties. For overall dentists, two counties (Potter and Juniata) fall below the guideline; other indicators suggest lack of access in other dimensions. For example, Forest and Elk counties do not have any dentists who accept Medicaid. Children’s access to pediatric dentists is an acute issue, both for the general youth population and for the CHIP population; 39 of the 67 counties have no pediatric specialists, and many of these counties border other counties with no pediatric specialists.
For all access indicators except Head Start enrollments per CHIP enrollee, there is less access in counties where population size and population density are low; the highest county quartile of population density has about five times as many dental specialists as the lowest quartile of population density. We find that areas with fewer dentists per capita also have fewer PHDHPs per capita, indicating that the goal of increasing access in rural areas through the creation of this mid-level provider role is not being achieved. Children in the Head Start program are more likely to live in areas that face dental workforce shortages, including those specifically related to children’s access to pediatric care. This suggests that the Head Start program is successful at delivering dental care to low-income children who otherwise could face barriers to access.

iv
Acknowledgments
We thank Lisa Schildhorn for guidance and helpful input; Deborah E. Polk, Hao Yu, Rebecca Anhang Price, and Paul Koegel for careful review and comments; and participants in the RAND Health Workforce Interest Group for valuable feedback at early stages of the research.
Abbreviations
AHRF Area Health Resources File CHIP Children’s Health Insurance Program FTE full-time equivalent PHDHP public health dental hygiene practitioner
1
1. Introduction
Access to dental care is an important policy problem (Network for Public Health Law, 2014; U.S. Department of Health and Human Services, 2010), as evidenced by the unmet needs of children and adults in the United States. The National Center for Health Statistics’ 1996 report on children’s access to care found that 57 percent of unmet health care needs were for dental care, that dental health care needs were the most common of all unmet health care needs (Coulter et al., 2003), and that failing to meet dental health care needs is related to several other health outcomes (Edelstein et al., 2006; Jackson et al., 2011; U.S. Department of Health and Human Services, 2000). Dental caries is the most common chronic disease among children, with 59 percent of children experiencing it (Dubay, Parker, and DeFriese, 2005; Mertz and Mouradian, 2009). Adults have significant barriers to accessing dental care as well (Flynn et al., 2014; Allison and Manski, 2007). In March 2015, insured adults cited dental care as the service for which they experienced the most unmet need because of affordability (Shartzer and Kenney, 2015).
Even people who have insurance coverage do not always use dental care. Although the American Dental Association recommends at least yearly dental office visits for all adults and children, only 38 percent of adult respondents in the Medical Expenditure Panel Survey reported having visited dental offices within the past year (Buchmueller, Miller, and Vujicic, 2014). Similarly, 22.4 percent of Minnesota Medicaid users reported “big problems” with accessing dental care (Flynn et al., 2014).
Several barriers to care can cause patients to experience unmet dental health care needs (Orlans, Mertz, and Grumbach, 2002). The barriers can generally be classified into three categories: (1) the distribution and availability of dental health providers (including types of health insurance coverage accepted); (2) institutional characteristics, such as medical assistance programs and the presence of health clinics that provide dental care and dental provider chains; and (3) patient factors, such as resource constraints (e.g., financial limitations and time constraints) and health literacy. Barriers 1 and 2 constitute supply-side barriers that dentist preferences determine in the presence of geographical realities and the legal landscape (such as scope-of-practice laws for mid-level providers); barrier 3 consists of demand-side (patient) constraints.
In this report, we examine the first source of barriers: the distribution and availability of dental providers across the counties of Pennsylvania. We first examine dentist-to-population ratios but then extend the analysis in order to better understand regional access to dental providers in Pennsylvania. The guideline established by the U.S. Department of Health and Human Services is that areas with less than one dentist per 5,000 people (corresponding to 0.2 dentists per 1,000 people) are experiencing a shortage (Health Resources and Services Administration, undated). By this metric, every state in the United States in 2013 had at least a
2
minimally adequate number of dentists. However, this does not mean that each county within a state has a sufficient number of dentists. For example, in the nine states that are characterized by the largest intrastate variation in dental workforce, about 7 percent of state residents live in counties with ratios below 0.2. Pennsylvania has both more dentists per capita and less variation in dental workforce across the state than half the states, suggesting that, compared with other states in the nation, Pennsylvania is doing fairly well on this crude measure of dentist provider access. Figure A.1 in the appendix shows the state averages and variation in the United States in 2013.
In what follows, we first explain the methodology used in this report. We next present our results, including county-level maps of several indicators of dental access in Pennsylvania, as well as an exploration of how county characteristics relate to access issues. We then discuss the strengths and weaknesses of this report and conclude with a summary of our findings and our suggestions for future research and application of these findings.
2. Methodology
We use data from several data sources, primarily the 2013 Survey of Dentists and Dental Hygienists administered by the Pennsylvania Department of Health (henceforth, the dentist survey and the hygienist survey) and the Area Health Resources File (AHRF). This work builds on 2013 Pulse of Pennsylvania’s Dentist and Dental Hygienist Workforce written by the Pennsylvania Department of Health (Bureau of Health Planning, 2014). That report comprehensively explores the results of the dentist and hygienist surveys. We expand on this report by further examining the trends suggested by the report’s Figure 9, which assesses the distribution of dentists across the counties of Pennsylvania. Our analyses improve upon those described in the original report by examining numerous additional metrics of access to care. We pay particular attention to the Medicaid population, the pediatric population, and the corresponding number of dentists who treat Medicaid patients or specialize in pediatric dentistry.
Instead of measuring dentist-to-population ratios (as in 2013 Pulse of Pennsylvania’s Dentist and Dental Hygienist Workforce [Bureau of Health Planning, 2014]), we measure full-time–equivalent (FTE) dentists, to take into account that some dentists work few hours and some work many. In Pennsylvania, more than 70 percent of dentists practice full time (40 hours or more each week), while the remainder work part time.
We examine ten indicators. Table 2.1 lists the indicators we examine in this report. Each indicator is described in detail with an accompanying by-county map. These indicators consist of several provider-to-population ratios that generally fall into three categories: ratio of dental care providers (overall, by type and specialty) to overall population (indicators 1 through 6); ratio of dentists accepting Medicaid patients to Medicaid populations (indicators 7 and 9); and ratio of pediatric dentists to children under 10 (indicators 8 and 9). Indicator 9 is the intersection of the
3
Medicaid and pediatric investigations. We also look at an additional indicator, Head Start enrollments per Children’s Health Insurance Program (CHIP) enrollee, a per capita count that has a different interpretation from the rest. Head Start ensures that children brush their teeth at least daily while they are in the program; children often receive dental screenings and examinations on site as well.
Table 2.1. Dental Access Indicators Used in This Report
Indicator Description
1 FTE dentists per 1,000 people
2 FTE general, pediatric, and geriatric dentists per 1,000 people
3 FTE dental specialists per 1,000 people
4 FTE hygienists per 1,000 people
5 FTE PHDHPs per 1,000 people
6 FTE dental professionals per 1,000 people
7 FTE dentists accepting Medicaid patients per 1,000 Medicaid enrollees
8 FTE pediatric dentists per 1,000 children under age 10
9 FTE pediatric dentists accepting Medicaid patients per 1,000 CHIP enrollees under age 10
10 Head Start enrollments per CHIP enrollee
NOTE: PHDHP = public health dental hygiene practitioner.
For indicator 1, we calculate the number of FTE dentists using the dentist survey from the
population of survey respondents reporting currently working in dentistry. The appendix describes how we assigned counties and calculated FTEs. We took the population counts from the AHRF for 2013.
For indicator 2, we categorized each dentist as general, pediatric, or geriatric, depending on that dentist’s response to question 15 on the dental survey: “Indicate the category that most closely represents the specialty in which the majority of your dental practice time is spent.” More than 80 percent of the FTE dentists in Pennsylvania classify themselves as general, pediatric, or geriatric dentists (the remaining 20 percent would be the other specialized dentists described by indicator 3). The methodology for calculating FTE dentists by specialty follows the same methodology described for indicator 1.
For indicator 3, dental specialists are survey respondents who, for question 15 of the dental survey, responded that the specialty for which most of their dental practice time was spent was endodontics, oral surgery, orthodontics, periodontics, or prosthodontics. The methodology for calculating FTE dental specialists follows the same methodology as that for indicator 1.
For indicator 4, the methodology is similar to that for dentists as described in the appendix, weighting by the imputed hours worked for hygienists reporting working actively in direct patient care.
4
For indicator 5, PHDHPs are expanded-scope-of-practice hygienists who must meet certain criteria (e.g., hours of experience as hygienist, continuing education) and can then administer certain dental procedures without the supervision of a dentist in the facility. PHDHPs were created in Pennsylvania to improve access to care by allowing well-trained hygienists to deliver additional dental care where dentists are scarcer. The methodology to calculate FTE PHDHPs is the same as for hygienists and dentists (as defined in the appendix) but on the subgroup of hygienists who reported being certified PHDHPs.
For indicator 6, the county totals are the sum of the number of FTE dentists (indicator 1) and number of FTE hygienists (indicator 4).
For indicator 7, the FTE dentist calculation is done using the methodology described in the appendix; we take the subset of the dentists who reported accepting Medicaid coverage. The Pennsylvania Department of Health provided the number of Medicaid enrollees by county for 2013. The ratio aims to present a comparable measure to indicator 1 for the subpopulation of Medicaid patients. We emphasize that this measure cannot separately parse out dentists accepting Medicaid coverage for children and for adults, which could differ.
For indicator 8, we calculate the number of FTE dentists using the methodology reported in the appendix. We take the subset of dentists to those reporting that they specialize in pediatrics. This is based on question 15 on the dental survey: “Indicate the category that most closely represents the specialty in which the majority of your dental practice time is spent.” We would prefer to measure the number of dentists who treat children and not just those reporting spending most of their time in pediatric care, but the current survey does not ask this. Our measure thus underestimates overall access to care for children under age 10.
For indicator 9, we explain the calculation for the number of FTE dentists and CHIP enrollees in the Appendix. This indicator is the counterpart of indicator 8 for the subpopulation of children who are in low-income households and participating in the CHIP program.
For indicator 10, Head Start, including Early Head Start, is a federally funded program that provides essential services, including dental services, to low-income children up to five years old. Head Start ensures daily on-site brushing with fluoride toothpaste and might implement dental screenings (Early Childhood Learning and Knowledge Center, 2006). The Head Start program has a unique capability of delivering oral health services to low-income young children and has experienced some success in improving the diagnosis of caries and other oral health issues (McKey et al., 1985; Siegal, Yeager, and Davis, 2004). Data on the number of Head Start enrollees are accessed from the Head Start website (Pennsylvania Head Start Association, undated). CHIP enrollments by county in 2013 were provided by The Pennsylvania Department of Health provided CHIP enrollments by county for 2013, and we converted them to CHIP enrollments under age 5 as described in the appendix.
In section 3, we present by-county maps of the indicators in order to examine the regional variation of dental access. We also calculate the correlation between the indicators that help demonstrate whether there are patterns of access issues in counties across indicators.

5
Finally, we examine how county population characteristics are related to the access indicators. For example, we inspect the access indicators across different levels of county population. We then perform exploratory multivariate regression analysis to understand county characteristics (such as population, population density, fraction with health insurance, unemployment rate, and income) that correlate with higher or lower access to care, as defined by our indicators.
3. Results
Figure 3.1 presents the by-county ratios of FTE dentists to 1,000 people. The yellow vertical line signifies the guideline 0.2 dentists per 1,000 people, and the red vertical line the Pennsylvania state average ratio. At 0.55 dentists per 1,000 people, the state on average has more than 2.5 times the ratio that would indicate a shortage. However, two counties (Potter and Juniata) fall below the guideline level for FTE dentists. In addition, there is wide variation between the counties. For example, the number of dentists per capita is four times as high in Montour (the county with the highest ratio) as in Juniata (the county with the lowest ratio).
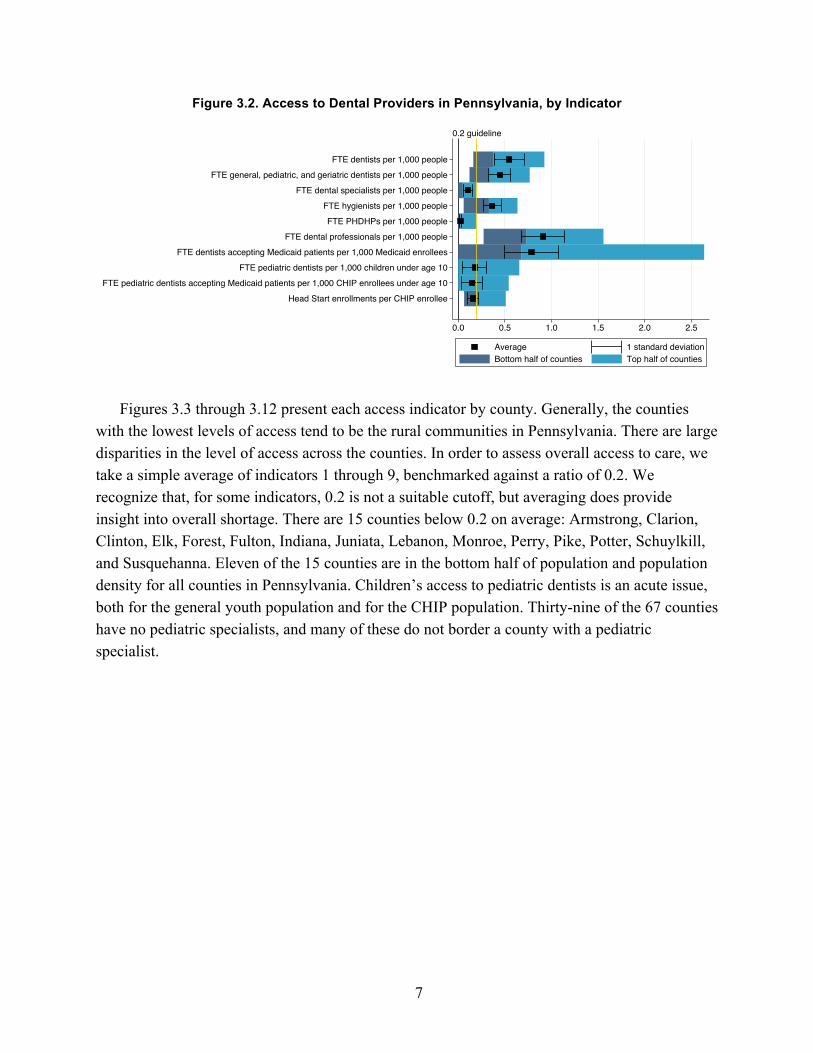
Figure 3.2 presents summary statistics for the ten access indicators, including the mean (average) median (meeting point of bottom and top halves for each indicators), range (full length of each bar), and standard deviation for each indicator. The figure suggests that the ratio of specialist dentists to population is lower than that for general dentists (although, as explained later, this is not necessarily indicative of worse access) and that Medicaid patients have access that is similar to that of non-Medicaid patients in terms of the overall ratio (although, as explained later, this is not necessarily indicative of equal access). The unit of analysis is the county. The range of five of the indicators extends to zero, which means that these counties have no provider in that category (e.g., pediatric dentists). Further, there is, by far, the largest variation between counties in Medicaid access, which also extends to zero; even though, overall, the Medicaid and overall provider–patient ratios are similar, there are several counties for which the ratio is quite low. We explore and illustrate these in more detail in the maps (Figures 3.3–3.12).

6
Figure 3.1. Full-Time–Equivalent Dentists per 1,000 County Residents
0.2 guidelineState average ratio
JuniataPotterFulton
CameronForest
PikeSusquehanna
PerryIndianaClarion
ArmstrongMifflin
ElkClintonAdams
FranklinMonroeSullivan
ColumbiaHuntingdon
LebanonMcKean
SchuylkillVenangoBedford
SomersetCarbon
NorthumberlandBradford
WyomingCrawford
WarrenJeffersonLycoming
TiogaYork
NorthamptonClearfield
MercerSnyderBeaver
BerksCambria
BlairLancaster
FayetteGreeneWayne
LawrenceWashington
CentreErie
ButlerWestmoreland
LuzernePhiladelphia
UnionChesterDauphin
BucksCumberland
DelawareLehigh
LackawannaAllegheny
MontgomeryMontour
Cou
nty
0.2 0.4 0.6 0.8 1.0FTE Dentists per 1,000 People
7
Figure 3.2. Access to Dental Providers in Pennsylvania, by Indicator
Figures 3.3 through 3.12 present each access indicator by county. Generally, the counties with the lowest levels of access tend to be the rural communities in Pennsylvania. There are large disparities in the level of access across the counties. In order to assess overall access to care, we take a simple average of indicators 1 through 9, benchmarked against a ratio of 0.2. We recognize that, for some indicators, 0.2 is not a suitable cutoff, but averaging does provide insight into overall shortage. There are 15 counties below 0.2 on average: Armstrong, Clarion, Clinton, Elk, Forest, Fulton, Indiana, Juniata, Lebanon, Monroe, Perry, Pike, Potter, Schuylkill, and Susquehanna. Eleven of the 15 counties are in the bottom half of population and population density for all counties in Pennsylvania. Children’s access to pediatric dentists is an acute issue, both for the general youth population and for the CHIP population. Thirty-nine of the 67 counties have no pediatric specialists, and many of these do not border a county with a pediatric specialist.
0.2 guideline
FTE dentists per 1,000 peopleFTE general, pediatric, and geriatric dentists per 1,000 people
FTE dental specialists per 1,000 peopleFTE hygienists per 1,000 peopleFTE PHDHPs per 1,000 people
FTE dental professionals per 1,000 peopleFTE dentists accepting Medicaid patients per 1,000 Medicaid enrollees
FTE pediatric dentists per 1,000 children under age 10FTE pediatric dentists accepting Medicaid patients per 1,000 CHIP enrollees under age 10
Head Start enrollments per CHIP enrollee
0.0 0.5 1.0 1.5 2.0 2.5
Average 1 standard deviationBottom half of counties Top half of counties

8
Figure 3.3. Indicator 1: Number of Full-Time–Equivalent Dentists per 1,000 People
Figure 3.3 presents the primary indicator of access, the number of FTE dentists per 1,000 people.
Only two counties (Potter and Juniata) are below the 0.2 guideline, as previously noted. The majority of counties are in the 0.2–0.5 range, while urban areas and their suburbs (Philadelphia, Pittsburgh, and Erie) exhibit higher ratios. Overall, the vast majority of counties in Pennsylvania meet the guideline minimum.

9
Figure 3.4. Indicator 2: Number of Full-Time–Equivalent General, Pediatric, and Geriatric Dentists per 1,000 People
Figure 3.4 shows the distribution of general, pediatric, and geriatric dentists. This map complements the companion map in Figure 3.5, which presents other dental specialists.
The trends are very similar to that for indicator 1, overall dentists (Figure 3.3), with still only two counties below the 0.2 guideline. Even more counties fall into the 0.2–0.5 range. Overall, this suggests that, despite some exceptions, Pennsylvania does not have significant access issues with respect to availability of general, pediatric, and geriatric dentists within each county.

10
Figure 3.5. Indicator 3: Number of Full-Time–Equivalent Other Dental Specialists per 1,000 People
Figure 3.5 shows the number of dental specialists per 1,000 people in each county. Although the distribution of general, pediatric, and geriatric dentists in Figure 3.4 suggests a
similar overall distribution and sufficient levels of access to overall dentists, Figure 3.5 indicates that there are far fewer dental specialists. Of course, fewer specialists are necessary per capita, given that patients do not need to see specialists as often as they see generalists. However, 15 counties have no dentists who categorize themselves as specialists in any of the five categories listed. These counties tend to be close to each other, and in rural areas, so it might be difficult for patients to access specialists by traveling to neighboring counties. Thus, patients who need specialized dental services, especially in rural areas, could have significant access issues.

11
Figure 3.6. Indicator 4: Number of Full-Time–Equivalent Hygienists per 1,000 People
Figure 3.6 presents the number of FTE hygienists per 1,000 people, derived from the 2013 dental hygienist survey. Overall, there are fewer hygienists than dentists (approximately two-third as many FTE hygienists).
In eight counties, the hygienist ratio falls below the 0.2-professional guideline. In contrast to dentists, hygienists, at least in some cases, are scarce in more-urban areas, including Philadelphia and counties bordering Pittsburgh. Potter, one of the two counties with less than 0.2 dentists per 1,000 people, has more than 0.2 hygienists per 1,000 people. Juniata, the other county below 0.2 dentists per 1,000 people, also has below 0.2 hygienists per 1,000 people.
12
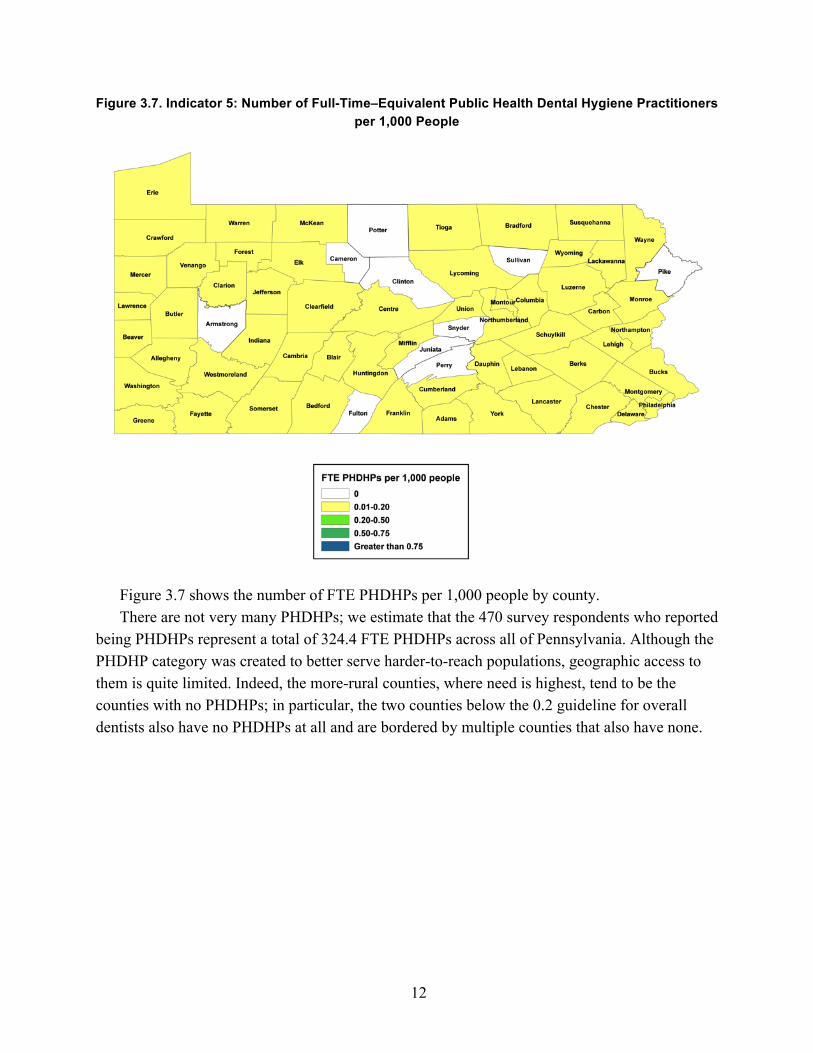
Figure 3.7. Indicator 5: Number of Full-Time–Equivalent Public Health Dental Hygiene Practitioners per 1,000 People
Figure 3.7 shows the number of FTE PHDHPs per 1,000 people by county. There are not very many PHDHPs; we estimate that the 470 survey respondents who reported
being PHDHPs represent a total of 324.4 FTE PHDHPs across all of Pennsylvania. Although the PHDHP category was created to better serve harder-to-reach populations, geographic access to them is quite limited. Indeed, the more-rural counties, where need is highest, tend to be the counties with no PHDHPs; in particular, the two counties below the 0.2 guideline for overall dentists also have no PHDHPs at all and are bordered by multiple counties that also have none.

13
Figure 3.8. Indicator 6: Number of Full-Time–Equivalent Dentists and Hygienists per 1,000 People
Figure 3.8 shows the number of FTE dentists plus hygienists per 1,000 people by county. The county totals are the sum of the number of FTE dentists (indicator 1) and number of FTE hygienists (indicator 4). Hygienists are typically considered complements to dentists because their scope of practice limits what they can do without the supervision of a dentist. (PHDHPs are an exception to this rule but, as indicated above, are scarce; less than 7 percent of hygienists in Pennsylvania are certified PHDHPs.) A dentist with hygienist assistance might be able to see more patients in the same amount of time.
Twenty-five of the 67 counties are in the highest category, having a ratio over 0.75. Eleven of the 67 counties have more than one FTE dental professionals per 1,000 people, five times the guideline level. However, considerable heterogeneity remains. These overall numbers reinforce that people in urban areas have the highest access to dentists and that areas with high access are more likely to be neighboring other areas of relatively high access. Combining dentist and hygienists slightly reorders county rankings; for example, Fulton County, which was above the 0.2 guideline for total FTE dentists, falls to the lowest-ranked county (at 0.27) for the dental professional category.

14
Figure 3.9. Indicator 7: Number of Full-Time–Equivalent Dentists Accepting Medicaid Patients per 1,000 Medicaid Enrollees
Figure 3.9 presents the number of FTE dentists who accept Medicaid patients per 1,000 Medicaid enrollees.
There is a higher ratio of Medicaid-accepting dentists to Medicaid enrollees than dentists per capita. However, there is also a much more variation across counties (0.2 versus 0.03). Although many counties have a sufficient supply of dentists that accept Medicaid patients, several counties have low levels of access. Two counties (Forest and Elk) are at zero, and three more counties (Clinton, Pike, and Lebanon) are below the 0.2 guideline. Further, even in counties with high ratios of dentists accepting Medicaid patients to Medicaid enrollees, there might still be access barriers for Medicaid patients. Specifically, some dentists might prefer private insurance or direct-payment patients to Medicaid coverage patients (and thus restrict the number of Medicaid patients they accept), and some might accept Medicaid only for children.

15
Figure 3.10. Indicator 8: Number of Full-Time–Equivalent Pediatric Dentists per 1,000 Children Under Age 10
Figure 3.10 illustrates the ratio of FTE pediatric dentists per 1,000 children under age 10. Children who need pediatric assistance face severe access-to-care issues. Thirty-nine of
Pennsylvania’s 67 counties have no pediatric specialists. The fact that more than half of the counties have no pediatric specialists suggests that some patients would need to be referred to locations hours away for specialized care (e.g., surgeries) that general dentists would be unwilling to perform, an occurrence that is common, for example, in the Meadville federally qualified health center in which one of us works.
16
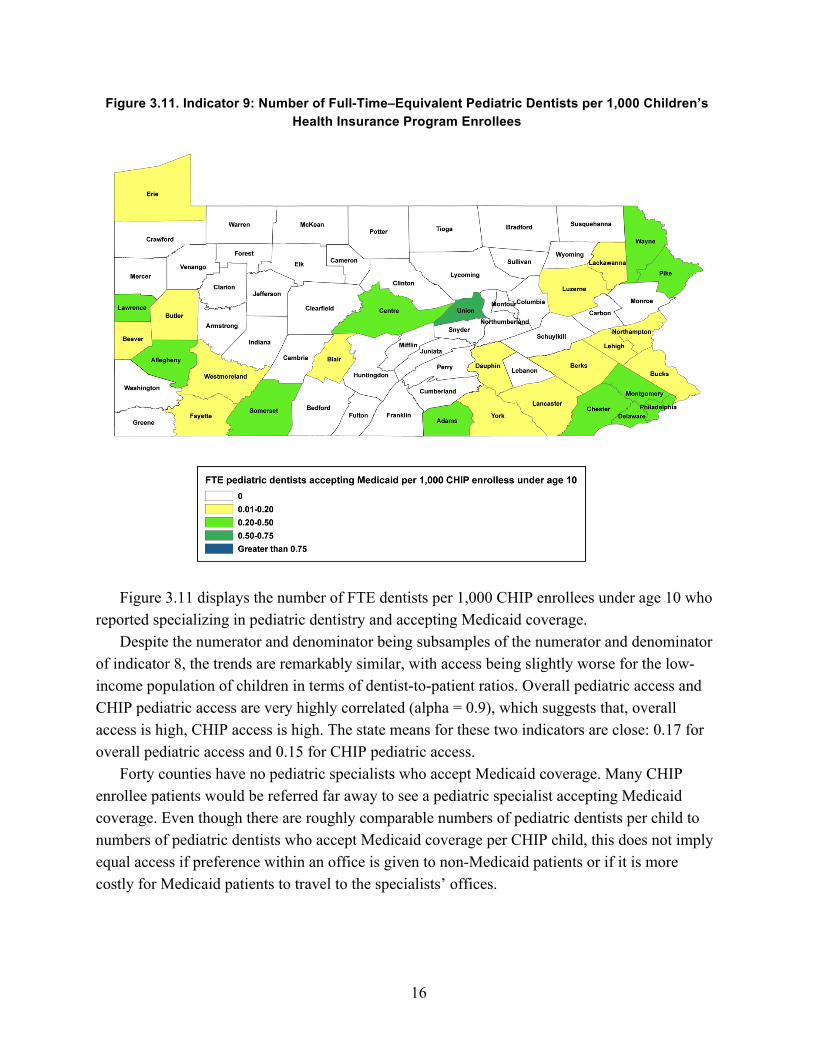
Figure 3.11. Indicator 9: Number of Full-Time–Equivalent Pediatric Dentists per 1,000 Children’s Health Insurance Program Enrollees
Figure 3.11 displays the number of FTE dentists per 1,000 CHIP enrollees under age 10 who reported specializing in pediatric dentistry and accepting Medicaid coverage.
Despite the numerator and denominator being subsamples of the numerator and denominator of indicator 8, the trends are remarkably similar, with access being slightly worse for the low-income population of children in terms of dentist-to-patient ratios. Overall pediatric access and CHIP pediatric access are very highly correlated (alpha = 0.9), which suggests that, overall access is high, CHIP access is high. The state means for these two indicators are close: 0.17 for overall pediatric access and 0.15 for CHIP pediatric access.
Forty counties have no pediatric specialists who accept Medicaid coverage. Many CHIP enrollee patients would be referred far away to see a pediatric specialist accepting Medicaid coverage. Even though there are roughly comparable numbers of pediatric dentists per child to numbers of pediatric dentists who accept Medicaid coverage per CHIP child, this does not imply equal access if preference within an office is given to non-Medicaid patients or if it is more costly for Medicaid patients to travel to the specialists’ offices.
17
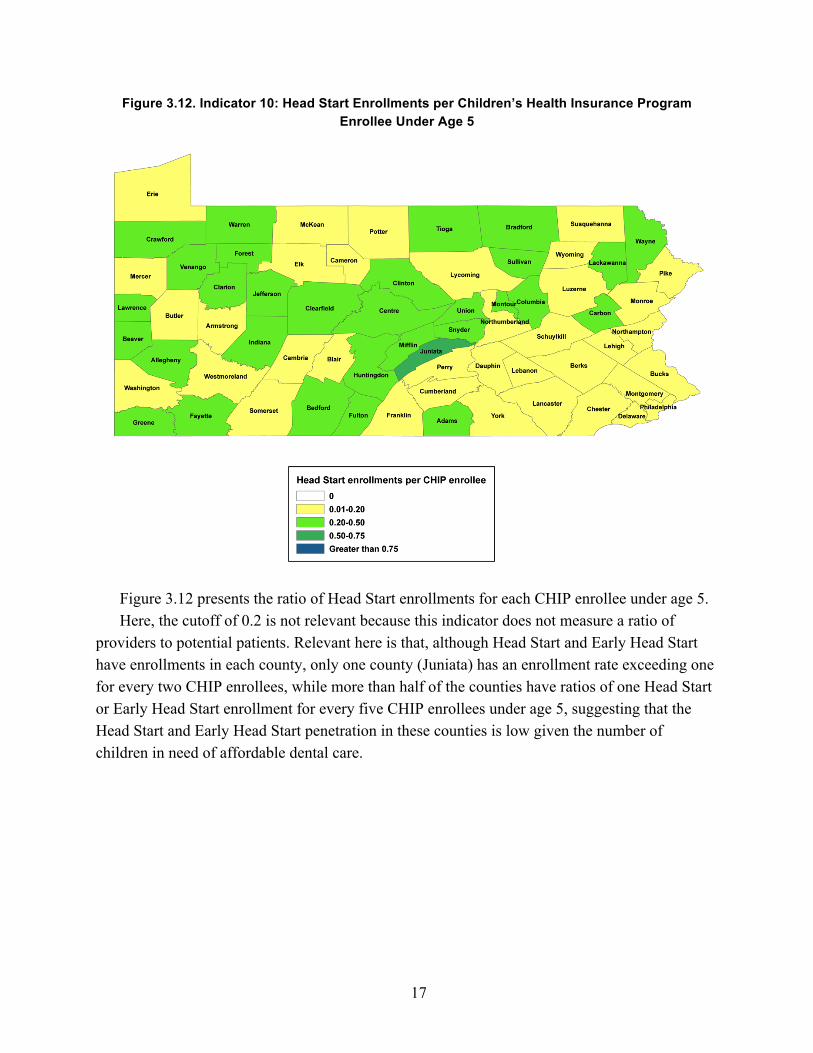
Figure 3.12. Indicator 10: Head Start Enrollments per Children’s Health Insurance Program Enrollee Under Age 5
Figure 3.12 presents the ratio of Head Start enrollments for each CHIP enrollee under age 5. Here, the cutoff of 0.2 is not relevant because this indicator does not measure a ratio of
providers to potential patients. Relevant here is that, although Head Start and Early Head Start have enrollments in each county, only one county (Juniata) has an enrollment rate exceeding one for every two CHIP enrollees, while more than half of the counties have ratios of one Head Start or Early Head Start enrollment for every five CHIP enrollees under age 5, suggesting that the Head Start and Early Head Start penetration in these counties is low given the number of children in need of affordable dental care.

18
The Relationship of Indicators to Each Other The indicators of access seem to exhibit similar patterns across the counties. Counties that
are low-ranked on one measure of access to care are more likely to be lower ranked on other measures as well. Figure A.2 in the appendix presents the pairwise correlation coefficients between each of the indicators. Correlations measure the degree to which two indicators vary together. A value of 1 means that an increase in one indicator is associated with a proportional and consistent increase in the other. A value of –1 means that an increase in one indicator is associated with a decrease in the other. A value of 0 means that the two indicators are not related at all. Seventy-two of the 90 correlation coefficients are positive, implying that, in 80 percent of the cases, counties with lower access to care on one indicator are also lower ranked on another indicator. This is true even for seemingly unrelated indicators. For example, consider the following:
• Of the 33 counties that are in the bottom half of the counties for Medicaid access to care (indicator 7), 26 are also in the bottom half of the counties for children’s access to pediatric specialists (indicator 8).
• Access to PHDHPs (indicator 5) should be higher in counties with poorer access to dentists (indicator 1)—that is, they should exhibit a negative correlation—if the program is succeeding in getting mid-level providers to areas that are not being reached by dentists. However, the correlation coefficient between the two is 0.31. This means that the areas with fewer dentists also have fewer PHDHPs. Figure 3.13 presents the county average PHDHP-to-population ratio within ranges of county FTE dentist–to-population ratios. In the counties with the lowest access to dentists, there are no PHDHPs. The counties with the highest levels of dentist-to-population rates also have the highest levels of PHDHP-to-population ratios on average. On the other hand, there is some evidence that PHDHPs are locating in areas with low levels of pediatric specialists (see Figure A.2 in the appendix), which might alleviate pressure in those areas.
Figure 3.13. Average of Full-Time–Equivalent Public Health Dental Hygiene Practitioners per 1,000 People Across Ranges of Full-Time–Equivalent Dentists per 1,000 People
0.000
0.027 0.027
0.080
0.00
0.02
0.04
0.06
0.08
Aver
age
FTE
PHD
HPs
per
1,0
00 p
eopl
e
0.00-0.20 0.20-0.50 0.50-0.75 >0.75Range of FTE dentists per 1,000 people

19
Of all of the indicators of access to dental care, Head Start enrollment is seemingly doing the best at reaching populations otherwise experiencing low access to dental care. Head Start enrollment is negatively correlated with seven of the nine other indicators, including indicators 8 and 9, which look specifically at children’s access to pediatric care. This suggests that the program might be an effective means of delivering dental care to low-income children who otherwise face barriers to access.
Identifying County Characteristics Associated with Access to Dental Providers
To identify possible explanations for variation in dental provider access across counties, we explore the relationship between counties’ performance on access-to-care indicators and county characteristics. Because dental providers are likely to congregate in areas of higher population density (residents per capita), we first examine how each access indicator varied according to the population density of each county. Figure 3.14 presents the average of the indicators across the four quartiles of population density. With the exception of indicator 10 (Head Start enrollments), each indicator has an almost universal increase in access at each higher level of density. In some cases, the differences can be stark, such as dental specialists (indicator 3), for which the highest quartile of population density has about five times as many dental specialists per capita as the lowest quartile of population density. Overall, Figure 3.14 presents strong evidence that rural areas have difficulties in securing dental providers.
Figure 3.14. Average County Access Indicator Values Stratified Across Population Density Quartiles
0.0
0.2
0.4
0.6
0.8
1.0
Indi
cato
r val
ue
1 2 3 4 5 6 7 8 9 10Access indicator
Population density <65 Population density 65-140Population density 140-353 Population density >353
20
To further explore why we see variation across counties, we use multivariate regression to examine the relationship between various county characteristics and each of our access outcomes. We look at the following characteristics:
• characteristics that could increase the number of providers by making it easier for the provider to reach more patients
− population − population density − total population of bordering counties − urbanicity score
• county median income, which might increase the number of providers by making it easier for residents to pay for providers’ services
• the fraction of the population on Medicaid, which might increase or decrease the number of providers, depending on the indicator and on whether providers are more interested in treating Medicaid or non–Medicaid-covered patients (we typically assume that they would prefer to treat non–Medicaid-covered patients)
• the unemployment rate in the county, which might influence both the likelihood that providers will be working and the likelihood that their patients will be interested in dental services
• the fraction of population under age 10, which could affect the likelihood that a dentist will specialize in pediatric care or that pediatric dentists will practice in these communities
• the percentage of population under age 65 who do not have health insurance, which could decrease the likelihood that providers will locate and work in areas with a high proportion of insurance (because health and dental insurance are highly correlated with each other; we calculate an almost 40-percentage-point increase in the likelihood of having dental insurance for those with health insurance versus those with no health insurance, using the 2013 Medical Expenditure Panel Survey).
To assess whether there is evidence that hygienists and PHDHPs are complements or substitutes for dentists, we additionally look at the ratio of FTE dentists per 1,000 people for the analyses of hygienist and PHDHP rates (indicators 4 and 5). For each of these analyses, we urge caution in interpretation. These analyses do not allow us to conclude that the characteristic causes the access-to-care issue. We are conducting these analyses to get a fuller sense of the issues; more-involved analysis would be necessary to claim that any of these county characteristics were causing increases or decreases in access to care. Table A.2 in the appendix presents the results of the analyses. There are five basic findings.
First, availability of dental providers tends to be higher in counties with larger populations, greater population density, and greater urbanicity. Because these three county characteristics are associated with each other, each might be a slightly different measure of the same underlying phenomenon. We find the strongest relationship with respect to overall population, especially for dentists working in the five specialties singled out in indicator 3. Bordering-county populations also seem to be important, perhaps because having a higher border population induces dentists

21
near the county borders to move their work across the county borders, lessening access within the county.
Second, the fraction of residents under age 10 does not seem to be related to the location of pediatric specialists (indicators 8 and 9), and, if anything, areas that have higher ratios of young children have slightly lower access to pediatric specialists.
Third, higher unemployment rates are associated with fewer dental providers in counties, as hypothesized. The results are statistically significant for four of the indicators. The result is particularly strong for Medicaid-enrollee access to Medicaid-accepting dentists (indicator 7). Dentists are more likely to be found in areas with low unemployment rates.
Fourth, the higher the percentage of people under age 65 who do not have health insurance, the worse the access to dental care, as hypothesized. The effect is especially strong (in relative terms) for general dentists. Although we have no causal explanation, we expect that this is connected to dentists preferring to treat patients who have dental insurance or the ability to pay for services, both of which would be correlated with having health insurance.
Fifth, for each additional two FTE dentists in a county, there is approximately one additional FTE hygienist, and, for each additional ten FTE dentists, there is one additional FTE PHDHP. The former is to be expected and desired because hygienists are complements with dentists and work in tandem. The latter, however, is not necessarily to be expected because PHDHPs are, in some ways, meant to be substitutes for dentists in rural areas. Given that there are more than ten times as many hygienists overall as PHDHPs in Pennsylvania, the relative magnitude of the effect of an additional dentist per PHDHP is twice as large as for hygienists. The higher likelihood for PHDHPs to locate in the same areas as dentists than hygienists overall is opposite the intention.
4. Strengths and Weaknesses
This report contributes to knowledge regarding the distribution of dental providers in Pennsylvania through detailed exploration of provider-to-population ratios for several indicators. The main strength of this report is in this level of detail and presentation at the county level. Through this exercise, we can better understand which types of dental care services and providers are more and less accessible across counties. Further, we are then able to demonstrate the connection between dental care providers and county characteristics, including population, unemployment, and health insurance rates.
There are limitations of this report. First, we cannot estimate the number of dentists willing to treat young children, so we must instead rely on reports of dentists who spend the majority of their time specializing in pediatric dentistry. We suggest that future surveys inquire whether the dentist provides patient care to young children and geriatric patients, regardless of whether this is the majority of their work. We also suggest adding a question to the Pennsylvania survey of

22
dentists regarding whether the dentist accepts Medicaid coverage for adults, in case there are differences in Medicaid coverage acceptance for adults and minors. Additionally, although we perform multivariate regression to understand how different county characteristics relate to indicators of access, these are only correlations and cannot establish causal relationships. Having a panel of more than one year of the dental survey, which could then include county-level fixed effects, would immediately improve the analysis. We could more credibly investigate how changes in county demographics and characteristics affect dental access indicators. However, credible causal estimates would require more than just multiple years of the survey; they would require exogenous variation in the factors (i.e., changes in the factors not occurring due to changes in dental providers but for other reasons), such as might be induced by unanticipated policy changes at the county level (which could then be estimated using a difference-in-differences strategy).
We apply the guidelines of one dentist per 5,000 people to identify access shortages, but this is a loose guideline and certainly not created with the intention of application to other subpopulations, such as ratios of dental specialists to population. Some of our other indicators would have lower thresholds for shortage than general dentists because of the decreased frequency for which each person in the population requires their services. Our strategy of using 0.2 as a guideline throughout this report is for continuity across indicators and because of the lack of previously validated thresholds for each indicator.
5. Conclusion
Our findings suggest variation in dental access to care in Pennsylvania across several indicators of access. A few counties have particularly low access across all of the indicators, and rural areas tend to have worse access. Access to dental specialists, including pediatric dentists, is of particular concern. More than half of Pennsylvania counties do not have a single pediatric dentist (nor do the counties that border them). In addition, a few counties in Pennsylvania have significant barriers for access to care for Medicaid populations, including two counties without a single dentist reporting that they accept Medicaid coverage. Together, the set of access indicators we evaluated helps to provide a more comprehensive picture of access distributions than just examining the rate of dentists per capita.
This research has implications for future policy regarding dental care in Pennsylvania and in other states. For example, we find that higher proportions of individuals with health insurance are correlated with more dentists (presumably because of the increase for demand for their services). The Patient Protection and Affordable Care Act (Pub. L. 111-148, 2010) made dental insurance a required benefit for children, which could lead to worsening access to care for children as demand for dental services increases. Our findings further suggest the need for
23
research that evaluates issues related to PHDHPs to verify that incentives are properly aligned for these mid-level providers to serve unmet needs in underserved populations, as intended.
There is a need for additional research to explore causal mechanisms by which counties increase or decrease access to care, most likely by examining variation across years between counties with shifts in the county characteristics caused by policy changes or other unexpected changes. Further, our analyses provide an indication of how dentists are sorted across the counties of Pennsylvania, but we have not established the level of absolute shortage. Clearly, however, there is an inequitable distribution of provider location, including by pediatric specialty and by willingness to accept Medicaid patients.
Appendix: Technical Materials
County Assignments
To assign counties, we first use the reported county where each survey respondent works. For those missing this variable but reporting working in dentistry, we use the county in which the respondent reported living (these account for 1.7 percent of the respondents).
Calculation of Individual Full-Time Equivalence To calculate FTE, we use the reported hours worked for each dentist reporting currently
working in dentistry. We then scale each person from counting for one dentist to the fraction of FTE dentists by using that person’s reported hours worked, using a 40-hour workweek as the baseline for FTE. If the respondent reported zero or reported not working in dentistry, we set that respondent equal to 0 FTE. If the respondent reported one to ten hours, we set the respondent equal to 5 ÷ 40 = 0.125 FTE. If the respondent reported 11 to 19 hours, we set the respondent equal to 15 ÷ 40 = 0.375 FTE. If the respondent reported 20 to 30 hours, we set the respondent equal to 25 ÷ 4 = 0.625 FTE. If the respondent reported 31 to 40 hours, we set the respondent equal to 40 ÷ 40 = 1 FTE. If the respondent reported more than 40 hours, we set the respondent equal to 50 ÷ 40 = 1.25 FTEs. Unfortunately, we do not have more-accurate information from the survey, particularly an issue for the response of more than 40 hours, for which there is no upper bound. Of working respondents, 12.7 percent reported being in this top category (46.3 percent are in the interval that includes 40 hours per week). Because we cannot find better guidance on the average number of hours worked for Pennsylvania dentists who work more than 40 hours per week, we choose a value of 50 hours per week. This yields an average-hours-worked estimate of 35.5 hours per week, conditional on working any hours.

24
Scaling Survey Responses to County Totals We use the AHRF, which has by-county reports of the total number of dentists who are
active professionally in 2013. We contrast this with our survey estimate of the total number of working dentists in each county (regardless of hours worked). Specifically, we take the ratio of the AHRF count to our survey count as a scaling factor to scale up our FTE calculation in case there were nonrespondents in the survey who are captured in the AHRF. This yields an average scaling factor of 1.200, with a minimum of 0 and a maximum of 1.75. We then adjust the scaling factor to have a floor of 1 (that is, the smallest number of dentists in a county is given by our number of dentists responding working in the survey). This moves the average scaling factor to 1.202, virtually the same. The joint use of the scaling factor and the floor means that our estimates of FTE are slightly conservative in favor of finding more dentists.
Children’s Health Insurance Program Enrollee Conversion
The numbers of total CHIP enrollees are for all children under age 18. The Pennsylvania Department of Health provided them. However, we were interested directly in the number of CHIP enrollees under lower ages (under age 10 for indicator 9 and under age 5 for indicator 10). To convert to these, we scaled by the ratio of the county population under age 18 to the county population under the lower age. This assumes that the CHIP enrollment rates are invariant within county across the age profile (at least at those cutoffs).
Additional Tables and Figures
Table A.1. Regression Covariate Moments
Variable Mean Standard Deviation Population 190,653.75 272,053.50 Population density 0.45 1.38
Urbanicity score 0.60 0.25
Border population 1,057,805.76 936,102.66
Fraction under 10 0.11 0.01
Median income, in dollars 48,863.51 9,147.23
Fraction receiving Medicaid 0.16 0.04
Unemployment rate 7.64 1.19
Percentage uninsured 0.12 0.02

25
Table A.2. Multivariate Regressions of Access Indicators on County Characteristics
Access Indicator 1a 2b 3c 4d 5e 6f 7g 8h 9i 10j
Population 0.06** 0.04 0.03*** –0.00 –0.01 0.09* 0.06 0.04 0.01 –0.02
(0.03) (0.02) (0.01) (0.02) (0.01) (0.05) (0.12) (0.03) (0.03) (0.02)
Population density
0.01 0.00 0.01 –0.01 0.01 0.00 0.04 0.03 0.04 0.02
(0.03) (0.02) (0.01) (0.02) (0.01) (0.05) (0.11) (0.03) (0.03) (0.02)
Urbanicity 0.02 0.02 0.01 0.01 –0.01 0.04 –0.04 0.02 0.03 –0.01
(0.02) (0.02) (0.01) (0.01) (0.00) (0.03) (0.08) (0.02) (0.02) (0.01)
Bordering-county population
–0.01 –0.00 –0.00 –0.02 –0.01 –0.03 –0.03 –0.01 –0.02 –0.00
(0.03) (0.02) (0.01) (0.02) (0.01) (0.04) (0.11) (0.03) (0.03) (0.02)
Fraction under age 10
–0.02 –0.03 0.00 0.03*** –0.00 –0.00 –0.13* –0.02 –0.03 –0.01
(0.02) (0.02) (0.01) (0.01) (0.00) (0.03) (0.07) (0.02) (0.02) (0.01)
Median income 0.02 0.03 –0.01 –0.01 0.00 0.02 0.10 0.02 0.04 –0.06**
(0.04) (0.03) (0.01) (0.02) (0.01) (0.06) (0.16) (0.04) (0.04) (0.03)
Fraction receiving Medicaid
0.02 0.03 –0.01 –0.02 0.00 0.00 0.09 –0.02 –0.02 –0.03
(0.03) (0.02) (0.01) (0.02) (0.01) (0.05) (0.12) (0.03) (0.03) (0.02)
Unemployment rate
–0.04* –0.03** –0.00 0.00 –0.00 –0.05* –0.14* 0.00 –0.00 –0.01
(0.02) (0.01) (0.01) (0.01) (0.00) (0.03) (0.07) (0.02) (0.02) (0.01)
Percentage under 65 uninsured
–0.06*** –0.04*** –0.01** –0.02 –0.00 –0.10*** –0.04 0.00 0.01 0.00
(0.02) (0.01) (0.01) (0.01) (0.00) (0.03) (0.07) (0.02) (0.02) (0.01)
Dentists per 1,000 people
0.47*** 0.11***
(0.08) (0.03)
Constant 0.42*** 0.36*** 0.06*** 0.13*** –0.02 0.74*** 0.69*** 0.08*** 0.08*** 0.20***
(0.01) (0.01) (0.00) (0.03) (0.01) (0.02) (0.05) (0.01) (0.01) (0.01)
R-squared 0.59 0.54 0.58 0.69 0.33 0.57 0.15 0.34 0.25 0.42
NOTE: Standard errors are in parentheses. Covariates are standardized to within-state z-scores. We have left all indicators (including where included as covariates) in their original form. *** = p < 0.01. ** = p < 0.05. * = p < 0.1. Given the exploratory nature of the analysis, we have not made multiple hypothesis adjustments. Observations = 67 for all indicators. a FTE dentists per 1,000 people. b FTE general, pediatric, and geriatric dentists per 1,000 people. c FTE dental specialists per 1,000 people. d FTE hygienists per 1,000 people. e FTE PHDHPs per 1,000 people. f FTE dental professionals per 1,000 people. g FTE dentists accepting Medicaid patients per 1,000 Medicaid enrollees. h FTE pediatric dentists per 1,000 children under age 10. i FTE pediatric dentists accepting Medicaid patients per 1,000 CHIP enrollees under age 10. j Head Start enrollments per CHIP enrollee.

26
Figure A.1. Ratio of Dentists to 1,000 Population, by State
Figure A.2. Correlation Coefficient Matrix for Access Indicators
Median
0.1
0.2
0.3
0.4
Stan
dard
dev
iatio
n of
ratio
acr
oss
coun
ties
Median
0.4 0.5 0.6 0.7 0.8Mean ratio of dentists to population
Pennsylvania Remaining states
1.001.001.001.001.00
0.870.870.870.870.87
0.980.980.980.980.98
0.730.730.730.730.73
0.310.310.310.310.31
0.960.960.960.960.96
0.580.580.580.580.58
0.540.540.540.540.54
0.370.370.370.370.37
−0.25−0.25−0.25−0.25−0.25
1.001.001.001.001.00
0.750.750.750.750.75
0.650.650.650.650.65
0.130.130.130.130.13
0.840.840.840.840.84
0.360.360.360.360.36
0.540.540.540.540.54
0.380.380.380.380.38
−0.24−0.24−0.24−0.24−0.24
1.001.001.001.001.00
0.710.710.710.710.71
0.350.350.350.350.35
0.930.930.930.930.93
0.630.630.630.630.63
0.500.500.500.500.50
0.330.330.330.330.33
−0.23−0.23−0.23−0.23−0.23
1.001.001.001.001.00
0.350.350.350.350.35
0.900.900.900.900.90
0.300.300.300.300.30
0.250.250.250.250.25
0.140.140.140.140.14
−0.39−0.39−0.39−0.39−0.39
1.001.001.001.001.00
0.350.350.350.350.35
0.320.320.320.320.32
−0.07−0.07−0.07−0.07−0.07
−0.11−0.11−0.11−0.11−0.11
0.240.240.240.240.24
1.001.001.001.001.00
0.500.500.500.500.50
0.450.450.450.450.45
0.300.300.300.300.30
−0.32−0.32−0.32−0.32−0.32
1.001.001.001.001.00
0.260.260.260.260.26
0.210.210.210.210.21
0.080.080.080.080.08
1.001.001.001.001.00
0.900.900.900.900.90
−0.21−0.21−0.21−0.21−0.21
1.001.001.001.001.00
−0.13−0.13−0.13−0.13−0.13 1.001.001.001.001.00
11
2
33
4
55
6
77
8
99
10
Indicator
11 2 33 4 55 6 77 8 99 10Indicator
27
References
Allison, R. A., and R. J. Manski, “The Supply of Dentists and Access to Care in Rural Kansas,” Journal of Rural Health, Vol. 23, No. 3, Summer 2007, pp. 198–206.
Buchmueller, Thomas C., Sarah Miller, and Marko Vujicic, How Do Providers Respond to Public Health Insurance Expansions? Evidence from Adult Medicaid Dental Benefits, Cambridge, Mass.: National Bureau of Economic Research Working Paper 20053, April 2014. As of December 7, 2015: http://www.nber.org/papers/w20053
Bureau of Health Planning, Division of Plan Development, Pennsylvania Department of Health, 2013 Pulse of Pennsylvania’s Dentist and Dental Hygienist Workforce: A Report on the 2013 Survey of Dentists and Dental Hygienists, Vol. 6, September 2014. As of December 7, 2015: http://www.health.pa.gov/Your-Department-of-Health/Offices%20and%20Bureaus/Health%20Planning/Documents/WR/2013%20Pulse%20of%20PA%20Dentist%20and%20Dental%20Hygienist%20Workforce%20Report%20Final.pdf
Coulter, Ian D., C. Maida, R. Belloso, J. Freed, K. Betters, and M. Marcus, Medicaid and Dental Care for Children: A Review of the Literature, Chicago, Ill.: American Dental Association, 2003.
Dubay, K. L., M. A. Parker, and G. H. DeFriese, “Assuring the Accessibility of Basic Dental Care Services: Issues of Workforce Supply, Organization of Care, and Education,” North Carolina Medical Journal, Vol. 66, No. 6, November–December 2005, pp. 430–437.
Early Childhood Learning and Knowledge Center, Head Start, “Oral Health—Revision ACF-PI-HS-06-03,” 2006. As of November 11, 2015: http://eclkc.ohs.acf.hhs.gov/hslc/standards/pi/2006/resour_pri_00109_122006.html
Edelstein, Burton, Clemencia M. Vargas, Devanie Candelaria, and Maryen Vemuri, “Experience and Policy Implications of Children Presenting with Dental Emergencies to US Pediatric Dentistry Training Programs,” Pediatric Dentistry, Vol. 28, No. 5, September–October 2006, pp. 431–437.
Flynn, P., K. T. Call, J. K. Pintor, and N. Elmi, “The Projected Effect of the Affordable Care Act on Dental Care for Adult Medicaid Enrollees,” Journal of Health Care for the Poor and Underserved, Vol. 25, No. 1 Suppl., February 2014, pp. 79–94.
Health Resources and Services Administration, U.S. Department of Health and Human Services, “Shortage Designation: Health Professional Shortage Areas and Medically Underserved Areas/Populations,” undated. As of October 13, 2015: http://www.hrsa.gov/shortage/

28
Jackson, Stephanie L., William F. Vann Jr., Jonathan B. Kotch, Bhavna T. Pahel, and Jessica Y. Lee, “Impact of Poor Oral Health on Children’s School Attendance and Performance,” American Journal of Public Health, Vol. 101, No. 10, October 2011, pp. 1900–1906.
McKey, Ruth Hubbell, Larry Condelli, Harriet Ganson, Barbara J. Barrett, Catherine McConkey, and Margaret C. Plantz, The Impact of Head Start on Children, Families and Communities: Final Report of the Head Start Evaluation, Synthesis and Utilization Project, Washington, D.C.: Head Start Bureau, Administration for Children, Youth and Families, Office of Human Development Services, U.S. Department of Health and Human Services, 1985. As of December 7, 2015: http://eric.ed.gov/?id=ED263984
Mertz, E., and W. E. Mouradian, “Addressing Children’s Oral Health in the New Millennium: Trends in the Dental Workforce,” Academic Pediatrics, Vol. 9, No. 6, November–December 2009, pp. 433–439.
Network for Public Health Law, Policy Options to Increase Access to Oral Health Care and Improve Oral Health by Expanding the Oral Health Workforce, Oral Health Care Science and Law Brief, October 2014. As of December 7, 2015: https://www.networkforphl.org/resources_collection/2014/10/10/507/brief_policy_options_to_increase_access_to_oral_health_care_and_improve_oral_health_by_expanding_the_oral_health_workforce
Orlans, Joshua, Elizabeth Mertz, and Kevin Grumbach, Dental Health Professional Shortage Area Methodology: A Critical Review, San Francisco, Calif.: University of California, San Francisco, Center to Address Disparities in Children’s Oral Health, University of California, San Francisco, Center for California Health Workforce Studies, October 2002. As of December 7, 2015: http://www.futurehealth.ucsf.edu/Public/Publications-and-Resources/Content.aspx?topic=Dental_Health_Professional_Shortage_Area_Methodology_A_Critical_Review
Pennsylvania Head Start Association, “PA’s Head Start Programs Current Enrollment,” undated. As of October 1, 2015: http://paheadstart.org/index.php/head-start-in-pa/list-of-pa-hs-programs/
Public Law 111-148, Patient Protection and Affordable Care Act, March 23, 2010. As of December 8, 2015: http://www.gpo.gov/fdsys/granule/PLAW-111publ148/PLAW-111publ148/content-detail.html
29
Shartzer, Adele, and Genevieve M. Kenney, “QuickTake: The Forgotten Health Care Need—Gaps in Dental Care for Insured Adults Remain Under ACA,” Health Reform Monitoring Survey, September 24, 2015. As of October 13, 2015: http://hrms.urban.org/quicktakes/Gaps-in-Dental-Care-for-Insured-Adults-Remain-under-ACA.html
Siegal, M. D., M. S. Yeager, and A. M. Davis, “Oral Health Status and Access to Dental Care for Ohio Head Start Children,” Pediatric Dentistry, Vol. 26, No. 6, November–December 2004, pp. 519–525.
U.S. Department of Health and Human Services, Oral Health in America: A Report of the Surgeon General, Rockville, Md.: U.S. Department of Health and Human Services, National Institute of Dental and Craniofacial Research, National Institutes of Health, 2000. As of December 7, 2015: http://silk.nih.gov/public/[email protected]
———, HHS Oral Health Initiative 2010: Promoting and Enhancing the Oral Health of the Public, 2010. As of December 7, 2015: http://www.hrsa.gov/publichealth/clinical/oralhealth/hhsinitiative.pdf