access to drinking water and sanitation in bulgaria · an eu directive pits environmentalists...
TRANSCRIPT

Access to drinking water and sanitation in Bulgaria
Assoc. Prof. Galia Bardarska, Ph.D.Bulgarian Academy of Sciences [email protected]
Equitable access to water, Paris, 5-6 July 2007

Bulgaria is part of the 5 th EU enlargement- January 1, 2007
Area 110993.6 km 2
Population 7 718 750 (2005)
70% of total population in the towns

Total number of settlements in the country 5332 (31.12.2005)
Number of settlements with inhabitants number less then 2000 - 4941 (31.12.2005) of which:
• 19 towns;
• 2 monasteries;• 4922 villages
Total number of inhabitants living in the settlements with less then 2000 inhabitants
1 881 387 inhabitants or 24.4% of total population
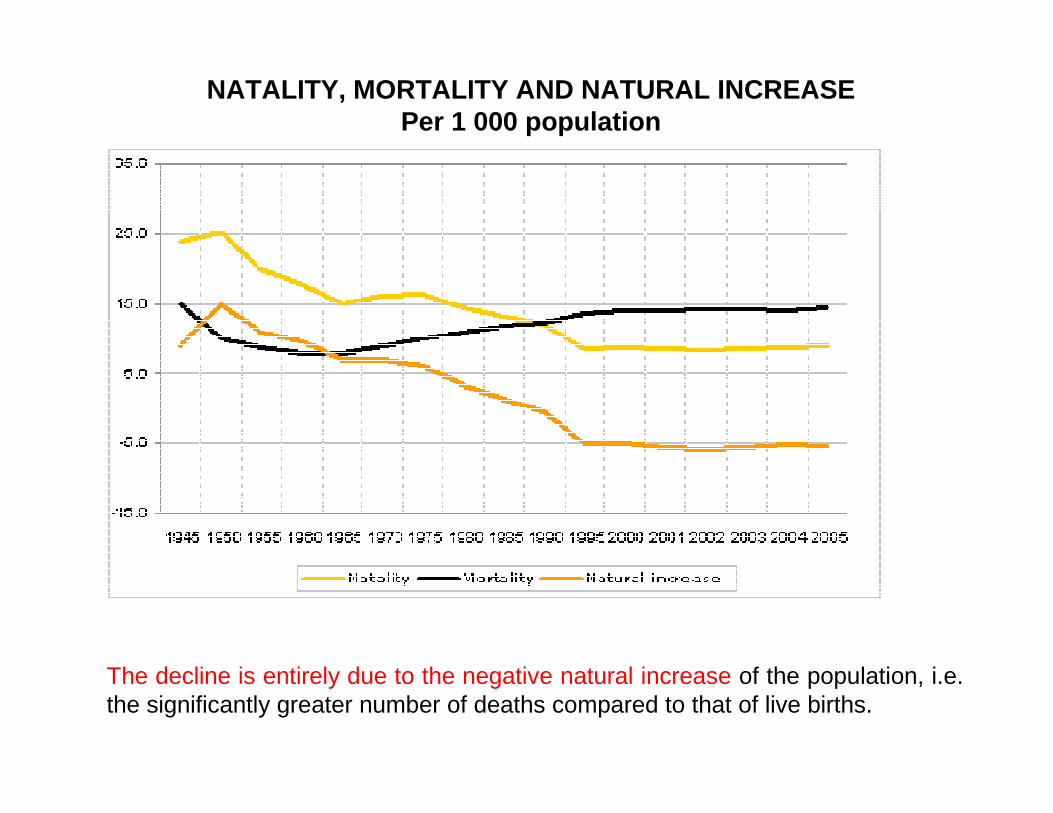
NATALITY, MORTALITY AND NATURAL INCREASEPer 1 000 population
The decline is entirely due to the negative natural increase of the population, i.e. the significantly greater number of deaths compared to that of live births.

After reaching the high level in 1997 -17.5‰, the rate decrease in the next years and reaches 11.6‰ in 2004. In 2005, 739 children up to the age of 1 year died in Bulgaria, with the infant mortality rate decreasing to 10.4‰.

Educational Status of the Population between 25 and
64 Years of Age in Rural and Urban Areas (2001,NSI)
16.9
35.9
51.9
43.4
20.6
5.5
0% 20% 40% 60% 80% 100%
Urban
Rural Illiterate
Primary education
Low er secondary
Secondary education
College
University
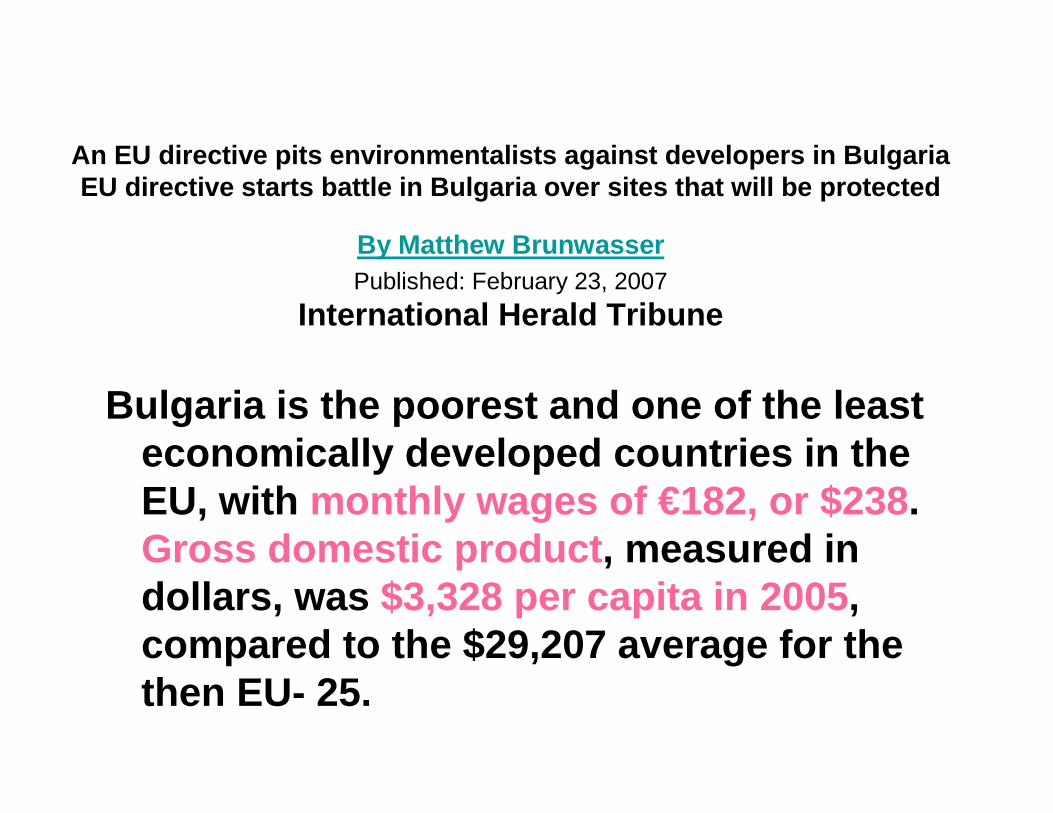
An EU directive pits environmentalists against deve lopers in BulgariaEU directive starts battle in Bulgaria over sites that will be protected
By Matthew BrunwasserPublished: February 23, 2007
International Herald Tribune
Bulgaria is the poorest and one of the least economically developed countries in the EU, with monthly wages of €182, or $238 . Gross domestic product , measured in dollars, was $3,328 per capita in 2005 , compared to the $29,207 average for the then EU- 25.

GDP (2005): ЕС25=100France=109; Bulgaria = 32

0%
10%
20%
30%
40%
50%
60%
70%
80%
90%
100%
Low Income Middle Income High Income
Development level
Typical shift in national priorities according to d evelopment levels
Environmental Sustainability Economic Development
Water Supply & Sanitation

0
200000
400000
600000
800000
1000000
1200000
Wat
er, t
hous
ands
m3 /y
ear
20
00
20
01
20
02
20
03
20
04
20
05
Year
Public water supply system in Bulgaria
Water supply Water lossess

Structure of water-supply network by
type of pipes
Others3.2%
PVC0.4%
PE3.6%
Zinc-coated2.9%
Steel pipes14.6%
Asbestos cement75.3%
2005Water-supply network 69043 km
Water-supply network built in
From 2001 to 20051.9%
From 1991 to 20005.0%
From 1981 to 200013.4%
From 1971 to 198022.5%
From 1961 to 197037.0%
By the end of 196020.2%

Public water supply -98.9% of total population:
- 100% urban areas - 84% in rural areas
4% of total population don’t have tapped water in villages

There are some villages with 40 l/cap/day (WHO limit is 50 l/cap/day)
Households consumption in Bulgaria1
32
13
7
99
95
90 95
94
92
0
20
40
60
80
100
120
140
160
19
91
19
95
20
00
20
01
20
02
20
03
20
04
20
05
Year
Co
nsum
ptio
n,l/c
ap/
d
Households consumption

Prices of drinking water (households)
Source: Géographie romande des prix de l’eau -HES
1.31Lausanne
1.24La Chaux de Fonds
0.79Genève
0.78Neuchâtel
0.19Martigny
0.18Sion
€/m3City
PRICE OF DRINKING WATER SWITZERLAND
0.92Razgrad
0.74Dobrich
0.55Veliko Tarnovo
0.31Sofia
0.30Plovdiv
0.16Rakitovo
€/m3Water supply & sewerage
company
PRICE OF DRINKING WATER BULGARIA 2005

Costs of water supply in € (2005) Bulgaria
0.05 0.05 0.05 0.02
0.42 0.440.51
0.28
0.92 0.92 0.92
0.57
0.00
0.20
0.40
0.60
0.80
1.00
1.20
Household Public Industry Not drinkingwater
Minimum
Average
Maximum

Directive 98/83/EC on the quality of water intended for human consumption
Regulation No. 9 of 16 March 2001 on the Quality of Water Intended for Human Consumption (State Gazette No. 30 of 28 May 2001)

Ministry of Health, 28 Regional Inspectorate for Protection and
Control of Public Health• 5892 sources of central drinking water supply were
monitored, 315 of which being surface water sources.
• Only 109 surface water sources have treatment installations
• 24890 samples have been tested in check monitoring and 3332 samples have been tested in audit monitoring by the State Health Control
• 97.7% of drinking water in the country meets the standards in 2006

Regions – 6, Districts- 28Municipalities - 264

84.00%
86.00%
88.00%
90.00%
92.00%
94.00%
96.00%
98.00%
100.00%
2000 2001 2002 2003 2004 2005
Year
Percentage of the value of quality indices according to drinking standards, %
Full (complete) analysis
Shortened analysis
Chemical, organoleptic and radiological indices

Drinking water treatment plants (43 DWTP) -43.2% of total population
Treatment of drinking water in Bulgaria
55%
2%
43%
Desinfection
Precipitation and desinfection
Drinking water treatment plant

0
2
4
6
8
10
12
14
03.10.0612:00
04.10.0600:00
04.10.0612:00
05.10.0600:00
05.10.0612:00
06.10.0600:00
06.10.0612:00
Мътност, F
AU
Turbidity of drinking water after drinking water treatment plant in Kardjalytown

Main drinking water quality problems• Deviations from the microbiological indicators• Nitrates
• Organoleptic indicators (colour, odour, taste, turbidity)
• Manganese
• Heavy metals indicators (mainly chromium)Main reasons: shortages of drinking water
(drought), floods, bad water supply systems condition and lack of treatment facilities

Impacts of drought on drinking water quality
Gopina G. et al. Chapter 17. Health and Hygienic Aspects of Drought. In: Drought in Bulgaria: A Contemporary Analog for Climate Change. Ashgate, UK, 2007, pp. 336
The study for the drought period 1982-1993 confirmed that rates of Hepatitis A virus and Shigelloses morbidity had been consistently higher among large population who live in regions with insufficient amounts of drinking water.
50.7%Targovishte
57.7%Vratsa
77.1%Montana
82.7%Dobrich
83.8%Lovech
1993Area
Percentage of the population with regular water supply regimes during the drought
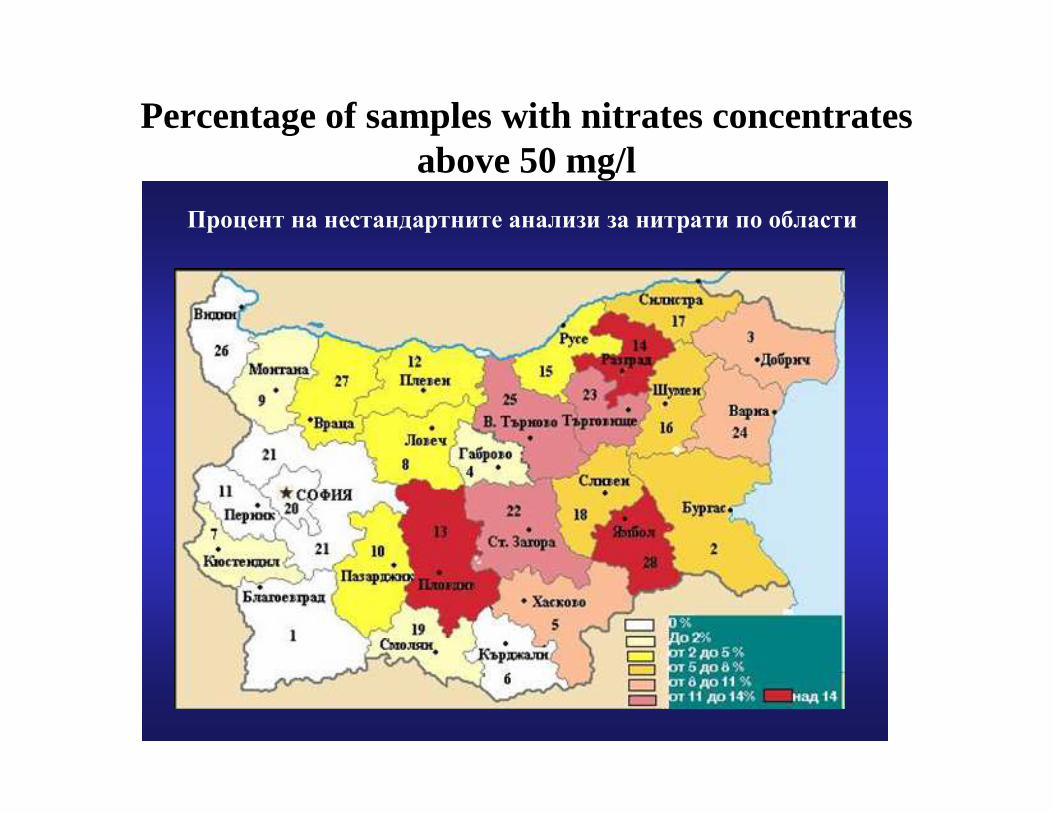
Percentage of samples with nitrates concentrates above 50 mg/l
Процент на нестандартните анализи за нитрати по области

88
%
87
.18
%
85
.90
%
91
.22
%
91
.63
%
90
.79
%
82%
84%
86%
88%
90%
92%
2000 2001 2002 2003 2004 2005Year
Number of control sample for microbiological indices according to drinking water standards, %

Percentage of sample with microbiological indices above limits
Процент на нестандартните анализи по микробиологични
показатели по области

Percentage of samples with concentrations of E. coli and Enterococi
above limits (Vidin and Burgas above WHO limits)
Процент на нестандартните анализи по значими за здравето
микробиологични показатели - Е. Коли и Ентерококи пообласти

EU Urban Waste Water Directive
concerns the collection, treatment and discharge of wastewater from urban agglomerations of more than 2000 p. e.
Recent review carried out by the Country Water Partnerships of GWP CEE indicates that small and dispersed communities (less then 2 000 p. e.) are inhabited to 40 percent of the total population of the CEE countries, which represents to 40 millions of inhabitants. They constitute large but usually economically less successful segment of our societies.

In Bulgaria all national programs and strategies refer to construction of collecting system and WWTPs for agglomerations with above 2 000 p.e.
4765 rural settlements are out of the range of the program. They include around 1.8 mln. inhabitants, which is around 24 % of the population of the country and represent around 2.2 mln. p.e. (around 18 % of the total p.e.).
At present, there is no working sustainable sanitation system in the country.
Visit of ENGREF-Montpellier studentsto WWTP Gorna Oryahovitza, March 2007

BULGARIA70.5% of total number of towns and
2.1% of total number of villages with sewerage systems (167 towns and 100 villages with sewerage systems)
68.9% inhabitants connected to sewerage systems (2005)
40.7% inhabitants connected to wastewater treatment plants
71 population areas with
3 342 075 inhabitants with WWTPs

66
.53
5.6
66
.73
5.9
66
.73
6.2
66
.53
6.7
67
.43
8.1
68
38
.6
68
.43
9.9
68
.54
0.3
68
.94
0.7
0
10
20
30
40
50
60
70
Po
pula
tion
conn
ecte
d, %
19
97
19
98
19
99
20
00
20
01
20
02
20
03
20
04
20
05
Year
Population connected to public sewerage and to wastewater treatment plant in Bulgaria
Part of population connected to public sewerage
Part of population connected to WWTP

2005Sewage network8244 km
Very old collectors
From 2001 to 20051.2%
From 1991 to 20008.4%
From 1981 to 200026.9%
From 1971 to 198030.3%
From 1961 to 197019.8%
By the end of 196013.4%sewage network in 70.5% of the towns covering 48.5% of the streets length
sewage network in 2.1% of the villages covering 0.6% of the streets length

2005Actual working WWTP capacity 54% of design capacity
Biological treatment42
Mechanical treatment14
56 - total number of WWTP of which:
Biological treatment1837
Mechanical treatment162
thousands m3/dayDesign capacity of which:
1999

Credit: T. Trenkova

Costs of wastewater collection in € (2005) Bulgaria
0.01 0.01 0.020.06 0.07
0.10
0.66 0.660.71
0.00
0.20
0.40
0.60
0.80
Household Public Industry
Minimum
Average
Maximum

Costs of wastewater treatment in € (2005) Bulgaria
0.02 0.02 0.02 0.02
0.120.2
0.26
0.38
0.28
0.43
0.55
0.83
0.00
0.20
0.40
0.60
0.80
1.00
LP 1 LP 2 LP 3
Household Industry (Level Pollution)
Minimum
Average
Maximum
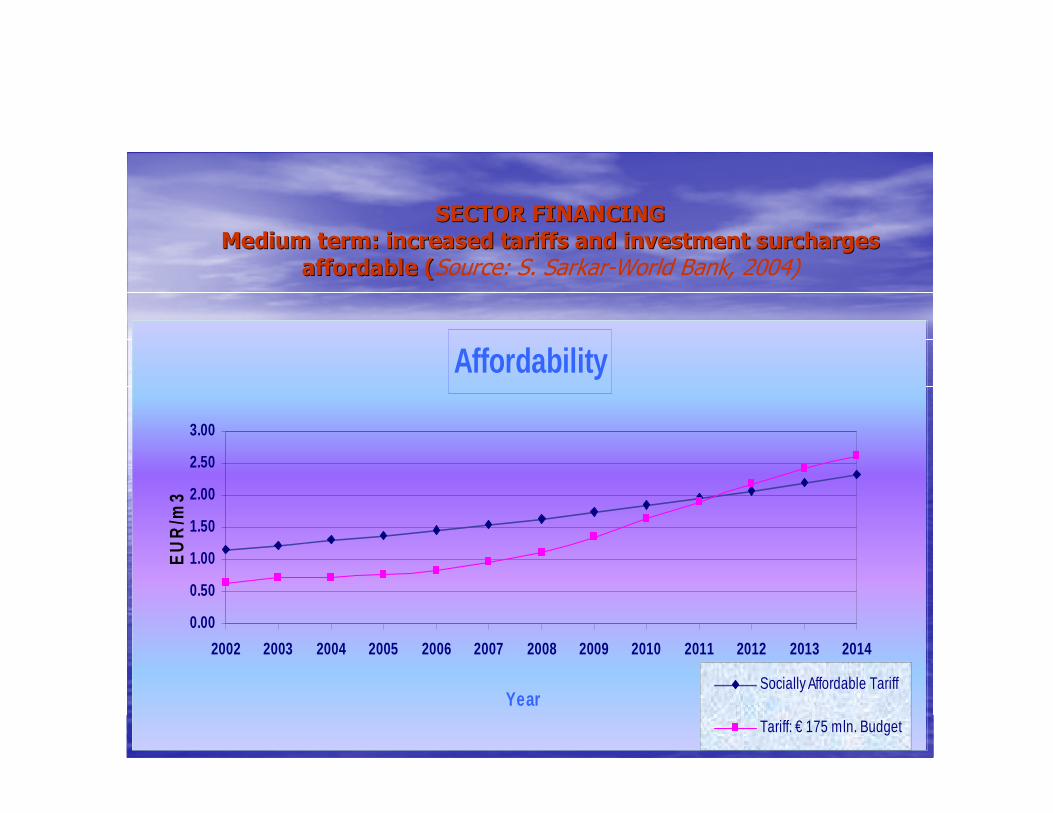
SECTOR FINANCING SECTOR FINANCING
Medium term: increased tariffs and investment surcharges Medium term: increased tariffs and investment surcharges
affordable (affordable (Source: S. Sarkar-World Bank, 2004)
Affordability
0.00
0.50
1.00
1.50
2.00
2.50
3.00
2002 2003 2004 2005 2006 2007 2008 2009 2010 2011 2012 2013 2014
Year
EU
R/m
3
Socially Affordable Tariff
Tariff: € 175 mln. Budget

SWOTSWOT ANALYSISANALYSIS
OpportunitiesOpportunitiesThere is a potential for the absorption of a There is a potential for the absorption of a
great amount of financial resources for great amount of financial resources for infrastructure improvement.infrastructure improvement.
Financial interest is shown by international Financial interest is shown by international financial institutionsfinancial institutions..
Some internationally recognized operators Some internationally recognized operators have expressed interest to participate in services have expressed interest to participate in services managementmanagement,, and they are ready to make and they are ready to make significant investments for improvement of the significant investments for improvement of the quality of water supply and sewerage services vis quality of water supply and sewerage services vis concession or other forms of publicconcession or other forms of public--private private
partnershippartnership..D
evelopm
ent leverag
esD
evelopm
ent levera
ges
Strong sidesStrong sidesThe provided services are of primary The provided services are of primary
importance to all consumersimportance to all consumers..
Activities in water supply and sewerage Activities in water supply and sewerage belong to belong to the the ““natural monopoliesnatural monopolies””
there are established management there are established management structures and the related facilities. structures and the related facilities.
Over Over 98,5%98,5%of the population uses water of the population uses water from water supply systemsfrom water supply systems..
The sector is considered a priority one and The sector is considered a priority one and it will receive significant funds from the it will receive significant funds from the EU. EU.
The country has available enough water The country has available enough water resources so that to meet the needs of the resources so that to meet the needs of the population for drinking waterpopulation for drinking water..
In the sector work experienced and In the sector work experienced and competent professionals in the field of water competent professionals in the field of water supply and seweragesupply and sewerage. .

ThreatsThreatsHigh economic loses due to high level of High economic loses due to high level of
water loseswater loses..
Low potential of municipalities and the Low potential of municipalities and the state to invest in infrastructure.state to invest in infrastructure.
Legislation developing slowly and in a Legislation developing slowly and in a complex waycomplex way..
Lack of training and reLack of training and re--training programs training programs designed for the professionals employed in designed for the professionals employed in the sectorthe sector..
Demographic problems related with the Demographic problems related with the reduction of consumptionreduction of consumption..
Restructuring of economy related with the Restructuring of economy related with the
reduction of water consumptionreduction of water consumption..
Ob
stacles to o
vercom
eO
bstacles to
overco
me
Weak sides Weak sides depreciated water supply networksdepreciated water supply networks..
High level of water losesHigh level of water loses–– overover60%.60%.
Low level of collection of the owned Low level of collection of the owned paymentspayments..
Low level of construction of the Low level of construction of the sewerage networkssewerage networks..
Necessity of construction ofNecessity of construction ofaa large large number of number of Waste Water Treatment Waste Water Treatment PlantsPlants..
Necessity of significant investmentsNecessity of significant investments..
Low level of income if the populationLow level of income if the population. .
SWOTSWOT ANALYSISANALYSIS

Thank you for attention