access to higher education: beyond brick and mortar tank access... · access to higher education:...
TRANSCRIPT

Access to Higher Education:
Beyond Brick and Mortar
RESEARCH – STATE OF MUSLIM EDUCATION IN KENYA
Ummah Foundation Think Tank
August, 2012
Page 1 of 91

Table of Contents
Table of Contents...............................................................................................................2
List of Figures.....................................................................................................................6
List of Tables......................................................................................................................7
Abbreviations and Acronyms............................................................................................. 9
Word from the Lead Researcher:......................................................................................12
Executive Summary..........................................................................................................13
1.0 Introduction............................................................................................................... 14
1.1The Research Objectives...................................................................................................................................15
2.0 The Secondary School Review.....................................................................................16
2.1The Established Secondary Schools..................................................................................................................16
2.2The Geographic Distribution of Schools............................................................................................................18
3.0 The Secondary Schools National Examination Performance....................................... 19
3.1The Secondary School Ranking.........................................................................................................................19
3.2The Type of School ...........................................................................................................................................21
3.3The Type of School by Region...........................................................................................................................21
3.4The National Schools’ Performance Index, 2011..............................................................................................22
3.5The National Examination Performance by School Type..................................................................................23
3.6The National Examination Performance by Region..........................................................................................23
4.0 The Secondary Schools Survey Results....................................................................... 24
4.1The Secondary Schools Establishment Status...................................................................................................25
4.1.1The Secondary Schools Ownership Status.................................................................................................25
4.1.2Schools’ Website and Email.......................................................................................................................26
4.1.3Schools’ Operating Objective.....................................................................................................................27
4.1.4The Secondary Schools Registration Status...............................................................................................27
Page 2 of 91

4.1.5The Schools Education System..................................................................................................................28
4.2The Schools’ Governance System and Structure...............................................................................................28
4.2.1Development of Vision and Mission Statements......................................................................................28
4.2.2Number of Board of Governors.................................................................................................................28
4.2.3The Appointment of Board of Governors..................................................................................................29
4.2.4Selection Criteria of Board of Governors...................................................................................................29
4.2.5BoGs Composition and Functionality.........................................................................................................31
4.2.6BoGs Terms of Reference..........................................................................................................................31
4.3Schools Organizational Structure and Management.......................................................................................31
4.3.1Schools’ Management and Administration...............................................................................................32
4.3.2Number of Schools Employees..................................................................................................................33
4.3.3Schools Academic and Non-Academic Employees....................................................................................34
4.4The Schools’ Academic Section.........................................................................................................................35
4.4.1Number of Classes per Stream..................................................................................................................35
4.4.2Number of Student Admissions.................................................................................................................39
4.4.3Average Class Size......................................................................................................................................42
4.4.4Class Utilization .........................................................................................................................................42
4.4.5Number of Teachers Employed: 2007 – 2011...........................................................................................46
4.4.6Teachers’ Resignations..............................................................................................................................47
4.4.7Academic Staff Training.............................................................................................................................47
4.4.8Number and Training Levels of Teachers..................................................................................................48
5.0 The Provision of Religious Facilities ...........................................................................56
6.0 The Schools’ Catering Services................................................................................... 57
6.1Number of Catering Trained Staff.....................................................................................................................58
6.2Meals Provisions to Students............................................................................................................................58
6.3Provision of Balanced Diet................................................................................................................................59
7.0School Accommodation/ Housekeeping Section.......................................................... 60
7.1Number of Staff in Housekeeping Section........................................................................................................60
Page 3 of 91

7.2Students Accommodation Provision.................................................................................................................60
7.3Schools’ Staff Accommodation Provision..........................................................................................................61
8.0Extra Curriculum Activities.......................................................................................... 62
8.1Type of Extra Curriculum Activities Participated..............................................................................................62
8.2Schools Provision of Extra Curriculum Activities...............................................................................................63
8.3Reasons for Non-Provision of Extra Curriculum Activities................................................................................65
9.0 The School Academic Performance............................................................................ 66
9.1Number of Students Registered for National Examination: 2007 – 2011........................................................66
9.2Schools’ National Mean Scores.........................................................................................................................67
9.3Grades Scored by Graduands: 2007 -2011 ......................................................................................................68
9.4Number of Students Admitted to Public Universities.......................................................................................71
10.0The School Financial Sustainability............................................................................ 74
10.1Boarding School Fees......................................................................................................................................74
10.2Day School Fees..............................................................................................................................................75
10.3Other School Charges Levied..........................................................................................................................76
10.4Boarding School Fees Mode of Payment........................................................................................................77
10.5Schools Financial Sustainability......................................................................................................................78
10.6Annual Statutory External Financial Audit......................................................................................................79
11.0Muslim Non-Governmental Organizations.................................................................80
11.1Mapping of Civil Sector Organisations...........................................................................................................80
11.2Survey of the Civil Society Organisations .......................................................................................................82
12.0The Research Conclusions ......................................................................................... 83
12.1Number of Muslim Secondary Schools...........................................................................................................83
12.2The Schools National Examination Performance 2011...................................................................................83
12.3Academic Staff................................................................................................................................................85
12.4School Utilization............................................................................................................................................88
12.5Provision of Religious Facilities.......................................................................................................................88
12.6Provision of Catering Services.........................................................................................................................89
Page 4 of 91
12.7Student Accommodation................................................................................................................................90
12.8Extra Curriculum Activities..............................................................................................................................90
12.9Schools Academic Performance......................................................................................................................91
12.10School Financial Sustainability......................................................................................................................93
13.0Research Recommendations......................................................................................94
13.1School Performance Improvement.................................................................................................................94
13.2Schools’ Communications...............................................................................................................................94
13.3Governance Structures Capacity Building and Strengthening ......................................................................94
13.4Academic Staff Capacity Building and Strengthening ...................................................................................94
13.5Provision of Religious Facilities .....................................................................................................................94
13.6School Capacity Utilization .........................................................................................................................95
13.7School Financial Sustainability........................................................................................................................95
13.8Formation of a Consortium of Members or Restructure the Muslim Education Council............................... 95
13.9Development of a Comprehensive Proposal...................................................................................................96
Page 5 of 91

List of Figures
Figure 1: Geographic Distribution of Schools.................................................................... 18
Figure 2: Type of School ...................................................................................................21
Figure 3: The Type of School by Region.............................................................................22
Figure 4: The National Schools' Performance Index, 2011.................................................22
Figure 5: The National Examination Performance by Type of School ................................23
Figure 6: The National Examination Performance by Region............................................ 24
Figure 7: The Secondary Schools Ownership Status.......................................................... 25
Figure 8: Availability of School Website & Email...............................................................26
Figure 9: Availability of School E-Mail Address................................................................. 27
Figure 10: Head of school management........................................................................... 32
Figure 11: Number of Academic and Non-Academic Staff.................................................34
Figure 12: Number of Classes per Stream......................................................................... 35
Figure 13: Number of Students Admission: 2007 – 2011................................................... 40
Figure 14: Average Class Size........................................................................................... 42
Figure 15 Class Utilization................................................................................................ 43
Figure 16: Number of teachers employed between 2007 and 2011................................... 46
Figure 17: Number of Teacher Resignations: between 2007 and 2011.............................. 47
Figure 18: Number of Trained and Untrained Staff........................................................... 48
Figure 19: Number of Mathematics and Language Teachers............................................ 49
Figure 20: Number of Science Subject Teachers................................................................ 50
Figure 21: Number of Humanities Teachers...................................................................... 52
Figure 22: Number of Teachers Handling IT, Arabic and IRE..............................................53
Figure 23: Qualification of the Catering Staff................................................................... 58
Page 6 of 91

Figure 24: Number of Trained and Untrained Staff in the Catering Department............... 58
Figure 25: Housekeeping and Accommodation Staff ........................................................60
Figure 26: Students Accommodation................................................................................ 61
Figure 27: Accommodation of Teachers and Other Staff...................................................61
Figure 28: Average number of students/ grades/ year..................................................... 70
Figure 29 Boarding school fee between '07 and '11.......................................................... 74
Figure 30: Day School Fee: 2007 – 2011............................................................................76
Figure 31: Ability of the School Fees/Charges to Sustain School Activities.........................78
Figure 32: Annual statutory external audit.......................................................................79
Page 7 of 91

List of Tables
Table 1 List of Secondary Schools and Geographic Location..............................................16
Table 2: School Ranking................................................................................................... 20
Table 3: Secondary Schools Sponsors................................................................................25
Table 4: School Operating Objective.................................................................................27
Table 5: Registration with the MoE and KNEC.................................................................. 27
Table 6: The School Education System.............................................................................. 28
Table 7: School vision/ mission and BoG...........................................................................28
Table 8: Number of Governors..........................................................................................29
Table 9: BoG Selection Criteria......................................................................................... 30
Table 10: Composition of the BoG.................................................................................... 31
Table 11: Other stated heads of school management.......................................................33
Table 12: Number of School Employees ........................................................................... 33
Table 13 Student Capacity per Class in Form 1..................................................................35
Table 14: Student Capacity per Class in Form 2.................................................................36
Table 15: Student Capacity per Class in Form 3.................................................................37
Table 16: Student Capacity per Class in Form 4.................................................................39
Table 17: Actual/Total/ Average number of students/form..............................................41
Table 18: Class utilization.................................................................................................44
Table 19: Academic Staff Training.................................................................................... 48
Table 20: Training Level of Mathematics and Language Teachers.................................... 50
Table 21: Training level for Physics, Chemistry and Biology Teachers............................... 51
Table 22: Proportion of Teaching Staff per Subject........................................................... 51
Table 23: Training Levels of Teachers Handling Humanities..............................................53
Page 8 of 91

Table 24 Training Level of Teachers Handling IT, Arabic & IRE.......................................... 54
Table 25: Summary of Subject/Teacher Qualification....................................................... 55
Table 26: Provision of Masjid and Madrassa.................................................................... 56
Table 27: Number of employees in the catering department............................................ 57
Table 28: Number of Meals Served per Day......................................................................59
Table 29 Provision of a Balanced Diet ..............................................................................59
Table 30: Sitting Capacity of the Dining Hall.....................................................................59
Table 31: Provision, capacity and participation in extra curriculum activities,.................. 62
Table 32: Extra curriculum activities competition participated......................................... 63
Table 33: Schools Extra Curriculum Activities....................................................................64
Table 34: Other Extra Curriculum Activities...................................................................... 65
Table 35: Number of students registering for the KNEC 2007 – 2011.................................67
Table 36 Actual school examination mean scores.............................................................67
Table 37: Grades Scored by Graduands: 2007 – 2008........................................................69
Table 38: Actual number of students admitted to public universities: 2007 – 2011........... 71
Table 39: Period of fee payment.......................................................................................76
Table 40: Other charges levied to the students.................................................................77
Table 41: School Fees Charge period.................................................................................77
Table 42: How the school meets financial obligations...................................................... 78
Page 9 of 91

Abbreviations and Acronyms
KNEC - Kenya National Examination Council
MEC - Muslim Education Council
NGOs - Non-Governmental Organisations
WAMY - World Assembly of Muslim Youth
Page 10 of 91

Brief History of the Ummah Think Tank:
The Ummah Think Tank is an initiative established by Ummah Foundation in the year 2009. It focuses mainly on development matters towards the Kenyan Muslims. The reason behind this initiative was born of the fact that Muslims have for a long time been left behind in matters development and denied their equal rights with other Kenyans. The Muslim Organisations have tried to narrow this gap of inequity by carrying out various activities, projects and programs but this has been done in a disjoined manner with little coordination. They have executed these programs based on their financial capacity or at times merely copying what others are doing. Little efforts were made to bridge the gap between these noble initiatives that had similar goals. This is duplication of work that cannot meet the general objectives of our Ummah. There was dire need for consolidation and team building to prioritize visionary programs that are holistic in nature and can deliver high impact in the whole Ummah.
In January 2009, Ummah Foundation convened a meeting of Muslim professionals to discuss this state of affairs and come up with a more consolidated way of development work among the community partners. The resolution of the meeting was start a “Think Tank- a team of professionals and experts whose task is mainly to generate ideas, analyse them and present them to implementers. The task of implementation was left to was left to Muslim institutions, Ngo’s, agencies, and people who are already in the business of carrying out development programs. The team is to meet regularly to articulate the professionals to develop propositions that can be translated into projects that improve the quality of life. The team identified 6 subjects as areas of major concern:
1- Education 2- Economic affairs 3- Women issues 4- Youth affairs 5- Media, public relations and Civil Rights 6- Religious affairs, family and social issues.
The objectives of the UTT are as follows:
1- Provide platform for Muslim Professionals to contribute ideas towards advancement of the Ummah.
2- Critically review prospective ideas so as to carry forward most viable and feasible projects that will catapult Muslims to desired level of life.
3- Coordinate forums that will bring together Muslim Professionals 4- Establish level of information sharing and referral networks among Muslim
Organisations5- To set examples for Muslim Organisations in areas of project harmonization6- Document successes, challenges, lessons learnt and focus area 7- Determine stakeholders for subsequent implementation of analysed ideas8- Ensure that ideas generated are captured accurately in a complete form and followed
through to ensure traceability and impact assessment9- Increase level of success among projects undertaken by Muslim Organisations
Page 11 of 91

On 19th March 2011, the UTT invited a stakeholders and Muslim Professionals from different fields to a forum at Safari Park hotel to populate ideas. Among the many ideas that were assembled, education was given the first priority and the UTT committed Brother Abdul Hamid Swaleh, an All Bright Scholar with a team of student assistant researchers assembled from the Universities to carry out the research. This document we are presenting here in a form of a book is the result of the efforts that went into survey, analysis and recommendations. We thank Brother Abdul Hamid and his team for the great efforts rendered to make the research project a success. We also thank the Ummah Think Tank team headed by its Chairman Brother Ahmed Yusuf, members and Trustees of Ummah Foundation for their devoted dedication in making sure this research paper is endorsed and meets the accepted standards. As the recommendation goes we would like to make this document owned by various Muslim Institutions and Stakeholders that are closely involved in the daily running of our Muslim Schools. More so it was strongly felt that Muslim Education Council has the onus to take this research paper to an implementation level.
Page 12 of 91

Word from the Lead Researcher:
I take immense pleasure in thanking The Think Tank, Ummah Foundation for having approved and funded this research project of ‘Access to Higher Education: Beyond Brick and Mortar’.
I wish to express my deep sense of gratitude to the support and response received from the various schools and charitable foundations in filling in the institutional survey tools that will complement the secondary information. Also, I would like to appreciate the Kenya National Examination Council (KNEC) for the provision of secondary school performance ranking based on the annual national examination performance index. I also thank and appreciate Ummah Foundation for the financial sponsorship for this research.
Lastly, but in no way least, I would like to appreciate the effort, role and contribution made by the project research assistants towards the achievement of the research project goals and objectives.
Finally, we ask for Allah (SWT) blessings in all endeavours we undertake to be full of sincerity and bring forth the benefits to the community.
Abdulhamid Abdulla Saleh MS.c, M.P.H.
Page 13 of 91

Executive Summary
This paper focuses on secondary schools established by the Muslim community as either community, religious or for-profit educational institutions. Also, the paper focuses on the foundations, trust funds and non-governmental organisations (NGOs) that specifically provides support in the educational sector to the Muslim community either through building educational institutions and or provide sponsorship in terms of scholarship and funding to cater for school and or university fees.
The research conducted initially identified and mapped all secondary schools established by the Muslim community and thereafter reviewed the school national examination performance as per the performance index and ranking provided by the Kenya National Examination Council (KNEC). This led to a total list of all schools established by the community as well as their respective national examination performances. This led to identifying and mapping a total number of 72 schools established by the community.
Secondly, the research focused on identifying and mapping all trust funds, charitable foundations and NGOs that provides support to the educational sector to the Muslim community. This led to identifying and mapping a total number of 30 trust funds, charitable foundations and NGOs established by the community.
The desk research and review of both schools and foundations/NGOs was followed by an institutional survey of both set of institutions.
The secondary school survey successfully covered 26 schools and probed on the following issues: school governance, management and administration; school capacity (infrastructure as well as teaching capacity); school’s national examination performance; and financial management and sustainability.
There were no charitable foundations/NGOs covered during the survey due to lack of cooperation by the foundations/NGOs, lack of contacts among other reasons. The study otherwise intended to probe the following areas: status/type of organization; identify the vision/mission; type of educational support provided etc.
Page 14 of 91

1.0 Introduction
Several secondary and or high schools have been constructed and developed by either local Muslim communities (Serani Harambee Secondary School, Mombasa) or by local non-governmental organisations (NGOs) (Islamic Foundation School, Garissa) or by international Muslim organisations (World Assembly of Muslim Youth (WAMY High School in Nairobi)) or for-profit schools (Alim High School). The primary objective of these various developed schools was to create an environment conducive for learning for the Muslim students as well as create more admission slots for the Muslim community with an objective of getting more Muslim high school graduates. However, despite this development of more secondary school facilities the Muslim community seems not to be succeeding in effectively utilizing these expanded opportunities in secondary school places nor has the community succeeded in posting more students in university admissions either in local universities (public or private) or overseas universities.
On the other hand, a significant number of Muslim Foundations and Trust Funds dedicate their funding towards supporting Muslim students either in secondary/high school or middle level colleges by paying for their school or college fees. Majority of these Muslim Foundations tend to support the needy students based on the choice of schools or colleges the students have already selected and obtain admissions. In most cases the Muslim institutions are not the preference of choice to the Muslim students and the community funding provisions are not used to sustain and develop the community schools further.
Therefore, this research is geared towards assessing the potential of the established secondary and or high schools in Kenya by the Muslim community irrespective of the mode of establishment towards achieving its maximum potential of admitting more students through secondary schools education and thereby posts more qualified students in university admissions and enrollment. Also, the research is geared towards linking the established and developed secondary schools with the Muslim Foundations that expend a huge amount of their funding to support students financially in accessing secondary education.
Page 15 of 91

1.1 The Research Objectives
The research objectives were as follows:
i) Map the secondary/high schools developed by the Muslim community for the purposes of creating awareness to Muslim parents of the availability of these schools as well as the capacity of admission places they offer;
ii) Assess the organisational governance and management structures and academic performances of the mapped secondary/high schools;
iii) Map the Muslim Foundations in the country that provides various assistance to the community at large;
iv) Establish the extent of annual educational scholarships offered and funding amounts by the Muslim Foundations in the country to support students and the respective recipient schools;
v) Review the structures of nationally top ranked secondary/high schools and create a template of lessons learned; and
vi) Review and or survey the facilities in a sample of the national and provincial schools in relation to the religious needs and or requirements of the Muslim student. These basic religious requirements include wearing of the hijab, provision of prayer facilities, provision for Islamic religious teachings and catering of halal meals.
Page 16 of 91

2.0 The Secondary School Review
The secondary school review process was searching for secondary schools lists from various sources including the Kenya School Directory, 2011; internet search; KNEC schools’ performance list etc. The review was undertaken with the objective of establishing the total number of schools currently in existence and providing secondary education schooling.
2.1 The Established Secondary Schools
The exercise of identifying and mapping all secondary schools established by the Muslim community totals 65 and the list below indicates the school name and its regional geographic location.
Table 1 List of Secondary Schools and Geographic Location
No Name of School Province1 ABBA SALAMA ACADEMY CENTRAL2 MARAGUA MUSLIM GIRLS SEC CENTRAL3 STAR SHEIKH ACADEMY CENTRAL4 ABU HUREIRA ACA SEC SCH COAST5 AGA KHAN SEC SCH COAST6 AL MADRASATUS SAIFIYATUL BURHANIYAH SCHOOL COAST7 ARABUKO FOREST HIGH SCHOOL COAST8 BURHANI HIGH SCHOOL COAST9 BURHANIA SECONDARY SCHOOL COAST10 DARUL ULUM SECONDARY SCHOOL COAST11 JAFFERY ACA SEC SCH – MSA COAST12 KIBOKONI HIGH SCHOOL COAST13 LIGHT ACADEMY –MOMBASA COAST14 MALINDI PROGRESSIVE ACA SECONDARY SCHOOL COAST15 MEMON HIGH SCHOOL COAST16 QUBAA SEC SCHOOL COAST17 SHEIK ZAYED SECONDARY SCHOOL COAST18 TAWHEED MUSLIM ACA GIRLS SEC SCH COAST19 THE AGA KHAN ACADEMY MOMBASA SEC COAST20 UMU SALAAM SECONDARY SCHOOL COAST21 STAR SHEIKH ACADEMY SEC EASTERN22 AGA KHAN ACADEMY SEC SCH NAIROBI23 AGA KHAN HIGH SCH. NAIROBI24 AL FURQAN TRAINING INSTITUTE NAIROBI25 AL MADRASA SEC SCH NAIROBI26 DON BOSCO SEC SCHOOL NAIROBI27 JARMAT GIRLS SEC SCHOOL NAIROBI28 KENYA MUSLIM ACADEMY NAIROBI29 KIBRA ACADEMY SEC. SCHOOL NAIROBI
Page 17 of 91

30 LIGHT ACADEMY – NAIROBI NAIROBI31 MAHAD GIRLS ACADEMY PANGANI NAIROBI32 MUNADHAMAT AL DAWA AL ISLAMIA NAIROBI33 MUSLIM ACADEMY PARK ROAD NAIROBI34 NAIROBI JAFFREYS ACADEMY - SEC NAIROBI35 NAIROBI MUSLIM ACADEMY- SEC NAIROBI36 RASUL AL AKRAM SEC SCH NAIROBI37 RASUL AL-AKRAM GIRLS ACADEMY NAIROBI38 SHAURI MOYO MUSLIM SEC SCH NAIROBI39 WAMY HIGH SCHOOL NAIROBI40 DAGAHALEY SECONDARY NORTH EASTERN41 EL-HACHO MIXED SEC SCH NORTH EASTERN42 HAGADERA SECONDARY NORTH EASTERN43 IQRA ACADEMY NORTH EASTERN44 JOWHAR AL ISLAM SEC SCH NORTH EASTERN45 KHADIJA GIRLS SECONDARY NORTH EASTERN46 MANDERA INTERGRATED ACADEMY NORTH EASTERN47 RHAMA MIXED SEC SCH NORTH EASTERN48 THE ALIM HIGH SCHOOL NORTH EASTERN49 THE BRIDGE INTERNATIONAL ACADEMY NORTH EASTERN50 YOUNG MUSLIM HIGH SCHOOL NORTH EASTERN51 MUSLIM SEC SCH NYANZA52 ABRAR SEC RIFT VALLEY53 AL MAKTOUM GIRLS SEC SCHOOL RIFT VALLEY54 HIGHLANDS HIGH SCHOOL RIFT VALLEY55 KERICHO HIGHLANDS ACADEMY RIFT VALLEY56 KILIMANJARO ACADEMY RIFT VALLEY57 KITENGELA MUSLIM GIRLS ACADEMY RIFT VALLEY58 RASUL AL AKRAM SECONDARY RIFT VALLEY59 STAR SHEIKH GIRLS SCH RIFT VALLEY60 BUNGOMA MUSLIM SECONDARY SCHOOL WESTERN61 KAKAMEGA MUSLIM HIGH SCHOOL WESTERN62 MUMIAS BOYS MUSLIM SEC SCHOOL WESTERN63 MUMIAS MUSLIM GIRLS SEC. SCHOOL WESTERN64 MUSLIM GIRLS HIGH SCHOOL65 UMMUL QURA SENIOR SCHOOL
Page 18 of 91

2.2 The Geographic Distribution of Schools
The figure below indicates the geographic of the secondary schools with Coast and Nairobi constituting 26 (17 schools) and 28 (18 schools) percentage points respectively. North Eastern and Rift Valley provinces followed with 17% (11 schools) and 12% (8 schools).
Figure 1: Geographic Distribution of Schools
Page 19 of 91

3.0 The Secondary Schools National Examination Performance
The data and information for the secondary schools national examination performance was accessed through the KNEC officials results documents for all schools and a separate result document for private ones. The objective of this review is to establish the schools’ respective national examination performance as ranked by the KNEC.
The total number of Muslim secondary schools extracted from the Kenya National Examination Council (KNEC) secondary school list included 30 schools out of 706 and 5, 558 private and all secondary schools nationally respectively.
3.1 The Secondary School Ranking
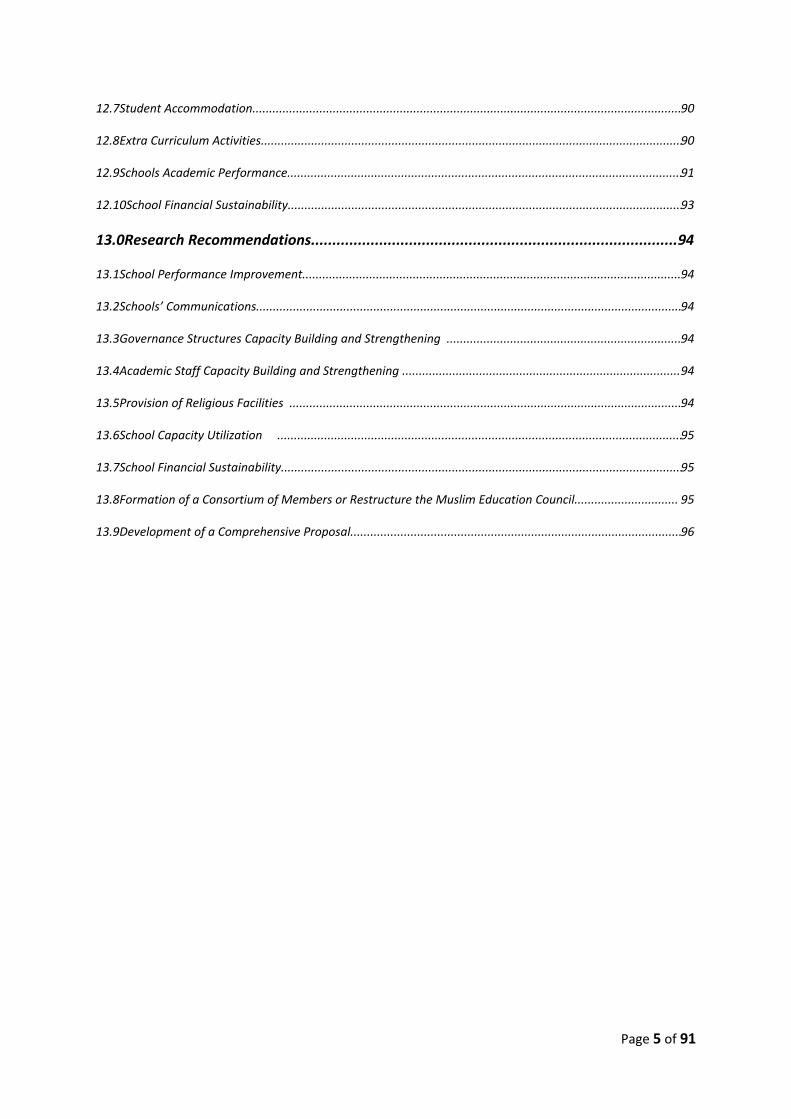
The KNEC ranks schools along the lines of private and a combination of both private and public secondary schools respectively. The table demonstrates the ranking as per private, all (private & public schools) and this project ranking respectively as per the 2011 National Performance Index.
Page 20 of 91
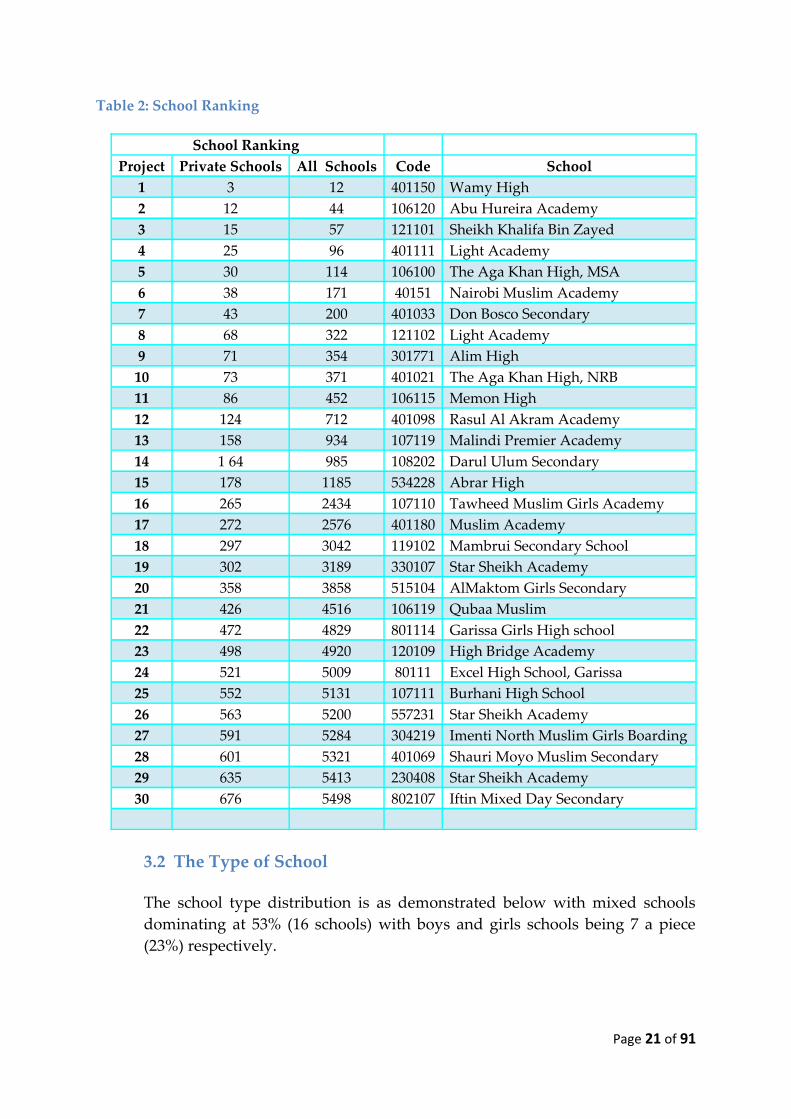
Table 2: School Ranking
School Ranking Project Private Schools All Schools Code School
1 3 12 401150 Wamy High2 12 44 106120 Abu Hureira Academy3 15 57 121101 Sheikh Khalifa Bin Zayed4 25 96 401111 Light Academy5 30 114 106100 The Aga Khan High, MSA6 38 171 40151 Nairobi Muslim Academy7 43 200 401033 Don Bosco Secondary 8 68 322 121102 Light Academy9 71 354 301771 Alim High 10 73 371 401021 The Aga Khan High, NRB11 86 452 106115 Memon High 12 124 712 401098 Rasul Al Akram Academy13 158 934 107119 Malindi Premier Academy14 1 64 985 108202 Darul Ulum Secondary15 178 1185 534228 Abrar High16 265 2434 107110 Tawheed Muslim Girls Academy 17 272 2576 401180 Muslim Academy18 297 3042 119102 Mambrui Secondary School19 302 3189 330107 Star Sheikh Academy20 358 3858 515104 AlMaktom Girls Secondary21 426 4516 106119 Qubaa Muslim 22 472 4829 801114 Garissa Girls High school23 498 4920 120109 High Bridge Academy24 521 5009 80111 Excel High School, Garissa25 552 5131 107111 Burhani High School26 563 5200 557231 Star Sheikh Academy27 591 5284 304219 Imenti North Muslim Girls Boarding28 601 5321 401069 Shauri Moyo Muslim Secondary29 635 5413 230408 Star Sheikh Academy30 676 5498 802107 Iftin Mixed Day Secondary
3.2 The Type of School
The school type distribution is as demonstrated below with mixed schools dominating at 53% (16 schools) with boys and girls schools being 7 a piece (23%) respectively.
Page 21 of 91

Figure 2: Type of School
3.3 The Type of School by Region
The school type by region bar graph depicts Coast and Nairobi regions having the largest number of mixed schools and the rest being generally distribute between boys, girls and mixed school type. Coast and Nairobi regions have recorded the highest number of schools.
Figure 3: The Type of School by Region
Page 22 of 91

3.4 The National Schools’ Performance Index, 2011
The school performance index, 2011 gives the various schools’ performance based on the ranking by the KNEC. The ranking shows close to half of the schools (43%) scored an average of a D-grade, 23% of the schools managed to score a C-grade, 30% scored a B-grade and only 1 school scored an A-grade.
Figure 4: The National Schools' Performance Index, 2011
3.5 The National Examination Performance by School Type
The school types are three as indicated above in section 3.2 and the bar graph below indicates the schools’ grade index attained as per the school type.
Figure 5: The National Examination Performance by Type of School
Page 23 of 91

The bar graph depicts a mixed performance in relation to school type with boy’s only schools in grades A, B and C followed by the mixed schools performing relatively better in Grades B and C and finally the girl’s only schools dominating the D grade.
3.6 The National Examination Performance by Region
The graph below demonstrates the national performance regionally indicating the bulk of good performance (Grades A, B and C) being attained in Coast and Nairobi regions with Grade D being distributed in all the regions.
Figure 6: The National Examination Performance by Region
Page 24 of 91
4.0 The Secondary Schools Survey Results
This section, divided into several subsections according to the study topics, presents the findings and discussion on the secondary school survey. The survey which targeted 49 private Muslim secondary schools in Kenya had a response rate of 53% having managed to successfully survey a total of 26 out of 49 schools. The other 23 schools were either uncooperative, not interested to participate in the survey or did not return the survey tools to the research officers among other reasons. The analysis is done using descriptive statistics and findings presented in form of tables and graphs.
4.1 The Secondary Schools Establishment Status
The survey sought to establish the general outlook of the schools surveyed in several aspects including contact information of the school and its sponsors and the school status.
4.1.1 The Secondary Schools Ownership Status
The schools sponsors or developers are mainly community-based at the rate of 64% and 36% are non-community sponsored.
Figure 7: The Secondary Schools Ownership Status
Page 25 of 91

The various schools’ sponsors are indicated in Table 3 as follows:
Table 3: Secondary Schools Sponsors
The School Sponsor No of Schools %1 Muslim locals 5 26.32 Al Muntazir Charitable Trust 2 10.53 Nairobi Islamic Association (South C) 2 10.54 SUPKEM 2 10.55 Africa Muslim Agency (AMA) 1 5.36 Burhaniya Bohra Education Society 1 5.37 Board of Trustees, Sheikh Khalifa Bin Zayed Al Nahyan 1 5.38 Islamia Madrasa Society 1 5.39 Maahad Daawah Organisation 1 5.3
10 World Assembly of Muslim Youth 1 5.311 Aga Khan Education Service, Kenya 1 5.312 Memon Community 1 5.3
Total 19 100
4.1.2 Schools’ Website and Email
In this context it was important to document the contact information of the schools surveyed where it was established that more than half (56%) of the school surveyed did not have a website (See Figure 8. Only 44% surveyed schools have indicated to be having websites.)
Figure 8: Availability of School Website & Email
On the contrary more schools, i.e. 7 in every 10 schools (73%) admitted to be having school e-mail addresses and 27% of the respondent schools however indicated that the institutions did not have e-mail addresses.
Page 26 of 91

Figure 9: Availability of School E-Mail Address
4.1.3 Schools’ Operating Objective
Nine out of ten (92%) of the surveyed schools are established on the non-profit making basis with their basic motivation being offering educational opportunities to the community. Only 8% of the schools are established for profit-making objective.
Table 4: School Operating Objective
Operating Objective NO %1 Profit Making 2 82 Non Profit making 23 92
Total 25 100
4.1.4 The Secondary Schools Registration Status
A majority of the schools’ are registered by both the Ministry of Education (MoE) and the Kenya National Examination Council (KNEC).
Table 5: Registration with the MoE and KNEC
Registration Status Yes No Total%
1 MoE 95.8 4.2 1002 KNEC 95.7 4.3 100
Page 27 of 91

4.1.5 The Schools Education System
On integration and education system, all the schools surveyed admitted to be offering 8-4-4 education system. One school indicated to be offering both 8-4-4 and IGSCE. Furthermore, 76% of the schools indicated that the education system they offer is integrated while 24% (or a total of 6 schools) indicated otherwise
Table 6: The School Education System
Education System YES NO TOTAL% Schools % Schools
1 Integrated 76 19 24 6 1002 8-4-4 curriculum 100 25 0 0 100
4.2 The Schools’ Governance System and Structure
This section sought to establish the status of governance structures; development of the vision and mission statements; number of board of governors (BoGs); who appoints the school governors; BoGs mode of operations; BoGs selection criteria; current composition of BoGs; period served by current BoGs and number of BoGs meetings per year;
4.2.1 Development of Vision and Mission Statements
First, all the schools surveyed indicated that they have a Vision and Mission statements and only 80% of the schools had a BoG.
Table 7: School vision/ mission and BoG
Page 28 of 91
Status Yes No Total1 Vision & Mission statements 100% 0% 100%2 Board of Governors (BoGs) 80% 20% 100%

4.2.2 Number of Board of Governors
Two in every five schools have between eleven to fifteen-member boards. This is followed by those who have 1 to 5 member board at 28% and 6 to 10 member board at 22%. Those with 16 to 20 member board and 26 to 30 member board were the fewest having a 5% representation each.
Table 8: Number of Governors
Number of Governors %
1 1 - 5 282 6 – 10 223 11 - 15 404 16 - 20 055 26 - 30 05
Total 100
4.2.3 The Appointment of Board of Governors
Majority of the school board of governors are appointed by the schools’ sponsor. 81% of the respondents cited that the school sponsors appoints the board of governors while 19% cited that parents have the major role in appointing the board of governors. The respondents also indicated the following to be responsible for the appointment of the board of governors:
Ministry of Education (3) Provincial Administration (1) Patron founder (2) Principal(1) Board of directors(3) Local Muslim Association representative (1)
4.2.4 Selection Criteria of Board of Governors
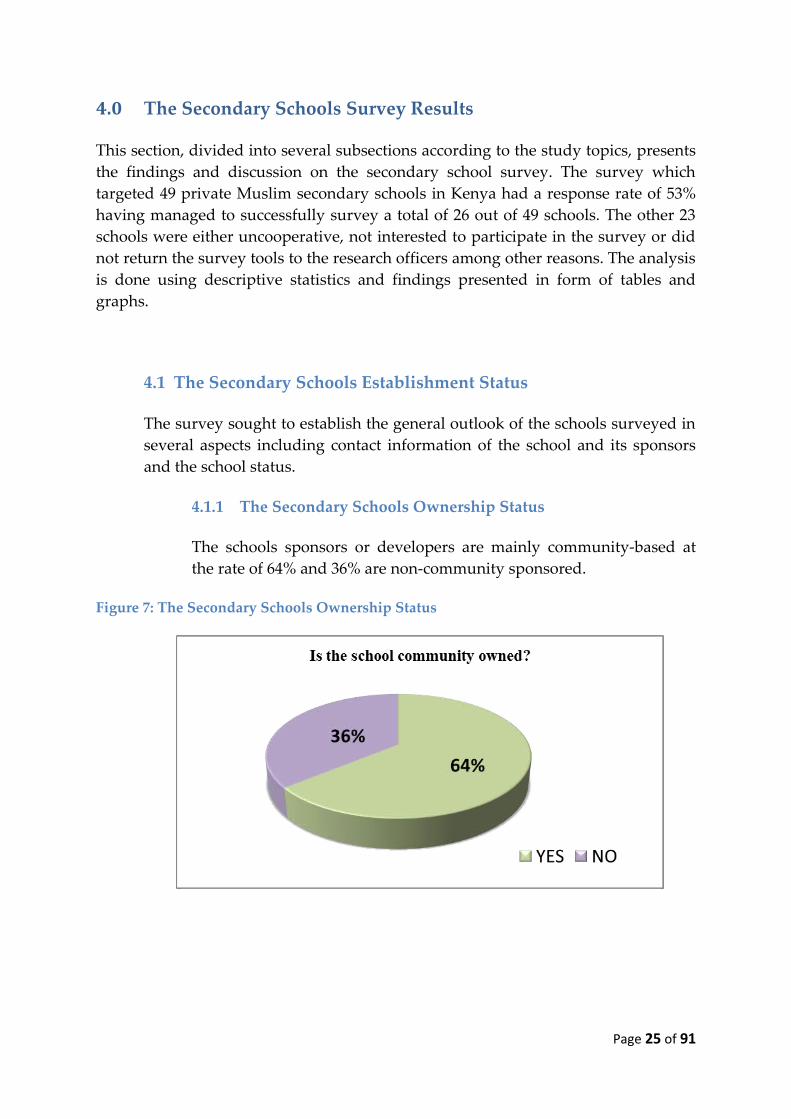
Majority of the schools (74%) have selection criteria of board of governors. The respondents who agreed to be having selection criteria were asked to list the criteria.
Table 9 shows the stated selection criteria whereby a significant majority prefer educationist to be included in the school Board. Others however prefer that the person must be responsible while others prefer selection through nomination.
Page 29 of 91
Table 9: BoG Selection Criteria
Page 30 of 91
Selection Criteria No1. Educationist 42. Responsible Person 33. Through Nomination 34. Accountant/Banker/Financial Specialist 55. Local Community 26. Lawyer 27. Health Officer/ Doctor 28. Administrator 29. Graduate 110. Founding Family 111. Ministry of Education criteria 112. Businessman 113. I.T Specialist 114. Engineer 1

4.2.5 BoGs Composition and Functionality
The study also sought to establish whether the current Board of Governors is based on professional functionalities. Majority of the schools have accountants included in the school board of governors (See Table 10). A significant majority also have health officers, educationists and lawyers. Other compositions as listed by the respondents are as listed in the table below.
Table 10: Composition of the BoG
BoG COMPOSITION No 1. Accountant/ Banker/Financial Specialist 102. Health officer/ Doctor 93. Educationist 74. Lawyer 55. I.T Specialist 46. Administrator/ Corporate Manager 47. Businessman 38. Counselors/ Religious leader 39. Engineer 210.
Social Services/ Sociologist 2
11.
Agriculturalist 2
4.2.6 BoGs Terms of Reference
The survey revealed that 2 in every 5 (39%) schools have terms of reference (ToRs) for their BoG’s. The availability of ToRs for the school governors assists in the process of having a clear agenda for the governors as well as a good tool for the schools’ development. However, 3 in every 5 (61%) have no ToRs for their respective board of governors and this could have an impact in the respective schools development and performance management.
Page 31 of 91

4.3 Schools Organizational Structure and Management
The section covered issues of organisational structure; general management and administration; academic management and capacity.
4.3.1 Schools’ Management and Administration
The survey established that 83% of the schools are managed by Principals or Head Teachers (See Figure 10). 13% are headed by school directors while 4% constituted of other school heads as stated by the respondents (See Table 11).
Figure 10: Head of school management
Table 11: Other stated heads of school management
Page 32 of 91
Description No %1 School in charge 2 252 Deputy Principal 2 253 Head of Departments 2 254 Senior teacher 1 12.55 Board of Directors 1 12.5
Total 8 100

Two schools each indicated that they are headed by the school in charge, deputy principal and head of departments. Other schools are headed by a senior teacher and board of directors.
4.3.2 Number of Schools Employees
The study also sought to establish the total number of employees employed by the school. It was realized that a significant majority of the schools have between 21 to 30 employees. This proportion constituted 36% of the total respondents (See Table 12). 24% of the schools have between 11 to 20 employees while another 12% each have between 1 and 10 and 51 to 60 employees.
Table 12: Number of School Employees
No of Employees No of Schools %1 1 - 10 3 12.02 11 - 20 6 24.03 21 - 30 9 36.04 31 - 40 1 04.05 41 - 50 1 04.06 51 – 60 3 12.07 > 101 2 08.0
Total 25 100
8% of the schools (2 schools) have the capacity to employ 101 employees and more.
4.3.3 Schools Academic and Non-Academic Employees
44% of the schools have between 1 and 10 academic staff while 53.8% of the schools have employed the same number for the non-academic staff. Around 3 in every 10 schools surveyed have between 11 to 20 academic staff employees (28%) and non-academic staff (30.8%). Others are as shown in Figure 11.
Page 33 of 91

Figure 11: Number of Academic and Non-Academic Staff
4.4 The Schools’ Academic Section
The survey covered the following issues with regards to the academic section: number of classes per stream; number of students admitted per year; class sizes; number of teachers employed; teaching staff turnover/retention; trained and untrained teaching staff.
4.4.1 Number of Classes per Stream
Seven in every ten (70%) schools surveyed have either one or two classes in form one and form two. As it can be seen in Figure 12, those with 3 or 4 classes in form one and two constituted of 26% each while form three and four comprised (each ) of 28% of the schools having either three or four classes.
Figure 12: Number of Classes per Stream
Page 34 of 91

However, the schools having one or two classes in form three and four were the majority with 67% for both third and fourth form. The schools that have five or six classes per stream were the fewest as it can be observed in the findings in Figure 12 above.
A cross-tabulation analysis was carried out to establish the estimated class capacity for form 1 to 4. For the Form 1 class, the capacities were as listed in Table 13 with the one school having a form 1 class capacity of 140 with 4 streams.
Table 13 Student Capacity per Class in Form 1
No of Students Number of classes (form1) 1 2 3 4 6 NA
Total
Estimated Capacity/Class (F1) 10 1 120 1 125 1 127 1 130 1 1 235 2 240 1 4 1 1 1 843 1 145 2 250 1 152 1 175 1 1140 1 1NA 1 1 1 3
Total 10 8 3 2 1 2 26
Average 37 37 58 20 40
Footnote: NA – Not Available
One school had the smallest form one class only able to accommodate 10 students per stream. This particular school only has one stream. A significant number of schools have a form 1 class capacity of 40 whereby 4 schools have 2 form 1 streams able to accommodate 40 students each. In total, eight schools have Form one class capacity of 40 students but with varied number of streams (i.e. 1, 2, 3, 4 and 6).
On average those schools with 1 and 2 streams in Form 1 have a class capacity of 37 each while those with 3, 4 and 6 streams in Form 1 have a class capacity of 58, 20 and 40 respectively.
Page 35 of 91

Turning focus on the Form 2 class, the minimum class capacity improved to 18 compared to the previous case in Form 1 which was 10. However there was no school with 6 streams in form 2 as was the case In Form 1.
Table 14: Student Capacity per Class in Form 2
Number of classes (form2) No of Students 1 2 3 4 5 Not
IndicatedTotal
Estimated Capacity/Class (F2) 18 1 120 1 125 1 1 226 1 130 1 1 233 1 135 2 240 1 2 2 542 1 144 1 148 1 149 1 150 2 275 1 1
140 1 1Not Indicated 2 1 3
Total 13 5 2 3 1 2 26
Average 37 37 75 73 42
Footnote: NA – Not Available
The maximum number of recorded streams was 5 whereby the class capacity stood at 42. Majority have a single stream (1) in form 2 with varying capacities as listed in Table 14. presents the findings for the Form 3 class whereby the minimum class capacity once again improved to 20. Majority have 2 stream in form 2 class (See total=11) whereby class capacity varied from one school to another although a significant majority (3) have a form 2 class capacity of 30.
Page 36 of 91

Table 15: Student Capacity per Class in Form 3
Number of classes (form3) none 1 2 3 4 5 N.A
Total
Estimated Capacity/Class (F3) none 1 120 1 125 1 130 3 1 1 535 1 1 1 338 1 140 1 2 1 441 1 143 1 145 2 247 1 175 1 1140 1 1N.A 1 1 1 3
Total 2 11 5 2 3 1 2 26
Average 36 38 75 73 35
Footnote: NA – Not Available
Finally for the form 4 class as shown in below, the minimum class capacity recorded was 10, half of what was recorded for the form 3 and 2 class. However this was recorded from only 1 school of which the school has 3 streams accommodating 10 students each. Majority of the surveyed schools have a single stream in form 4 (See total=10). The class capacities of the form 4 class in these schools varied from one to another although a significant majority has the form 4 class able to accommodate 30 students.
Page 37 of 91

Table 16: Student Capacity per Class in Form 4
Number of classes (form4) none 1 2 3 4 5 not
indctdTotal
Estimated Capacity/Class (F4) None 1 110 1 120 1 1 225 1 130 3 1 1 1 631 1 132 1 134 1 135 1 137 1 138 1 140 1 2 1 444 1 1140 1 1not indicated 1 1 1 3
No of Schools 2 10 6 2 3 1 2 26
Average 33 33 10 73 30
4.4.2 Number of Student Admissions
It is evident from the findings that a significant majority of the schools have been admitting between 1 to 40 forty students between the year 2007 and 2011 with the year 2001 having the highest number of schools (36%) admitting at most 40 students (See Figure 13). A significant number of schools have also been admitting between 81 and 120 students (See green section) with the year 2009 having the largest number of schools having admitted the range of students.
Page 38 of 91

Figure 13: Number of Students Admission: 2007 – 2011
It should be noted from the findings above that more that 10% (but less than 21%) of the schools have had the capacity to admit 201 students and more between the year 2007 and the year 2011.
A keener look into the actual number of students in all the surveyed schools revealed that the number of students tend to generally reduce as one moves from Form 1 to Form 4 (See average in Table 17). Besides, a significant majority of the schools surveyed have class capacity of 40 across Form 1 to Form 4.
Page 39 of 91

Table 17: Actual/Total/ Average number of students/form
Page 40 of 91
FORM 1 TOTAL Average
No. of students 10 20 25 27 30 35 40 43 45 50 52 75 140 592
No. of schools 1 1 1 1 2 2 8 1 2 1 1 1 1 23
Total students 10 20 25 27 60 70 320 43 90 50 52 75 140 982 43
FORM 2
No. of students 18 20 25 26 30 33 35 40 42 44 48 49 50 75 140 675
No. of schools 1 1 2 1 2 1 2 5 1 1 1 1 2 1 1 23
Total students 18 20 50 26 60 33 70 200 42 48 48 49 100 75 140 979 43
FORM 3
No. of students 20 25 30 35 38 40 41 43 45 47 75 140 579
No. of schools 1 1 5 3 1 4 1 1 2 1 1 1 22
Total students 20 25 150 105 38 160 41 43 90 47 75 140 934 42
FORM 4
No. of students 10 20 25 30 31 32 34 35 37 38 40 44 140 516
No. of schools 1 2 1 6 1 1 1 1 1 1 4 1 1 22
Total students 10 40 25 180 1 32 34 35 37 38 160 44 140 776 35

4.4.3 Average Class Size
The number of schools that have indicated having a capacity of between 21 to 40 students per class in form 1, 2 and 3 were fairly the same (i.e. 58%, 54% and 58% respectively). A fairly significant number of schools also indicated that they have classes able to accommodate between 41 and 60 students in form one (23%), form two (27%) and form three (23%). This was not the case for the form 4 classes as shown in whereby only 5% of the schools indicated that the form 4 classes can accommodate between 41 and 60 students per class. However it should be noted that 18% of the schools indicated that the form 4 class have a capacity of 1 to 20 students per stream.
Figure 14: Average Class Size
4.4.4 Class Utilization
The recommended standard class capacity being 40 per class, further analysis was carried out as shown in Table 18 in order to determine how the schools utilize their classes (See column ‘Utilization’). The negative values indicate under-utilization by the shown margins while the positive values shows over-utilization/ excess students’ capacities by the shown margins. A zero indicates perfect utilization i.e. 40 students per class. Five schools have excess students per class while 12 schools have classes that are under-utilized. Only 4 schools recorded maximum utilization of their classes. Other schools however did not give details of the number of students or classes.
Page 41 of 91

Figure 15 Class Utilization
Page 42 of 91

Table 18: Class utilization
School No of Classes No of
StudentsAvg. Class Size Avg. Class Capacity Size
Exp. Tot. Capacity
Utilization
1 Tudor Academy (IQRA) 4 79 20 40 160 -812 Alim High School 7 200 29 40 280 -803 Malindi Progressive Schl. 8 240 30 40 320 -804 Memon High Schl. 16 560 35 40 640 -805 Sheikh Khalifa Bin Zayed 21 775 37 40 840 -656 Kitengela Muslim Girls 3 60 20 40 120 -607 Al Furqan Training Institute 4 120 30 40 160 -408 Rasul Al Akram Boys 4 120 30 40 160 -409 Kibra Academy 4 140 35 40 160 -20
10 The Aga Khan H.S Msa 15 584 39 40 600 -1611 Bungoma Muslim Sec. 6 225 38 40 240 -1512 Makunda Muslim Sec. Schl. 4 148 37 40 160 -1213 Abrar High School 5 200 40 40 200 014 Burhaniya Secondary 8 320 40 40 320 015 Mumias Boys Muslim Sec. schl 16 640 40 40 640 016 Qubaa Muslim Academy 8 320 40 40 320 017 Kenya Muslim Academy 4 170 43 40 160 1018 Maragua Muslim Girls Sec 4 170 43 40 160 1019 Busombi Muslim Mixed 4 183 46 40 160 2320 Muslim Girls’ Sec. Schl 8 366 46 40 320 4621 Nairobi Muslim Academy 12 705 59 40 480 22522 Muslim Academy-Park road - - - 40 - -23 Rasul Al-Akram Girls Academy 4 - - 40 160 -24 Tawheed Girls Sec. Schl. - - - 40 - -25 Ummul Qura Senior Schl 3 - - 40 120 -26 Wamy High Schl 12 - - 40 480 -
Total 184 6235
Page 43 of 91

4.4.5 Number of Teachers Employed: 2007 – 2011
Shifting focus on the teachers, their number and employment, the study established that more than half of the surveyed schools employed utmost ten teachers annually between the year 2007 and the year 2010 (See ). The figure was slightly less than half in the year 2011 but then the number of schools that employed at least 11 (and utmost 20) teachers in the same year were significant with 3 in every 10 schools (30%) surveyed. From the findings in Figure 16 it is evident that through the years (from 2007 to 2011) the number of teachers employed by the schools has been generally and steadily dropping with number of schools employing from 1 teacher to at most 20 teachers annually recording as follows:
2007: 88%, 2008: 89%, 2009: 84%, 2010: 80% 2011: 78%
Figure 16: Number of teachers employed between 2007 and 2011
Page 44 of 91

It should be noted that 5% and 4% of the schools indicated having employed between 61 and 70 teachers in the year 2010 and the year 2011 respectively.
4.4.6 Teachers’ Resignations
Despite majority of schools employing between 1 and 10 teachers annually (as explained in the above findings), the same range also resign annually from majority of the schools as shown in Table 17 below with the year 2009 having the most schools (73%) lose between 1 and 10 teachers. It should be noted that only the year 2011 saw a minimum 21 and 30 teachers resign from 6% of the schools surveyed. However for the years 2007 to the year 2010, a minimum of 1 and a maximum of 20 teachers were recorded to have resigned from the schools surveyed.
Figure 17: Number of Teacher Resignations: between 2007 and 2011
4.4.7 Academic Staff Training
7 in every 10 schools surveyed indicated that their teaching staff are all trained (See Table 19). The rest of the respondents (31%) however admitted that not all the teaching staff is trained.
Page 45 of 91

Table 19: Academic Staff Training
Academic Staff %1 Trained 692 Untrained 31
Total 100
Asked to state the number of trained and untrained staff, a total of 67% of the schools (See untrained staff-red and green bar in Figure 18) indicated that they have a maximum of 10 untrained staff but a minimum of 1. Nine percent of the respondents however indicated that they have between 46 and 50 trained staff while another 9% indicated that they have between 36 and 40 trained staff. A total of 11% of the schools also indicated that between 16 and 20 employees in their schools are untrained.
Figure 18: Number of Trained and Untrained Staff
4.4.8 Number and Training Levels of Teachers
The survey also covered the number and training levels of the school’s employed academic staff in the following subjects: Mathematics and language; sciences; humanities; information and technology; Arabic and Islamic Religious Education (I.R.E).
a) Mathematics, English and Kiswahili Teachers
Sixty and sixty five percentage of the schools have either 1 or 2 English and Kiswahili teachers respectively (See Figure 19). One in every five (20%)
Page 46 of 91

schools surveyed indicated that they have either 3 or 4 English teachers while only 9% of the schools have either 3 or 4 Kiswahili teachers. Only 4% of the schools have either 9 or 10 Kiswahili teachers while another 5% of the schools indicated that they have either 9 or 10 mathematics teachers.
It should be noted that the number of schools that have between 1 to 4 mathematics teachers were much fewer than those that teach Kiswahili and English subjects. The following is a structured breakdown of the total number of schools surveyed that have between 1 and 4 (between 1 and 2 and between 3 and 4) teachers:
1) English (80%)2) Kiswahili (94%)3) Mathematics (68%)
Figure 19: Number of Mathematics and Language Teachers
b) Training Level for Mathematics, English and Kiswahili Teachers
On the training level of Mathematics and language teachers it was noted that all the schools surveyed have a total of 48 mathematics teachers holding university degree, 6 holding diploma and 5 holding Masters (See Table 20). This respectively constituted of 81%, 10% and 8% of the total number of mathematics teachers. English language had the largest proportion (92%) of teachers holding bachelor’s degree although their count (36) was 12 teachers less than the mathematics teachers holding Bachelor’s Degree.
Page 47 of 91

Table 20: Training Level of Mathematics and Language Teachers
Number of TeachersQualification Mathematics Kiswahili English
Diploma 6 2 -Degree 48 38 36Masters 5 2 3TOTAL 59 42 39
The proportion of Kiswahili teachers holding University degree certificates was 90% against 5% of their counterparts holding Diploma and Masters each. It should be noted that there was no school that recorded an English teacher holding a Diploma certificate.
c) Physics, Chemistry and Biology Teachers
Shifting focus to the science (Physics, Chemistry and Biology) subject teachers, their average numbers in the schools and their training levels, it was noted that majority of schools have either 1 or 2 teachers handling each of the subjects with Physics and Biology having the highest (65% each) number of schools agreeing to this (See Figure 20).
Figure 20: Number of Science Subject Teachers
However Chemistry was the only subjects where the school (s) indicated that they have either 7 or 8 teachers handling it. A significant percentage of schools also indicated that they have either 3 or 4 teachers handling Chemistry (21%) and Biology (20%).
Page 48 of 91

d) Training Level for Physics, Chemistry and Biology Teachers
On the training level of the science teachers, just like in the previous case it was realized that majority of the teachers in the surveyed schools hold University Degrees (See Table 21). Biology has the highest proportion of teachers holding Degree with a 92% against 5% and 3% Diploma and masters holders respectively.
Table 21: Training level for Physics, Chemistry and Biology Teachers
Qualification Number of TeachersBiology Chemistry Physics Total
Diploma 2 5 4 11Degree 35 32 25 92Masters 1 3 4 8Total 38 40 33 111
Although the proportion of the Physics teachers holding degrees (76%) against those holding masters (12%) and diploma (12%) was lower than the proportion realized for their Chemistry and biology counterparts, it is clear that Physics has the highest number and proportion of teachers holding masters (12% and 4 in number).
Generally the total number of all Science teachers is much lower that of the language and mathematics teachers which stood at
).
Table 22: Proportion of Teaching Staff per Subject
Page 49 of 91
Subject No. of Teachers %1 Mathematics 59 23.52 English 39 15.53 Kiswahili 42 16.74 Physics 33 13.15 Chemistry 40 15.96 Biology 38 15.1
Total 251 100

e) Humanities’ Teachers
For the teachers handling humanity subjects (C.R.E, Home Science, Business education, Agriculture, History and Geography), the case was no different as it was established as shown in Figure 21 that majority of schools have either 1 or 2 teachers handling the listed Humanity subjects. A few schools are having between 3 and 4 teachers handling Business Education (11%), history (16%) and Geography (11%). In fact for Geography, 6% of the schools indicated that they have between 5 and 6 teachers.
Figure 21: Number of Humanities Teachers
Home Science and Christian Religious Education have less than 10 teachers each (See ‘TOTALS’ in Table 23). However this can be attributed to the fact that not all schools indicated to be offering the two subjects. It is also interesting to note that the total number of the listed 7 Humanity subject-teachers, combined ( is still less that the total number of teachers handling Mathematics and the two languages (140) and just 12 teachers more than those handling the 3 Science subjects (111).
f) Training Level of Humanities Teachers
History had the highest number of teachers (32) holding University degree followed by Geography (27) then Business education (17). Generally majority of the teachers hold University degrees. The proportion of history teachers holding University Degree against other education levels was the highest (94%) followed by Home Science (89%) the C.R.E at 88%. Agriculture was the only subject that had a teacher holding Certificate
Page 50 of 91

while Business education and Geography were the only subjects having a proportion of their teachers holding Masters. It is also worth noting that 3 in every 10 Business education teachers hold Diplomas (which is fairly significant).
Table 23: Training Levels of Teachers Handling Humanities
Number of Teachers
Geography History Agriculture Business Education
Home Science C.R.E Total
O-level 1 1 - - - 1 2Certificate - - 1 - - 0Diploma 4 1 2 8 1 - 16Degree 27 32 9 17 8 7 100Masters 1 - - 2 - - 3
Total 33 34 12 27 9 8 121
g) Computer, Arabic and Islamic Religious Teachers
Computer studies, Arabic and Islamic Religious Studies (I.R.E) were also looked at separately and the following (See Figure 22, Table 24 and Figure23) were the findings. Majority of the schools indicated that they have either 1 or 2 teachers handling each of the three subjects (See Figure 22). There was no school that indicated having more than 2 computer studies teachers. 6% of the schools however have 5 to 6 teachers handling Arabic studies. Also 13% of the schools stated that they have 3 to 4 teachers handling Arabic while 21% of the schools also stated that they have 3 to 4 teachers handling I.R.E.
Figure 22: Number of Teachers Handling IT, Arabic and IRE
Page 51 of 91

Majority of the teachers handling these three subjects also hold University degrees with a few holding Diploma.
Table 24 Training Level of Teachers Handling IT, Arabic & IRE
Number of Teachers Computer Studies Arabic I.R.EO-level - - 1Diploma 4 9 -Degree 12 18 7Masters - 2 -Total 16 29 8
Arabic had the highest number of Degree holders (18) while Computer studies had the highest proportion of teachers (75%) holding University Degrees. A general summary of the above findings are as shown in the table below.
Page 52 of 91

Table 25: Summary of Subject/Teacher Qualification
Subject O-level Certificate Diploma Degree Masters Total1. Mathematics 6 48 5 592. Kiswahili 2 38 2 423. English 36 3 394. Biology 2 35 1 385. Chemistry 5 32 3 406. Physics 4 25 4 337. Geography 1 4 27 1 338. History 1 1 32 349. Agriculture 1 2 9 1210. Business Education 8 17 2 2711. Home Science 1 8 912. C.R.E 1 7 813. Computer Studies 4 12 1614. Arabic 9 18 2 2915. I.R.E 1 7 8
Total 4 1 48 351 23 427% Total 0.94% 0.23% 11.24% 82.20% 5.39% 100%
Page 53 of 91

5.0 The Provision of Religious Facilities
The study also sought to establish whether the surveyed schools provide religious facilities such as a masjid (mosque) and madrassa (Islamic Religious Studies) facilities for the students. Almost all the schools (96%) surveyed agreed to be providing the students with a Masjid and or a prayer room while 62% of the schools agreed to be providing Madrassa facilities other than IRE classes with teachers to cater for religious education.
Table 26: Provision of Masjid and Madrassa
*Madrassa – provision of religious teaching over and above IRE classes **Figures in parentheses are percentages
Page 54 of 91
Response Facilities ProvisionMasjid/Prayer
RoomMadrassa*
1 Yes 25 (96)** 162 No 1 (4) 10
Total 26 (100) 26

6.0 The Schools’ Catering Services
This section presents the status of the catering section/department of the schools surveyed. These includes the number of staff, their qualifications, school menu and the number of meals served to the students and the school dining hall capacity.
It was established that 1 in every 4 schools (25%) have between one and ten employees charged with the catering department in the school (See Table 27). Majority of the schools (65%) however indicated that they have a have a minimum of 11 or a maximum of 20 employees based in the catering section. It was quite unlikely to find a school with a minimum of 21 employees or a maximum of 30 employees as only 1 in every 10 schools (10%) indicated that.
Table 27: Number of employees in the catering department
Number of Employees No. of Schools %
1 1 – 10 4 252 11 - 20 11 653 21 - 30 2 10
Total 17 100
6.0 Catering Staff Training
74% of the schools indicated that the catering employees are qualified to undertake their responsibilities (See Figure 23 below). However 26% admit that the catering staff employed does not have the necessary qualifications needed for them to effectively undertake their catering responsibilities.
Figure 23: Qualification of the Catering Staff
Page 55 of 91

6.1 Number of Catering Trained Staff
Out of the schools that admitted having qualified staff, 57% of the schools have between 11 and 20 trained staff. This formed the majority in this category. However 3 in every 10 schools have between 1 and 10 trained staff.
Figure 24: Number of Trained and Untrained Staff in the Catering Department
For the untrained staff, 78% of the schools admitted having between 11 to 20 untrained staff while 11% (each) noted that they have between 1 to 10 and between 21 to 30 untrained staff in the catering section.
6.2 Meals Provisions to Students
It was also in the interest of the research to establish how many meals are served to the students per day whereby it was established that a significant majority (44%) of the schools serve three meals each day while 39% serve more than three meals per day.
Table 28: Number of Meals Served per Day
Meals/ Day No. of Schools %1 1 2 112 2 1 63 3 8 444 >3 7 39
Total 18 100
However, a significant 11% of the schools surveyed offered only one meal a day and 6% providing 2 meals a day.
Page 56 of 91

6.3 Provision of Balanced Diet
It was also in the interest of the research to establish how many meals are served to the students per day whereby it was established that a significant majority (44%) of the schools serve three meals each day while 39% serve more than three meals per day.
Table 29 Provision of a Balanced Diet
Diet No of School (%)
1 Balanced 16 (84)2 Not Balanced 3 (16)
19 (100)
These meals are considered well balanced nutritionally by 84% of the schools (See Table 29).The rest of the schools (16%) admitted that the meals they serve to the students are not balanced.
Further, 4 in every 5 schools (80%) have a dining hall while 1 in every 5 schools (20%) surveyed do not. For the schools that have a dining hall, a significant majority indicated that the halls are capable of holding 201 students and more (See Table 30). Other findings on the dining hall capacities of the schools are as shown below.
Table 30: Sitting Capacity of the Dining Hall
Student Dining Hall Sitting CapacityStudent Range No of Schools %
1 1 - 20 1 72 21 - 40 1 73 41 - 60 1 74 101 - 120 1 7 5 161 - 180 1 76 181 - 200 4 277 > 201 6 40
TOTAL 15 100
Page 57 of 91

7.0 School Accommodation/ Housekeeping Section
This involved investigation into the number of staff charged with the overseeing of smooth running in the accommodation of the students, the type of accommodation and also the teachers’ accommodation.
7.1 Number of Staff in Housekeeping Section
Majority of the schools (87%) entrust a maximum of 20 and a minimum of 11 staff to oversee accommodation matters in the school (See Figure 25).There was no school which with more than 20 employees allocated in the accommodation section. 13% of the schools have at most 10 employees responsible for the housekeeping and accommodation matters in the school.
Figure 25: Housekeeping and Accommodation Staff
7.2 Students Accommodation Provision
Majority of schools (83%) prefer and provide their students with open dormitories while the rest (17%) provide cubicles for the students’ accommodation.
Figure 26: Students Accommodation
Page 58 of 91

7.3 Schools’ Staff Accommodation Provision
In the same note, More than half (55%) of the schools accommodate their teachers and staff within the school (See Figure 27).
Figure 27: Accommodation of Teachers and Other Staff
Page 59 of 91

8.0 Extra Curriculum Activities
Extra curriculum activities are an important factor in the school curriculum and consequently a contributing factor to the general performance of the students. The survey therefore sought to establish the schools position and ways of ensuring that the students are provided with the opportunity to participate in the extra curriculum activities.
From (item no. 1) it can be seen that all the respondents agreed that the students are provided with extra curriculum activities. Half of the respondents (50%) have enough capacity to cater for the development of extra curriculum activities (See item no.2). This included facilities such as land and games equipment among other facilities. The other half noted that they lack adequate capacity to cater for these facilities.
Table 31: Provision, capacity and participation in extra curriculum activities,
YES NONo % No % Tot
1 Does the school provide for extra curriculum activities? 25 100 0 0 100 (25)
2 Does the school have enough capacity (e.g. land etc) to cater for development of extra curriculum activities facilities?
12 50 12 50 100 (24)
3 Has the school been participating in extra curriculum activities competitions?
23 92 2 8 100 (25)
It is encouraging to note that almost all the schools (92%) surveyed involve their students in the extra curriculum competitions in the various levels (See item no. 3).
8.1 Type of Extra Curriculum Activities Participated
The schools were then asked to state the competitions the school had participated, majority of the schools (21 schools) noted that they participate in football/soccer games while a significant number (10 schools) also citing National, Provincial, and District tournaments (See Table 32).
Page 60 of 91

Table 32: Extra curriculum activities competition participated
Participation in Extra Curriculum Competition No of Schools1. Football/ Soccer 212. National/ Provincial/ District tournaments 103. Drama 74. Scouting/ Girl guide 45. Basketball 36. Science Congress 37. Volleyball 38. Handball 29. Choir/ Qaswida 210. Netball 211. Debating 212. Inter-house competition 1
Drama festivals and scouting/ Girl Guide were also cited by some schools as extra curriculum activities participated.
However, at the school level, students are allowed and enabled (through provision of facilities) to participate in the following extra curriculum activities (See Table 33).
8.2 Schools Provision of Extra Curriculum Activities
Just as the majority of schools compete in various levels in football/ soccer games as earlier seen so do majority of schools provide opportunities for their students to participate in football at the school level (See Table 33). A significant number of schools also provide opportunities (and facilities) for participation in religious societies, netball and choir/qaswida.
Table 33: Schools Extra Curriculum Activities
Extra Curriculum Activity No of Schools 1. Football 212. Religious society 183. Netball 144. Choir Group 135. Basketball 126. Debating Society 87. Swimming 4
Other extra curriculum activities provided by the schools (other than the ones that were listed in the questionnaire) as noted by the respondents were as listed in Table 34 below.
Page 61 of 91

Table 34: Other Extra Curriculum Activities
Other Extra Curriculum School Activities No. of Schools1. Farming 72. Tree nursery/ Environmental programmes 33. Gym 34. Athletics 35. Scouting/ Girl guide 36. Science club 37. Volleyball 28. Journalism 29. Rounders 110. Aerobics 111. Peer Counseling 112. Youth for youth 113. Handball 114. Karate 115. Red cross 116. History Club 117. Table tennis 118. Rugby 1
8.3 Reasons for Non-Provision of Extra Curriculum Activities
Other schools do not however allow their students to participate in the various extra curriculum activities competitions. These particular schools noted the following reasons for doing so:
1. Lack of finances (7)
2. Inadequate infrastructure (1)
3. Lack of land (1)
Page 62 of 91

9.0 The School Academic Performance
The school survey also covered the school’s academic performance in terms of number of Form 4 students each school registered for the national examinations; the grades the students attained; the school’s national mean score and the number of students admitted to public universities.
9.1 Number of Students Registered for National Examination: 2007 – 2011
The number of students registering for the Kenya National examination between the year 2007 and 2011 was also analyzed and the findings are as shown in Table 35 below. Out of the 24 schools that indicated the number of students they register for national examination, only 3 have the capacity to register more than 100 students. The rest registers less than 90 students for the national examination.
Table 35: Number of students registering for the KNEC 2007 – 2011
School No. of Students Registered for Exams2007 2008 2009 2010 2011 Total Average
1. Sheikh Khalifa Bin Zayed (1985) 200 268 200 200 240 1108 2222. The Aga Khan H.S Msa 117 133 137 134 143 664 1333. Mumias Boys Muslim Sec. Schl (1965) 99 104 109 114 143 569 1144. Memon High School (1982) 71 67 79 98 117 432 865. Muslim Girls Sec. Schl-Mumias (2002) 96 76 82 62 83 399 806. Bungoma Muslim Sec . Schl (2004) - - - 58 67 125 63*7. Qubaa Muslim School (1996) 44 80 50 66 53 293 598. Malindi Progressive School (2004) 50 59 69 47 53 278 569. Wamy High School 35 39 50 82 54 260 5210. Burhaniya Sec. Schl. - - 44 47 48 139 46*11. Kibra Academy (2003) 48 34 45 42 47 216 4312. Nairobi Muslim Academy (1995) 32 45 34 47 50 208 4213. Tudor Academy-IQRA (2010) - - - 40 33 73 37*14. Kenya Muslim Academy (1993) - - - - 36 36 36*15. Rasul Al Akram Boys (2004) 30 30 30 40 45 175 3516. Makunda Muslim Sec. Schl (1998) 40 40 33 23 29 165 3317. Maragua Muslim Girls Academy (1993) 33 37 35 32 24 161 3218. Abrar High School 29 30 35 30 28 152 3019. Busombi Muslim Mixed Sec. Schl (1995) 24 28 27 27 31 137 2720. Tawheed Girls Sec. Schl (1998) 23 24 18 26 - 91 23*21. Rasul Al Akram Girls’ Academy (2008) - - - - 20 20 20*22. Alim High School (2009) - - - - 20 20 20*23. Kitengela Muslim Girls High (2011) - - - - 10 10 10*24. Al Furqan Training Institute 4 4 6 10 5 29 625. Ummul Qura Senior School (2011) - - - - - -26. Muslim Academy –Park Road (1937) - - - - - -
Total 975 1098 1038 1225 1379 5760 1152
Page 63 of 91

9.2 Schools’ National Mean Scores
Looking at the annual mean scores by the respective schools it can be realized that there exists a very wide gap between the first three best performing schools and the rest of the schools (See ‘Average’ column in Table 36).
Table 36 Actual school examination mean scores
KNEC School National Mean ScoresSchool 2007 2008 2009 2010 2011 Average
1. Sheikh Khalifa Bin Zayed 9.83 9.16 9.17 10.32 9.55 9.6062. The Aga Khan H.S Msa 9.52 8.3 8.42 8.7 9.02 8.7923. Alim High School - - - - 7.71 7.710*4. Maragua Muslim Girls Sec 4.7 4.9 5.4 5.9 5.6 5.3005. Tawheed Girls Sec. Schl. 6.00 4.00 4.2 4.6 4.78 4.7166. Kenya Muslim Academy 4.2 4.7 5.1 4.6 4.9 4.7007. Muslim Girls’ Sec. Schl 3.875 4.197 4.707 4.45 4.73 4.3928. Busombi Muslim Mixed 2.350 3.857 4.742 4.852 5.342 4.2299. Makunda Muslim Sec. Schl. 3.4 3.3 3.4 4.8 4.3 3.84010. Bungoma Muslim Sec. 2.95 3.73 3.76 3.86 4.32 3.72411. Kibra Academy 4.87 3.769 3.476 3.586 2.66 3.67212. Qubaa Muslim Academy 5.71 3.13 2.91 3.22 3.33 3.66013. Mumias Boys Muslim Sec.
schl- - - - -
14. Malindi Progressive Schl. - - - - -15. Nairobi Muslim Academy C+ B- B- B- B16. Kitengela Muslim Girls - - - - -17. Memon High Schl. - - - - -18. Muslim Academy-Park road - - - - -19. Rasul Al-Akram Girls
Academy- - - - -
20. Tudor Academy (IQRA) - - - - -21. Ummul Qura Senior Schl - - - - -22. Burhaniya Secondary - - - - -23. Abrar High School - - - - -24. Al Furqan Training Institute - - - - -25. Rasul Al Akram Boys B- C C C C+
AVERAGE 5.219 4.822 5.026 5.353 5.520
Page 64 of 91

9.3 Grades Scored by Graduands: 2007 -2011
The table below presents the number of students who have been scoring the various grades between the year 2007 and the year 20011. To get a better picture especially on the trends on the grades scored through the five years, (see the figure below Table 37)
Page 65 of 91

Table 37: Grades Scored by Graduands: 2007 – 2008
Grades Scored
2007 2008 2009 2010 2011School A B C D A B C D A B C D A B C D A B C D
1. Abrar High School - - - - - - - - - 3 13 20 - 5 11 14 - 8 9 102. Al Furqan Training Institute - - - - - - - - - - - - - - - - - - 1 43. Alim High School - - - - - - - - - - - - - - - - - 9 11 -4. Bungoma Muslim Sec. - - - - - - - - - - - - - - - - - 3 - -5. Burhaniya Secondary - - - - - - - - - - 5 18 - - 3 22 - - 4 206. Busombi Muslim Mixed - - - 17 - - 7 21 - 4 10 13 - 2 13 12 - 7 10 147. Kenya Muslim Academy - 6 15 18 - 4 13 17 - 1 32 6 - 3 12 18 - 2 11 158. Kibra Academy - 5 20 23 - 1 10 23 - 1 6 36 - 1 7 32 - - 1 449. Kitengela Muslim Girls - - - - - - - - - - - - - - - - - - - -10. Makunda Muslim Sec. Schl. - 1 5 33 - 2 5 32 - 1 5 26 - - 14 9 - 2 8 1911. Malindi Progressive Schl. - - - - - - - - - - - - - - - - - - - -12. Maragua Muslim Girls Sec 1 4 10 7 - 4 15 12 - 5 12 10 - 3 11 15 - 2 10 1313. Memon High Schl. 4 28 36 3 3 19 36 7 1 20 49 8 8 29 53 8 10 40 60 -14. Mumias Boys Muslim Sec. schl - - - - - - - - - - - - - - - - - - - -15. Muslim Academy-Park road - - - - - - - - - - - - - - - - - - - -16. Muslim Girls’ Sec. Schl - 1 20 75 - - 25 51 - 2 44 36 - - 27 35 - 4 44 3517. Nairobi Muslim Academy - 18 13 - - 25 20 - - 13 21 - 1 28 18 - 5 32 13 -18. Qubaa Muslim Academy - 7 20 14 - 1 13 59 - - 7 38 - - 9 55 - 2 3 3919. Rasul Al Akram Boys - 28 16 - - 9 43 4 1 10 31 20 - 5 16 3 3 12 21 920. Rasul Al-Akram Girls Academy - - - - - - - - - - - - - - - - - 2 15 321. Sheikh Khalifa Bin Zayed 46 72 7 - 45 102 30 - 41 58 30 - 71 68 1 - 53 105 19 -22. Tawheed Girls Sec. Schl. - 2 5 4 - - 2 - - 2 2 3 - 3 3 6 - - - -23. The Aga Khan H.S Msa 39 93 11 - 13 64 55 - 12 70 55 - 23 77 33 - 27 59 31 -24. Tudor Academy (IQRA) - - - - - - - - - - - - - - 15 25 - - 10 2025. Ummul Qura Senior Schl - - - - - - - - - - - - - - - - - - - -26. Wamy High Schl 19 13 - - 12 6 - - 2 17 1 - 4 9 16 - 6 10 - -
Total 109 278 178 194 73 237 274 226 57 207 323 234 107 233 262 254 104 299 281 245
Page 66 of 91

It can be noted in the in the findings in the figure that the number of students scoring grade A has been generally low through the years 2007 to 2011. The number declined between 2007 and 2009 but rose steadily from the year 2009 to 2011. Those scoring grade B also had similar trend whereby there was a drop in the number between the year 2007 and 2009 but rose steadily from 2009 to 2011. The average number of students scoring grade B however has been high compared to the ones scoring grade A.
The trend for the students scoring grade C however was different from the rest (See green line) since the average number of students rose steadily between the year 2007 and 2009, dropped in 2010 but rose slightly in the year 2011. Further, the average number of students in grade C was the highest compared to all the other grades.
The students scoring grade D has been steadily rising between the year 2007 and 2010 but slightly fell in the year 2011.
Figure 28: Average number of students/ grades/ year
9.4 Number of Students Admitted to Public Universities
Out of the 25 schools successfully surveyed, only 15 have had their students admitted into the public universities.
Page 67 of 91

Table 38: Actual number of students admitted to public universities: 2007 – 2011
Number of Admissions in Public UniversitiesSchool 2007 2008 2009 2010 2011 Total Average Avg. Registered
Student %
1. Sheikh Khalifa Bin Zayed 53 95 67 140 - 355 89* 222 402. Nairobi Muslim Academy - 38 23 40 - 101 34* 133 253. Alim High School - - - - 16 16 16* 114 144. Kenya Muslim Academy 11 10 12 9 7 49 10 86 125. Maragua Muslim Girls Sec 9 10 8 6 7 40 8 80 106. Mumias Boys Muslim Sec. schl 7 6 7 11 10 41 8 63* 137. Abrar High School 4 5 5 6 9 29 6 59 108. Malindi Progressive Schl. 5 3 3 7 9 27 5 56 99. Busombi Muslim Mixed - - - - 3 3 3* 52 610. Tawheed Girls Sec. Schl. - - 2 3 - 5 3* 46* 711. Qubaa Muslim Academy 3 3 3 2 2 13 3 43 712. Kibra Academy - 1 1 1 5 8 2 42 513. Burhaniya Secondary - - - 2 - 2 2* 37* 514. Muslim Girls’ Sec. Schl 1 - - - - 1 1* 36* 315. Makunda Muslim Sec. Schl. 1 - - - - 1 1* 35 316. Rasul Al Akram Boys - - - - - - - 3317. Bungoma Muslim Sec. - - - - - - - 3218. Kitengela Muslim Girls - - - - - - - 3019. Memon High Schl. - - - - - - - 2720. Muslim Academy-Park road - - - - - - - 23*21. Rasul Al-Akram Girls Academy - - - - - - - 20*22. Tudor Academy (IQRA) - - - - - - - 20*23. Ummul Qura Senior Schl - - - - - - - 10*24. The Aga Khan H.S Msa - - - - - - -25. Al Furqan Training Institute - - - - - - -
TOTAL 94 171 131 227 68
Page 68 of 91

The rest have either had none or did not indicate the number of students they have admitted into the public universities (See Table 38). Sheikh Khalifa Bin Zayed Secondary schools leads with the number of students admitted into the public universities between the year 2007 and 2010. Through the four years they indicated, they have been managing 89 students into the public universities annually. Nairobi Muslim Academy followed a distant second with an average of 34 students annually although this was just for the year 2008 to 2010 (3 years). Although Alim high school recorded only the number of students admitted into the universities for a single year, the school came third with an average of 16 students in a single year. Other schools that managed to admit 10 (and below) students into the public universities are as shown in the table.
The proportion of students joining the public universities against the number registering for the Kenya national Examination in the various schools are as shown above. The best performing school manages (on average) to send 2 in every 5 of its students (40%) to the public universities. The second best school sends 1 in every 4 (25%) students registered for the Kenya national Examination to the public universities. The rest of the schools either sends a number lower than these first two or do not manage at all to send any student to the public university.
Page 69 of 91

10.0 The School Financial Sustainability
This section presents an analysis and findings on the schools financial sustainability as indicated by the schools’ survey respondents.
10.1Boarding School Fees
This section presents an analysis and findings on the schools financial sustainability as indicated by the respondents.
A significant majority of private Muslim schools have been charging a boarding school fee of between Ksh. 20,000 and Ksh. 30, 000 between the year 2009 and 2011 (Figure 29).
Figure 29 Boarding school fee between '07 and '11
For the years 2008 and 2009 a significant majority were charging between Ksh. 30, 001 and Ksh. 40, 000 and between Ksh. 40, 001 and Ksh. 50, 000 respectively. One in every 10 schools (10%) was charging Ksh. 10, 000 boarding school fees in the year 2007. However, less than 10% of the schools surveyed have been charging the same amount from the year 2008 down to the year 2011.
There was no school charging between Ksh. 90,000 and Ksh. 100,000 boarding fees in the years 2007 and 2008 but then in the year 2009, 2010 and 2011 the percentage of schools that charged the amount was 8%, 15% and 8% respectively.
Page 70 of 91

The year 2010 saw 8% of the schools charge Ksh. 100,000 and more whereas the year 2011 saw the number almost double to 15%. Other trends in the charging of the boarding school fees are as shown in Figure 29 above.
10.2 Day School Fees
Day school fees levied on the students were also sought during the survey (Figure 30).
It was established that no school surveyed charges more than Ksh. 70,000 day school fees. The highest day school fees charged noted was between Ksh. 60,001 and Ksh. 70,000 levied by 8% of the schools only in the year 2010. A significant number of schools charge Ksh. 30,000 and less with the years 2010 (46%) and 2011 (36%) having a significant majority charge Ksh. 10,000 and less.
In the years 2007 (55%) and 2008 (42%), a significant majority of schools levied between Ksh. 10,001 and Ksh. 20,000 day school fees. The number/ percentage of schools charging the same amount declined in the year 2009 (15%) and 2010 (15%) but slightly increased in the year 2011 with 21% of the schools indicating to have charged the amount.
The number/ percentage of schools charging Ksh. 10,000 and below have reduced between the year 2010 and the year 2011 from 46% to 36% while the number of schools charging the following range of fees increased (by the margins shown in the brackets) between the year 2010 and 2011:
1. Between Ksh. 10, 001 and Ksh. 20,000 (increase from 15% to 21%)
2. Between Ksh. 50, 001 and Ksh. 60,000 (increase from 8% to 14%)
Other day school fee ranges and the percentage of schools charging them are as shown in Figure 30 below.
Page 71 of 91

Figure 30: Day School Fee: 2007 – 2011
The above stated school fees are charged per semester/ term by a majority (76%) of the schools as evident in the findings in Table 39 below. A few other schools 24% however expects their students to pay the fees both on an annual and semester basis.
Table 39: Period of fee payment
Fee Payment No of Schools %1 Semester 16 762 Annual 0 .03 Both 5 24
Total 21 100
10.3Other School Charges Levied
Apart from the basic school fees levied on the students as discussed above, the schools also levy other miscellaneous charges on the students (See Table40). It was established that a significant majority of the schools charge:
1. Ksh. 500 and below (3 schools: 14%)
2. Between Ksh. 1,501 and Ksh. 2,000 (3 schools: 14%) and
3. Between Ksh. 3,001 and Ksh. 3,500 (3 schools: 14%)
Page 72 of 91

Table 40: Other charges levied to the students
Other School Charges No of Schools %1 ≤ 500 3 142 501 - 1,000 2 103 1,001 - 1,500 2 104 1,501 - 2,000 3 145 2,001 – 2,500 0 06 2,001 - 3,000 2 107 3,001 - 3,500 3 148 3,501 - 4,000 2 109 4,000 - 4,500 1 510 4,501 - 5,000 1 511 ≥ 5, 001 2 10
TOTAL 21 100
Two schools indicate that they charge Ksh. 5,001 (and more) miscellaneous fee.
10.4 Boarding School Fees Mode of Payment
The mode of Boarding-school fees payment by the various schools is either on an annual or term basis.
Table 41: School Fees Charge period
Further, ten (10) schools indicated that theses miscellaneous fees are charged termly while 7 schools indicated that they are charged annually (See Table 41)
10.5 Schools Financial Sustainability
The survey also attempted to establish the financial sustainability of the schools based on the school fees and other charges levied on students.
Page 73 of 91
CHARGE PERIOD No of Schools
1 Termly 102 Annually 7

Figure 31: Ability of the School Fees/Charges to Sustain School Activities
The school fees collected can sustain operations in only 14% of the schools (See Figure 31) 86% of the schools indicated that the school fees collected does not adequately sustain the various activities and commitments in the school.
Majority of the schools (whose school fees collected do not sustain activities) therefore rely/depend on the school sponsor for financial support in order to meet financial obligations (See Table 42). A few other respondents noted that they rely on donation in cash and kind to meet financial obligations.
Table 42: How the school meets financial obligations
Sources of Finances No of Schools 1 Donation in cash 52 Donation in kind 43 Financial support from the school
sponsor16
Other respondents also stated other means of meeting their financial obligations apart from the ones listed in the questionnaire. These were:
1. Financial support from the directors (1)
2. Fund drives (1)
3. Free Secondary Education (1)
Page 74 of 91

10.6 Annual Statutory External Financial Audit
Elsewhere, it was established that majority of the schools perform annual statutory external audit (See Figure 32). A few (18%) however do not perform or have the statutory external audit.
Figure 32: Annual statutory external audit
Page 75 of 91

11.0 Muslim Non-Governmental Organizations
The research also focused on identifying and mapping all trust funds, charitable foundations and NGOs that provides support to the educational sector to the Muslim community.
11.1 Mapping of Civil Sector Organisations
This led to identifying and mapping of the following trust funds, charitable foundations and NGOs established by the community. However, it was not possible to survey the organizations due to among other reasons, lack of co-operation, lack of particular organization contacts and inability to locate them.
Table 43: Mapped Muslim NGOs
Name of Organisation
1. AFRICA MUSLIMS AGENCY – KENYA
2. AL - MOMIN FOUNDATION
3. AL- ANSAR FOUNDATION
4. Al- MAKTOUM FOUNDATION
5. AL MUNTADA DEVELOPMENT PROJECT
6. AL-MUNTADA AL-ISLAMI TRUST
7. ASSALAM MUSLIM WOMEN FORUM
8. CHALBI SCHOLARS ORGANIZATION
9. GAADDISA LAMMII FOUNDATION
10. HALAL DEVELOPMENT ORGANIZATION
11. HIJRA ORGANIZATION FOR WELFARE AND DEVELOPMENT
12. HIMILO RELIEF AND DEVELOPMENT ASSOCIATION
13. HOOBAAN RELIEF ORGANIZATION
14. IIMAAN RELIEF AND DEVELOPMENT ORGANIZATION
Page 76 of 91

15. INTERNATIONAL ISLAMIC RELIEF ORGANISATION
16. INTO ABBAS ARMS
17. ISLAMIC AFRICAN RELIEF AGENCY
18. ISLAMIC CALL WELFARE
19. ISLAMIC DEVELOPMENT GROUP
20. ISLAMIC FOUNDATION
21. KENYA MUSLIM CHARITABLE SOCIETY
22. LAMU FOUNDATION
23. MANHAL CHARITABLE ORGANIZATION
24. MASOMO FOUNDATION
25. MUNADHAMAT AL DAWA AL ISLAMIA
26. MUNADHAMAT AL DAWAAL ISLAMIA (M.D.I MISSION OF KENYA)
27. ONE SHILLING FOUNDATION28. MUSLIM EDUCATION AND WELFARE ASSOCIATION
29. MUSLIM WORLD LEAGUE30. SOMALI AIDS ORGANIZATION
31. SOMALI COMMUNITY AND RELIEF ASSOCIATION32. SOMALI FAMILY CARE NETWORK – AFRICA33. SOMALI INTERNATIONAL MINORITIES OF AMERICA
34. SOMALI MINORITY RIGHTS AND AID FORUM35. SOMALI YOUTH LEADERSHIP FORUM
36. WORLD ASSEMBLY OF MUSLIM YOUTH
37. YOUNG MUSLIM ASSOCIATION38. ZAMZAM FOUNDATION39. UMMAH FOUNDATION
Page 77 of 91

11.2 Survey of the Civil Society Organisations
The research team approached the NGOs registered in Kenya by the NGO Coordination Board for the purposes of filling a survey tool. The main objective of the survey was to establish the extent to which each organisation on the number of scholarships offered and the total amount in Kenya Shillings offered per annum. None of the surveyed NGOs responded back and therefore the research team could not get any responses on the two (2) research objectives.
Page 78 of 91

12.0 The Research Conclusions
The following are the research conclusions and recommendations:
12.1 Number of Muslim Secondary Schools
The research desk review established that there are at least 65 secondary schools established by either the Muslim community in general or private Muslim individuals. The schools’ geographic spread is as follows:
Nairobi - 18 Schools Coast - 17 Schools North Eastern - 11 Schools Rift Valley - 8 Schools
12.2 The Schools National Examination Performance 2011
The schools national examination performance, 2011 demonstrates a poor national performance by most of the Muslim secondary schools. The boys’ schools performed better than mixed schools and the girls only schools performed very poorly.
The following conclusions with regards to national examination performances:
i) Poor national examination performance in general by most of the Muslim secondary schools;
A - 1 school only B - 9 Schools C - 7 Schools D - 13 Schools
ii) The boys schools performed better than girls and mixed schools combined;
A - 1 school only B - 3 Schools C - 3 Schools D - 0 Schools
Page 79 of 91

iii) Good National Examination performance as per KNEC 2011 performance index for mixed schools:
A - None B - 6 Schools C - 3 Schools D - 7 Schools
iv) Poor National Examination performance index for girls only schools:
A - None B - None C - 1 School D - 6 Schools
Table 44: Summary National Examination Performance
School Exam Grade School Type Boys Girls Mixed Total %
1 A 1 0 0 1 3.302 B 3 0 6 9 30.03 C 3 1 3 7 23.34 D 0 6 7 13 43.3
Totals 7 7 16 30 100% 23.3 23.3 53.3 100
12.3Academic Staff
The schools’ academic staff comprises of mainly of teachers and other support staff such as laboratory technologists etc. According to the school survey data, two-thirds of all the academic staff have been reported by the schools as trained teachers and about a third as untrained (See Table 45)
Page 80 of 91

Table 45 Training of the Academic Staff
Academic Staff %1 Trained 692 Untrained 31
Total 100
The schools employ various teachers with various qualification backgrounds to teach all the examinable subjects. The surveyed schools (N=26) has employed a total of 427 teachers (See Table 46). A majority of the teachers (82%) holding a bachelor’s degree, followed by Diploma holders (11.2%), then Master’s degree holders accounting for 5.4%, Certificate holders (0.2%) and Ordinary (O) level at 1.0% respectively.
Table 46: Summary of Academic Staff Qualifications
Subject O-level Cert Dip
Degree Masters Total%
1 Mathematics 6 48 5 59 142 Kiswahili 2 38 2 42 103 English 36 3 39 94 Biology 2 35 1 38 95 Chemistry 5 32 3 40 96 Physics 4 25 4 33 87 Geography 1 4 27 1 33 88 History 1 1 32 34 89 Agriculture 1 2 9 12 310 Business Education 8 17 2 27 611 Home Science 1 8 9 212 C.R.E 1 7 8 213 Computer Studies 4 12 16 414 Arabic 9 18 2 29 715 I.R.E 1 7 8 2
Total 4 1 48 351 23 427% 1.0 0.2 11.2 82 5.4
Page 81 of 91

Figure 33: Academic Staff Qualification
The figure below indicates the teacher allocation per subject with mathematics taking the largest share (14%) of the total number of teachers.
Figure 34: Teacher Allocation per Subject
Page 82 of 91

12.4 School Utilization
The school survey research established that some schools are underutilized whereas others are over utilized.
The figure below demonstrates that more than half (57%) of the surveyed schools (N=21) are under-utilized by admitting less than 40 students per class on average. About 5 schools (24%) of the respondent schools have admitted on average more than 40 students per class and 4 schools (19%) had admitted the number students averaging 40 students per class room.
Figure 35: Class Utilization
12.5 Provision of Religious Facilities
Majority of the schools surveyed indicated provision of both either a masjid (mosque) or a prayer room and madrassa for teaching of Islamic religious studies above the teaching of I.R.E.
Page 83 of 91

Figure 36: Teacher Allocation per Subject
12.6 Provision of Catering Services
The students in most of the surveyed schools receive adequate nutritional nourishment with 89% of the schools providing at least 2 meals per day. Most schools (44%) provide 3 meals a day and a substantial number of schools provide 4 meals per day.
Figure 37: Number of Meals per day
As much as the provision of meals, most schools (84%) indicated that their respective schools provide a balanced diet to all students per day.
Page 84 of 91

12.7 Student Accommodation
Most schools (83%) surveyed provide cubicles for student accommodation with 17% provides open dormitory accommodation.
Figure 38 Student Accommodation
In the same note, More than half (55%) of the schools accommodate their teachers and staff within the school.
Figure 39: School Staff Accommodation
12.8 Extra Curriculum Activities
A total of 92% of the schools surveyed provide extra curriculum activities with most schools providing more than one activity and at the same time participates in the various competitions within their respective geographic regions.
Page 85 of 91

However, some of the schools face a challenge in terms of lack of land, financial resources and lack of sports infrastructure in the provision of extra curriculum activities to the students.
12.9Schools Academic Performance
The academic performance of most schools surveyed is either average or poor leading to a low transition rate to public universities in Kenya.
a) The Number of Registered Students: 2007 – 2011
The surveyed schools (N=24) that responded to this section had registered a total of 5175 between the years 2007 and 2011.
Table 47: Number of KNEC Registered Students: 2007 – 2011
Year Number of Students
Registered for KCSE
% Total % Change
2007 975 17 02008 1098 19 132009 1038 18 -62010 1225 21 192011 1379 24 16
Total 5715
The number of registered students per year has been on an upward trend except for the years 2008 and 2009 when it dropped by 7 percentage points from 13 to 6 percent. In total, the 24 schools managed to register a total of 5, 175 students between the period of 2007 and 2011.
Page 86 of 91

Figure 40: Total Number of KNEC Registered Students: 2007 - 2011
b) The Number of Students Admitted in Public Universities: 2007 – 2011
Fifteen (N=15) school responded to the question in relation to the number of students the school managed to admit in local public universities between the years 2007 and 2011. However, the data collected was for the period between 2007 and 2010 because by the time the survey was conducted the public university admission for 2011 had not yet commenced.
Figure 41: Number of Students Admitted in Public Universities: 2007 - 2010
The 15 schools reported admission of a total of 623 students into the various public universities in Kenya between the years 2007 and 2010.
The admission to public universities rate of change increased by 82% between 2007 and 2008, fell to 43% in 2009 and recorded an impressive rate of change
Page 87 of 91

of 102% in 2010. However, these impressive rates of change are calculated from a lower base of 97 students in 2007.
Table 48: Number of Students Admitted in Public Universities: 2007 - 2010
YearPublic University
Admission
%Change
2007 94 02008 171 822009 131 -432010 227 102Total 623
An interesting point to note is that Sheikh Khalifa School contributed 51% of all public university admission despite registering only 40% of the total number of registered for the KCSE examinations. Nairobi Muslim Academy contributed a total of 15% of total admission into public universities despite registering 25% of total registered students.
12.10 School Financial Sustainability
The survey results revealed that 86% of the schools have financial sustainability issues where revenue collected as school fees and levies are not enough to cater for the costs of running and managing of the schools.
Figure 42: Schools Financial Sustainability
The schools’ financial deficits are covered through school’s sponsors financial support donations either in cash or in kind.
Page 88 of 91

13.0 Research Recommendations
The research recommendations are as follows:
13.1 School Performance Improvement
Two thirds of the 30 schools have scored a C grade and below and there is a strong need to develop a performance improvement framework and assist both the schools and students improve their respective the performances.
13.2 Schools’ Communications
Some schools have well dedicated websites and emails for external communication channels whereas others have not yet developed the schools’ websites or the email. The schools should be assisted in developing their respective websites and domain emails that will assist the schools to communicate with external stakeholders and prospective ones. Further, a common website should be developed that shall have a back-to-back link with all schools’ websites.
13.3 Governance Structures Capacity Building and Strengthening
All the schools surveyed had a governance structure with a majority having board of governors (BoGs) but despite these governance structures most schools’ academic performances are very low over a period of time. This calls for building capacities of the board governors in all matters regarding school management and academic performance in particular.
13.4 Academic Staff Capacity Building and Strengthening
Two thirds of the academic staff is reported to be trained with almost 82% of the teachers reporting having a bachelor’s degree. Despite this high rate of trained academic staff, the schools’ academic performance does not reflect this academic staff establishment.
13.5 Provision of Religious Facilities
25 and 16 schools out of 26 provide a masjid or a room for prayers and Islamic religious teaching over and above the IRE classes. The schools ought to use this as a unique selling point to all Muslim parents locally and internationally as the schools caters for both religious and secular educational needs for the student.
Page 89 of 91

13.6 School Capacity Utilization
Majority of the schools (57%) are currently underutilized leading to a higher average cost per student for these schools. School capacity underutilization with these schools is highly associated with school academic performance with over-utilized schools (24%) having recorded better national academic performances. Therefore, full optimal utilization of the schools’ student admission is directly and positively linked to good academic performances.
13.7 School Financial Sustainability
The long term schools’ financial sustainability relies directly on the student admissions that are the primary source of schools’ collection of revenue. However, schools can only attract a good number of students with good academic performance only when the schools record impressive academic performance in the national examinations.
13.8 Formation of a Consortium of Members or Restructure the Muslim Education Council
The establishment of a consortium of subscribed membership comprising of universities and colleges; secondary, primary and nursery schools; local and international NGOs; teachers and other professionals and students at all levels.
The objective of forming the consortia of members or the restructuring the Muslim Education Council (MEC) is to plan; facilitate; coordinate and implement most of the above raised issues in general and the school performance improvement framework in particular.
Page 90 of 91
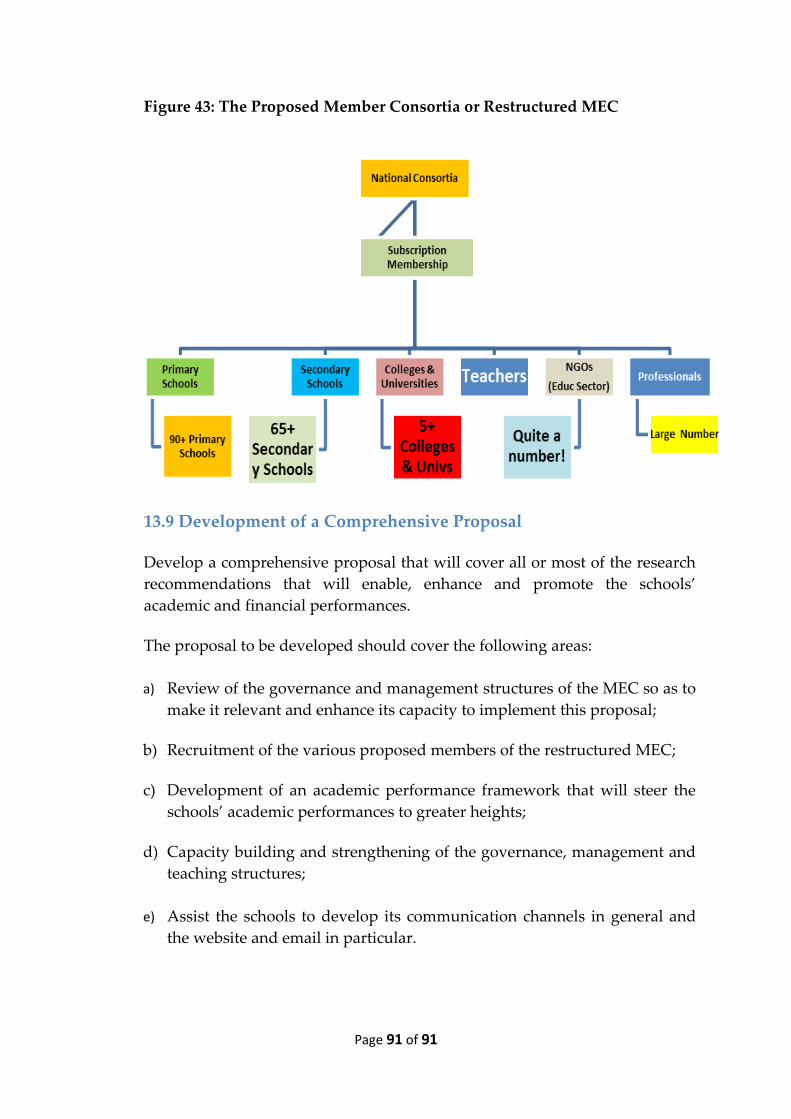
Figure 43: The Proposed Member Consortia or Restructured MEC
13.9 Development of a Comprehensive Proposal
Develop a comprehensive proposal that will cover all or most of the research recommendations that will enable, enhance and promote the schools’ academic and financial performances.
The proposal to be developed should cover the following areas:
a) Review of the governance and management structures of the MEC so as to make it relevant and enhance its capacity to implement this proposal;
b) Recruitment of the various proposed members of the restructured MEC;
c) Development of an academic performance framework that will steer the schools’ academic performances to greater heights;
d) Capacity building and strengthening of the governance, management and teaching structures;
e) Assist the schools to develop its communication channels in general and the website and email in particular.
Page 91 of 91