accessing the relationship between marketing mix …ht show that the tourist satisfaction mediates...
TRANSCRIPT
www.aasrc.org/aasrj American Academic & Scholarly Research Journal Vol. 4, No. 2, November 2012
ISSN 2162-321X E-ISSN 2162-3228
Assessing the Relationship between Marketing Mix and Loyalty through Tourists Satisfaction in
Jordan Curative Tourism
Dr. Ayed Al Muala
Applied Science University
Dr. Majed Al Qurneh
University Utara Malaysia
ABSTRACT
The aim of this paper is to explore the relationship between three key variables, namely Marketing Mix,
satisfaction and loyalty in curative tourism industry in Jordan. The seven dimensions of the Marketing Mix
employed in this study are product, price, promotion, physical evidence, place, personnel, and process. Out
of 950 questionnaires, 690 were returned by the end of September, 2009. Each variable was measured using
reliable developed scales: product (6 items), adapted from (Yuksel, 2004), price (6 items) by (Yuksel, 2004),
physical evidence (6 items) by (Yuksel, 2004), promotion (9 items) by (Yuksel, 2004), place (4 items) by
(Yuksel, 2004), process (4 items)by (Yuksel, 2004), personnel (5 items) by (Yuksel, 2004), and tourist
satisfaction (5 items) by Lim et al (2006). Finally, destination loyalty (7 items) by Lim et al (2006) .Data was
input into SPSS and analyzed used exploratory factor analysis (EFA). SPSS results indicate that there some
hypotheses: results of this study were as follows: H1 show that product and place were significant on
destination loyalty. While, price, personnel and process not significant on destination loyalty, and for H2
show that product, place, price, personnel and process significant impact on tourist satisfaction. In addition,
H3 show that the tourist satisfaction mediates the relationship between Marketing Mix and loyalty.
KEY WORDS: curative tourism, Marketing Mix, satisfaction, and loyalty. Introduction Marketing is an art and a science. According to the American Marketing Association, marketing is "the process of planning and executing the conception, pricing, promotion, and distribution of ideas, goods, and services to create exchanges that satisfy individual and organizational objectives." Simply stated it is creating and promoting a product (ideas, goods or services) that satisfies a customer's need or desire and is
www.aasrc.org/aasrj American Academic & Scholarly Research Journal Vol. 4, No. 2, November 2012
ISSN 2162-321X E-ISSN 2162-3228
available at a desirable price and place. According to Mahoney, Edward, Warnell, and Gary (1987), modern marketing is a way of doing business, heavily based on the "marketing concept" which holds that businesses and organizations should: (1) design their products/services to meet customer needs and wants; (2) focus on those people most likely to buy their product rather than the entire mass market; and (3) develop marketing efforts that fit into their overall business objectives. The importance of marketing mix concept is lauded by Rafiq and Ahmed (1995) who considers it as one of the core concepts of marketing theory. The spread of many ad hoc ideas has underestimated the concept of marketing mix and a call for a more coherent approach is necessary. In another study, Booms and Bitner (1981) studied marketing mix in other areas of marketing and opine that by adopting marketing mix, the provision of better products is not only accomplished but in addition, the saving of costs and time in developing and promoting the product is also accomplished (Mahoney et al., 1987). Elements of the Marketing Mix a) Product A product as defined by Armstrong and Kotler (2006), is anything that can be offered to a market for attention, acquisition, use, or consumption that might satisfy a want or need. As for services, according to Hirankitti, Mechinda, and Manjing (2009) the product offer in respect of services can be explained based in two components: (1) The core service which represents the core benefit; (2) The secondary services which represent both the tangible and augmented product levels. The latter can be best understood in terms of the manner of delivery of the particular service. Ferrell (2005) opines that the product is the core of the marketing mix strategy where retailers can offer unique attributes that differentiates their product from their competitors. According to Borden (1984) product is characterized by quality, design, features, brand name and sizes b) Price
According to Kotler, Armstrong, Wong, and Saunders (2008), price is the amount of money charged for a product or service, or the total values that consumers exchange for the benefits of having or using the product or service. Due to the intangible nature of services, price becomes a crucial quality indicator where other information is not lacking or absent (Zeithaml, 1981). Price is considered as the most important measurement of repurchase intentions (Oh, 2000; Parasuraman and Grewal, 2000). In deciding to return to the service provider, the customers normally think whether or not they received their value for money (Zeithaml, 1988). It has been proven therefore, that customers usually buy products on the basis of price rather than other attributes (Peter & Donnely, 2007). c) Place This factor is defined by Armstrong and Kotler (2006) as a set of interdependent organizations that caters to the process of making a product available to the consumers. Hirankitti et al., (2009) considers place as the ease of access which potential customer associates to a service such as location and distribution. The strategy of place needs effective distribution of the firm’s products among the channels of marketing like wholesalers or retailers (Berman, 1996). An organization should pay attention to place decisions, because of the importance of the product and consumption occurring at the same time and at the same place; a place that provides all information of customer, competition, promotion action, and marketing task. It should pay attention to how it can deliver the product at the right time and at the right place, and which channel should be used to deliver the product (Copley, 2004). d) Promotion
www.aasrc.org/aasrj American Academic & Scholarly Research Journal Vol. 4, No. 2, November 2012
ISSN 2162-321X E-ISSN 2162-3228
It is defined as sales promotion, advertising, personal selling, public relations and direct marketing (Borden, 1984) - A decision of how best to relate the product to the target market and how to persuade them to buy it (Lovelock, Patterson and Walker, 1998). A communication program is important in marketing strategies because it plays three vital roles: providing needed information and advice, persuading target customers of the merits of a specific product, and encouraging them to take action at specific times (Lovelock and Wright, 2002). Activities that cater to promotion are advertising, sales promotions, personal selling and publicity; they can all influence consumer’s way of thinking, their emotions, their experience as well as their purchasing. Communications should be devised by marketers in such a way that it (1) offer consistent messages about their products and (2) are placed in media that consumers in the target market are likely to use (Munusamy and Hoo, 2008). Promotion is a selling technique; to succeed in any marketing program, it should be involved with communication (promotion). Promotion is very important as it provides information, advice, and it persuades the target market. It guides and teaches the customer to take action at a specific time and how they can use the product and get beneficial result from it. The product advertisement can be delivered by individual sales people, T.V, radio, internet, magazine, press, and all types of media. e) Personnel
This factor refers to the service employees who produce and deliver the service. It has long been a fact that many services involve personal interactions between customers and the site's employees, and they strongly influence the customer’s perception of service quality (Hartline and Ferrell, 1996: Rust, Zahorik and Keiningham, 1996). Personnel are keys to the delivery of service to customers. In addition, according to Magrath (1986) customers normally link the traits of service to the firm they work for. Personnel are also considered as the key element in a customer centered organization as well as a way to differentiate variables with product, services, channel, and image (Kotler, 2000). Achievement of a customer-orientation is not possible if there is no cooperation coming from the personnel (Judd, 2001). The interaction is important because it influences customer perception. In other words, the actions of all the personnel normally influence success of action and function of an organization and with more communication, training, skills, learning, and advice they will achieve to display the optimum value of the product and the company. f) Process
Process is generally defined as the implementation of action and function that increases value for products with low cost and high advantage to customer and is more important for service than for goods. According to Hirankitti et al., (2009) the pace of the process as well as the skill of the service providers are clearly revealed to the customer and it forms the basis of his or her satisfaction with the purchase. Therefore, process management ensures the availability and consistence of quality. In the face of simultaneous consumption and production of the process management, balancing services demand with service supply is extremely difficult (Magrath, 1986). The design and the implementation of product elements are crucial to the creation and delivering of product. g) Physical Evidence
This factor refers to the environment in which the service and any tangible goods that facilitate the performance and communication of the service are delivered. This holds great importance because the customer normally judges the quality of the service provided through it (Rafiq & Ahmed, 1995). In addition, according to Mittal and Baker (1998), this factor also refers to the environment in which the services production is in. Similarly, Bitner (1990) adds that other visible surroundings can affect the impressions
www.aasrc.org/aasrj American Academic & Scholarly Research Journal Vol. 4, No. 2, November 2012
ISSN 2162-321X E-ISSN 2162-3228
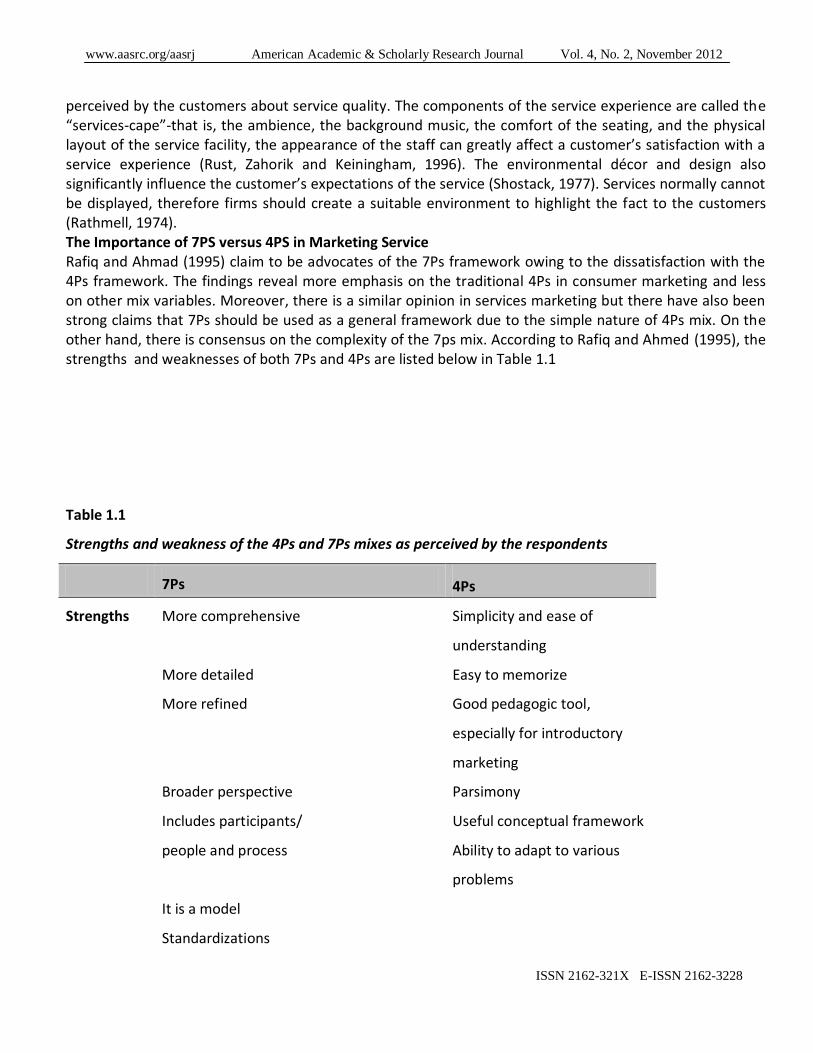
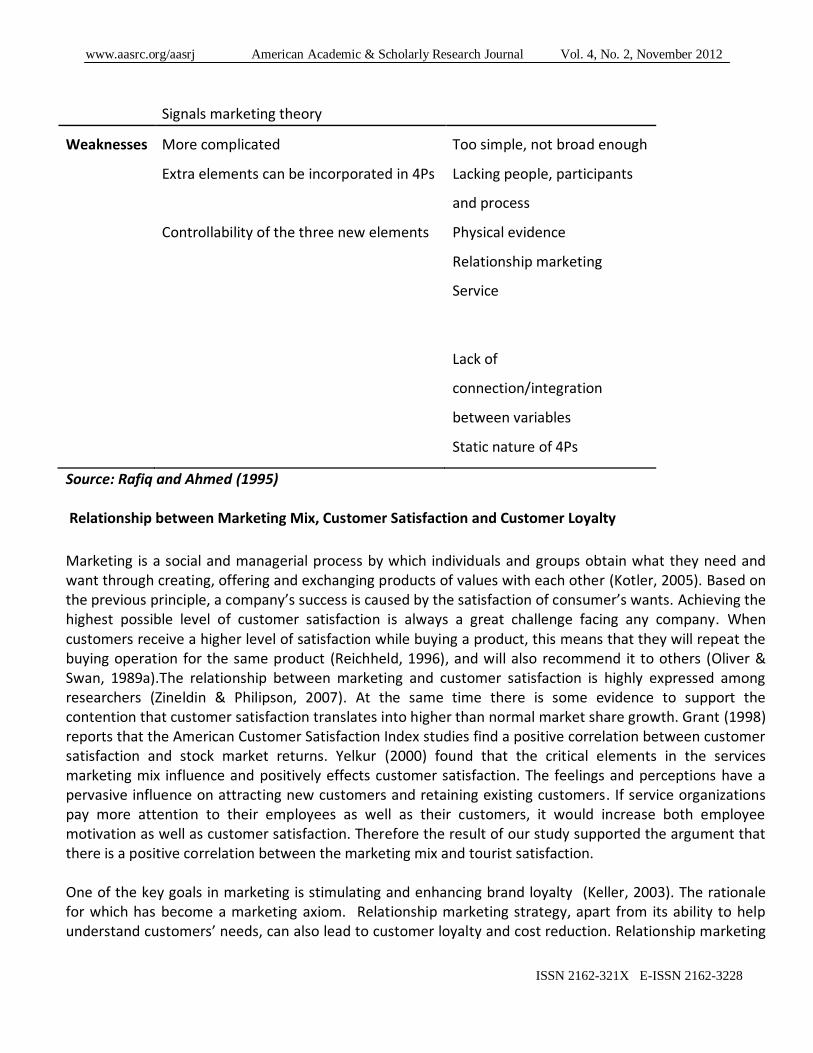
perceived by the customers about service quality. The components of the service experience are called the “services-cape”-that is, the ambience, the background music, the comfort of the seating, and the physical layout of the service facility, the appearance of the staff can greatly affect a customer’s satisfaction with a service experience (Rust, Zahorik and Keiningham, 1996). The environmental décor and design also significantly influence the customer’s expectations of the service (Shostack, 1977). Services normally cannot be displayed, therefore firms should create a suitable environment to highlight the fact to the customers (Rathmell, 1974). The Importance of 7PS versus 4PS in Marketing Service Rafiq and Ahmad (1995) claim to be advocates of the 7Ps framework owing to the dissatisfaction with the 4Ps framework. The findings reveal more emphasis on the traditional 4Ps in consumer marketing and less on other mix variables. Moreover, there is a similar opinion in services marketing but there have also been strong claims that 7Ps should be used as a general framework due to the simple nature of 4Ps mix. On the other hand, there is consensus on the complexity of the 7ps mix. According to Rafiq and Ahmed (1995), the strengths and weaknesses of both 7Ps and 4Ps are listed below in Table 1.1 Table 1.1
Strengths and weakness of the 4Ps and 7Ps mixes as perceived by the respondents
7Ps 4Ps
Strengths
More comprehensive Simplicity and ease of
understanding
More detailed Easy to memorize
More refined Good pedagogic tool,
especially for introductory
marketing
Broader perspective Parsimony
Includes participants/ Useful conceptual framework
people and process Ability to adapt to various
problems
It is a model
Standardizations
www.aasrc.org/aasrj American Academic & Scholarly Research Journal Vol. 4, No. 2, November 2012
ISSN 2162-321X E-ISSN 2162-3228
Signals marketing theory
Weaknesses More complicated Too simple, not broad enough
Extra elements can be incorporated in 4Ps Lacking people, participants
and process
Controllability of the three new elements Physical evidence
Relationship marketing
Service
Lack of
connection/integration
between variables
Static nature of 4Ps
Source: Rafiq and Ahmed (1995)
Relationship between Marketing Mix, Customer Satisfaction and Customer Loyalty
Marketing is a social and managerial process by which individuals and groups obtain what they need and want through creating, offering and exchanging products of values with each other (Kotler, 2005). Based on the previous principle, a company’s success is caused by the satisfaction of consumer’s wants. Achieving the highest possible level of customer satisfaction is always a great challenge facing any company. When customers receive a higher level of satisfaction while buying a product, this means that they will repeat the buying operation for the same product (Reichheld, 1996), and will also recommend it to others (Oliver & Swan, 1989a).The relationship between marketing and customer satisfaction is highly expressed among researchers (Zineldin & Philipson, 2007). At the same time there is some evidence to support the contention that customer satisfaction translates into higher than normal market share growth. Grant (1998) reports that the American Customer Satisfaction Index studies find a positive correlation between customer satisfaction and stock market returns. Yelkur (2000) found that the critical elements in the services marketing mix influence and positively effects customer satisfaction. The feelings and perceptions have a pervasive influence on attracting new customers and retaining existing customers. If service organizations pay more attention to their employees as well as their customers, it would increase both employee motivation as well as customer satisfaction. Therefore the result of our study supported the argument that there is a positive correlation between the marketing mix and tourist satisfaction. One of the key goals in marketing is stimulating and enhancing brand loyalty (Keller, 2003). The rationale for which has become a marketing axiom. Relationship marketing strategy, apart from its ability to help understand customers’ needs, can also lead to customer loyalty and cost reduction. Relationship marketing
www.aasrc.org/aasrj American Academic & Scholarly Research Journal Vol. 4, No. 2, November 2012
ISSN 2162-321X E-ISSN 2162-3228
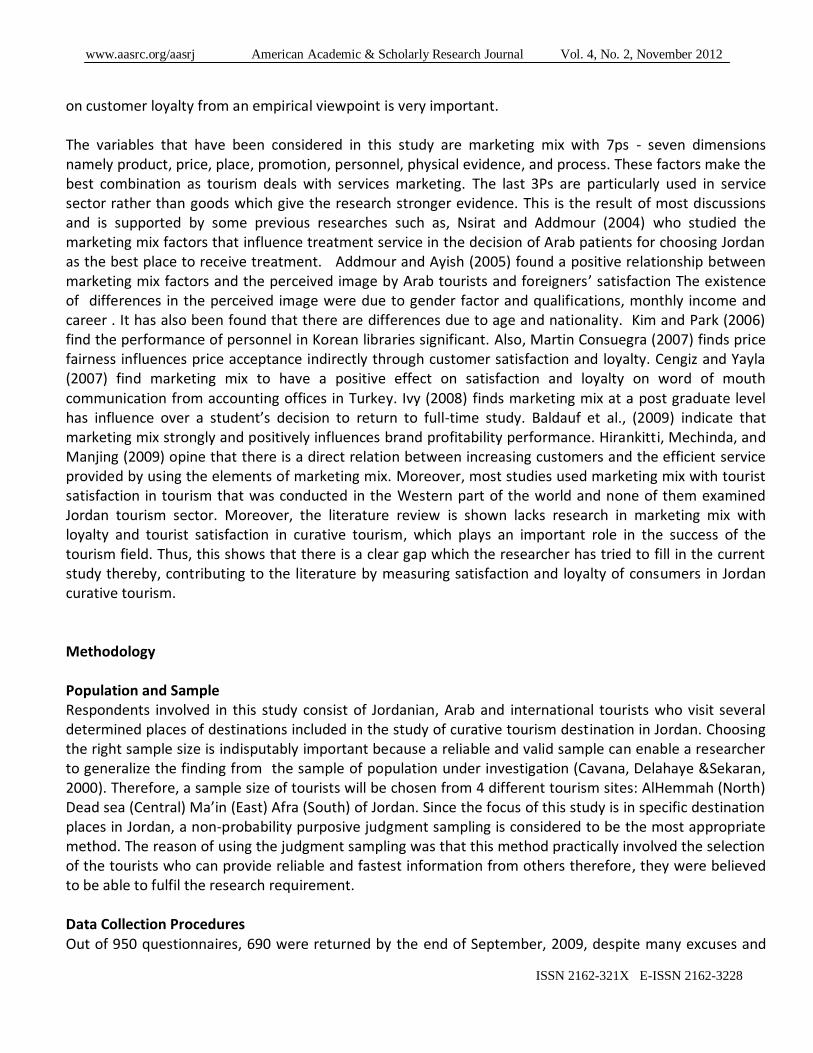
on customer loyalty from an empirical viewpoint is very important. The variables that have been considered in this study are marketing mix with 7ps - seven dimensions namely product, price, place, promotion, personnel, physical evidence, and process. These factors make the best combination as tourism deals with services marketing. The last 3Ps are particularly used in service sector rather than goods which give the research stronger evidence. This is the result of most discussions and is supported by some previous researches such as, Nsirat and Addmour (2004) who studied the marketing mix factors that influence treatment service in the decision of Arab patients for choosing Jordan as the best place to receive treatment. Addmour and Ayish (2005) found a positive relationship between marketing mix factors and the perceived image by Arab tourists and foreigners’ satisfaction The existence of differences in the perceived image were due to gender factor and qualifications, monthly income and career . It has also been found that there are differences due to age and nationality. Kim and Park (2006) find the performance of personnel in Korean libraries significant. Also, Martin Consuegra (2007) finds price fairness influences price acceptance indirectly through customer satisfaction and loyalty. Cengiz and Yayla (2007) find marketing mix to have a positive effect on satisfaction and loyalty on word of mouth communication from accounting offices in Turkey. Ivy (2008) finds marketing mix at a post graduate level has influence over a student’s decision to return to full-time study. Baldauf et al., (2009) indicate that marketing mix strongly and positively influences brand profitability performance. Hirankitti, Mechinda, and Manjing (2009) opine that there is a direct relation between increasing customers and the efficient service provided by using the elements of marketing mix. Moreover, most studies used marketing mix with tourist satisfaction in tourism that was conducted in the Western part of the world and none of them examined Jordan tourism sector. Moreover, the literature review is shown lacks research in marketing mix with loyalty and tourist satisfaction in curative tourism, which plays an important role in the success of the tourism field. Thus, this shows that there is a clear gap which the researcher has tried to fill in the current study thereby, contributing to the literature by measuring satisfaction and loyalty of consumers in Jordan curative tourism.
Methodology
Population and Sample Respondents involved in this study consist of Jordanian, Arab and international tourists who visit several determined places of destinations included in the study of curative tourism destination in Jordan. Choosing the right sample size is indisputably important because a reliable and valid sample can enable a researcher to generalize the finding from the sample of population under investigation (Cavana, Delahaye &Sekaran, 2000). Therefore, a sample size of tourists will be chosen from 4 different tourism sites: AlHemmah (North) Dead sea (Central) Ma’in (East) Afra (South) of Jordan. Since the focus of this study is in specific destination places in Jordan, a non-probability purposive judgment sampling is considered to be the most appropriate method. The reason of using the judgment sampling was that this method practically involved the selection of the tourists who can provide reliable and fastest information from others therefore, they were believed to be able to fulfil the research requirement. Data Collection Procedures Out of 950 questionnaires, 690 were returned by the end of September, 2009, despite many excuses and
www.aasrc.org/aasrj American Academic & Scholarly Research Journal Vol. 4, No. 2, November 2012
ISSN 2162-321X E-ISSN 2162-3228
obstacles found by the author during data collection purpose. For example, most respondents were busy with treatment or relaxation in spa and do not have time to answer the questionnaire and they also complain about it as a so called interruption, to the office of service providers, and it was difficult to reach them by mobile phone. In addition to the primary data, relevant secondary data was also gathered from various sources namely the Ministry of Tourism and Antiquities (MOTA), Jordan Tourism Board (JTB), Statistic General Circle (SGC), and daily newspapers. Operationalization of Variable The main objective of this study is to promote the curative tourism in Jordan, the original measurement being a modification of Yuksel (2004), by using 4 point scale with 42 items that ranges from very good to very poor. Based on the validity process, the questionnaire was reduced to 36 items. 5 point scale that ranges from “Highly dissatisfied” (1) to “Highly satisfied” (5) is used. Example of items for marketing mix destination is provided in Appendix1. Factor Analysis on Marketing Mix Strategies
Exploratory factor analysis (EFA) was conducted on marketing mix strategies including 7 dimensions namely, product, price, physical evidence, promotion, personnel, place, and process. 6 items used for product, 6 items used for price, 6 items used for physical evidence, 4 items used for promotion, 5 items used for personnel, 4 items used for place, and 5 items used for process. The results of exploratory factor analysis on marketing mix are presented in Appendix 2. The table presents the factor loading of 7 dimensions of marketing mix items after deleting the items that show either low factor loading (<0.40), double loading and the results indicate that the loadings of the remaining items were from 0.40.to 0.80. The five dimensions comprised of product with 3 items, price with 5 items personnel with 5 items, place with 4 items, and process with 5 items. The relative explanatory power (Eigenavalues) for each dimension is 9.130, 2.984, 2.269, 1.601, and 1.193, respectively. These dimensions cumulatively captured 78.072 percent of variance in the data. The Kaiser-Meyer-Olkin Measure of Sampling Adequacy (MAS) for all items was 0.865 which is ranged within the acceptable level i.e. between 0.51 and 0.90. In other words, if the MAS value is above 0.50, it indicates a certain level of appropriateness (Hair et al., 2006).The Bartlett's Test of Sphericity was significant, which indicates that there is sufficient number of significant inter-correlations for factor analysis, and the assumptions of factor analysis were met. In fact, if the KMO measure is greater than 0.60 and the Bartlett's test of Sphericity is large and significant , then factorability is assumed (Coakes & Steed, 2007; Pallant, 2007; Tabachnick & Fidell, 2007). The Cronbach's Alpha of items is reliable. These results provide support to discriminate convergent validity of marketing mix. Moreover, the results also show homogeneity within the dimensions and heterogeneity between the dimensions. The results of factor analysis are attached in Appendix 2. The Examination of Marketing Mix that has more Impact on Destination Loyalty
In order to examine which component of marketing mix has more impact on destination loyalty, five hypotheses were developed:
H1: There is a significant and positive relationship between marketing mix and destination loyalty.
The largest beta coefficient is ( =.371) which is the place. This means that this dimension makes the
www.aasrc.org/aasrj American Academic & Scholarly Research Journal Vol. 4, No. 2, November 2012
ISSN 2162-321X E-ISSN 2162-3228
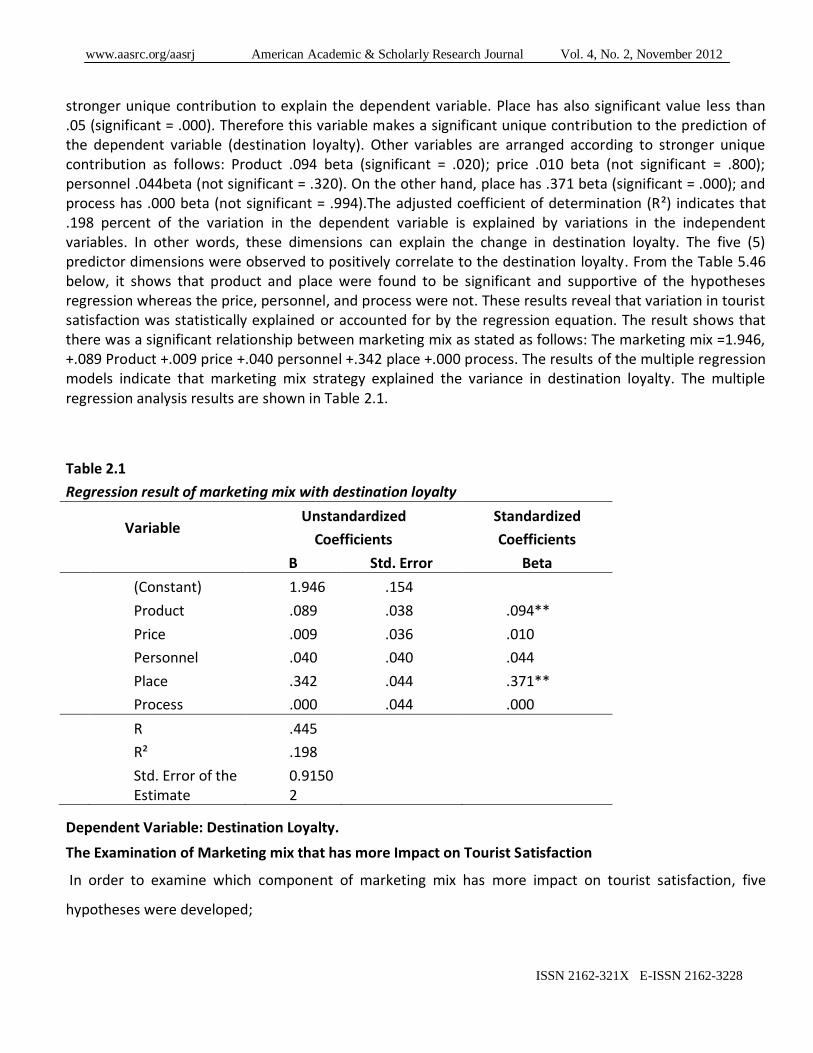
stronger unique contribution to explain the dependent variable. Place has also significant value less than .05 (significant = .000). Therefore this variable makes a significant unique contribution to the prediction of the dependent variable (destination loyalty). Other variables are arranged according to stronger unique contribution as follows: Product .094 beta (significant = .020); price .010 beta (not significant = .800); personnel .044beta (not significant = .320). On the other hand, place has .371 beta (significant = .000); and process has .000 beta (not significant = .994).The adjusted coefficient of determination (R²) indicates that .198 percent of the variation in the dependent variable is explained by variations in the independent variables. In other words, these dimensions can explain the change in destination loyalty. The five (5) predictor dimensions were observed to positively correlate to the destination loyalty. From the Table 5.46 below, it shows that product and place were found to be significant and supportive of the hypotheses regression whereas the price, personnel, and process were not. These results reveal that variation in tourist satisfaction was statistically explained or accounted for by the regression equation. The result shows that there was a significant relationship between marketing mix as stated as follows: The marketing mix =1.946, +.089 Product +.009 price +.040 personnel +.342 place +.000 process. The results of the multiple regression models indicate that marketing mix strategy explained the variance in destination loyalty. The multiple regression analysis results are shown in Table 2.1.
Table 2.1
Regression result of marketing mix with destination loyalty
Variable
Unstandardized
Coefficients
Standardized
Coefficients
B Std. Error Beta
(Constant) 1.946 .154
Product .089 .038 .094**
Price .009 .036 .010
Personnel .040 .040 .044
Place .342 .044 .371**
Process .000 .044 .000
R .445
R² .198
Std. Error of the Estimate
0.91502
Dependent Variable: Destination Loyalty.
The Examination of Marketing mix that has more Impact on Tourist Satisfaction
In order to examine which component of marketing mix has more impact on tourist satisfaction, five
hypotheses were developed;
www.aasrc.org/aasrj American Academic & Scholarly Research Journal Vol. 4, No. 2, November 2012
ISSN 2162-321X E-ISSN 2162-3228
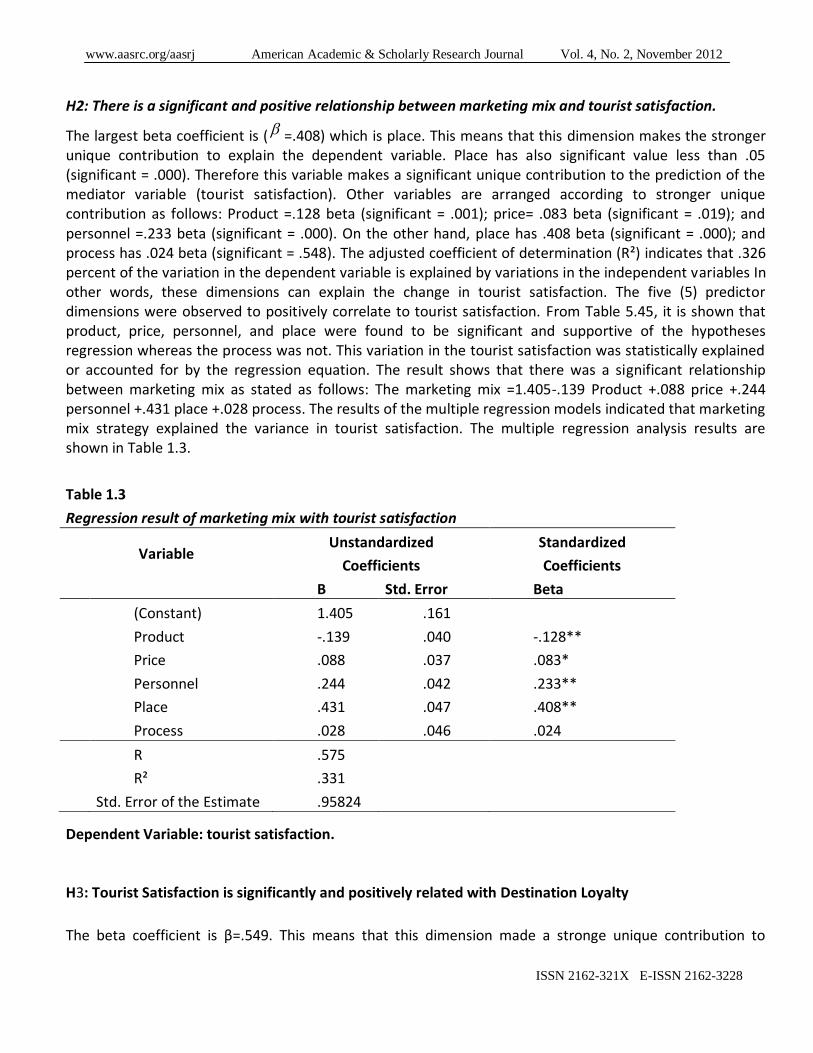
H2: There is a significant and positive relationship between marketing mix and tourist satisfaction.
The largest beta coefficient is ( =.408) which is place. This means that this dimension makes the stronger unique contribution to explain the dependent variable. Place has also significant value less than .05 (significant = .000). Therefore this variable makes a significant unique contribution to the prediction of the mediator variable (tourist satisfaction). Other variables are arranged according to stronger unique contribution as follows: Product =.128 beta (significant = .001); price= .083 beta (significant = .019); and personnel =.233 beta (significant = .000). On the other hand, place has .408 beta (significant = .000); and process has .024 beta (significant = .548). The adjusted coefficient of determination (R²) indicates that .326 percent of the variation in the dependent variable is explained by variations in the independent variables In other words, these dimensions can explain the change in tourist satisfaction. The five (5) predictor dimensions were observed to positively correlate to tourist satisfaction. From Table 5.45, it is shown that product, price, personnel, and place were found to be significant and supportive of the hypotheses regression whereas the process was not. This variation in the tourist satisfaction was statistically explained or accounted for by the regression equation. The result shows that there was a significant relationship between marketing mix as stated as follows: The marketing mix =1.405-.139 Product +.088 price +.244 personnel +.431 place +.028 process. The results of the multiple regression models indicated that marketing mix strategy explained the variance in tourist satisfaction. The multiple regression analysis results are shown in Table 1.3.
Table 1.3
Regression result of marketing mix with tourist satisfaction
Variable
Unstandardized
Coefficients
Standardized
Coefficients
B Std. Error Beta
(Constant) 1.405 .161
Product -.139 .040 -.128**
Price .088 .037 .083*
Personnel .244 .042 .233**
Place .431 .047 .408**
Process .028 .046 .024
R .575
R² .331
Std. Error of the Estimate .95824
Dependent Variable: tourist satisfaction.
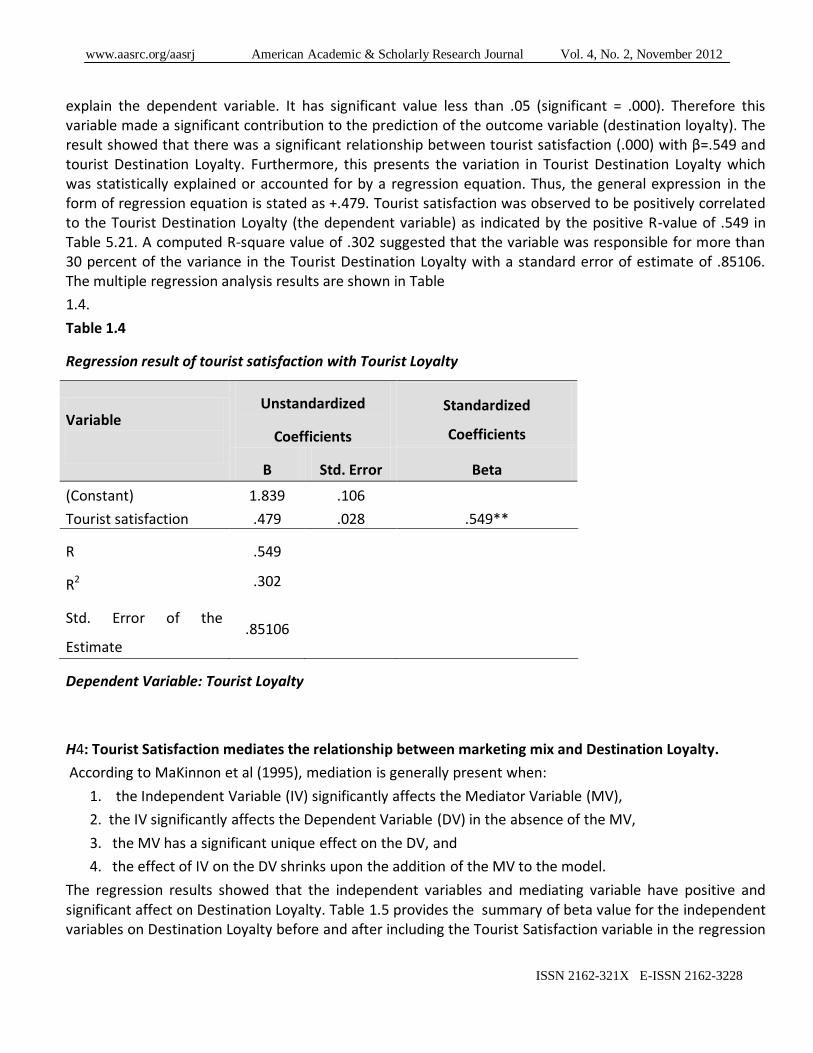
H3: Tourist Satisfaction is significantly and positively related with Destination Loyalty
The beta coefficient is β=.549. This means that this dimension made a stronge unique contribution to
www.aasrc.org/aasrj American Academic & Scholarly Research Journal Vol. 4, No. 2, November 2012
ISSN 2162-321X E-ISSN 2162-3228
explain the dependent variable. It has significant value less than .05 (significant = .000). Therefore this variable made a significant contribution to the prediction of the outcome variable (destination loyalty). The result showed that there was a significant relationship between tourist satisfaction (.000) with β=.549 and tourist Destination Loyalty. Furthermore, this presents the variation in Tourist Destination Loyalty which was statistically explained or accounted for by a regression equation. Thus, the general expression in the form of regression equation is stated as +.479. Tourist satisfaction was observed to be positively correlated to the Tourist Destination Loyalty (the dependent variable) as indicated by the positive R-value of .549 in Table 5.21. A computed R-square value of .302 suggested that the variable was responsible for more than 30 percent of the variance in the Tourist Destination Loyalty with a standard error of estimate of .85106. The multiple regression analysis results are shown in Table
1.4.
Table 1.4
Regression result of tourist satisfaction with Tourist Loyalty
Variable
Unstandardized
Coefficients
Standardized
Coefficients
B Std. Error Beta
(Constant) 1.839 .106
Tourist satisfaction .479 .028 .549**
R .549
R2 .302
Std. Error of the
Estimate .85106
Dependent Variable: Tourist Loyalty
H4: Tourist Satisfaction mediates the relationship between marketing mix and Destination Loyalty.
According to MaKinnon et al (1995), mediation is generally present when:
1. the Independent Variable (IV) significantly affects the Mediator Variable (MV),
2. the IV significantly affects the Dependent Variable (DV) in the absence of the MV,
3. the MV has a significant unique effect on the DV, and
4. the effect of IV on the DV shrinks upon the addition of the MV to the model.
The regression results showed that the independent variables and mediating variable have positive and significant affect on Destination Loyalty. Table 1.5 provides the summary of beta value for the independent variables on Destination Loyalty before and after including the Tourist Satisfaction variable in the regression

www.aasrc.org/aasrj American Academic & Scholarly Research Journal Vol. 4, No. 2, November 2012
ISSN 2162-321X E-ISSN 2162-3228
analysis.
Table 1.5
Summary of Beta Value on the Relationship of Tourist satisfaction between Marketing Mix and Loyalty
Criterion Variable
Destination Loyalty
Variable
Without With Result
Product .110** .124**
Place .393** .146** P
Note: F = Full mediator
P = Partial mediator
**P<0.01
Table 1.5 indicates that Place had been a partial mediator between Tourist Satisfaction and Destination Loyalty but Product did not mediate the relationship because the beta value with Tourist Satisfaction is more compared to beta value without Tourist Satisfaction.
Discussion and Limitation
The finding of this study indicates that the product, price, personnel, place has positive and significant impact on tourist satisfaction and loyalty. It means that tourists became satisfied by experiencing the quality, price and delivery of tourism products of Jordan and it increased their loyalty levels, but process was not significant. In Jordan, tourists found many options of tourism products with good quality and competitive price as business operators know higher price will drive the tourists to buy other products in the same area or in another country. National Tourism Strategy investigates the appropriate pricing conditions so that it can increase the global tourism market share for Jordan. The emergence of private sector with the ability to develop tourism sites makes the sector more competitive. Another possible explanation for this positive result could be that the Jordanian lifestyle and their friendly behaviour have been encouraged in Islam. Employees are well equipped and technically sound as they get continuous training, and as they get to use the latest technology. The archaeological value of Petra, charming scenery of Dead sea, Jordan river, suitable services provided by spas, affordable and comfortable accommodations, and religious historical places really have tremendous value to tourists, especially to Europeans; the improved and extended services and logistic supports of the tourist destinations might enhance tourists’ satisfaction as well as loyalty level. In Jordan, most of the service providers are cautious of the services as tourists expect, especially the Europeans who are keen to observe the process of their consumed services.

www.aasrc.org/aasrj American Academic & Scholarly Research Journal Vol. 4, No. 2, November 2012
ISSN 2162-321X E-ISSN 2162-3228
But the result shows that it is not a strong determinant for destination loyalty as perhaps they think it is normal in Jordan, as well as elsewhere. This research measures the relationships between marketing mix strategy, as the determinate variable of tourist satisfaction as well as the relationship between tourist satisfaction and tourist loyalty. The result of this study shows that satisfaction will lead to loyalty too. The limitations of this study are due to lack of researches regarding tourist’s satisfaction and loyalty in tourism sector industry in the Eastern world.
Reference:
Armstrong, G., & Kotler, P. (2006). Marketing:An introduction (8th ed.). NewYork: Prentice Hall.Addmour, H., & Ayish, H. (2005). The influence of marketing service mixed for five star hotels in Jordan on the image that is perceived by tourist comparative study. Jordan University Journal, 1, 143-156
Baldauf, A., Cravens, K. S., Diamantopoulos, A., & Zeugner-Roth, K. P. (2009). The impact of product-country image and marketing efforts on retailer-perceived brand equity: An empirical analysis. Journal of
Retailing 85(4), 437-452.
Booms, B. H., & Bitner, M. J. (1981). Marketing strategies and organization structures for service firms. Chicago: American Marketing Association.
Borden, N. H. (1984). The concept of marketing mix. Journal of Advertising Research, 1(9), 2-7.
Bitner, M. J. (1990). Evaluating service encounter: The effects of physical surroundings and employee responses. Journal of Marketing, 54, 69-82.
Berman, B. (1996). Marketing channels. United States: John Wiley & Sons
Cavana, R. Y., Delahaye, B. L., & Sekaran, U. (2000). Applied research:Qualitative and quantitative methods. Australia: John Wiley & Sons Australia, Ltd, QLD.
Cengiz, E., & Yayla, H. E. (2007). The effect of marketing mix on positive word of mouth communication:Evidence from accounting offices in Turkey. Innovative Marketing, 3(4), 74-86.
Consuegra, D. M., Molina, A., & Esteban, A. (2007). An integrated model of price, satisfaction and loyalty: An empirical analysis in the service sector. Journal of Product & Brand Management, 16(7), 459–468
Copley, P. (2004). Marketing communications management: concepts and theories, cases and practices Oxford: Butterworth-Heinemann.
Coakes, S. J., & Steed, L. (2007). SPSS version 14.0 for windows: Analysis without anguish: Wiley
Ferrell, O. C., & Hartline, M. D. (2005). Marketing strategy (3rd ed.). Mason, Ohio: South-Western Thomson.
Grant, L. (1998). Your customers are telling the truth: Fortune..
Hartline, M. D., & Ferrell, O. C. (1996). The management of customer contact service employees. Journal of Marketing, 60(4), 52-70.
Hirankitti, P., Mechinda, P., & Manjing, S. (2009). Marketing strategies of thai spa operators in bangkok metropolitan. Paper presented at the The International Conference on Applied Business Research ICABR Valletta (St.Julians)–Malta.
Ivy, J. (2008). A new higher education marketing mix: the 7Ps for MBA marketing. International Journal of Educational Management, 22(4), 288-299.
Judd, V. C. (2001). The targets beyond clients: The Haworth Press, Inc

www.aasrc.org/aasrj American Academic & Scholarly Research Journal Vol. 4, No. 2, November 2012
ISSN 2162-321X E-ISSN 2162-3228
Kotler, P. (2000). Marketing management (10th ed.). NewJersey: Prenmtice Hall.
Kotler, P., & Armstrong, G. (2005). Marketing an introduction: Upper Saddle River Pearson.
Kotler, P., Armstrong, G., Wong, V., & Saunders, J. (2008). Principles of marketing (5th ed.): Financial Times/Prentice Hall.
Kim, H., & Park, Y. (2006). Marketing analysis of reference and information services in Korean Libraries Paper presented at the WORLD LIBRARY AND INFORMATION CONGRESS: 72ND IFLA GENERAL CONFERENCE AND COUNCIL Seoul, Korea.
Keller, K. L. (2003). Strategic brand management: Upper Saddle River, NJ: Prentice Hall.
Lim, H., Widdows, R., & Park, J. (2006). M-Loyalty: Winning strategies for mobile carriers. Journal of Consumer Marketing, 23(4), 208-218.
Lovelock, C. H., Patterson, P. G., & Walker, R. H. (1998). Service marketing. Australia and New Zealand. NewYork: Prentice hall
Lovelock, C., & Wright, L. (2002). Principles of service marketing and management. USA: Prentice Hall.
Mahoney, Edward, Warnell, & Gary. (1987). Tourism marketing
Magrath, A. J. (1986). When marketing services 4 Ps are not enough. Journal of Business, 29(3), 44-50.
MacKinnon, D. P., G. Warsi, et al. (1995). "A simulation study of mediated effect measures." Multivariate Behavioral Research 30(1): 41-62.
Mittal, B., & Baker, J. (1998). The services marketing system and customer psychology. Journal of Psychology and Marketing, 15(8), 727-733.
Munusamy, J., & Hoo, W. C. (2008). Relationship between marketing mix strategy and consumer motive: An empirical study in major tesco stores. UNITAR E-JOURNAL, 4(2), 41-56.
Nusairat, F., & Al-Dmour, H. (2004). The influence of marketing mix elements on Arab patients choice decision of Jordan hospitals for medical Treatment. Derasat ,Universty of Jordan, 31(2), 406-421.
Oliver, R. L., & Swan, J. E. (1989a). Equity and disconfirmation perceptions as influence on merchant and product satisfaction. Journal of Consumer Research, 16, 372-383.
Oh, H. (2000). Diners’ perceptions of quality, value and satisfaction. Cornell Hotel and Restaurant Administration Quarterly, 41(3), 58-66.
Pallant, J. (2007). A step by step guide to data analysis using spss for windows (third ed.). UK: McGraw-Hill House.
Parasuraman, A., & Grewal, D. (2000). The impact of technology on the quality-valueloyalty chain: A research agenda. Journal of the Academy of Marketing Science, 28(1), 168-174.
Peter, P. J., & Donnelly, J. H. (2007). Marketing management: Knowledge and skills (8th ed.). NewYork: McGraw-Hill.
Rafiq, M., & Ahmed, P. K. (1995). Using the 7Ps as a generic marketing mix: An exploratory survey of UK and European marketing academics. Marketing Intelligence & Planning, 13(9), 4-15
Rathmell, J. M. (1974). Marketing in the service sector. Cambridge: Winthrop.
Rust, R. T., Zahorik, A. J., & Keiningham, T. L. (1996). Service marketing. New York: Harper Collins College.
Reichheld, F. (1996). Learning from customer defections. Harvard Business Review, 74(2), 56-69.
www.aasrc.org/aasrj American Academic & Scholarly Research Journal Vol. 4, No. 2, November 2012
ISSN 2162-321X E-ISSN 2162-3228
Shostack, L. G. (1977). Breaking free from product marketing. Journal of Marketing, 4, 73-80..
Tabachnick, B. G., & Fidell, L. S. (2007). Using multivariate statistics. Boston: Pearson international edition..
Yuksel, A. (2004). Shopping experience evaluation: A case of domestic and international visitors. Tourism Management, 25(6), 751–759..
Yelkur, R. (2000). Customer satisfaction and the services marketing mix Journal of professional service marketing, 21(1).Zeithaml, V. (1988). Consumer perceptions of price,quality, and value: A means- end model and synthesis of evidence. Joumai of Marketing, 52(July), 2-22.
Zeithaml, V. A. (1981). How consumer evaluation processes differ between goods and service Paper presented at the National Service Conference ED. , American Marketing Association Chicago.
Zineldin, M., & Philipson, S. (2007). Kotler and Borden are not dead: Myth of relationship marketing and truth of the 4 Ps. Journal of consumer marketing, 24(4), 229-241.