accident and emergency survey 2000/1 - rospa · dhssps accident and emergency survey 1 accident and...
TRANSCRIPT
DHSSPS Accident and Emergency Survey
1
Accident
and Emergency Survey
2000/1
Actively supported by RoSPA
DHSSPS Accident and Emergency Survey
2
Table of Content ...........................................................................................................Page I Executive Summary.................................................................................................... 3 Summary of key findings...................................................................................................... 3
II Background and Terms of Reference ....................................................................... 4 III Methodology................................................................................................................ 5 Overview of Methodology.................................................................................................... 5 IV Key findings................................................................................................................. 7 Attendance data .................................................................................................................... 7 Profile of accidents ............................................................................................................... 8 Triage code allocation........................................................................................................... 8 Injury location..................................................................................................................... 10 Type of injury ..................................................................................................................... 11 Injured body parts ............................................................................................................... 12 Causes of Accidents............................................................................................................ 14 Alcohol, Medication/drugs or Cigarettes............................................................................ 16 Demographics ..................................................................................................................... 17
DHSSPS Accident and Emergency Survey
3
I. Executive Summary 1.1 PricewaterhouseCoopers were commissioned by the Department of Health, Social
Services & Public Safety (DHSS&PS) to conduct a head count of people attending 16 accident and emergency (A&E) departments in Northern Ireland. Furthermore, interviews were conducted with individuals who were attending for the first time with accidental injuries.
1.2 In accordance with the terms of reference, the headcount has enabled the formulation of baseline data with respect to the number of people attending A&E departments with accidental injuries over the duration of a year.
1.3 In addition, more detailed information on the circumstances of the accident and the characteristics of the person concerned has been collated with emphasis on home accidents.
Summary of key findings
1.4 It is estimated that almost 175,000 accidental injuries were treated in the Province’s A&E departments in 2000.
1.5 Two thirds of accidents were classified as triage 4 and just over 2% were classified as triage 1 or 2.
1.6 The most common types of injury were bruising, lacerations and sprains and these accounted for over 80% of accidents.
1.7 Over 40% of the accidents occurred at home and over 80% of these resulted in bruising, lacerations and sprains. 42% of home accidents affected the fingers/hand, wrist and arm.
1.8 The two main activities being undertaken at the time of the home accident were walking (26%) and playing (25%). This correlates with the causes of accident which were primarily as a result of falling (on the same level) and being struck by an object. Where objects were involved in home accidents, it was mainly furniture and fixtures.
1.9 The under 10 years age group are the most likely to be involved in a home accident.
DHSSPS Accident and Emergency Survey
4
II Background and Terms of Reference 2.1 PricewaterhouseCoopers was commissioned by the Department of Health, Social
Services and Public Safety (DHSS&PS) to conduct a programme of research at 16 of the Province’s accident and emergency departments.
2.2 The objectives of this research were:
� To provide an estimate of the numbers of people with accidental injuries attending A&E departments over a six month period;
� To gather information on the characteristics of the persons concerned; and
� To gather information on the circumstances of the accident.
DHSSPS Accident and Emergency Survey
5
III Methodology
Overview of Methodology
3.1 The methodology involved face to face interviews with patients attending 16 A&E departments in addition to a head count of all patients attending A&E departments.
3.2 The field-work was conducted over 51 randomly selected 8 hour shifts in each of the hospitals over the period 8th July 2000 to 5th January 2001. The interview shifts were midnight to 8am, 8am to 4pm and 4pm to midnight.
3.3 Prior to the fieldwork commencement, a representative from the Royal Society for the Prevention of Accidents (RoSPA) attended all of the A&E departments to inform staff of the survey and to enlist co-operation for the project. The nature and scope of the research was explained to the hospital staff along with the potential benefits to the hospital. The approach that the interviewers would adopt in the A&E departments was discussed and adapted according to the recommendations of the staff.
3.4 Each hospital was sent an interview rota prior to the fieldwork.
3.5 Each interviewer was provided with a letter of introduction to be used when they attended the A&E for the first time, both to introduce themselves and to assure staff of the legitimacy of the survey. This was used on further occasions when staff who were unfamiliar with the project approached the interviewer.
3.6 In the early stages of the research, senior field managers visited each of the hospitals to ensure that there were no problems with the research and to ensure that the hospital staff were co-operating fully with the interviewers.
Face to face interviews
3.7 The interviewer liased with the triage nurse to obtain information on triage allocation and accident details before approaching the patient.
3.8 An interview was attempted with all people with accidental injury attending the A&E department for the first time classified as triage code 1,2,3, 4 or 5. Triage code 1 is reserved for life threatening injuries or illnesses, code 2 is for very serious non life threatening illnesses or injuries. Triage code 3 is reserved for serious injuries such as broken bones and fractures. Triage code 4 is for non-serious illnesses or injuries such as lacerations or wounds needing stitches and triage code 5 is for very minor injuries or illnesses, e.g., cut which does not need stitches.
3.9 In the case of serious accidental injury, the interviewers obtained guidance from the triage nurse in relation to appropriate timing to approach the injured person or their relatives.
3.10 Any refusals or non-contacts were noted on a data collection sheet.
DHSSPS Accident and Emergency Survey
6
Headcount
3.11 During the shifts when interviewing was taking place, a headcount of all patients attending the A&E department was undertaken. In the majority of cases, the interviewer liased with reception staff during and at the end of the shift to obtain details of the headcount information.
3.12 The information collated from the head count included the number of patients attending accident and emergency for the first time disaggregated by triage code. Additionally, details of people with accidental injuries attending accident and emergency for the first time by triage code was collected.
DHSSPS Accident and Emergency Survey
7
IV Key findings
Attendance data
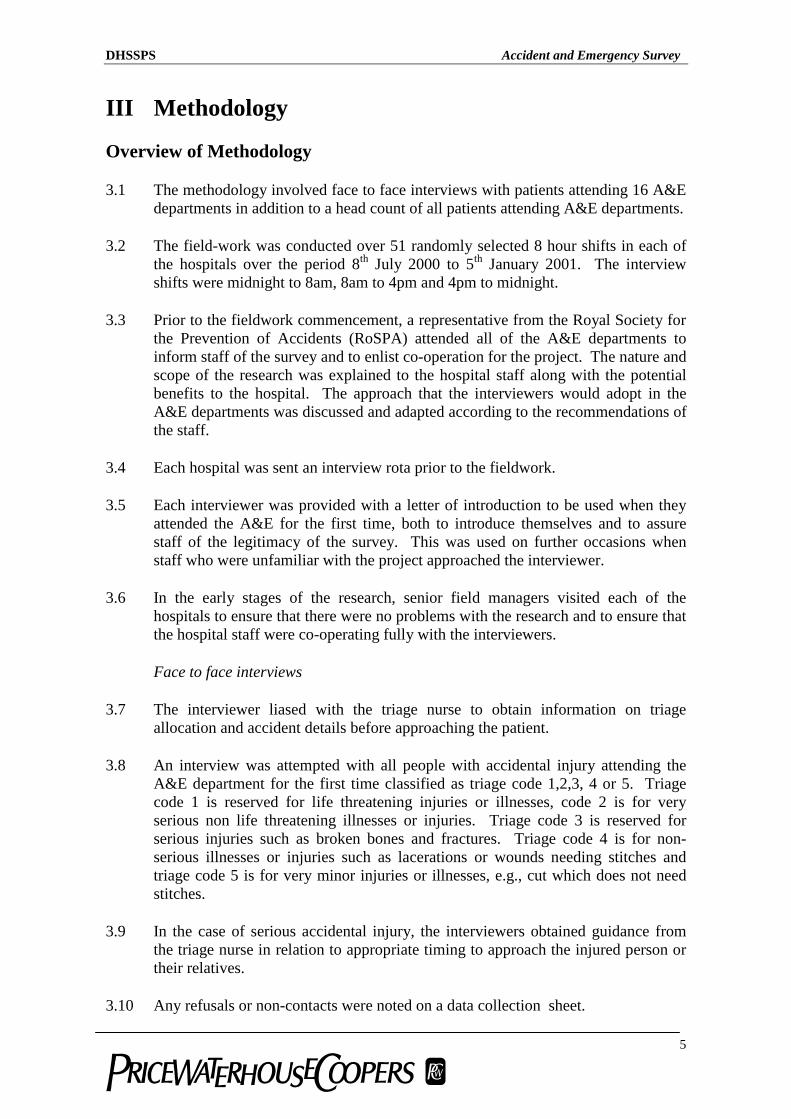
4.1 Over the six months, almost 23,000 people attended A&E departments for the first time with a particular injury. There were 8,138 accidental injuries recorded during this time and this figure grossed up for a yearly basis equates to a total of 174,967 accidents per annum. A full break down of the data obtained is detailed in the table below.
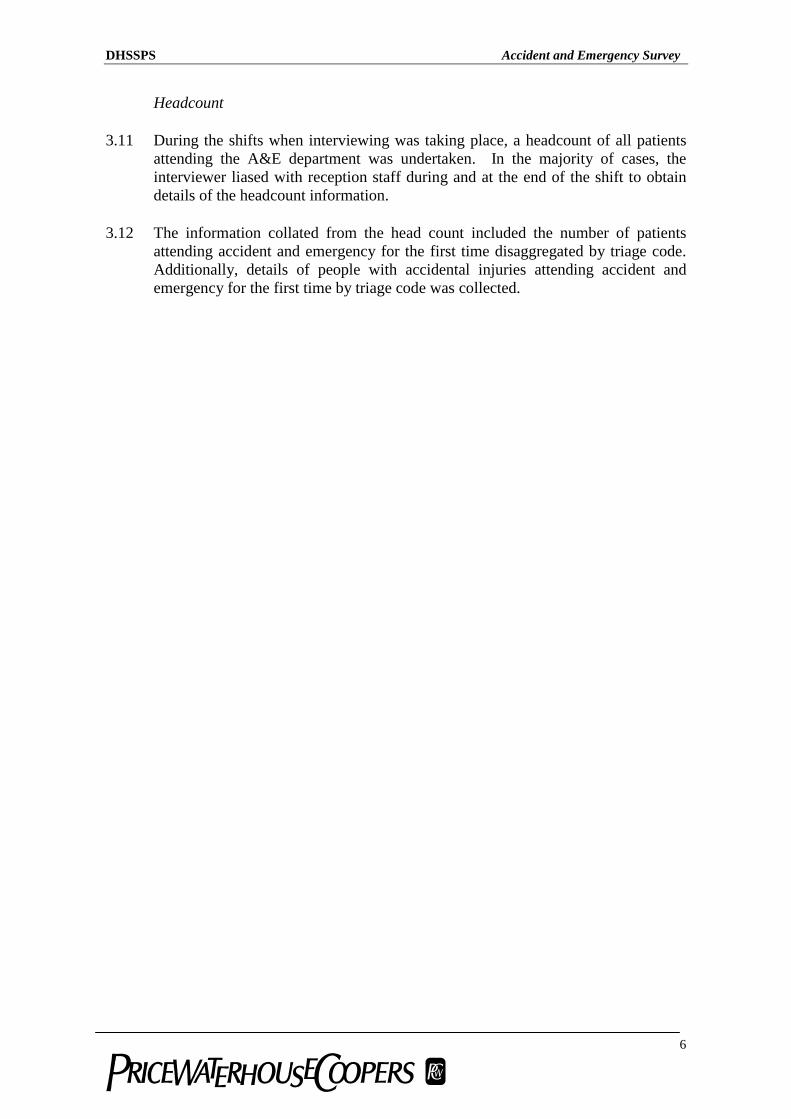
4.2 In terms of the individual A&E departments and the number of patients attending
for the first time, the Belfast Royal Hospitals combined, the Ulster Hospital, and the Belfast City Hospital had the largest attendance accounting for 14%, 10% and 10% respectively of the total for all hospitals. The Daisy Hill, Tyrone and Coleraine hospitals had the smallest attendance numbers. The results for all 16 hospitals are outlined below.
PricewaterhouseCoopers
Attendance data
Total number attending A&E for first time 22,680Total number with accidental injuries 8,138Total number interviewed 7,635
Total number of non-contacts 503Total number of refusals 249Total number of unobtainables (eg patient drunk) 95Total number not giving consent 60Total number untraceable (eg left A&E to go home) 99
PricewaterhouseCoopers
Total Number Attending for the FirstTime
PricewaterhouseCoopers
Hospitals % NumberCounted
Altnagelvin 8.7 1,962Antrim 8.9 2,014BCH 9.6 2,179Coleraine 3.5 783Craigavon 8.2 1,854Daisy Hill 1.9 428Downe 4.3 986Erne 3.3 751Lagan Valley 5.2 1,177Mater 7.6 1,724Mid-Ulster 4.0 907RBHSC 6.1 1,392RVH 7.6 1,735Tyrone 2.9 666Ulster 9.9 2,246Whiteabbey 8.3 1,876Total 100.0 22,680
6. 8
Base: All accidents
DHSSPS Accident and Emergency Survey
8
Profile of accidents
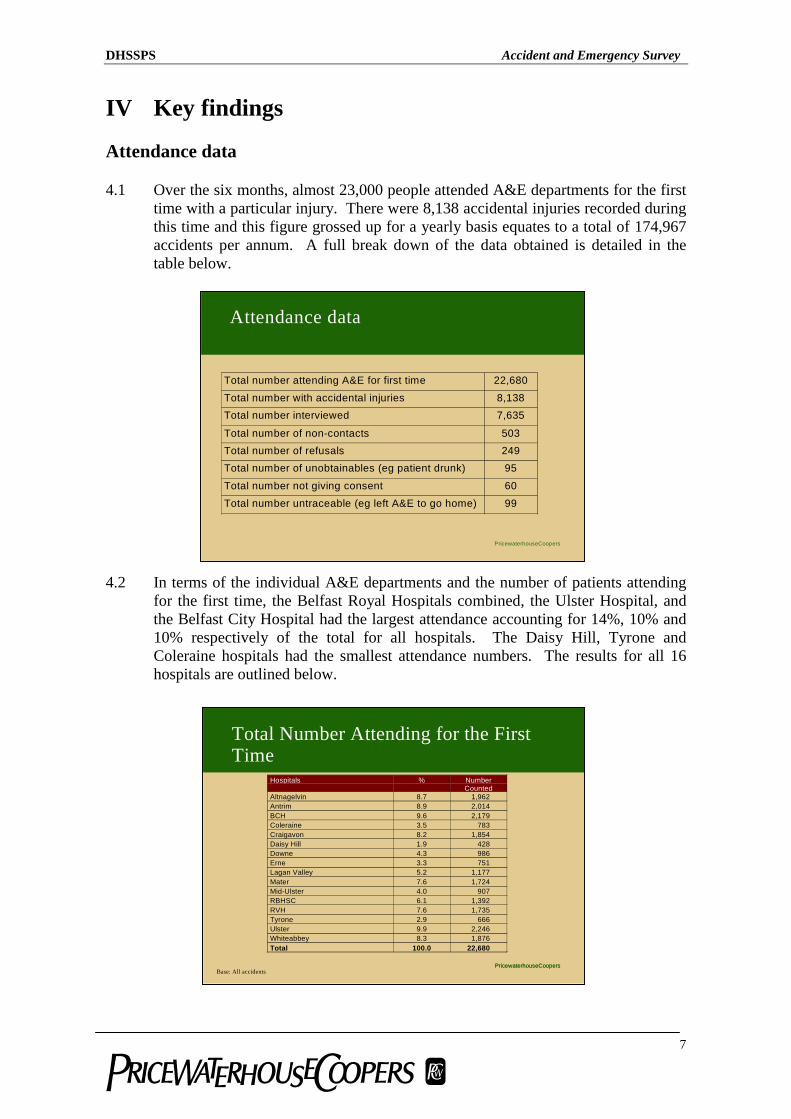
4.3 In relation specifically to accidental injuries, the Ulster Hospital, Altnagelvin and Whiteabbey hospitals, had the highest incidence during the survey time frame.
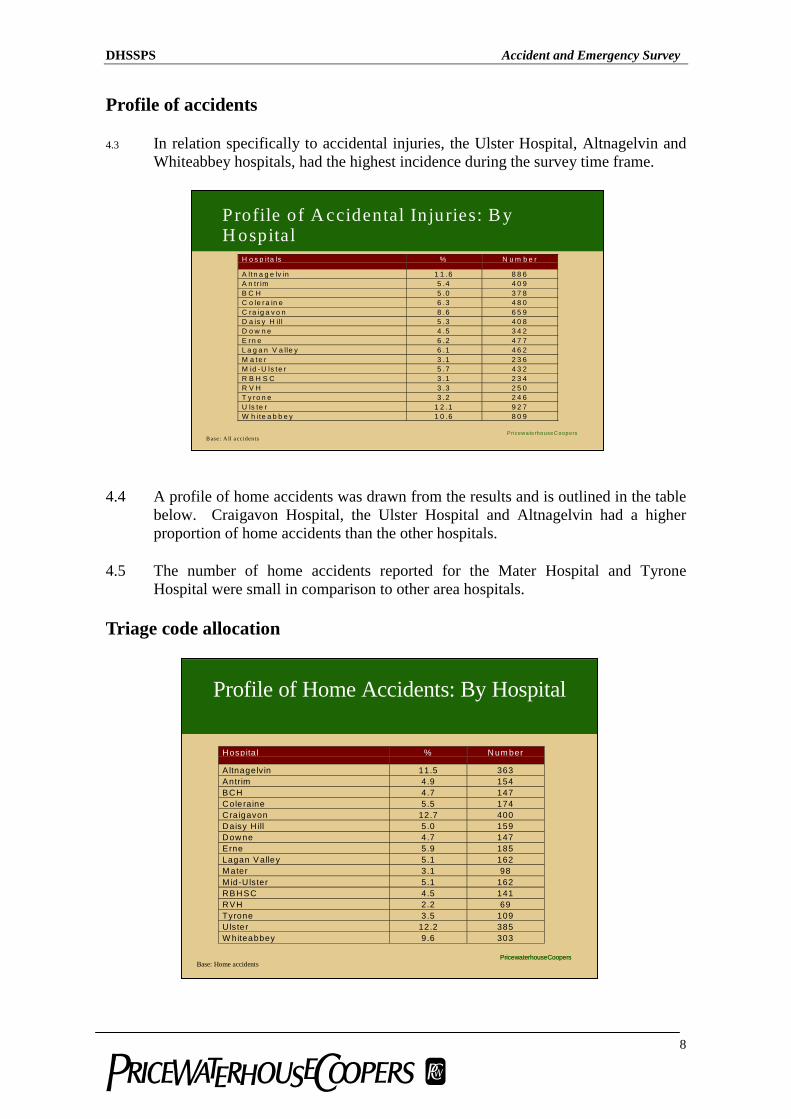
4.4 A profile of home accidents was drawn from the results and is outlined in the table below. Craigavon Hospital, the Ulster Hospital and Altnagelvin had a higher proportion of home accidents than the other hospitals.
4.5 The number of home accidents reported for the Mater Hospital and Tyrone Hospital were small in comparison to other area hospitals.
Triage code allocation
Profile of A ccidental In juries: B yH ospital
Pricewa terhouseC oopers
H o s p ita ls % N u m b e r
A ltn a g e lv in 1 1 .6 8 8 6A n tr im 5 .4 4 0 9B C H 5 .0 3 7 8C o le ra in e 6 .3 4 8 0C ra ig a v o n 8 .6 6 5 9D a is y H il l 5 .3 4 0 8D o w n e 4 .5 3 4 2E rn e 6 .2 4 7 7L a g a n V a lle y 6 .1 4 6 2M a te r 3 .1 2 3 6M id -U ls te r 5 .7 4 3 2R B H S C 3 .1 2 3 4R V H 3 .3 2 5 0T y ro n e 3 .2 2 4 6U ls te r 1 2 .1 9 2 7W h ite a b b e y 1 0 .6 8 0 9
6. 8
B ase : A ll acciden ts
PricewaterhouseCoopers
Profile of Home Accidents: By Hospital
PricewaterhouseCoopers
Hospita l % N um ber
A ltnage lv in 11.5 363Antrim 4.9 154BCH 4.7 147Coleraine 5.5 174Craigavon 12.7 400Daisy H ill 5.0 159Dow ne 4.7 147Erne 5.9 185Lagan V alley 5.1 162M ater 3.1 98M id-U lster 5.1 162RBH SC 4.5 141RVH 2.2 69Tyrone 3.5 109Ulster 12.2 385W hiteabbey 9.6 303
6. 8
Base: Home accidents
DHSSPS Accident and Emergency Survey
9
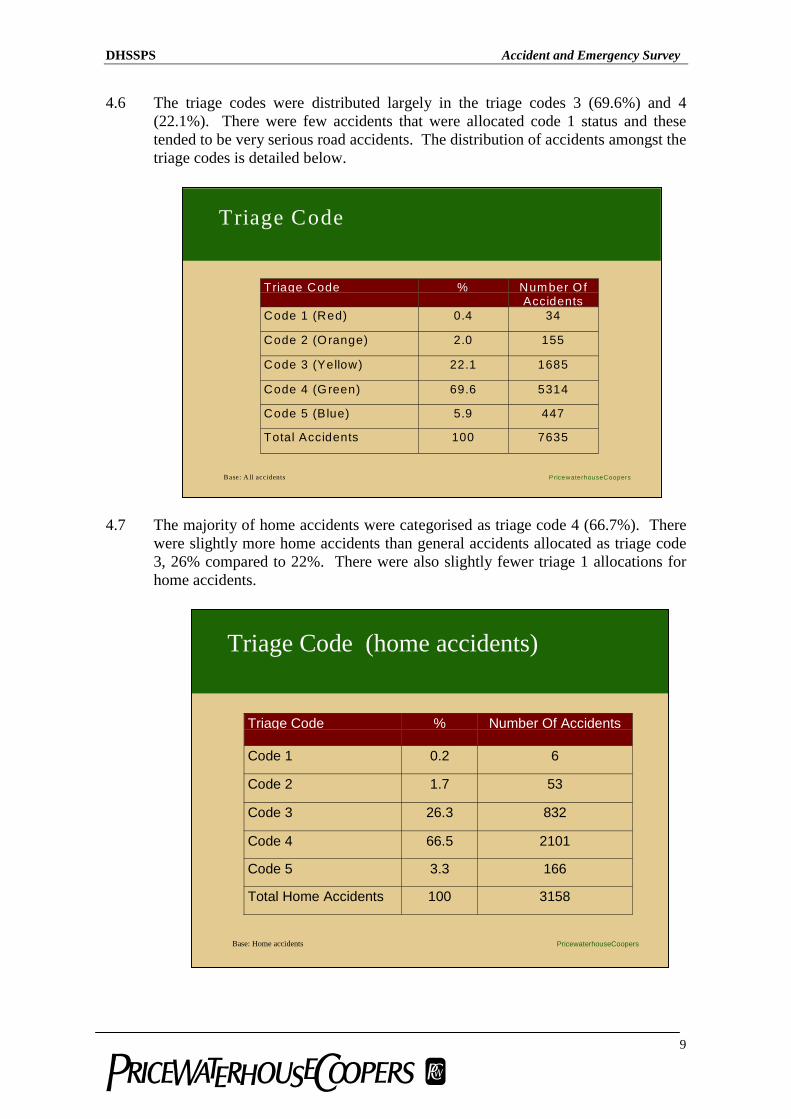
4.6 The triage codes were distributed largely in the triage codes 3 (69.6%) and 4 (22.1%). There were few accidents that were allocated code 1 status and these tended to be very serious road accidents. The distribution of accidents amongst the triage codes is detailed below.
4.7 The majority of home accidents were categorised as triage code 4 (66.7%). There
were slightly more home accidents than general accidents allocated as triage code 3, 26% compared to 22%. There were also slightly fewer triage 1 allocations for home accidents.
Triage Code (home accidents)
PricewaterhouseCoopers
Triage Code % Number Of Accidents
Code 1 0.2 6
Code 2 1.7 53
Code 3 26.3 832
Code 4 66.5 2101
Code 5 3.3 166
Total Home Accidents 100 3158
Base: Home accidents
Triage Code
PricewaterhouseCoopers
Triage Code % Number OfAccidents
Code 1 (Red) 0.4 34
Code 2 (Orange) 2.0 155
Code 3 (Yellow) 22.1 1685
Code 4 (Green) 69.6 5314
Code 5 (Blue) 5.9 447
Total Accidents 100 7635
Base: A ll accidents
DHSSPS Accident and Emergency Survey
10
Injury location
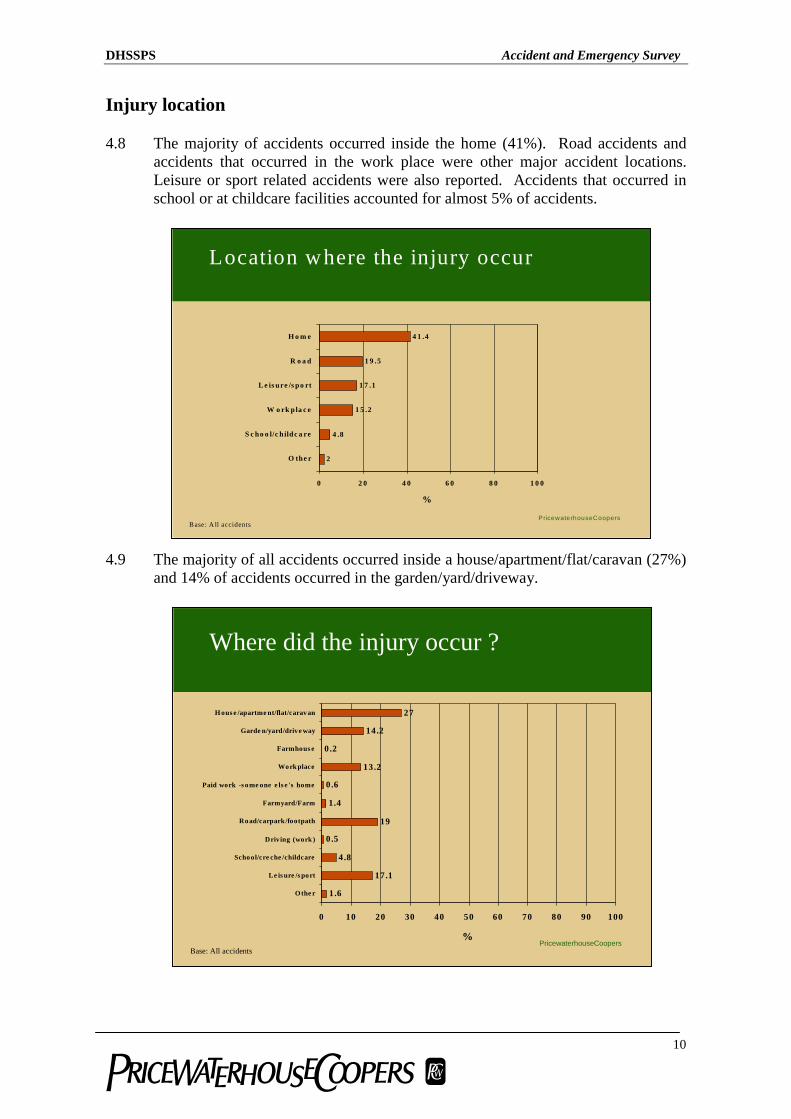
4.8 The majority of accidents occurred inside the home (41%). Road accidents and accidents that occurred in the work place were other major accident locations. Leisure or sport related accidents were also reported. Accidents that occurred in school or at childcare facilities accounted for almost 5% of accidents.
4.9 The majority of all accidents occurred inside a house/apartment/flat/caravan (27%)
and 14% of accidents occurred in the garden/yard/driveway.
Location where the injury occur
PricewaterhouseCoopers
2
4 .8
1 5 .2
1 7 .1
1 9 .5
4 1 .4
0 2 0 4 0 6 0 8 0 1 0 0
O the r
S c ho o l/c h ildc a re
W o rk pla c e
L e is ure /s po rt
R o a d
H o m e
%
Base: A ll accidents
Where did the injury occur ?
PricewaterhouseCoopers
1.6
17.1
4.8
0.5
19
1.4
0.6
13.2
0.2
14.2
27
0 10 20 30 40 50 60 70 80 90 100
Othe r
Le is ure /s port
School/cre che /childcare
Driving (work )
Road/carpark/footpath
Farmyard/Farm
Paid work -s ome one e ls e 's home
Work place
Farmhous e
Garde n/yard/drive way
H ous e /apartme nt/flat/caravan
%Base: All accidents
DHSSPS Accident and Emergency Survey
11
4.10 Of the home accidents, 65% occurred inside the home and 34% occurred directly outside the home i.e. in the garden, yard, driveway, path and steps.
Type of injury
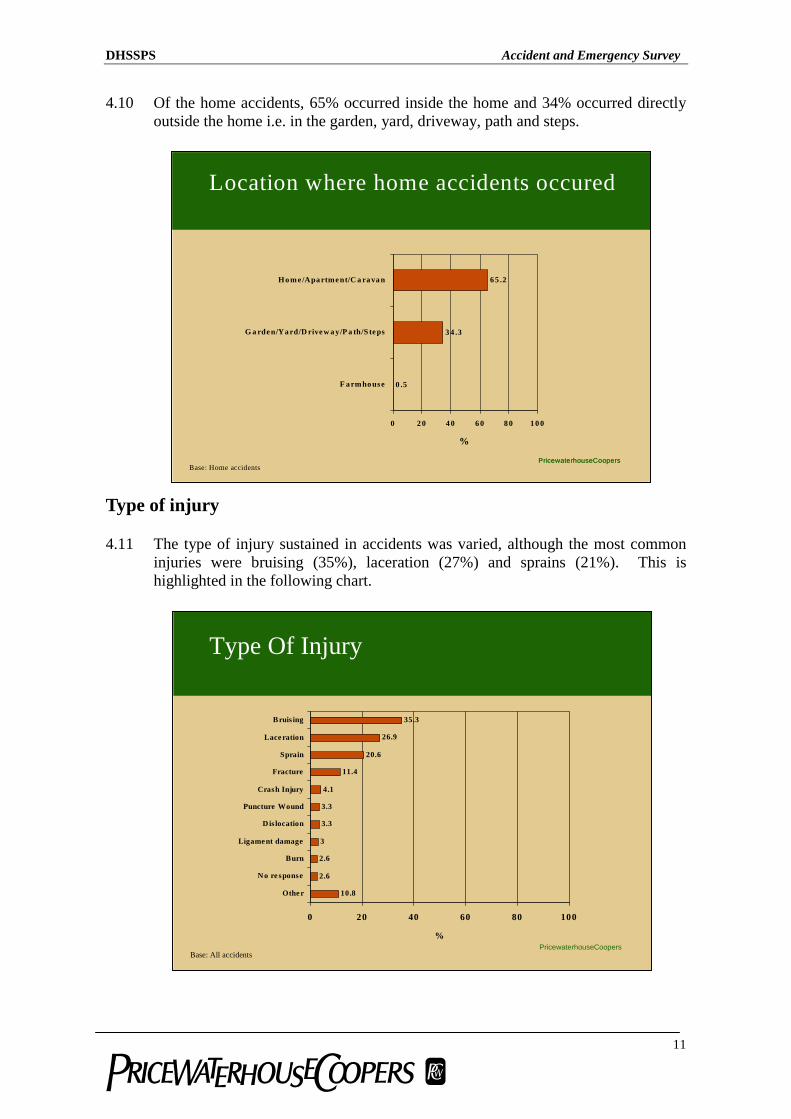
4.11 The type of injury sustained in accidents was varied, although the most common injuries were bruising (35%), laceration (27%) and sprains (21%). This is highlighted in the following chart.
PricewaterhouseCoopers
Location where home accidents occured
PricewaterhouseCoopers
0 .5
3 4 .3
6 5 .2
0 2 0 4 0 6 0 8 0 1 0 0
F a rm ho use
G a rde n/Ya rd/D rive w a y/P a th/S te ps
Ho m e /Apa rtme nt/C a ra va n
%
Base: Home accidents
Type Of Injury
PricewaterhouseCoopers
10.8
2.6
2.6
3
3.3
35.3
11.4
20.6
26.9
3.3
4.1
0 20 40 60 80 100
Othe r
No re sponse
Burn
Ligament damage
Dis location
Puncture Wound
Crash Injury
Fracture
Sprain
Lace ration
Bruis ing
%
Base: All accidents
DHSSPS Accident and Emergency Survey
12
4.12 In home accidents, the incidence of lacerations increased, accounting for almost 32% of home accidents compared to almost 27% of all accidents. Burns were also more prevalent amongst home accidents.
Injured body parts
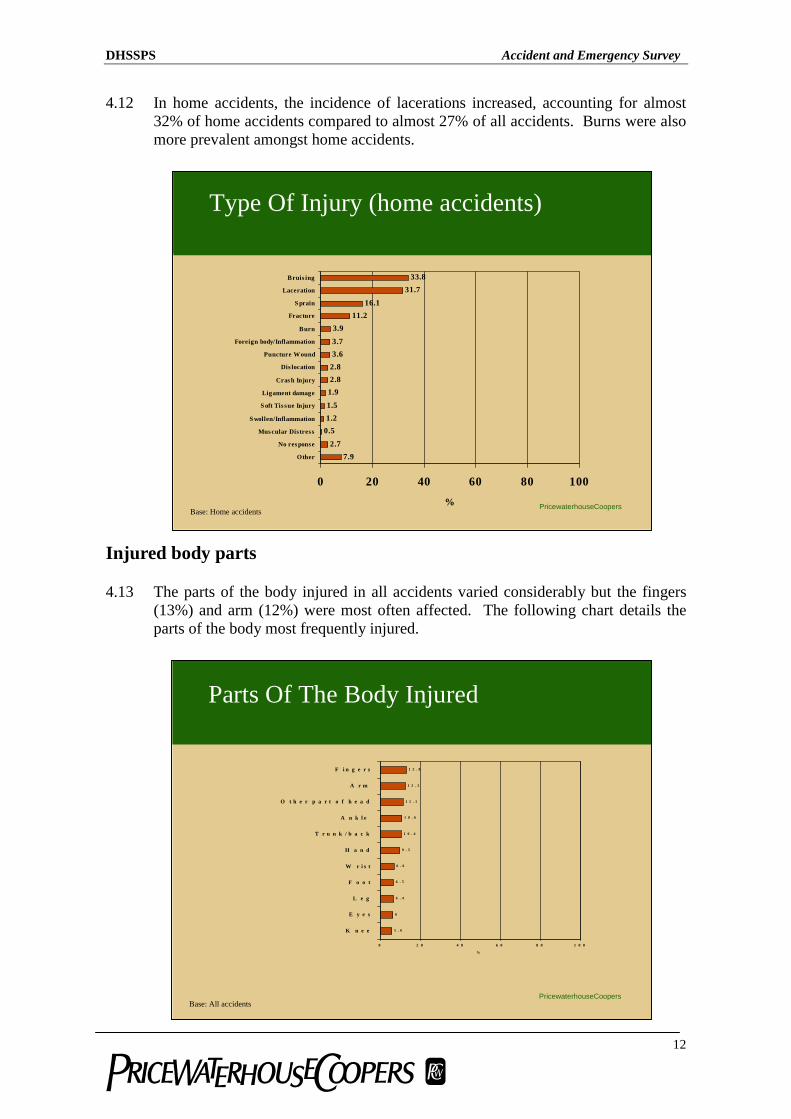
4.13 The parts of the body injured in all accidents varied considerably but the fingers (13%) and arm (12%) were most often affected. The following chart details the parts of the body most frequently injured.
PricewaterhouseCoopers
Type Of Injury (home accidents)
7.92.7
0.51.21.5
3.911.2
16.131.7
33.8
2.83.63.7
1.92.8
0 20 40 60 80 100
Other
No res ponse
Mus cular Distress
S wollen/Inflammation
S oft Tis sue Injury
Ligament damage
Cras h Injury
Dis location
Puncture Wound
Foreign body/Inflammation
Burn
Fracture
S prain
Laceration
Bruis ing
%Base: Home accidents
Parts Of The Body Injured
PricewaterhouseCoopers
5 . 6
6
6 . 4
6 . 5
6 . 6
9 . 5
1 0 . 4
1 0 . 6
1 1 . 1
1 2 . 2
1 2 . 8
0 2 0 4 0 6 0 8 0 1 0 0
K n e e
E y e s
L e g
F o o t
W r i s t
H a n d
T r u n k / b a c k
A n k l e
O t h e r p a r t o f h e a d
A r m
F i n g e r s
%
Base: All accidents
DHSSPS Accident and Emergency Survey
13
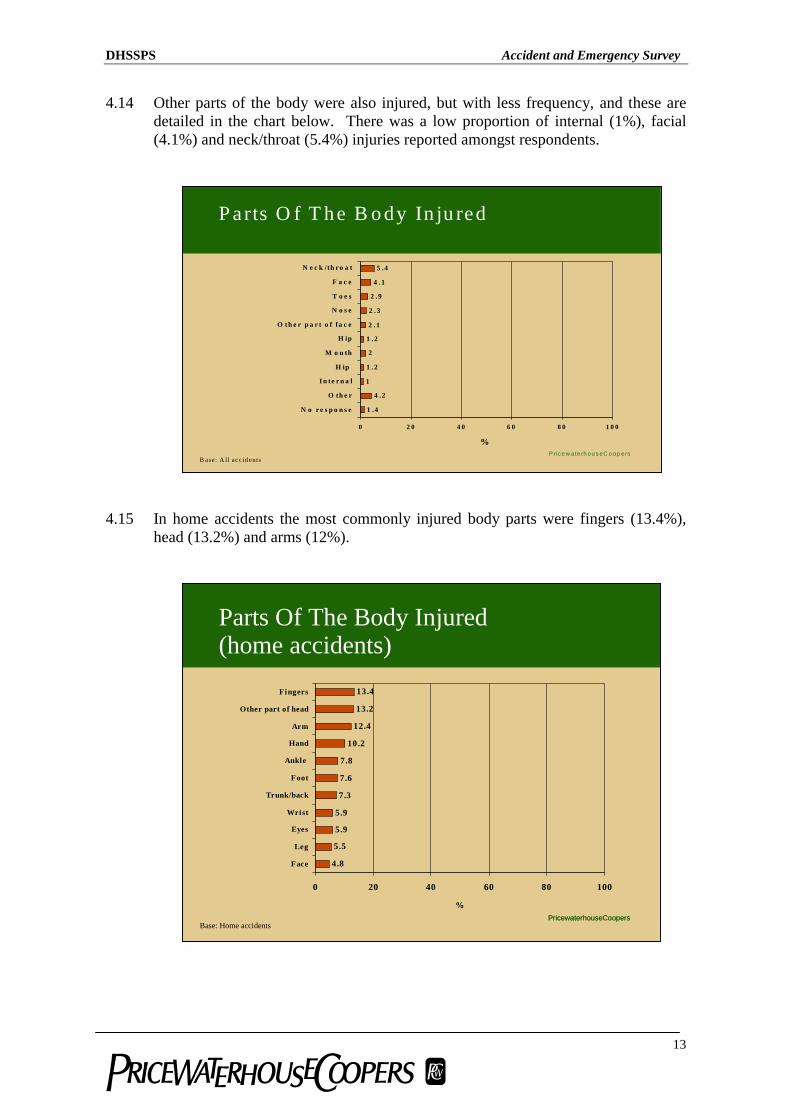
4.14 Other parts of the body were also injured, but with less frequency, and these are detailed in the chart below. There was a low proportion of internal (1%), facial (4.1%) and neck/throat (5.4%) injuries reported amongst respondents.
4.15 In home accidents the most commonly injured body parts were fingers (13.4%), head (13.2%) and arms (12%).
P a rts O f T he B o dy In ju red
P rice w a te rh ou s eC o op ers
1 .4
4 .2
1
1 . 2
2
1 . 2
2 . 1
2 .3
2 .9
4 .1
5 .4
0 2 0 4 0 6 0 8 0 1 0 0
N o r e s p o n s e
O th e r
I n te r n a l
H ip
M o u th
H ip
O th e r p a r t o f fa c e
N o s e
T o e s
F a c e
N e c k /th ro a t
%
B ase: A ll ac c id ents
PricewaterhouseCoopers
Parts Of The Body Injured(home accidents)
PricewaterhouseCoopers
4.8
5.5
5.9
5.9
7.3
7.6
7.8
10.2
12.4
13.2
13.4
0 20 40 60 80 100
Face
Leg
Eyes
Wrist
Trunk/back
Foot
Ankle
Hand
Arm
Other part of head
Fingers
%
Base: Home accidents
DHSSPS Accident and Emergency Survey
14
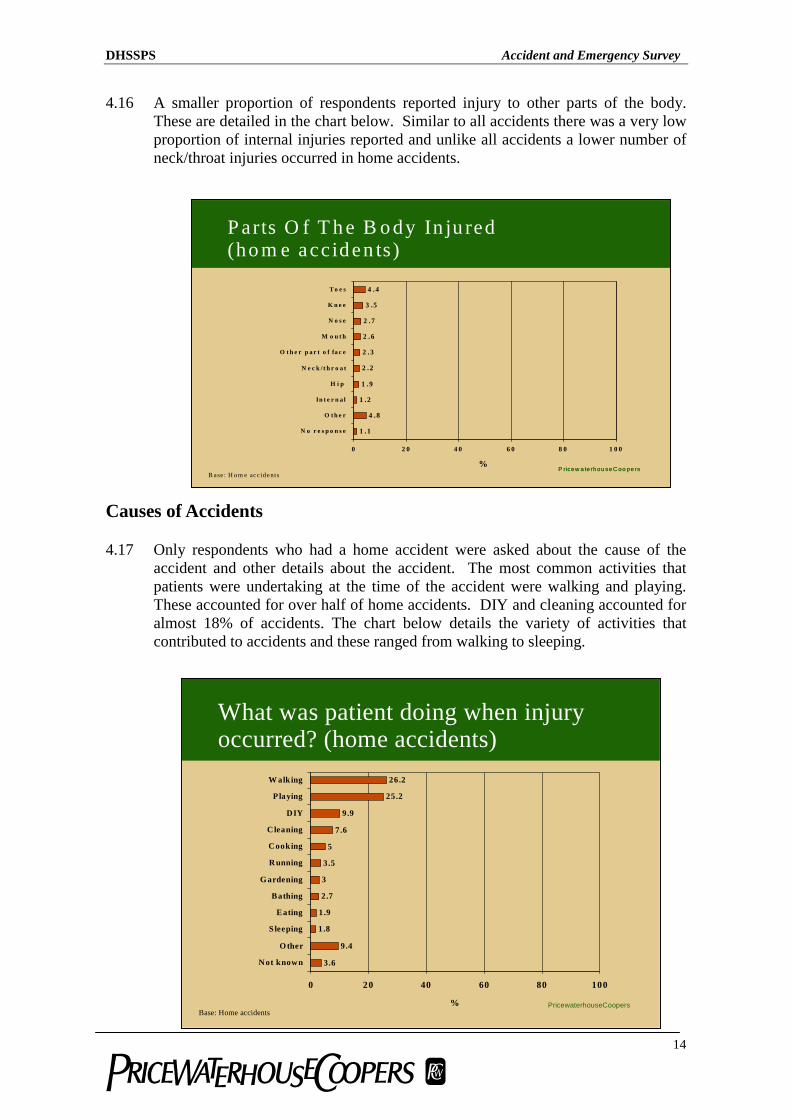
4.16 A smaller proportion of respondents reported injury to other parts of the body. These are detailed in the chart below. Similar to all accidents there was a very low proportion of internal injuries reported and unlike all accidents a lower number of neck/throat injuries occurred in home accidents.
Causes of Accidents
4.17 Only respondents who had a home accident were asked about the cause of the accident and other details about the accident. The most common activities that patients were undertaking at the time of the accident were walking and playing. These accounted for over half of home accidents. DIY and cleaning accounted for almost 18% of accidents. The chart below details the variety of activities that contributed to accidents and these ranged from walking to sleeping.
P ricew a te rhou se C oo pe rs
P arts O f T h e B o dy In ju red(ho m e acc iden ts)
P ricew a te rhou se C oo pe rs
1 .1
4 .8
1 .2
1 .9
2 .2
2 .3
2 .6
2 .7
3 .5
4 .4
0 2 0 4 0 6 0 8 0 1 0 0
N o r e s p o n s e
O t h e r
In t e r n a l
H i p
N e c k / t h r o a t
O t h e r p a r t o f fa c e
M o u t h
N o s e
K n e e
T o e s
%B ase : H om e acc idents
What was patient doing when injuryoccurred? (home accidents)
PricewaterhouseCoopers
3.6
9.4
1.8
1.9
2.7
3
3.5
5
7.6
9.9
25.2
26.2
0 20 40 60 80 100
Not known
O ther
Sleeping
Eating
Bathing
G ardening
Running
Cooking
Cleaning
DIY
Playing
W alking
%Base: Home accidents
DHSSPS Accident and Emergency Survey
15
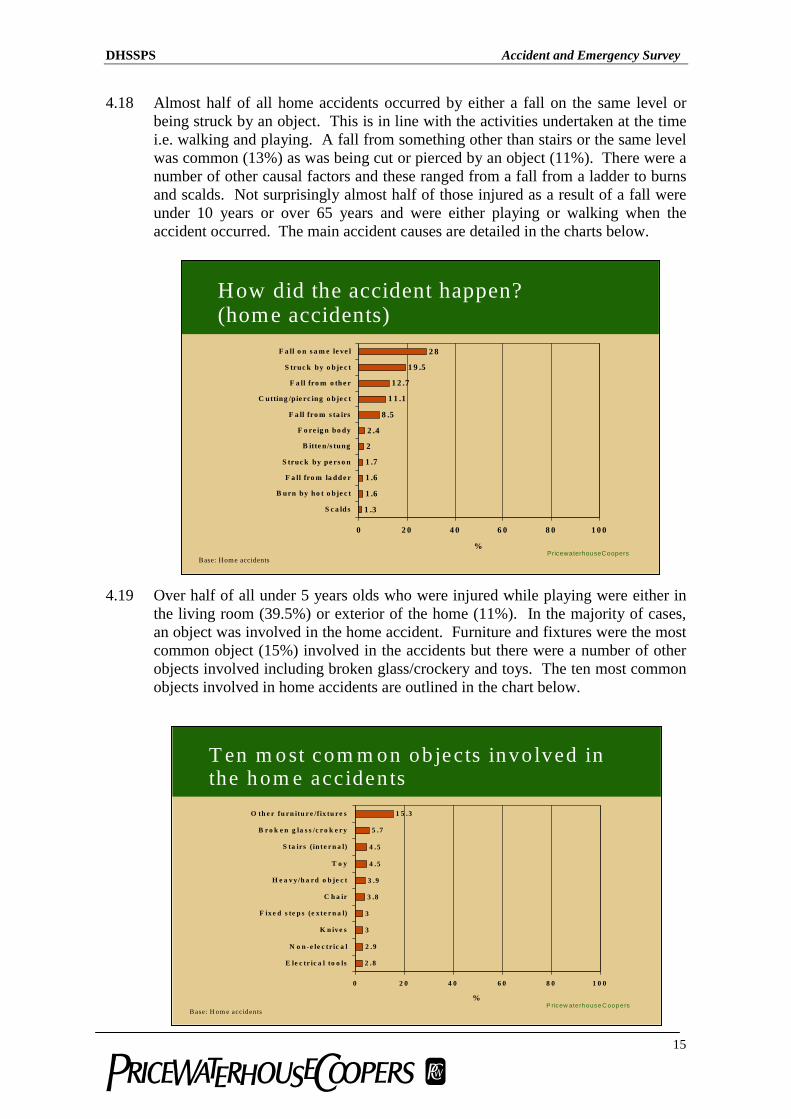
4.18 Almost half of all home accidents occurred by either a fall on the same level or being struck by an object. This is in line with the activities undertaken at the time i.e. walking and playing. A fall from something other than stairs or the same level was common (13%) as was being cut or pierced by an object (11%). There were a number of other causal factors and these ranged from a fall from a ladder to burns and scalds. Not surprisingly almost half of those injured as a result of a fall were under 10 years or over 65 years and were either playing or walking when the accident occurred. The main accident causes are detailed in the charts below.
4.19 Over half of all under 5 years olds who were injured while playing were either in
the living room (39.5%) or exterior of the home (11%). In the majority of cases, an object was involved in the home accident. Furniture and fixtures were the most common object (15%) involved in the accidents but there were a number of other objects involved including broken glass/crockery and toys. The ten most common objects involved in home accidents are outlined in the chart below.
How did the accident happen?(home accidents)
PricewaterhouseCoopers
1 .3
1 .6
1 .6
1 .7
2
2 .4
8 .5
1 1 .1
1 2 .7
1 9 .5
2 8
0 2 0 4 0 6 0 8 0 1 0 0
S c a ld s
B urn by ho t o bje c t
F a ll fro m la dd e r
S truc k by pe rs o n
B itte n/s tung
F o re ig n bo dy
F a ll fro m s ta irs
C utting /pie rc ing o bje c t
F a ll fro m o th e r
S truc k by o bje c t
F a ll o n s a m e le ve l
%Base: Home accidents
T en m ost com m on ob jects invo lved inthe hom e acciden ts
P ricew ate rh ouse C oop ers
2 .8
2 .9
3
3
3 .8
3 .9
4 .5
4 .5
5 .7
1 5 .3
0 2 0 4 0 6 0 8 0 1 0 0
E le c tr ic a l to o ls
N o n -e le c tr ic a l
K n iv e s
F ix e d s te p s (e x te r n a l)
C h a ir
H e a v y /h a rd o b je c t
T o y
S ta irs ( in te r n a l)
B r o k e n g la s s /c r o k e r y
O th e r fu rn itu r e /f ix tu re s
%
B ase: H om e acciden ts
DHSSPS Accident and Emergency Survey
16
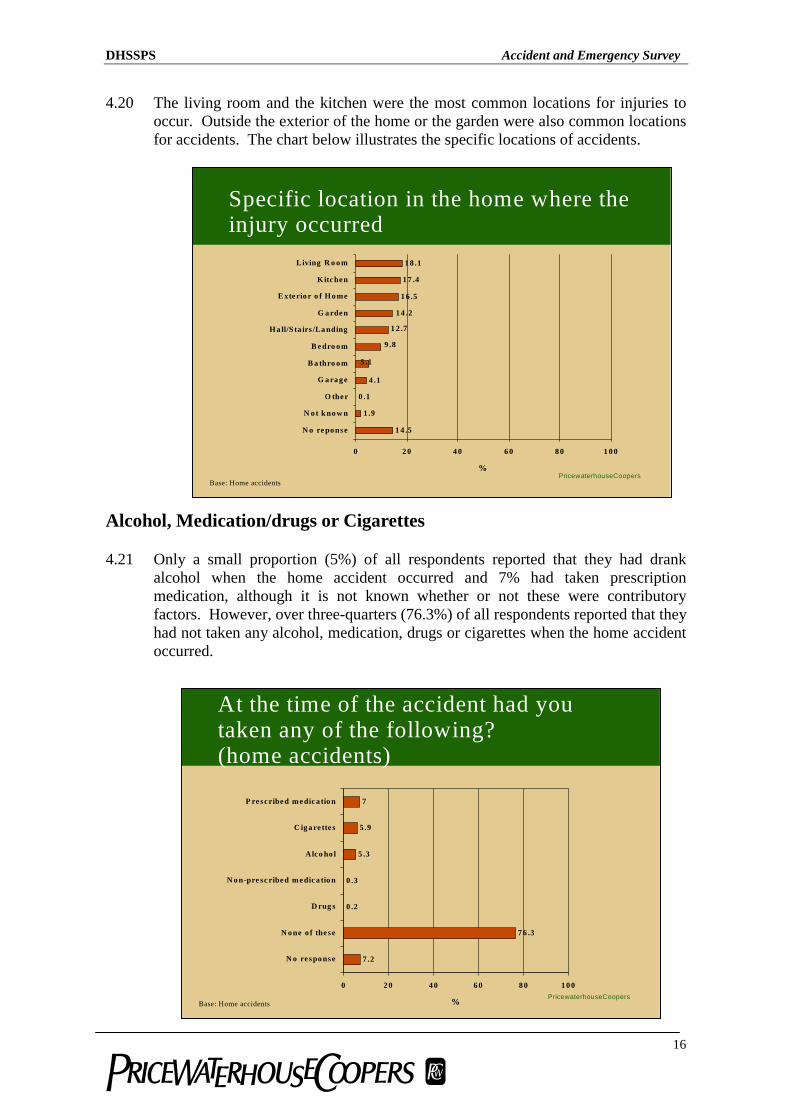
4.20 The living room and the kitchen were the most common locations for injuries to occur. Outside the exterior of the home or the garden were also common locations for accidents. The chart below illustrates the specific locations of accidents.
Alcohol, Medication/drugs or Cigarettes
4.21 Only a small proportion (5%) of all respondents reported that they had drank alcohol when the home accident occurred and 7% had taken prescription medication, although it is not known whether or not these were contributory factors. However, over three-quarters (76.3%) of all respondents reported that they had not taken any alcohol, medication, drugs or cigarettes when the home accident occurred.
At the time of the accident had youtaken any of the following?(home accidents)
PricewaterhouseCoopers
7 .2
7 6 .3
0 .2
0 .3
5 .3
5 .9
7
0 2 0 4 0 6 0 8 0 1 0 0
N o re spo nse
N o ne o f the se
D rug s
N o n-pre sc ribe d me dic a tio n
Alc o ho l
C ig a re tte s
P re sc ribe d m e dic a tio n
%Base: Home accidents
Specific location in the home where theinjury occurred
PricewaterhouseCoopers
1 4 .5
1 .9
0 .1
4 .1
1 6 .5
1 7 .4
1 8 .1
1 4 .2
1 2 .7
9 .8
5 .1
0 2 0 4 0 6 0 8 0 1 0 0
N o re po nse
N o t k no w n
O the r
G a ra g e
B a thro o m
B e dro o m
Ha ll/S ta irs /La nding
G a rde n
E xte rio r o f Ho me
Kitc he n
Living R o o m
%Base: Home accidents

DHSSPS Accident and Emergency Survey
17
Demographics
4.22 The distribution of age ranges of those that had had an accident are presented in the chart below and are compared to the age ranges of the population. Accidents with the under 5 years age group were common, as were accidents amongst the 10-15 years and the 16-24 years age groups. It is interesting to note that during this period, there were fewer accidents in the older age groups.
Age of injured person (all accidents)
PricewaterhouseCoopers
0.9
7 .3
4 .9
7 .8
12 .2
16 .2
19 .3
13 .8
8 .1
9 .4
0 20 40 60 80 100
N ot know n
65+
55 to 6 4
45 to 5 4
35 to 4 4
25 to 3 4
16 to 2 4
10 to 1 5
5 to 9
Under 5
%Base: All accidents
PopulationSurvey
13
9.4
11 .6
14 .3
15 .1
12 .6
9 .4
7 .5
7
0 20 40 60 80 100
N ot know n
65+
55 to 64
45 to 54
35 to 44
25 to 34
16 to 24
10 to 15
5 to 9
Under 5
%
DHSSPS Accident and Emergency Survey
18
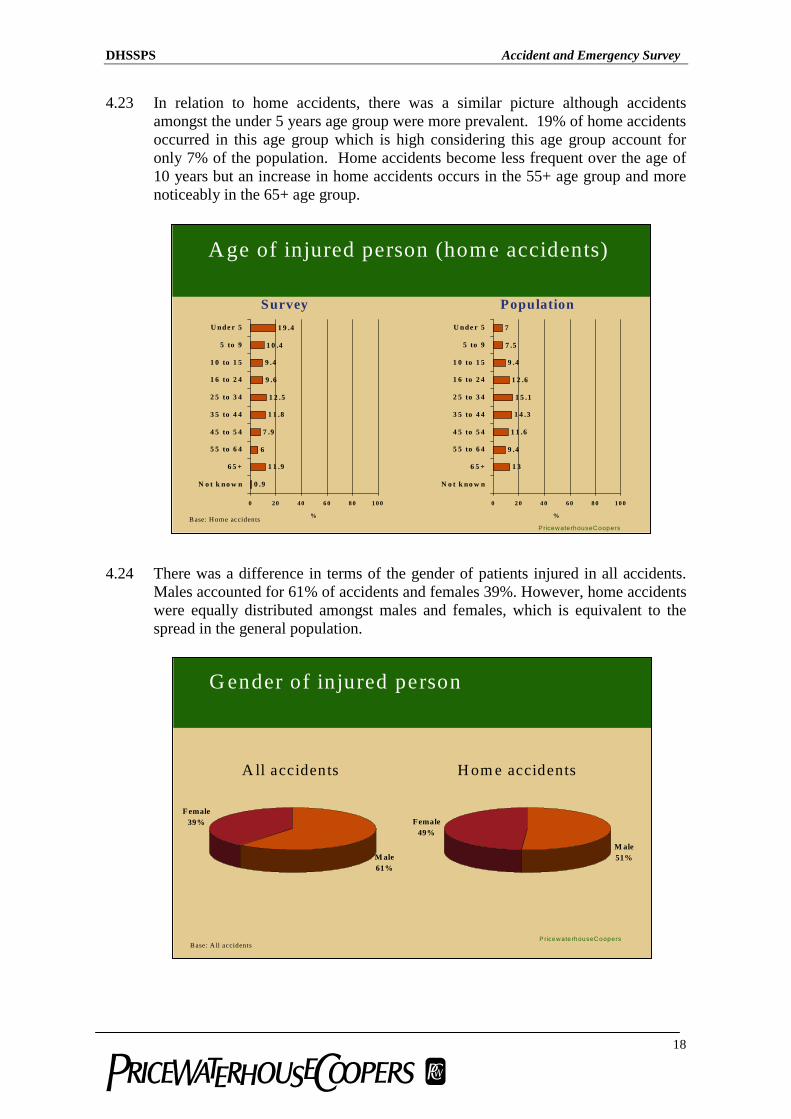
4.23 In relation to home accidents, there was a similar picture although accidents amongst the under 5 years age group were more prevalent. 19% of home accidents occurred in this age group which is high considering this age group account for only 7% of the population. Home accidents become less frequent over the age of 10 years but an increase in home accidents occurs in the 55+ age group and more noticeably in the 65+ age group.
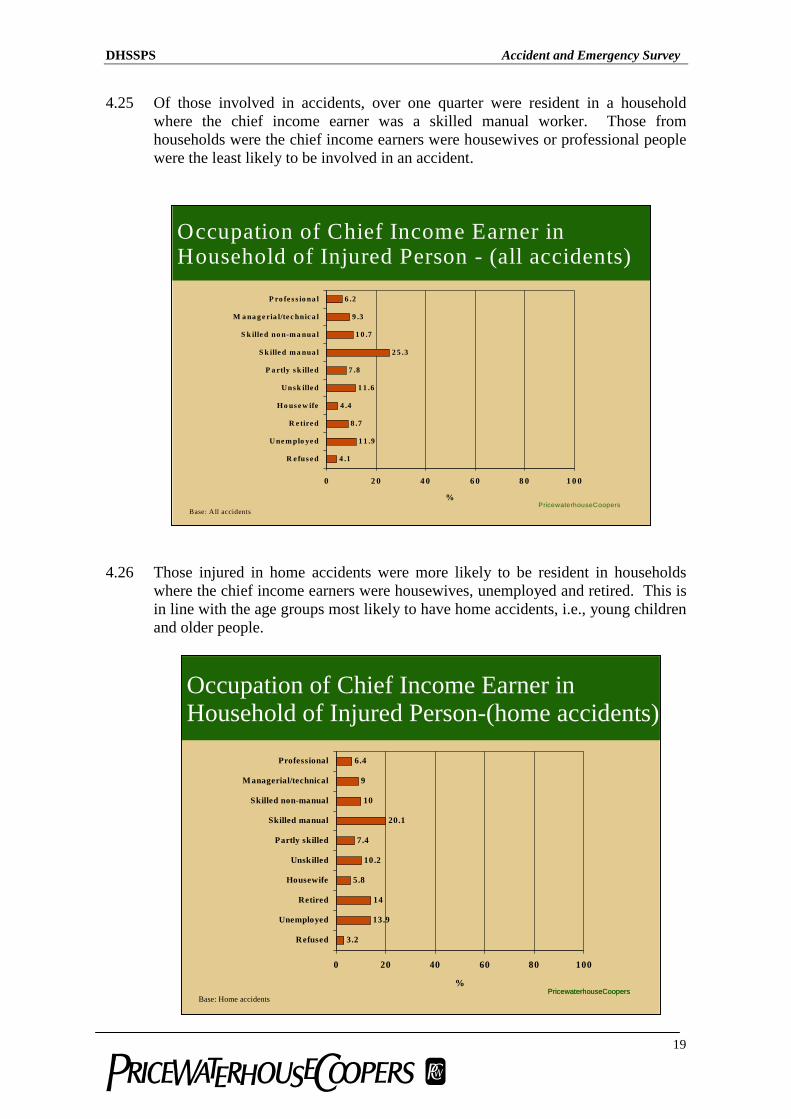
4.24 There was a difference in terms of the gender of patients injured in all accidents. Males accounted for 61% of accidents and females 39%. However, home accidents were equally distributed amongst males and females, which is equivalent to the spread in the general population.
G ender of injured person
PricewaterhouseCoopers
M ale61%
F emale39%
B ase: A ll accidents
M ale51%
Female49%
A ll accidents H om e accidents
Age of injured person (hom e accidents)
PricewaterhouseCoopers
0 .9
1 1 .9
6
7 .9
1 1 .8
1 2 .5
9 .6
9 .4
1 0 .4
1 9 .4
0 20 40 6 0 8 0 1 0 0
N o t k no w n
6 5 +
5 5 to 6 4
4 5 to 5 4
3 5 to 4 4
2 5 to 3 4
1 6 to 2 4
1 0 to 1 5
5 to 9
U nde r 5
%Base: H ome accidents
PopulationSurvey
1 3
9 .4
1 1 .6
1 4 .3
1 5 .1
1 2 .6
9 .4
7 .5
7
0 2 0 4 0 6 0 8 0 10 0
N o t k no w n
6 5 +
5 5 to 6 4
4 5 to 5 4
3 5 to 4 4
2 5 to 3 4
1 6 to 2 4
1 0 to 1 5
5 to 9
U nde r 5
%
DHSSPS Accident and Emergency Survey
19
4.25 Of those involved in accidents, over one quarter were resident in a household where the chief income earner was a skilled manual worker. Those from households were the chief income earners were housewives or professional people were the least likely to be involved in an accident.
4.26 Those injured in home accidents were more likely to be resident in households where the chief income earners were housewives, unemployed and retired. This is in line with the age groups most likely to have home accidents, i.e., young children and older people.
Occupation of Chief Income Earner inHousehold of Injured Person - (all accidents)
PricewaterhouseCoopers
4 .1
1 1 .9
8 .7
4 .4
1 1 .6
7 .8
2 5 .3
1 0 .7
9 .3
6 .2
0 2 0 4 0 6 0 8 0 1 0 0
R e fus e d
U ne m plo ye d
R e tire d
Ho us e w ife
Unsk ille d
P a rtly s k ille d
S k ille d m a nua l
S k ille d no n-m a nua l
M a na g e ria l/te c hnic a l
P ro fe s s io na l
%Base: All accidents
PricewaterhouseCoopers
Occupation of Chief Income Earner inHousehold of Injured Person-(home accidents)
PricewaterhouseCoopers
3.2
13.9
14
5.8
10.2
7.4
20.1
10
9
6.4
0 20 40 60 80 100
Refused
Unemployed
Retired
Housewife
Unskilled
Partly skilled
Skilled manual
Skilled non-manual
Managerial/technical
Professional
%Base: Home accidents

APPENDIX A Questionnaire
APPENDIX B Tabulations