accident configurations and injuries for bicyclists based on german in-depth-accident...
TRANSCRIPT
1
Accident configurations and injuries for bicyclists based on German In-Depth-Accident Study
Chiara Orsi1, Dietmar Otte2, Cristina Montomoli1, Anna Morandi1
1. University of Pavia, Centro Interdipartimentale di Studi e Ricerche sulla Sicurezza Stradale
2. University of Hannover, Accident Research Unit
Introduction
Road traffic deaths, disabilities, and injuries are a major global public health issue. Worldwide, the number of
people killed in road traffic crashes each year is estimated around 1.3 million (World Health Organization
2009). In addition, between 20 and 50 million people globally are estimated to be injured or disabled each
year. In the European Union – with about 500 million inhabitants and 230 million motor vehicles – a total of
1,200,000 injuries and 34,500 deaths occur every year from road crashes (European Commission 2012a).
Vulnerable road users – in particular bicyclists - play an important role in this context: in the European Union,
of all journeys, 20-40% are travelled by cycle or on foot (European Commission 2012b).
Bicycle riding is becoming a popular means of transportation: the bicycle is used for short trips to shops and
for leisure purposes; however, cycling is also a common way for commuting. The reasons of this phenomenon
are several: the sharp increase in traffic in urban areas, a greater awareness among people about the
environmental risk of pollution, economic reasons, health promotion.
Given this popularity, it is not surprising that cycling injuries and fatalities can and do occur: of all traffic
fatalities in Europe, the proportion of bicyclist fatalities is about 6%( European Commission 2012b).
Moreover, 80% of vehicles striking cyclists are four-wheeled motor vehicles, as passenger cars, trucks, buses
(European Commission 2012b), with a high risk of death as well as of severe injuries for the cyclist (Boström
and Nilsson 2001). Indeed, bicyclists rank among the most exposed participants in traffic, who suffer injuries in
case of an accident: compared to cars, bicycles have reduced visibility, are less stable, and offer less
protection to the driver. Considering the unprotected body in comparison to the passenger car, the bicyclist
usually separates from his bicycle and hits the hard, non-deformable structures of other vehicles or
infrastructures, and suffers the most severe consequences.
The majority of bicycle-related injuries are head injuries (Lustenberger et al. 2010, Styrke et al. 2007) and
extremities fractures (Bostrom e Nilsson 2001, Eid et al. 2007, Lustenberger et al. 2010, Richter et al. 2005,
Richter et al. 2007, Rosenkranz e Sheridan 2003).
Aim of the present study is to evaluate which are the most common types of accident involving bicycles and to
compare the frequency of injuries, in order to understand which are the most dangerous situations for
bicyclists and to suggest appropriate preventive actions.
2
Materials and methods
Data sources and data collection
The data source was the German In-Depth Accident Study (GIDAS) database.
GIDAS is the largest in-depth accident study in Germany. The project is supported by the Federal Highway
Research Institute (BASt) and the German Association for Research in Automobile Technology (FAT). The
research institutes involved are the Medical University of Hannover and the Dresden Technical University.
Within the study, a sample of accidents occurring in the areas of Hannover and Dresden is investigated. In the
both areas, the respective police, rescue services, and fire department headquarters report all accidents
continuously to the research team. The team then selects accidents according to a strict selection process and
investigates these cases following detailed procedures contained in a handbook and coding manual.
Accident investigation takes place daily during two six-hour shift following a 2-week cycle in order to cover all
periods of the day throughout the whole year:
• first week: from 12:00 a.m. to 06:00 a.m. and from 12:00 a.m. to 6:00 p.m.
• second week: from 6:00 a.m. to 12:00 p.m. and from 6:00 p.m. to 12:00 p.m.
During each shift, a team consisting of two technicians, a doctor and a coordinator is on duty, equipped with
special emergency vehicles. When an accident occurs the team goes on the accident site and collects
information on:
• environmental conditions
• road design
• traffic control
• accident details
• crash information
• vehicle damages and deformation
• impact contact point for passenger and pedestrians
• technical vehicle data
• information about the people involved.
The information collected “on the scene” is complemented by more detailed measurements of the vehicle
(collected usually on the following day), further medical information about injuries and treatment and an
extensive accident reconstruction generated from evidence collected at the accident scene. The accident is
then reconstructed using in-depth approach, reconstruction methodologies, and hoc software.
Both teams – Hannover and Dresden - function in the same manner using the same system, procedures and
collecting data in a common database.
Each year in every investigation region approximately 1,000 traffic accidents are documented (GIDAS, 2012).
3
Sample
Cases consist of bicycles and their riders that were involved in accidents with injuries and transported to an
emergency ward, stored in the GIDAS database and occurred in the years 2000-2010.
Injuries analysis
The injury situation was described according to the Abbreviated Injury Scale (AIS). The AIS is an anatomically-
based global severity scoring system that classifies each injury by body region according to its relative
importance on a six-point ordinal scale (from 1=minor to 6=maximal) (American Association of Automotive
Medicine, 2012). For each rider all injures were classified according to body region (head, face, neck, thorax,
abdomen, spine, upper extremities, lower extremities) and AIS score. The whole bodily injury severity is
classified as maximum AIS (MAIS), the maximal severity of all injuries of the body. All riders with MAIS≥3 were
classified as severely injured riders.
Accident configurations analysis
Each accident was jointly reconstructed and analysed by a team of experts. Based on the results of the
reconstruction, all the accidents were classified into different configurations, depending on the situation which
led to the accident. The type of vehicle against which the bicycle had an impact was also taken into account,
as it is an important factor for rider consequences on health.
Statistical analysis
All the study variables were described using the usual descriptive statistics: mean and standard deviation for
continuous variables and percentages for categorical ones. In particular, frequencies of collision partner, of
maximum AIS body region, and of accident configuration were calculated.
Accident consequences – percentage of injured, severely injured and died riders – by collision partner and
accident configurations were also calculated.
Finally, the impact of the most frequent accident configurations - in terms of percentage of involved riders,
injured riders, severely injured riders and died riders – was evaluated.
Results
Sample description
4
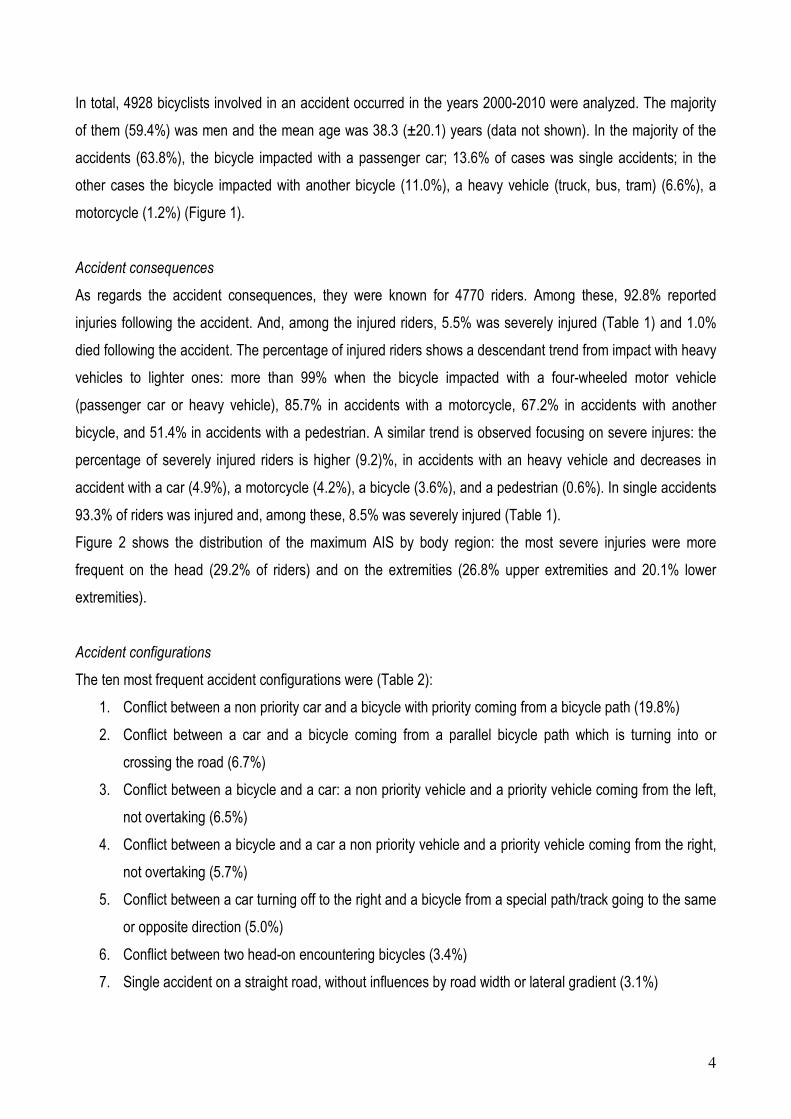
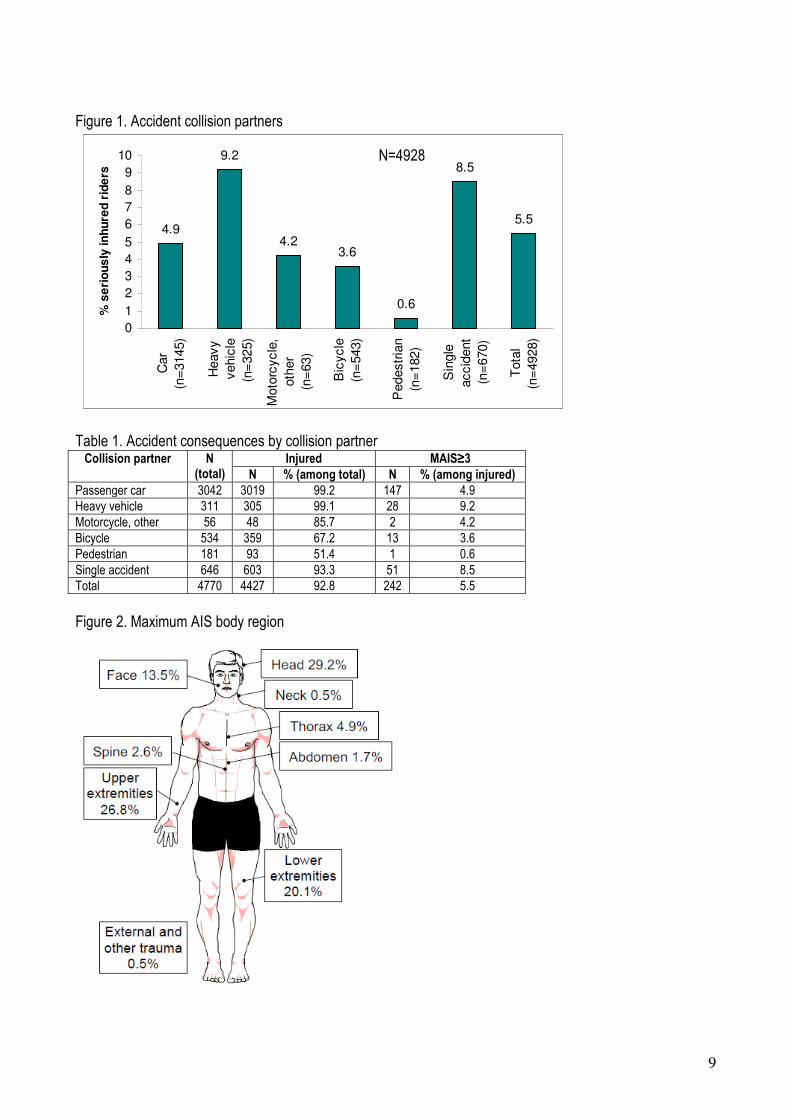
In total, 4928 bicyclists involved in an accident occurred in the years 2000-2010 were analyzed. The majority
of them (59.4%) was men and the mean age was 38.3 (±20.1) years (data not shown). In the majority of the
accidents (63.8%), the bicycle impacted with a passenger car; 13.6% of cases was single accidents; in the
other cases the bicycle impacted with another bicycle (11.0%), a heavy vehicle (truck, bus, tram) (6.6%), a
motorcycle (1.2%) (Figure 1).
Accident consequences
As regards the accident consequences, they were known for 4770 riders. Among these, 92.8% reported
injuries following the accident. And, among the injured riders, 5.5% was severely injured (Table 1) and 1.0%
died following the accident. The percentage of injured riders shows a descendant trend from impact with heavy
vehicles to lighter ones: more than 99% when the bicycle impacted with a four-wheeled motor vehicle
(passenger car or heavy vehicle), 85.7% in accidents with a motorcycle, 67.2% in accidents with another
bicycle, and 51.4% in accidents with a pedestrian. A similar trend is observed focusing on severe injures: the
percentage of severely injured riders is higher (9.2)%, in accidents with an heavy vehicle and decreases in
accident with a car (4.9%), a motorcycle (4.2%), a bicycle (3.6%), and a pedestrian (0.6%). In single accidents
93.3% of riders was injured and, among these, 8.5% was severely injured (Table 1).
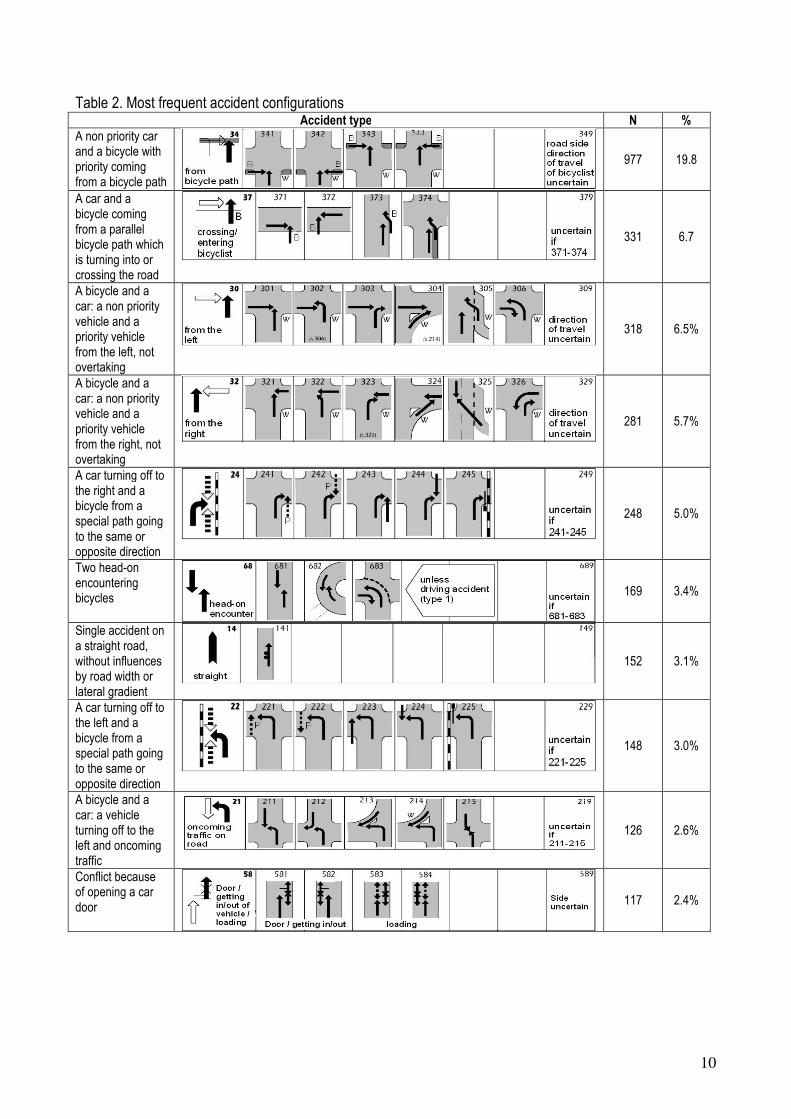
Figure 2 shows the distribution of the maximum AIS by body region: the most severe injuries were more
frequent on the head (29.2% of riders) and on the extremities (26.8% upper extremities and 20.1% lower
extremities).
Accident configurations
The ten most frequent accident configurations were (Table 2):
1. Conflict between a non priority car and a bicycle with priority coming from a bicycle path (19.8%)
2. Conflict between a car and a bicycle coming from a parallel bicycle path which is turning into or
crossing the road (6.7%)
3. Conflict between a bicycle and a car: a non priority vehicle and a priority vehicle coming from the left,
not overtaking (6.5%)
4. Conflict between a bicycle and a car a non priority vehicle and a priority vehicle coming from the right,
not overtaking (5.7%)
5. Conflict between a car turning off to the right and a bicycle from a special path/track going to the same
or opposite direction (5.0%)
6. Conflict between two head-on encountering bicycles (3.4%)
7. Single accident on a straight road, without influences by road width or lateral gradient (3.1%)
5
8. Conflict between a car turning off to the left and a bicycle from a special path/track going to the same
or opposite direction (3.0%)
9. Conflict between a bicycle and a car: a vehicle turning off to the left and oncoming traffic (2.6%)
10. Conflict because of opening a car door (2.4%).
Consequences by accident configuration
In the most common configuration - accident between a non priority car and a bicyclist with priority coming
from a bicycle path - the percentage of injured rides was 99.5% and, among these, 3.1% was severely injured
and 0.1% died following the accident. The configurations presenting the highest percentages of severely
injured riders, higher than the average (5.5%), were: the accident between a car and a bicycle from a parallel
bicycle path which is turning into or crossing the road (8.9%); the single accident on a straight road without
influences by road width or lateral gradient (8.6%); the accident between a bicycle and a car: a non priority
vehicle and a priority vehicle from the right, not overtaking (8.3%); and the conflict because of opening a car
door (6.1%). The configurations presenting the highest percentages of rider fatalities, higher than the average
(1.0%), were: the accidents between a bicycle and a car: a non priority vehicle and a priority vehicle from the
right or the left, not overtaking (2.3% and 1.7% respectively); the conflict because of opening a car door
(1.7%); and the single accident on a straight road without influences by road width or lateral gradient (1.4%)
(Table 3).
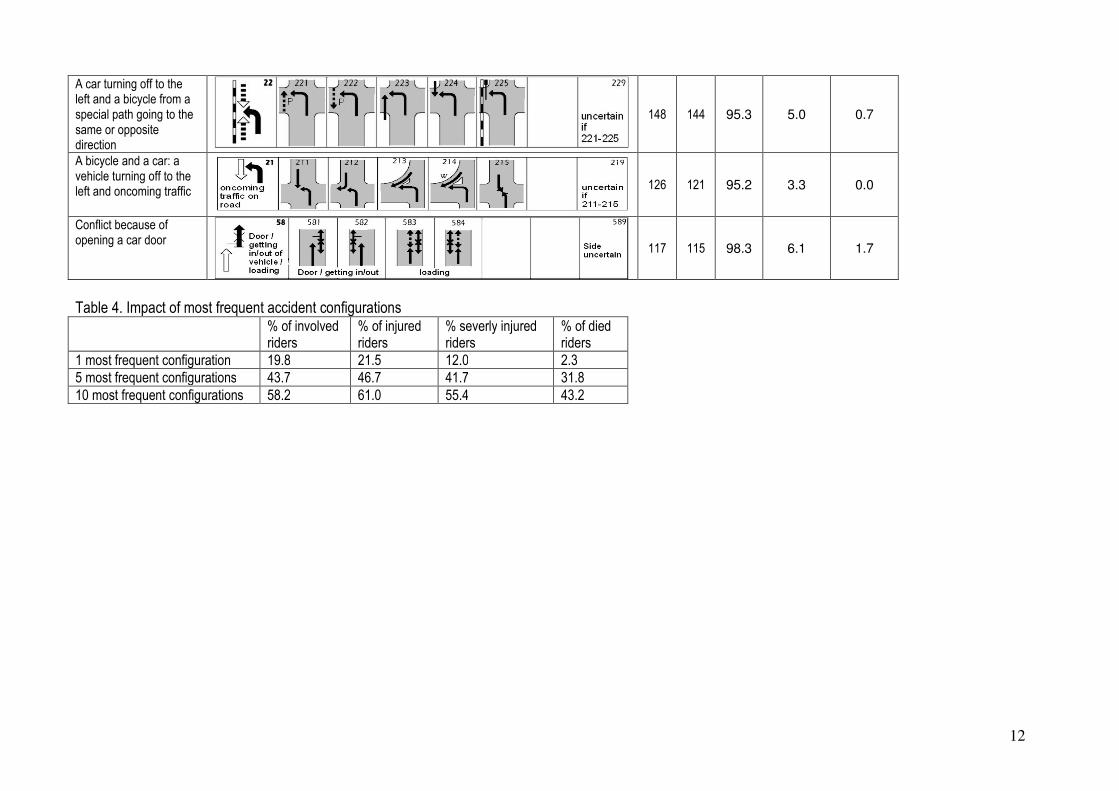
Table 4 shows the impact of the first most frequent, the five most frequent and the ten most frequent
configurations, in terms of percentage of riders involved, injured riders, severely injured riders and died riders.
The accident between a car and a bicycle with priority from a bicycle path represented alone almost 19.8% of
involved riders and 21.5% of injured riders. The five most frequent configurations represented 43.7% of
involved riders and 46.7% of injured riders. The ten most frequent configurations represent 58.2 of involved
riders, 61.0% of injured riders, 55.4% of severely injured riders, and 43.2% of died riders.
Discussion and conclusions
The main findings of the present research can be summarized as follows:
• in the majority of accidents the bicycle impacted with a passenger car, followed by single accidents;
• the percentage of injured riders was higher if the bicycle impacted with an heavy vehicle and decreased
when the bicycle impacted with lighter vehicles;
• a high percentage of injured and severely injured riders in single accidents was observed;
• the most severe injury was more frequently on the head and on the extremities;
6
• ten most frequent configurations represented about 60% of involved riders and more than 60% of injured
riders;
• five most frequent configurations represented more than 40% of involved riders and more than 45% of
injured riders;
• the accident between a car and a bicycle with priority from a bicycle path represented alone almost 20% of
involved riders and more than 20% of injured riders.
The results obtained allow to make some considerations about the phenomenon of road accidents involving
bicycles and some suggestions for preventive actions.
The findings of this study indicate that the risk of sustaining injury or death in an accident is inversely
proportional to the weight and solidity of the vehicle partner in the accident, consistently with previous findings
(Orsi et al. 2009). These results are therefore supportive of recommendations to prioritise plans for protective
interventions for bicycle riders.
The dangerousness of single accident is in accordance with results of previous studies, for instance Orsi et al.
(2009). As these accidents occur without the intervention of other vehicles, the consequences are probably
due to the impact with some infrastructure, suggesting that attention should be paid to infrastructure, to make
the vulnerable road users safer. Moreover, these accidents are probably attributable to distractions, illness,
falling asleep, often brought on by excess of food, alcohol, pharmaceuticals, and drugs. Therefore, injury
prevention for bicycle riders should also include education and training about safe riding habits and accident
risk factors.
The results of this research indicate that the most severe injury was more frequently on the head and on the
extremities, in accordance with previous studies (Bostrom e Nilsson 2001, Eid et al 2007, Lustenberger 2010,
Richter et al. 2005, 2007, Rosenkranz e Sheridan 2003, Styrke et al 2007). This evidence underlines the
importance of wearing a helmet as preventive measure for accident consequences. Indeed, it is known that
helmets reduce bicycle-related head and facial injuries for bicyclists of all ages involved in all types of crashes
including those involving motor vehicles (Attewell et al. 2001, Airaksinen 2010, Amoros 2011, Thompson
2000). Consequently, helmet promotion and education on its use should be an integral part of bicycle injury
prevention strategies.
The evidence that few configurations cause the majority of injured riders indicates that it is possible to address
the preventive actions focusing on the most common situations. As the most frequent configuration is the
accident between a car and a priority bicycle from a bicycle path, educational interventions should be
addressed not only to bicycle riders but also to other vehicles drivers. A possible cause of these accidents
could be a low bicycle and rider conspicuity: increased use of high-visibility helmets and clothing could be a
simple intervention that may have a large impact on the safety of cycling.
7
In conclusion, it is reasonable to assume that in-depth investigations and accident reconstruction give most
detailed data for specific research questions and decision making. It is possible to infer that training education
programme to improve some riding ability and knowledge of the risk annexed to riding, could protect bicycles
riders maybe by helping them in the detection of oncoming passenger cars and other road vehicles and the
prediction of their manoeuvres. Moreover, a visibility enhancement system should be suggested on the bicycle
and on the rider, for example on the helmet. Finally, to reduce the potential for accidents to happen at all it is
desirable a proper road design, the use of traffic calming, mobility management, and more adherence to traffic
laws.
References
Airaksinen, N., Lüthje, P., Nurmi-Lüthje, I., 2010. Cyclist Injuries Treated in Emergency Department (ED):
Consequences and Costs in South-eastern Finland in an Area of 100 000 Inhabitants. Ann Adv Automot Med.
54, 267-274.
American Association of Automotive Medicine 2012. http://www.aaam1.org/ais/ (May 2012).
Amoros, E., Chiron, M., Martin, J.L., The´lot, B., Laumon, B., 2012. Bicycle helmet wearing and the risk of
head, face, and neck injury: a French case-control study based on a road trauma registry. Inj Prev. 18, 27-32.
Attewell, R.G., Glase, K., McFadden, M., 2001. Bicycle helmet efficacy: a meta-analysis. Accid Anal Prev.,
33(3), 345-352.
Boström, L., Nilsson, B, 2001. A review of serious injuries and deaths from bicycle accidents in Sweden from
1987 to 1994. J. Trauma 50 (5), 900–907.
Eid, H.O., Bashir, M.M., Muhammed, O.Q., Abu-Zidan, F.M., 2007. Bicycle-related injuries: a prospective study
of 200 patients. Singapore Med. J. 48 (10), 884–886.
European Commission 2012a. Road Safety.
http://ec.europa.eu/transport/road_safety/specialist/statistics/care_reports_graphics/care_what_is_it/index_en.
htm (May 2012).
European Commission, 2012b. Road Safety.
http://ec.europa.eu/transport/road_safety/specialist/knowledge/pedestrians/index.htm (May 2012).
GIDAS project. http://www.gidas.org/en (May 2012).
Lustenberger, T., Inaba, K., Talving, P., Barmparas, G., Schnüriger, B,, Green, D., Plurad, D., Demetriades,
D., 2010. Bicyclists injured by automobiles: relationship of age to injury type and severity - a national trauma
databank analysis. J Trauma. 69(5), 1120-5.
Orsi, C., Marchetti, P., Marinoni, A., Morandi, A., 2009. Risk factors for road traffic accidents severity in the
province of Milan, Italy. Biomedical Statistics And Clinical Epidemiology 3 (3), 143-154.
8
Missoni, E., Kern, J., 2003. Fatality risk factors for bicyclists in Croatia. Croat. Med. J. 44 (5), 610–613.
Törö, K., Hubay, M., Sótonyi, P., Keller, E., 2005. Fatal traffic injuries among pedestrians, bicyclists and motor
vehicle occupants. Forensic Sci. Int. 151, 151–156.
Styrke, J., Stålnacke, B.M., Sojka, P., Björnstig, U., 2007. Traumatic brain injuries in a well-defined population:
epidemiological aspects and severity. J. Neurotrauma 24, 1425–1436.
Richter, M., Pape, H.-C., Otte, D., Krettek, C., 2005. The current status of road user injuries among elderly in
Germany: a medical and technical accident analysis. J. Trauma 58 (3), 591–595.
Richter, M., Otte, D., Haasper, C., Knobloch, K., Probst, C., Westhoff, J., Sommer, K., Krettek, C., 2007. The
current injury situation of bicyclists—a medical and technical crash analysis. J. Trauma 62 (5), 1118–1122.
Rosenkranz, K., Sheridan, R., 2003. Trauma to adult bicyclist: a growing problem in the urban environment.
Injury 34, 825–829.
Thompson, D.C., Rivara, F.P., Thompson, R., 2000. Helmets for preventing head and facial injuries in
bicyclists. Cochrane Database Syst Rev. (2):CD001855.
World Health Organization, 2009. Global Status Report on Road Safety: Time for Action. World Health
Organization, Geneva, CH.
9
Figure 1. Accident collision partners
4.9
9.2
4.23.6
0.6
8.5
5.5
0
1
2
3
4
5
6
7
8
9
10C
ar
(n=
3145)
Heavy
vehic
le
(n=
325)
Moto
rcycle
,
oth
er
(n=
63)
Bic
ycle
(n=
543)
Pedestr
ian
(n=
182)
Sin
gle
accid
ent
(n=
670)
Tota
l
(n=
4928)
% s
eri
ou
sly
in
hu
red
rid
ers
Table 1. Accident consequences by collision partner
Collision partner N (total)
Injured MAIS≥3
N % (among total) N % (among injured)
Passenger car 3042 3019 99.2 147 4.9 Heavy vehicle 311 305 99.1 28 9.2 Motorcycle, other 56 48 85.7 2 4.2 Bicycle 534 359 67.2 13 3.6 Pedestrian 181 93 51.4 1 0.6 Single accident 646 603 93.3 51 8.5 Total 4770 4427 92.8 242 5.5
Figure 2. Maximum AIS body region
N=4928
10
Table 2. Most frequent accident configurations Accident type N %
A non priority car and a bicycle with priority coming from a bicycle path
977 19.8
A car and a bicycle coming from a parallel bicycle path which is turning into or crossing the road
331 6.7
A bicycle and a car: a non priority vehicle and a priority vehicle from the left, not overtaking
318 6.5%
A bicycle and a car: a non priority vehicle and a priority vehicle from the right, not overtaking
281 5.7%
A car turning off to the right and a bicycle from a special path going to the same or opposite direction
248 5.0%
Two head-on encountering bicycles
169 3.4%
Single accident on a straight road, without influences by road width or lateral gradient
152 3.1%
A car turning off to the left and a bicycle from a special path going to the same or opposite direction
148 3.0%
A bicycle and a car: a vehicle turning off to the left and oncoming traffic
126 2.6%
Conflict because of opening a car door
117 2.4%

11
Table 3. Accident consequences by accident configurations Accident type
N
Injured % severe injured (among injured)
% of fatalities (among injured)
N %
A non priority car and a bicycle with priority coming from a bicycle path
977 955 97.2 3.1 0.1
A car and a bicycle coming from a parallel bicycle path which is turning into or crossing the road
331 320 95.2 8.9 0.6
A bicycle and a car: a non priority vehicle and a priority vehicle from the left, not overtaking
318 302 94.3 6.7 1.7
A bicycle and a car: a non priority vehicle and a priority vehicle from the right, not overtaking
281 267 94.7 8.3 2.3
A car turning off to the right and a bicycle from a special path going to the same or opposite direction
248 240 94.8 0.9 0.0
Two head-on encountering bicycles
169 164 69.2 2.6 0.0
Single accident on a straight road, without influences by road width or lateral gradient
152 143 92.1 8.6 1.4
12
A car turning off to the left and a bicycle from a special path going to the same or opposite direction
148 144 95.3 5.0 0.7
A bicycle and a car: a vehicle turning off to the left and oncoming traffic
126 121 95.2 3.3 0.0
Conflict because of opening a car door
117 115 98.3 6.1 1.7
Table 4. Impact of most frequent accident configurations % of involved
riders % of injured riders
% severly injured riders
% of died riders
1 most frequent configuration 19.8 21.5 12.0 2.3 5 most frequent configurations 43.7 46.7 41.7 31.8 10 most frequent configurations 58.2 61.0 55.4 43.2