acc&it final report september 2013 - cedex · title: microsoft word - acc&it final report...
TRANSCRIPT

Working Group
for the analysis of the
Climate change adaptation needs of the core network of transport infrastructure
in Spain
FINAL REPORT September 2013
SECRETARÍA GENERAL DEL TRANSPORTE
DIVISIÓN DE PROSPECTIVA Y TECNOLOGÍA DEL TRANSPORTE
SECRETARÍA GENERAL DE INFRAESTRUCTURAS
DIRECCIÓN GENERAL DE FERROCARRILES
SECRETARÍA GENERAL DE INFRAESTRUCTURAS
DIRECCIÓN GENERAL DE CARRETERAS
SECRETARÍA DE ESTADO DE INFRAESTRUCTURAS, TRANSPORTE Y VIVIENDA
SUBDIRECCIÓN GENERAL DE PLANIFICACIÓN DE INFRAESTRUCTURAS Y TRANSPORTE
SECRETARÍA DE ESTADO DE MEDIO AMBIENTE
DIRECCIÓN GENERAL DE CALIDAD, EVALUACIÓN AMBIENTAL Y MEDIO NATURAL


Climate change adaptation needs of the core network of transport infrastructure in Spain
i
CONTENTS
1. BACKGROUND AND SCOPE OF THIS DOCUMENT ............................................................... 1
2. METHODOLOGY ADOPTED BY THE WORKING GROUP ....................................................... 1
3. THE TRANSPORT NETWORK UNDER ANALYSIS .................................................................. 3
3.1. ROAD NETWORK ............................................................................................................................ 3 3.2. RAIL NETWORK .............................................................................................................................. 4 3.3. PORT NETWORK ............................................................................................................................. 4 3.4. AIRPORT NETWORK ....................................................................................................................... 6
4. CLIMATE CHANGE FORECASTS CONSIDERED ..................................................................... 7
4.1. RELEVANT CLIMATIC VARIABLES.................................................................................................... 7 4.2. AVAILABILITY OF CLIMATE CHANGE SCENARIOS IN SPAIN ............................................................ 8 4.3. CLIMATIC FORECASTS FOR SPAIN ................................................................................................ 10
5. KEY IMPACTS EXPECTED .................................................................................................. 15
5.1. IMPACTS ON THE INFRASTRUCTURE PLANNING PHASE .............................................................. 16 5.2. IMPACTS THAT COULD AFFECT THE DESIGN OF NEW INFRASTRUCTURE ................................... 16 5.3. IMPACTS ON THE CONSTRUCTION PHASE ................................................................................... 19 5.4. IMPACTS AFFECTING THE OPERATION OF EXISTING INFRASTRUCTURE ..................................... 19
6. PROPOSED ADAPTATION MEASURES .............................................................................. 23
6.1. SHORT‐TERM MEASURES ............................................................................................................. 23 6.2. MEDIUM‐TERM MEASURES ......................................................................................................... 27
7. FINAL REFLECTIONS ......................................................................................................... 28
Appendix I. CURRENT VULNERABILITY OF THE SPANISH CORE NETWORK .............................. 31
I.1. CURRENT VULNERABILITY OF THE ROAD NETWORK ................................................................... 31 I.2. CURRENT VULNERABILITY OF THE RAIL NETWORK ..................................................................... 35 I.3. CURRENT VULNERABILITY OF THE PORT NETWORK .................................................................... 39 I.4. CURRENT VULNERABILITY OF THE AIRPORT NETWORK .............................................................. 43
Appendix II. CURRENT WEATHER WARNING SYSTEMS ........................................................... 47
II.1. AEMET’S METEOALERTA WARNING PLAN ................................................................................... 47 II.2. SPECIFIC WARNINGS FOR THE CORE ROAD NETWORK ............................................................... 47 II.3. WARNING SYSTEMS ON THE RAIL NETWORK .............................................................................. 48 II.4. WARNING SYSTEMS DUE TO MARINE PHENOMENA ................................................................... 49 II.5. WARNING SYSTEMS IN AIRPORTS ................................................................................................ 50 II.6. FLOOD RISK WARNINGS ............................................................................................................... 51
Appendix III. LIST OF PARTICIPANTS ....................................................................................... 53
III.1. WORKING GROUP ........................................................................................................................ 53 III.2. GROUPS OF ESPERTS BY MODE OF TRANSPORT ......................................................................... 54

Climate change adaptation needs of the core network of transport infrastructure in Spain
ii

Climate change adaptation needs of the core network of transport infrastructure in Spain
1
1. BACKGROUND AND SCOPE OF THIS DOCUMENT Climate change can be addressed in two ways: through mitigation, which involves acting on the causes of global warming, and through adaptation, which seeks to prevent and combat its possible effects. Transport adaptation to climate change is an issue that is gaining increasing attention worldwide. So far, however, the issue has barely been considered in Spain, in spite of the fact that the National Climate Change Adaptation Plan (PNACC) proposed in 2006 to start assessing the vulnerability and possibilities for adaptation of the transport sector and system. One of the international organizations that has recently incorporated transport adaptation to climate change in its agenda is the European Environment Agency (EEA). The EEA is interested in how the different climate change impacts, depending on the geographic context, may affect the different transport modes and the transport system as a whole, and how the various parties affected consider those risks and the possible options for adaptation. Within this context, an initiative was launched in September 2012 in the field of activity of the Spanish ministries of transport (Grupo Fomento) and environment (Ministerio de Agricultura, Alimentación y Medio Ambiente) to conduct a preliminary analysis of the needs to adapt the core network of transport infrastructure in Spain to climate change. The results of this initiative feed into the debate promoted by the EEA and, at the same time, help the Spanish government develop a better understanding of the issue and thus enable it to promote initiatives and make timely decisions when the need arises. This document presents the results obtained by the Working Group that developed this initiative. Appendix III gives details of the administrative units and organizations included in this Working Group, and their representatives.
2. METHODOLOGY ADOPTED BY THE WORKING GROUP Figure 1 provides a summary of the way in which the Working Group organized its analysis of the adaptation needs. The first phase (from October 2012 to March 2013) focused on identifying the key climate change impacts and risks to the core infrastructure network and categorizing them based on the perceived urgency to take some form of adaptation measure. The second phase (from April to July 2013) focused on determining which adaptation measures should be promoted as a priority. In order to carry out each of these two phases, the Working Group was supported by four groups of experts, one for each transport mode. Appendix III outlines the composition of each group of experts. At the start of the first phase, each modal group delimited the scope of the analysis by defining which infrastructure in Spain is covered by the concept of the core network, and which assets/components of this core network were to be included in the analysis. Section 3 of this document summarizes the results of this exercise. For the identification and categorization of the potential impacts and risks, it was first necessary to request information from climatologists about climate change forecasts in Spain over the coming decades. Section 4 contains the general information provided to this effect by the State Meteorological Agency (AEMET, Agencia Estatal de Meteorología), and specific forecasts on the marine environment, the Spanish coastline and the hydrological regimes provided by the State Ports Agency (Puertos del

Climate change adaptation needs of the core network of transport infrastructure in Spain
2
Estado), the Spanish Climate Change Office (OECC, Oficina Española de Cambio Climático) and CEDEX (Centro de Estudios y Experimentación de Obras Públicas), respectively. In order to provide guidance for compiling these forecasts, and to facilitate the subsequent identification of impacts, the groups of modal experts previously made explicit the main climatic variables that affect the design of each asset/component of the infrastructure and examined the available data on the current vulnerability of the core network to weather events, a summary of which is included in Appendix I. In order to identify the main climate change impacts and risks, the groups of experts were also supported by a state of the art review on the potential effects of climate change described in other countries, by international transport bodies and researchers.
Figure 1 Diagram of the working methodology used by the Working Group
Transport network
and assets
under analysis
Climatic variables
that have an impact
in the design
Current vulnerability
of the transport network
to clima
Climate change forecasts
in Spain
Possible effects
of climate change
on transport
Main impacts and risks
for transport infrastructure
in Spain
Design regulations
and recommendations
Current weather warning and
emergency management
systems
Possible measures
for adapting transport
to climate change
Adaptation needs
in Spain

Climate change adaptation needs of the core network of transport infrastructure in Spain
3
In order to tackle the second phase of the work, the groups of modal experts first compiled information on the design regulations and recommendations that include variables likely to be significantly altered by the effects of climate change, on the current systems for managing emergencies/incidents caused by climatic events, and on the capacities and constraints of the weather warning systems, a summary of which is included in Appendix II. Using this and a review of the literature on the measures currently being proposed by administrations and researchers in other countries to adapt transport systems to climate change, each of the modal groups drafted a preliminary proposal for adaptation measures in Spain and the Working Group consolidated these for the entire core network.
3. THE TRANSPORT NETWORK UNDER ANALYSIS The infrastructure network used by the Working Group as the baseline for its analysis includes roads, railways, ports and airports. The concept of core network covers, basically, the Spanish port and airport networks and the linear infrastructure (roads and railways) that is strongly organizational in nature and facilitates the majority of medium‐ to long‐distance intercity journeys, access to the main cities and/or international communications. The impact of climate change on maritime and air transport in general, and on urban transport and on some of its more characteristic infrastructure (for example, metro and tram lines) were left out of the scope of the analysis conducted by the Working Group.
3.1. ROAD NETWORK The baseline road network includes, firstly, the entire state‐owned network, i.e. about 25,830 km out of a total of 165,000 km of roads in Spain. Of the state‐owned network, around 2,535 km comprise toll motorways, 8,830 km are dual carriageways, and 14,465 km are conventional single‐carriageway roads. All high‐capacity roads and conventional roads owned by autonomous communities and provincial councils that are proposed by the Spanish government to be part of the Trans‐European Transport Network were also included in this network. The length of non‐state‐owned network selected for the analysis totals almost 1,500 km across six autonomous communities (the Basque Country, Navarra Catalonia, Andalusia, the Balearic Islands and the Canary Islands). Of this total, almost 18% are toll motorways, 70% are dual carriageways and a little more than 12% are conventional roads. Therefore, the total network under analysis exceeds 27,300 km and includes roads in all provinces on the Spanish mainland, the Balearic Islands and the Canary Islands, and the autonomous cities of Ceuta and Melilla. Despite only including 16.5% of the total length of roads in Spain, this network supports more than half the total volume of traffic and around two thirds of heavy‐vehicle traffic. The majority of the network is relatively young, especially in the case of high‐capacity roads. Virtually the whole network is paved with bituminous materials; only 0.7% of the network has a concrete pavement. The network has a relatively high number of tunnels, bridges and viaducts as a result of the country's rugged terrain and the design standards of the network. For example, on the state‐owned road network alone there are currently 365 tunnels, with an average length of 425 m. Despite the fact that the Spanish coastline is very long, the length of roads on this network that run very close to the sea is very short. About 10.5% of the length of the network is managed by concessionary companies by means of toll charges. A further 3.6% are dual carriageways in service that have been awarded to the private sector in recent years for reconditioning, maintenance and operation for a period of 19 years.

Climate change adaptation needs of the core network of transport infrastructure in Spain
4
The route geometry and all of the assets that make up the road infrastructure fall within the scope of the analysis conducted by the Working Group. This includes slopes, fillings, subgrades, pavements, drainage, bridges and structures, tunnels, traffic signing and guidance equipment, barriers, lighting or vegetation.
3.2. RAIL NETWORK The rail network used as the baseline for the analysis includes:
the entire international‐ and Iberian‐gauge high‐speed network (2,290 km1).
the entire network managed by ADIF over which suburban services travel (2,152 km1).
the remainder of the conventional Iberian‐gauge lines managed by ADIF with higher specifications and an average traffic exceeding 50 trains a day (3,779 km1).
In total, this network comprises more than 8,220 km, i.e. around 54% of the total length of the operational network managed by ADIF and more than 51% of the total Spanish rail network. This way, the core rail network includes all strategic lines, in which the eventual impacts resulting from climate change may involve major negative consequences for the operation of the service. The network includes almost 1,400 tunnels, with a total length of more than 700 km, and nearly 400 traction substations. The entirety of the network selected for analysis is located on the mainland; of this, only some sections of the conventional network in the east and northeast run along the coast. With regard to its age, there is a vast difference between the conventional network lines and the high‐speed lines; while the former are a century old in many places, the first high‐speed line in Spain opened in 1992 and 80% of the remainder of this network has been built within the last seven years. The following are included in the scope of analysis:
The various assets of the railway line itself: ‐ Infrastructure: earthworks and subgrades, structures (cross‐passage structures, bridges and
viaducts), tunnels and cut‐and‐cover tunnels, cross‐ and longitudinal‐drainage, and other ancillary elements (access roads, enclosing fences, screens/walls, etc.).
‐ Superstructure: the track (ballast, rails, sleepers, fastenings, switches and crossings), electrification (catenary, traction substations), and safety and communication systems.
The stations and technical facilities, especially: ‐ All of the major stations managed by the ADIF General Directorate of Client Services and
Patrimony, representing a total of 95 locations. ‐ Rail traffic management centres, including 20 Regulation and Control Centres (16 on the
conventional network and four on the high‐speed network), as well as the H24 Network Management Centre, which oversees the state of the infrastructure and the rail traffic conditions on a 24‐hour basis.
The trains for passenger and goods transport.
3.3. PORT NETWORK The port network used by the Working Group as a baseline is made up of the entire state‐owned port system, that includes 45 ports of national interest (see Figure 2) managed by 28 Port Authorities that, in turn, are coordinated by the public State Ports Agency. The port of Seville is the only inland maritime
1 Data from 2012.

Climate change adaptation needs of the core network of transport infrastructure in Spain
5
port in Spain; its facilities are accessed via a lock after a 90‐km journey from the Atlantic Ocean through a navigation canal in the Guadalquivir River. The entire port system under analysis moves more than 458 million tonnes a year, equivalent to almost 60% of Spanish exports and 85% of Spanish imports. In addition, almost 19.3 million passengers embark and disembark in these ports each year, as well as 8 million cruise passengers.
The scope of analysis includes:
The water area, for ships, which comprises the following: ‐ Seawalls, which protect the berthing area from the outside waves and consist mainly of
breakwaters. ‐ The access mechanisms, which allow ships to enter the port safely and ensure they have
sufficient manoeuvrability, width and water depth (includes channel breakwaters, dredged canals, locks and signalling).
‐ The anchoring areas (havens), which hold the ships in calm waters while they are waiting to berth at the piers.
‐ The commercial and fishing basins, which constitute the area of sheltered waters suitable for the stay and operation of ships.
The onshore area, which includes: ‐ Piers that, in addition to allowing ships to berth and moor, support equipment and serve as
a provisional storage area for goods.
Figure 2 Baseline port system

Climate change adaptation needs of the core network of transport infrastructure in Spain
6
‐ The storage areas and warehouses that ‐ as well as providing a space for goods ‐ are used for the regulation of maritime‐land flows.
‐ The buildings and facilities for services.
Land access routes, which include access routes to the port from the general road and railway networks, the perimeter and distribution roads within the port enclosure, and manoeuvring and parking areas.
3.4. AIRPORT NETWORK As the baseline airport network, the Working Group used the 46 airports and two heliports in Spain currently managed by Aena Aeropuertos (see Figure 3). In 2012, these airports registered more than 194.3 million passengers, operated more than 1.9 million flights and transported almost 650,000 tonnes of freight, which corresponds to almost all of the commercial air traffic in Spain. The average age of the network's main airports is approximately 50 years, although Aena has undertaken expansion projects in most of its major airports (Madrid‐Barajas, Barcelona‐El Prat, Málaga‐Costa del Sol, Alicante, etc.) over the last few decades.
The analysis was conducted on the whole set of systems, subsystems and infrastructure assets that make up the service area of an airport and its land access. The service area is usually divided into three
Figure 3 Baseline airport system

Climate change adaptation needs of the core network of transport infrastructure in Spain
7
large homogeneous areas based on the activities assigned and the degree of their direct or complementary relationship with the actual functioning of the airport:
The aircraft movement subsystem, which includes the spaces and surfaces used by aircrafts for landing, take‐off, taxiing and parking. It is made up of the airfield, the apron and the ancillary facilities.
The airport activities subsystem, which includes the infrastructure, facilities and buildings within the airport that complete the multi‐modal interchange process between air transport and the land system, and that guarantee its operational efficiency and service quality. This is divided into the following functional areas: ‐ Passenger area: terminal building and car parks. ‐ Cargo area: cargo building and platform. ‐ Aircraft support area: ground handling buildings and parking areas, de‐icing platforms,
hangars and warehouses. ‐ Services area: technical block, TWR, transmission station, fire and rescue services / fire
station, wildlife control service. ‐ General aviation area: buildings, platform and hangars for general aviation. ‐ Supply area: power plant, water supply, waste and wastewater treatment, supply of fuel
and lubricants, etc. ‐ Complementary activity area: perimeter road and fencing.
The airport reserve area, which includes the spaces required for the potential development of new airport facilities and services, as well as the expansion of any of the abovementioned areas.
4. CLIMATE CHANGE FORECASTS CONSIDERED
4.1. RELEVANT CLIMATIC VARIABLES In general, the climatic variables relevant to transport infrastructure are already known. Nevertheless, the Working Group considered it appropriate to carry out a review that would help make explicit why these climatic variables are relevant and categorize this relevance. In order to achieve this, the group determined which of the climatic variables are significant, whether from an infrastructure design perspective or from a perspective of its operation. The relevance for the design was identified through a systematic review of the design regulations and recommendations that apply to each type of infrastructure. The relevance for the operation of infrastructure was assessed based on data compiled on the current vulnerability of the Spanish network to climatic events (this information is summarized in Appendix I). In both cases, the results of the analysis were organized by infrastructure asset. As a result of this preliminary analysis, it was concluded that the climatic variables that would be useful to forecast future development are those indicated in Table 4.

Climate change adaptation needs of the core network of transport infrastructure in Spain
8
Table 4 Climatic variables that are relevant for transport
Climatic variables Roads Railways Ports Airports
Air temperature
Mean temperature ● ● ●
Daily maximum temperature ● ● ● ●
Diurnal thermal oscillation ● ●
Frost days ● ● ●
Heat waves ● ● ● ●
Relative humidity ●
Cloud cover and cloud ceiling ●
Precipitation
Mean annual precipitation ● ● ●
Intensity of extreme rainfall ● ● ● ●
Duration of heavy rainfall ● ● ● ●
Floods ● ● ●
Droughts ● ●
Electrical storms ● ●
Snow ● ● ●
Flash floods in rivers ● ●
Water table ● ● ● ●
Fog Fog intensity ● ● ● ●
Frequency of intense fog ● ● ● ●
Wind
Intensity of extreme winds ● ● ● ●
Frequency of strong winds ● ● ● ●
Wind direction ● ● ● ●
Wind direction variability ●
Waves Wave height ●
Wave direction ●
Sea level Mean sea level ● ●
Variation due to storms ●
Sea currents Speed ●
Direction ●
Sea surface temperature ●
4.2. AVAILABILITY OF CLIMATE CHANGE SCENARIOS IN SPAIN In order to carry out the analysis, the Working Group had access to climate change estimates provided by the State Meteorological Agency of Spain (AEMET). The National Climate Change Adaptation Plan (PNACC), which was approved in 2006, identifies AEMET as the institution responsible for generating regionalized climate change scenarios for Spain. AEMET is responsible for ensuring that the most active Spanish research groups in this field join forces and offer a unified package of climate change scenarios for Spain, appropriately organized and documented. AEMET also makes them available to the various sectoral, public and private players so that they may be used to assess climate change impacts. The first phase of this work resulted in an initial collection of scenarios, which was made available to users through the AEMET website and the publication “Generación de escenarios regionalizados de cambio climático en España” (Generation of regionalized climate change scenarios in Spain), which was released in the year 2008. This initial collection of scenarios, which was based on the models of the Third Assessment Report by the Intergovernmental Panel on Climate Change (IPCC), considers two of the IPCC's possible global greenhouse gas emissions scenarios (the SRES‐A2 medium‐high emissions scenario and the SRES‐B2 medium‐low emissions scenario), and has fuelled, for example, the sectoral

Climate change adaptation needs of the core network of transport infrastructure in Spain
9
PRECIPITACIÓN ANUALSRESA1B 2046‐2065
impact assessments conducted by the state administration in areas such as coasts, water resources, tourism and biodiversity. AEMET has subsequently generated and provided the users of its website with access to a new collection of scenarios based on the models of the IPCC's Fourth Assessment Report and the ENSEMBLES project, which is part of the European Union's Sixth Framework Programme for Research and Technological Development, and these focused on three emissions scenarios (SRES‐A2, SRES‐A1B and SRES‐B12) and a mitigation scenario (E1). The information is provided in both numeric format, with daily data, and aggregated format by season and year for the Spanish mainland and regions as an evolution graph (Figure 5) and a projections map (Figure 6). At the moment, AEMET is finalizing a new collection of regionalized climate change scenarios named PNACC Scenarios – Monthly Data. This collection of scenarios includes information generated by AEMET and the national research projects ESTCENA and ESCENA. The data from the collection PNACC Scenarios – Monthly Data expand on the list of variables and indices that were previously made available. The projections correspond to three emissions scenarios (SRES‐A2, SRES‐A1B and SRES‐B1) and the time horizons covered are up to 2050 or 2100, depending on the model. For the specific case of the marine environment, the Working Group has received data from the State Ports Agency and the Mediterranean Institute for Advanced Studies (Instituto Mediterráneo de Estudios Avanzados), which have collaborated with AEMET to carry out, thus far, a series of simulations to reproduce the climatic characteristics of the Mediterranean Sea and the area of the Atlantic Ocean adjacent to the Spanish coastline during the second half of the 20th century, and to obtain projections
2 Scenario A1B is a non‐mitigation scenario with intermediate emissions, for which a greater number of global
projections have been calculated. Scenario B1 (more optimistic) corresponds to low emissions without mitigation and scenario A2 (more pessimistic) corresponds to high emissions without mitigation.
Figure 5 Example of an evolution graph that
can be accessed through AEMET’s website
Figure 6 Example of a projections map that
can be accessed through AEMET’s website

Climate change adaptation needs of the core network of transport infrastructure in Spain
10
of its evolution throughout the 21st century under various climate change scenarios3. For coastal waves, the Working Group also had access to the predictions made as part of the project Climate Change on the Spanish Coast, which was carried out between 2009 and 2012 by the Environmental Hydraulics Institute (Instituto de Hidráulica Ambiental) at the University of Cantabria for the Spanish Office for Climate Change. With respect to hydrological predictions, the forecasts used were those generated by CEDEX.
4.3. CLIMATIC FORECASTS FOR SPAIN Below is a short description of the most significant climatic forecasts for transport, obtained for Spain for this century. The results of the various simulations conducted often show disagreements regarding the magnitude of the projected changes, and they are obviously dependent on the climate change scenario considered. However, for the purposes of the assessment conducted by the Working Group, working with a medium climatic scenario and recording any significant qualitative matches observed between the various simulations was deemed sufficient.
4.3.1. Air temperature The estimated mean temperature projections throughout the 21st century indicate that all Spanish regions will experience a gradual increase in the average surface temperature over the course of the century. The rise in average temperature will be greater in summer than in winter. The average trend will be around +2°C in summer and +1.2°C in winter for every third century, although the increase is likely to be more pronounced after the middle of the 21st century. Not all regions will experience the same degree of rise in average temperatures. While the projected temperature rise in winter will be fairly similar across all regions, differences between the regions will increase somewhat in summer, with the average temperature rises higher in inland regions and the southern of the peninsula than in coastal areas. In all regions the daily maximum temperatures will have a tendency to increase a little more than the average temperatures. The daily minimum temperatures will also increase, although slightly less than the average temperatures. Accordingly, there will be a drop in the average number of days a year with frost (i.e. days on which the minimum temperature is below 0°C). There will also be a tendency towards a slight increase in the diurnal thermal oscillation (the difference between the maximum and minimum temperatures during a
day); this trend will be more pronounced in inland areas in the summer months. In the Canary Islands, a more moderate rise in the maximum temperatures is expected, since oceanic influences clearly create a cooling effect. All projections also indicate that, in all regions of Spain, there will be a significant rise in the intensity and frequency of extreme events related to temperature. For example, the duration of heat waves4 in a year is set to double by the middle of this century. In the last third of the century, in a medium‐high emissions scenario, more than half of the days in summer could reach daily maximum temperatures in inland areas of the peninsula in excess of those that are already considered exceptionally high.
3 This work was carried out within the framework of the ESCENARIOS project, funded by AEMET, and the
research projects VANIMEDAT I and II, funded by the National Plan for Research, Development and Innovation. 4 When the daily maximum temperature on more than five consecutive days exceeds the 90th percentile of the
daily maximum temperature in the reference period.

Climate change adaptation needs of the core network of transport infrastructure in Spain
11
4.3.2. Relative humidity The relative humidity will tend to decrease slightly (5%) across the board, in line with the increase in temperatures.
4.3.3. Cloud cover There will be a general downward trend in cloud cover in all regions and at all times of year, with the exception of the north‐western area of the peninsula, during the winter months. The standard deviation of cloud cover is considerably higher in the summer months, possibly due to the convective origin of cloudiness and the major inter‐model discrepancies for this type of process.
4.3.4. Precipitation, storms, floods, flash floods and droughts The results for precipitation present greater uncertainty than those obtained for temperature. This is a consequence of, firstly, the error arising from regionalization methods when they are applied to precipitation, and secondly, the position of the Iberian Peninsula in the transition zone between the high latitudes, where precipitation will increase, and the subtropical zone, where there will be a decline in precipitation. In general terms, a progressive downward trend in the annual accumulated precipitation has been projected for most regions, and this will be more pronounced from the middle of the century onwards. A decline in the total annual precipitation is projected for the 2011‐2040 period, with values of around 5% in the northern half of the country and the Valencia region, close to 10% in the south‐western area of the peninsula, and a more pronounced decline in the Canary Islands. In the last third of the century, the decline will be even greater. In terms of extreme precipitation with a very short duration and electrical storms5, a general decline in frequency is expected, although their intensity may increase in the case of convective phenomena that occur in summer and autumn, especially in northern regions and the Valencia‐Murcia area, and this could lead to an increased risk of local flooding6. In terms of the hydrological regime, its annual variability is expected to increase in the Atlantic basin in the future, which may cause a decline in the frequency of flash floods, although not in their magnitude. In the Mediterranean and inland basins, the greater irregularity in the precipitation patterns will lead to rising water levels and flash floods, and these may even increase in magnitude in Mediterranean areas.
5 An electrical storm is defined as one or several sudden discharges of atmospheric electricity that manifest as
flashes of light, i.e. lightning, and sound in the form of thunder. Bolts are lightning discharges that reach the ground.
6 The risk of flooding currently affects virtually the whole of Spain, although the hardest hit areas are the Mediterranean and Cantabrian coasts and the fluvial areas of the major mainland rivers. Following severe flooding in the Valencia‐Murcia area and the Basque Country between 1982 and 1983, the National Civil Protection Commission drew up a map with the areas presenting the greatest potential risk. Currently, the work established in Royal Decree 903/2010 on the assessment and management of flood risk, is being carried out in order to identify flood areas using historical, geomorphological and hydrological/hydraulic criteria, and to produce a cartographic representation of the danger and risk. The areas identified will form part of a database of flood areas, and the resulting maps produced in 2013 must be incorporated into civil protection plans against the risk of flooding.

Climate change adaptation needs of the core network of transport infrastructure in Spain
12
Any conclusions regarding the characterization of droughts must also be considered with caution due to the high level of uncertainty. In theory, however, drought periods are expected to increase, especially in summer.
4.3.5. Snow An overall decline in the frequency of snow is expected as a result of the fall in precipitation and the rise in temperatures. Snowfall intensity is not expected to increase either, since the highest risk of increased precipitation intensity is expected to occur in summer and autumn.
4.3.6. Fog There is no evidence that fog evolution over the last few decades has been analysed in Spain. However, various studies conducted in Europe that are based on horizontal visibility values recorded at airports suggest that the number of misty and foggy periods in metropolitan areas has been declining since the 1970s. One hypothesis for this decline lies in the gradual phasing‐out of coal for heating and therefore a reduction in sulphur dioxide emissions. The presence of sulphur dioxide causes the appearance of sulphate particles, which turn into condensation nuclei surrounded by water droplets, i.e. fog.
4.3.7. Wind In general, significant changes in the intensity of surface wind are not expected until the end of the century. An analysis of the regionalized data available indicates that, on average throughout the whole Iberian peninsula, there is a tendency for wind to blow less from the west and more from the east, and more from the south and less from the north, as well as an overall downward decline in wind speed and maximum gust, except in summer (when a rise, albeit a moderate one, is expected, especially in Galicia and the Ebro valley) and during episodes of intense convection. An analysis of the average and extreme wind patterns on the coast during the second half of the 20th century is consistent with these predictions.
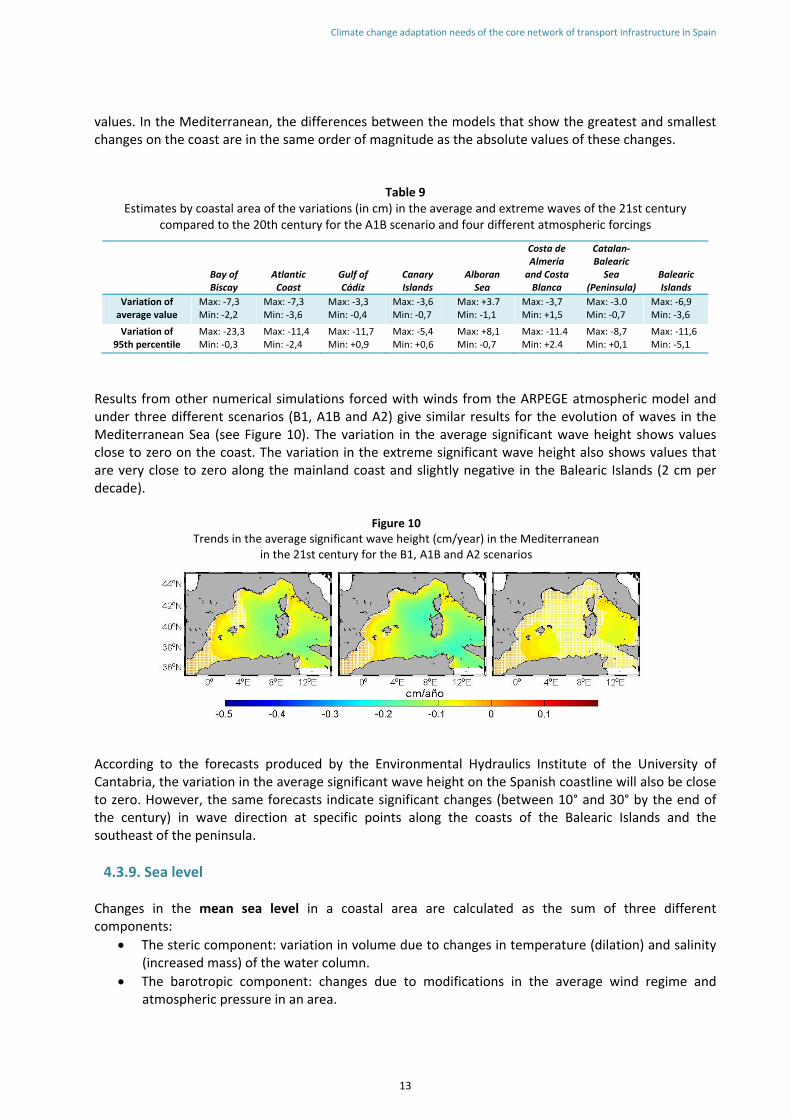
4.3.8. Waves All simulations of the waves on Spanish coasts for various scenarios relating to the 21st century show moderate variations in the significant wave height7 for both the Mediterranean and Atlantic coasts, with an overall trend towards a slight decline, just on the statistical significance threshold. Simulations carried out using the WAM wave generation and propagation model, forced by winds from four different atmospheric models (see Table 9), show that the greatest variations in coastal waves are expected to occur on the Cantabrian coast, with slightly negative trends in both mean and extreme
7 The significant height is approximately equal to the average height of the third of the highest waves.
Figure 8 Spatial distribution of the change in wind speed at 10 mabove the surface in summer, averaged out annually for
the 2081‐2098 period and the SRES‐A1B scenario
Climate change adaptation needs of the core network of transport infrastructure in Spain
13
values. In the Mediterranean, the differences between the models that show the greatest and smallest changes on the coast are in the same order of magnitude as the absolute values of these changes.
Table 9 Estimates by coastal area of the variations (in cm) in the average and extreme waves of the 21st century
compared to the 20th century for the A1B scenario and four different atmospheric forcings
Bay of Biscay
Atlantic Coast
Gulf of Cádiz
Canary Islands
Alboran Sea
Costa de Almería and Costa Blanca
Catalan‐Balearic Sea
(Peninsula) Balearic Islands
Variation of average value
Max: ‐7,3 Min: ‐2,2
Max: ‐7,3 Min: ‐3,6
Max: ‐3,3 Min: ‐0,4
Max: ‐3,6 Min: ‐0,7
Max: +3.7 Min: ‐1,1
Max: ‐3,7 Min: +1,5
Max: ‐3.0 Min: ‐0,7
Max: ‐6,9 Min: ‐3,6
Variation of 95th percentile
Max: ‐23,3 Min: ‐0,3
Max: ‐11,4 Min: ‐2,4
Max: ‐11,7Min: +0,9
Max: ‐5,4 Min: +0,6
Max: +8,1 Min: ‐0,7
Max: ‐11.4 Min: +2.4
Max: ‐8,7 Min: +0,1
Max: ‐11,6 Min: ‐5,1
Results from other numerical simulations forced with winds from the ARPEGE atmospheric model and under three different scenarios (B1, A1B and A2) give similar results for the evolution of waves in the Mediterranean Sea (see Figure 10). The variation in the average significant wave height shows values close to zero on the coast. The variation in the extreme significant wave height also shows values that are very close to zero along the mainland coast and slightly negative in the Balearic Islands (2 cm per decade).
According to the forecasts produced by the Environmental Hydraulics Institute of the University of Cantabria, the variation in the average significant wave height on the Spanish coastline will also be close to zero. However, the same forecasts indicate significant changes (between 10° and 30° by the end of the century) in wave direction at specific points along the coasts of the Balearic Islands and the southeast of the peninsula.
4.3.9. Sea level Changes in the mean sea level in a coastal area are calculated as the sum of three different components:
The steric component: variation in volume due to changes in temperature (dilation) and salinity (increased mass) of the water column.
The barotropic component: changes due to modifications in the average wind regime and atmospheric pressure in an area.
Figure 10 Trends in the average significant wave height (cm/year) in the Mediterranean
in the 21st century for the B1, A1B and A2 scenarios

Climate change adaptation needs of the core network of transport infrastructure in Spain
14
The eustatic component: a rise due to variations in the total water mass of the oceans, primarily as a result of the melting of glaciers and continental polar masses, about which there are major uncertainties.
Future projections indicate an overall rise in the average sea level along the entire Spanish coastline, although there is no agreement concerning the intensity of this rise. Some figures being considered for the 2050 horizon include a minimum rise in the average sea level of 15 cm; this is consistent with the orders of magnitude indicated in the IPCC's Fourth Assessment Report. The simulations carried out by the State Ports Agency for the Spanish coastline show an increase in the steric component in 50 years of 6‐9 cm in the A1B scenario, for both the Mediterranean and Atlantic coasts. In this same scenario, the barotropic component is negligible. Taking into account the range of values that the global models associate with the eustatic component, the total average level for the A1B scenario would see an increase of between 17 and 35 cm on Spanish coasts by the middle of the 21st century, with respect to the year 2000. The above results are consistent with those of another study conducted using the ARPEGE model for the Mediterranean in the A2 scenario and covering the whole 21st century (see Figure 11). For the year 2100, the value of the steric component will reach 35 cm, since its evolution will steadily accelerate over the course of the second half of the 21st century. If the eustatic component from the IPCC's estimates is incorporated, the projections for the rise in sea level by the end of the 21st century for this scenario range from 47 to 81 cm, on average, on the Mediterranean coast.
Figure 11 Annual evolution of average sea level on the Mediterranean coast (the total and by component) during the 21st
century under the A2 scenario, assuming a linear rate due to melting of 1.2 mm/year (left) and 4.6 mm/year (right)
With respect to variations in sea level due to storms8, the predictions, although not significant, generally indicate a slight decline of the phenomenon.
8 Changes in sea level can be caused by wind, because of the drag effect on water, and by atmospheric pressure,
due to the inverted barometer effect; these changes can last from a few hours to a few days. The maximum magnitude of this phenomenon on Spanish coasts can vary between +60/70 cm and ‐40/50 cm.

Climate change adaptation needs of the core network of transport infrastructure in Spain
15
4.3.10. Other marine variables The scenarios obtained by means of three‐dimensional baroclinic simulations show a considerable increase in sea surface temperature over the course of the 21st century. Until 2050, the sea is expected to record an increase in surface temperature of around +0.02°C per year, both in the Mediterranean waters near the Spanish mainland and in the Atlantic, from the Bay of Biscay to the Canary Islands. This upward trend continues when analysing the results closer to the coast, except on the Atlantic coast of the peninsula, where high‐resolution simulations show downward trends until 2050 for some forcings. The study of possible changes in marine currents due to the effects of climate change is still in the embryonic stage. At the moment, the current state of knowledge makes it also difficult to provide a statistically significant estimate on the evolution of surface salinity along the Spanish coastline.
5. KEY IMPACTS EXPECTED
Identification of the foreseeable impacts of climate change on the Spanish core transport network was carried out basically in a qualitative way, based on expert judgement. During the analysis, the potential impacts on the transport infrastructure planning phase and the design, construction and operation phases were assessed. In order to differentiate between impact levels, the likelihood of the impact, and its consequences in terms of cost for the infrastructure provider and service/safety level for the user were taken into account. The Working Group's analysis focused primarily on the identification of impacts that will require an adjustment of current practices to ensure the existing service levels of the Spanish core transport network and its assets are not compromised. For this reason, the Working Group paid special attention to the adverse impacts of climate change, although clearly it can also result in positive impacts. For example, the decline in snow and frost will lead to a considerable number of positive effects on the operation of roads and railways by reducing the need for winter maintenance work and improving the operating conditions of the network. It should be noted that, at present, seven out of every ten incidents directly associated with climatic conditions that involve traffic restrictions on the core road network are due to snow, and that about a quarter of weather‐related incidents that affect the rail traffic of Renfe Operadora are attributable to snow and ice. Although to a lesser extent, the
Two snowploughs clearing the road after a snowfall in Guipúzcoa

Climate change adaptation needs of the core network of transport infrastructure in Spain
16
decline in snowfall and frost will also have a positive impact on air transport, given that such weather conditions cause 8% of the incidents that significantly affect airport operations. In maritime transport, the factor that could have the greatest positive impact is, without doubt, the rise in sea level, since it will improve the operating conditions of some ports that are currently experiencing access restrictions due to shallow waters at low tide or berthing constraints for certain vessels at piers with low water levels. In specific cases, climate change may even have a positive effect on the design requirements of part of the infrastructure. In airports, for example, the decline in precipitation may result in a lower volume of water to be treated in the treatment plant, in the event that surface runoff and surface water are treated along with the rest of the airport wastewater.
5.1. IMPACTS ON THE INFRASTRUCTURE PLANNING PHASE In general, the impact that climate change may have on infrastructure planning tasks is considered limited compared to the possible impact on its design and operation. The two planning facets that a priori may be more compromised by climate change are traffic demand studies and the assessment of different sites for the construction of new infrastructure.
When analysing possible sites, the most important aspects to consider will be possible changes in coastal areas (essentially, the rise in sea level) and the risk of changes in the local weather conditions (that may reduce the efficiency and regularity of nodal infrastructure operations). Airports, for example, have to be planned so as to enable aircraft to operate under normal wind conditions most of the time. The effects of climate change on transport demand and on the
behaviour of passenger and freight mobility are difficult to predict. Various studies conducted in Spain indicate possible changes in the spatial distribution patterns of the population and tourist behaviour as a consequence of climate change. In general, it is expected to be an improvement in climatic suitability in populations with higher latitudes and altitudes, a greater spatial dispersion of major tourist centres as a result of decreasing water resources, and a decline in the climatic suitability of Spanish inland regions as tourist destinations due to the rising temperatures. However, in the opinion of the Working Group, the certainty of the results that would be obtained from transport demand studies that justify the planning of new infrastructure would barely change if these change forecasts were incorporated.
5.2. IMPACTS THAT COULD AFFECT THE DESIGN OF NEW INFRASTRUCTURE The impacts that will have the greatest effect on the design of new roads on the core network relate primarily to slopes and pavements.
Wind on the runway at Bilbao Airport

Climate change adaptation needs of the core network of transport infrastructure in Spain
17
In the case of slopes, a rise in local damages, which may be more prevalent in the north and southeast of the peninsula, is expected. The main trigger will be the rise in intensity of short, extreme rainfall. This could affect the stability of slopes due to surface runoff. This could also lead to more severe flash floods that affect the stability of the slopes of embankments running parallel to rivers. The increased intensity of extreme precipitation, combined with an increase in arid conditions, could also result in the erosion of slopes. In the case of pavements, the impact is expected to be more widespread. The rise in maximum temperatures could lead to an increased risk of non‐structural ruts and cracks due to the premature oxidation of the binder. A decline in the average annual precipitation could preclude the use of porous asphalt over a larger area of the country.
Other assets/components of the road infrastructure that may also be affected by climate change, albeit to a lesser extent, are vegetation, bridges and protective structures, the road geometry, or signing and barriers. The rise in temperatures and droughts could make it necessary to select more resistant plant species for slope stabilization and for central reserves, especially in the centre and south of the peninsula. More severe flash floods may affect the stability of the slopes at bridge abutments and undermine their pile foundations and protection elements. In terms of the road geometry, a rise in the intensity of extreme precipitation may lead to an increasing number of locations where the drainage capacity of the road surface is insufficient, thus calling for a review of the design of the carriageway's drainage conditions (straight‐line camber, transition of the superelevation). The overall rise in maximum temperatures and number of heat waves will lead to an increase in sunlight exposure, which may affect the durability of certain signing elements due to the ultraviolet rays. The rising temperatures may also make road markings fade prematurely or cause the connecting elements in very long stretches of metal safety barriers to break due to excessive expansion. Although the increase in intensity of extreme precipitation may place greater demands on drainage at local level, the Working Group considers that the impact of climate change on this aspect for new roads will not be a priori relevant due to the basic design criteria included in the draft for the new Instruction 5.2‐IC on Surface Drainage.
Landslide on the N‐121‐A road (Pamplona/Iruña‐Behobia) near the Belate tunnelthat resulted in closure of the road to vehicle traffic for several weeks
Collapse of the N‐330 road near Castiello de Jaca in Huescacaused by the flooding of the River Aragón following heavy rainfall

Climate change adaptation needs of the core network of transport infrastructure in Spain
18
The biggest impacts expected on conventional rail network lines relate to infrastructure components whose design criteria are outdated and do not respond to the same requirements currently fulfilled by high‐speed lines. The earthworks, structures and drainage systems are a priori the most vulnerable assets. In the majority of cases, the impacts relate to the rise in heavy rain episodes. With respect to the superstructure components of the conventional rail network lines, the impacts identified relate primarily to the overall rise in temperature and thermal oscillations between day and night, as well as the occurrence of more intense electrical storms and a possible rise in the maximum intensity of wind gusts. In this respect, the Working Group draws attention to the impacts of temperature on the track and fastenings, as well as to the expected rise in the risk of damages to the catenary due to surges from electrical storms and falling objects as a result of wind gusts. In newly constructed high‐speed rail lines, the main impacts are expected to occur on track components, the catenary and certain ancillary elements of the infrastructure, such as barriers and vegetation. The overall rise in maximum temperatures and diurnal thermal oscillations will cause expansion of the rail and increase its internal stress, affecting the strain in the rail fastening system even more than in the case of conventional lines, since high‐speed lines are subject to greater demands. Also notable is the potential impact on the catenary caused by the increase in wind gust intensity, which should be taken into account in its design. Similarly, special attention should be paid to the potential impact of the wind factor on the design of noise and protective barriers. Current forecasts for changes in wind conditions and intensity appear to be a priori not significant, but they are still somewhat uncertain. Given the major effect that this aspect currently has on the operation of high‐speed lines, it would be appropriate to keep an eye on this potential impact until more accurate forecasts are available. In railway stations and technical buildings and in newly constructed trains, the greatest impact relates to the increased need for air conditioning as a result of the rise in temperature. In terms of the design of new port infrastructure, climate change predictions indicate that the phenomenon that will have the biggest impact over the coming decades will be the anticipated rise in mean sea level. The rise in sea level will lead to a reduction in the height of breakwater crests and crest walls, and a greater water depth in breakwaters. This will result in an increased risk of breakwater failure due to a lack of protection from the maximum wave forecast used to calculate the breakwater size and, at the same time, a greater force exerted on the breakwater elements (the force on the breakwater increases with the square of the water depth). At the same time, an increase in the incident wave is expected, even though the projections do not show any significant variations in the waves on the high seas: on reaching a greater water depth, the incident wave will refract less compared to waves
Suspension of rail traffic between Lorca and Águilas in Murcia after a storm that resulted in the collapse of drainage systems, dragging of embankments and loss of support of the rail tracks

Climate change adaptation needs of the core network of transport infrastructure in Spain
19
on the high seas, and will therefore have a higher wave height than the one used for calculating the size of breakwaters and structures, which again will result in an increased risk of damage to the breakwater. Regarding the expansion or construction of new airport infrastructure, particular attention should be paid to the rise in temperatures. In the design of airport buildings, the rise in temperature will be accompanied by a rise in energy demand for air‐conditioning systems in terminal buildings, as well as for the maintenance of equipment in control towers and transmission stations. The rise in temperature could also result in the need for longer runways, since higher temperatures mean lower air density, a factor that reduces the thrust produced by aircraft and the wing's lift9. The rising temperatures will also be accompanied by increased heat inside both airport service vehicles and passenger vehicles. This will mean a lower degree of comfort for users that cannot park their vehicles in areas with elements (e.g. canopies) that cast shadow over them. As well as the effects of the rise in temperature, it is important to consider the impact that the increase in the intensity of extreme precipitation may have on the design of drainage systems in order to prevent flooding of the airfield. Lastly, close attention should be paid to the potential impact of the wind factor on the design of the airfield, since current forecasts for changes in wind conditions, although a priori expected not to be significant, are still uncertain, especially at local level.
5.3. IMPACTS ON THE CONSTRUCTION PHASE In terms of construction of infrastructure, climate change is expected to have a particular impact on some aspects of health and safety and risk prevention during construction. The rise in maximum temperatures and number of heat waves could affect working conditions and/or periods, and the operational and comfort requirements of construction machinery. It could also increase the risk of accidental fires during execution of the works. The increased intensity of occasional extreme rainfall in some areas could make it advisable to reinforce the drainage and protection systems, especially during the construction of subgrades and earthworks. As a result of climate change, it may also be necessary to focus on certain construction processes (e.g. the setting and curing of concrete, as a consequence of the increased insolation) or even resort to alternative processes involving less water consumption, due to the scarcity of water resources.
5.4. IMPACTS AFFECTING THE OPERATION OF EXISTING INFRASTRUCTURE In terms of the operation of existing infrastructure, the road assets that will be affected the most will be earthworks and drainage. The impacts on earthworks are expected to be similar to those described above, relating to their design. With regard to drainage elements, the rise in the intensity of extreme rainfall could place greater demands on their capacity at local level, intensify the reservoir effect of some embankments or, combined with the concentration effect of many cross‐drainage elements of roads, increase erosion downstream caused by water flows, thus affecting third‐party property.
9 The International Civil Aviation Organization (ICAO) recommends an increase of the runway length of 1% for
each 1°C that the aerodrome reference temperature exceeds the temperature in the standard atmosphere for the aerodrome elevation. Furthermore, if the total correction for elevation and temperature is greater than 35%, the required corrections should be obtained through an aeronautical study conducted for the purpose.
Climate change adaptation needs of the core network of transport infrastructure in Spain
20
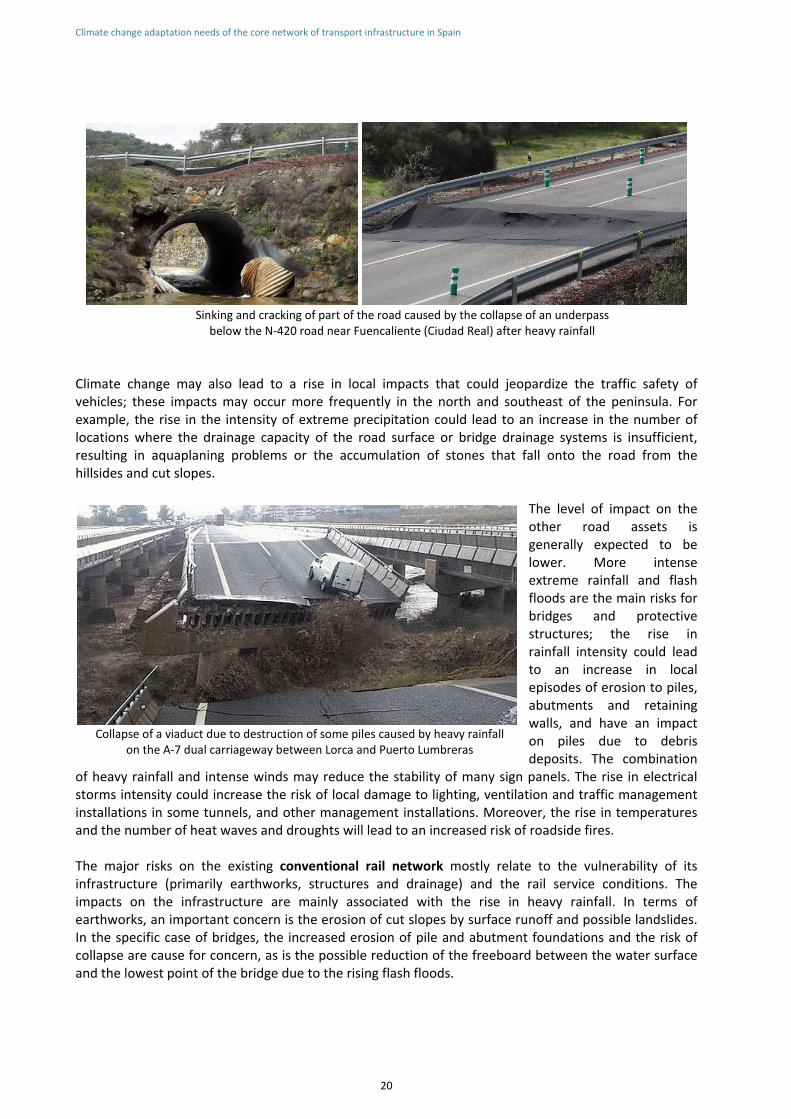
Climate change may also lead to a rise in local impacts that could jeopardize the traffic safety of vehicles; these impacts may occur more frequently in the north and southeast of the peninsula. For example, the rise in the intensity of extreme precipitation could lead to an increase in the number of locations where the drainage capacity of the road surface or bridge drainage systems is insufficient, resulting in aquaplaning problems or the accumulation of stones that fall onto the road from the hillsides and cut slopes.
The level of impact on the other road assets is generally expected to be lower. More intense extreme rainfall and flash floods are the main risks for bridges and protective structures; the rise in rainfall intensity could lead to an increase in local episodes of erosion to piles, abutments and retaining walls, and have an impact on piles due to debris deposits. The combination
of heavy rainfall and intense winds may reduce the stability of many sign panels. The rise in electrical storms intensity could increase the risk of local damage to lighting, ventilation and traffic management installations in some tunnels, and other management installations. Moreover, the rise in temperatures and the number of heat waves and droughts will lead to an increased risk of roadside fires. The major risks on the existing conventional rail network mostly relate to the vulnerability of its infrastructure (primarily earthworks, structures and drainage) and the rail service conditions. The impacts on the infrastructure are mainly associated with the rise in heavy rainfall. In terms of earthworks, an important concern is the erosion of cut slopes by surface runoff and possible landslides. In the specific case of bridges, the increased erosion of pile and abutment foundations and the risk of collapse are cause for concern, as is the possible reduction of the freeboard between the water surface and the lowest point of the bridge due to the rising flash floods.
Sinking and cracking of part of the road caused by the collapse of an underpass below the N‐420 road near Fuencaliente (Ciudad Real) after heavy rainfall
Collapse of a viaduct due to destruction of some piles caused by heavy rainfallon the A‐7 dual carriageway between Lorca and Puerto Lumbreras

Climate change adaptation needs of the core network of transport infrastructure in Spain
21
On the conventional network, there is also an expected rise in the number of rail service incidents due to the presence of obstacles on the platform and local flooding and damage due to the heavy rainfall. A rise in the number of fires affecting rail traffic is also expected due to the increased number of heat waves and periods of drought. However, fires directly attributable to railway operations (generally caused by the braking systems of freight wagons) will continue to be rare.
The impact of climate change on high‐speed rail services is expected to be greater due to the increased long‐term usage share of these lines compared to the conventional network. The impacts on the existing high‐speed network are expected to be similar to those that are considered in the design of new lines, although ‐ together with the effects on the track components, catenary, barriers and vegetation ‐ some impacts on other infrastructure assets will worsen, especially on the lines in Southern Spain. In general, these impacts are due to extreme precipitation, with higher incidence levels than those anticipated on newly constructed lines. In particular, there is an expected rise in the risk of erosion of cut slopes and embankments caused by heavy rainfall, a rise in the erosion of piles, abutments and protective structures on bridges and viaducts as a result of the flow of flash floods, flooding and debris dragged by surface runoff in tunnels and cut‐and‐cover tunnels, and an increased risk of collapsing fences due to the combination of heavy rainfall and intense winds. On high‐speed lines, some localized impacts on the superstructure are expected to be worse: for example, the rainfall intensity may increase the drag and movement of the track ballast; the rise in electrical storm intensity and maximum temperatures may increase the risk of fires in traction substations; and in the case of the rise in intensity of the maximum wind gust, the risk of damage and breakage of security and communications system elements could increase. The incidence of fires directly attributable to railway operations is negligible due to the current scarcity of goods traffic on the high‐speed network. However, this risk could alter if UIC‐gauge tracks are opened up to mixed traffic in the future. With respect to railway stations and technical buildings, a major impact associated with the increase in air‐conditioning needs due to the rise in temperature has been identified. This impact will be somewhat more moderate in the case of passenger trains. The effects of climate change on existing ports will depend largely on their design, the characteristics of their traffic and the local weather conditions. However, in general, the rise in sea level is expected to have the greatest effect on port operations in the coming decades. This rise could produce the following adverse effects:
Suspension of traffic between Sariñena and Zaragoza due a firebetween the towns of Grañén and Torralba

Climate change adaptation needs of the core network of transport infrastructure in Spain
22
A rise in the frequency and intensity of breakwater overtopping events, with negative consequences for the activities and installations on top of the barrier and an increase in the number of days the dike is closed.
A reduction in the height of the crest and crest walls on breakwaters and deeper water in the breakwaters. This will lead to an increased risk of breakwater failure due to a lack of protection from the maximum waves forecast when calculating the breakwater size and, at the same time, an increase in the forces exerted on the elements of the breakwater (in addition to the fact that the forces on the breakwater increase with the square of the water depth, the incident wave ‐ on reaching a greater water depth ‐ will refract less compared to waves on the high seas, and will therefore have a higher wave height than the one used for calculating the size of breakwaters and structures).
A possible rise in the internal agitation, due to the fact that the incident wave reaches the port with a greater water depth.
A rise in the water table in piers and platforms that could affect the operation of underground service networks and pipelines of all types, the quality of the port land areas and stocking areas and their consistency, the hygiene and health conditions in the port environment, as well as substantially increase the sub‐pressure on works and installations.
An impact on storm drains in harbours due to the reduction in the slope available. A rise in water temperature, especially on the Mediterranean coast, may also result in the deterioration of the water quality (due to the increased number of months in which there is strong water column stratification) and a greater risk of the occurrence of phytoplankton blooms. Unfortunately, there are no climate predictions relating to fog. This could be an important phenomenon for port operations, since it increases the risk for maritime traffic of collisions between vessels and with breakwaters or structures, especially in ports with a large interior route. The predicted evolution of other parameters such as air temperature, precipitation and waves (except when the latter are combined with a rise in sea level) is not expected to have a significant widespread impact on Spanish ports, although it should be noted that the impact of some of these phenomena (e.g. precipitation and waves) on port operations may depend enormously on the local conditions and the specific design of each port. The impact that climate change will have on the current airport network is particularly difficult to forecast. As is the case with ports, it will vary depending on the airport's design, the characteristics of the airport traffic and the local weather conditions. In addition to this, the impacts that currently affect airport operations most frequently and intensely are related to wind and a lack of visibility, phenomena for which few predictions are available.
Breakwater in the outer port of A Coruña during a storm

Climate change adaptation needs of the core network of transport infrastructure in Spain
23
Fog can slow down take‐off and landing operations at airports, cause air traffic diversions and increase the risk of collisions due to the reduced response time for avoidance manoeuvres by aircraft and vehicles. In heavy fog conditions, vehicle operators may become disorientated and drive onto active runways or taxiways, thus greatly increasing the potential for accidents.
Wind, meanwhile, is particularly important for the operation of the airfield. Runway use is determined by the distribution of the wind in such a way that, as long as other factors allow it, the runway is aligned with the prevailing wind. Configuration of runway use also has an effect on the level of noise that the inhabitants close to airports are exposed to, and this may have an impact on planning and land use. The rise in maximum temperatures and heat waves will result primarily in greater energy demands for air‐conditioning systems in airport buildings and aircrafts, a decline in the conditions of comfort for staff working on the runways and platform, and is likely to speed up the deterioration of bituminous materials in the airfield. The rise in the number of days with higher temperatures may degrade the air quality and jeopardize compliance with environmental regulations. Furthermore, the risk of fire will increase in the airport reserve area and during aircraft refuelling operations (given that the flashpoint of the kerosene fuel Jet A‐1 is 38°C). In specific cases, operating restrictions could be applied to the heaviest aircrafts due to the lack of runway length (higher temperatures lead to a reduction in the thrust produced and thus a longer runway length is required by aircrafts during take‐off). The effects due to changes in the precipitation pattern are expected to be lesser. Intense precipitation episodes, combined with prolonged periods of drought, will generally result in the need for more maintenance work on the airfield drains to ensure they remain effective. The extended periods of drought may lead to problems at airports where the water is supplied by means of wells. At airports where there are ponds, pools or other water resources that favour the presence of birds, the decline in precipitation could lead to a change in the settlement patterns of birds. In turn, the rise in the intensity of extreme rainfall may cause runway flooding, damage or disable air navigation aid systems and perimeter and ancillary installations, and cause damage due to flooding and saturation of drainage systems in some airports, all of which may result in more delays and flight cancellations.
6. PROPOSED ADAPTATION MEASURES Below is a description of the adaptation measures proposed by the Working Group for the core network of Spanish transport infrastructure in light of the key impacts and risks expected on this network and an analysis of the capacities and limitations of the current warning and emergency management systems for adverse weather events. A review of the current weather warning systems and incident/emergency management systems is justified on the grounds that climate change is expected to cause a rise in the intensity of certain
Operations in foggy conditions at Tenerife North Airport

Climate change adaptation needs of the core network of transport infrastructure in Spain
24
extreme phenomena (such as heavy rainfall, flash floods and strong wind gusts) and, in some cases, a rise in their frequency (in the case of droughts and heat waves). This could result in a need to strengthen these systems. In order to select and prioritize the adaptation measures, the Working Group implicitly considered the uncertainties surrounding climate projections and the effects of weather on the transport network, as well as the urgency of implementing the adaptation measures and the cost of their implementation. The adaptation measures proposed focus on the need for adjustments in the construction of new infrastructure and in the operation of existing infrastructure. During the process to review and update the infrastructure design criteria, different alternatives for different levels of risk should be weighed up, since adopting design criteria whose primary objective is to prevent risk usually involves a rise in the cost of constructing the infrastructure and a higher cost than the implementation of measures aimed primarily at improving risk management.
6.1. SHORT‐TERM MEASURES Although the situation for each mode of transport is different, it emerges that – in general ‐ there is
a lack of systematic sources of information for identifying the current vulnerability of the infrastructure to climate events, despite the fact that such sources of information are an excellent starting point for the identification of network vulnerability in the medium to long term. It would be useful to strengthen the current systems for logging incidents caused by adverse weather events and for monitoring their consequences in order to facilitate an ex‐post analysis of the climatic events that most frequently affect the network and have the greatest impact on users, transport service providers and the infrastructure owner itself. In the case of linear infrastructure, drawing on these records would also help correctly identify and characterize the most vulnerable sections of the network. In view of the forecast that the frequency and/or intensity of certain climatic phenomena will change, the appropriateness and effectiveness of contingency plans and procedures for dealing with current weather emergencies should also be assessed regularly with the aim of adjusting and/or updating them if necessary. As a general rule, the management of incidents/emergencies caused by weather events is part of the overall risk and emergency management policies of the entities that manage or operate the network. These, in turn, are based on a set of plans and procedures, the components of which are, in large part, based on legal requirements. This means that specific procedures for responding to adverse weather events are only available in relation to some specific aspects (for example, warning systems, or plans of action and coordination protocols in the event of harsh winter conditions or fires), and that incidents/emergencies triggered by weather events in general have often not been subject to appropriate consideration, especially in contingency plans.
In terms of roads, a review of the standards and recommendations for the design of earthworks is
recommended in the short term, with the aim of reducing the vulnerability of cut slopes and embankments to a combination of events such as droughts, heavier precipitation and exceptionally high flash floods. In order to achieve this, it may be advisable to strengthen certain drainage elements (such as ditches at top of slope and kerbs), build more moderate slopes, increase measures to protect against erosion by planting certain vegetation, use wider berms at the foot of slopes, or strengthen protective structures at the foot of embankments that run alongside rivers. Regarding the review of the design regulations and recommendations, the modifications incorporated by the current draft of Instruction 5.2‐IC on Road Surface Drainage, which has been in force since 1990, are deemed sufficient to meet the short‐term adaptation needs that may be
Climate change adaptation needs of the core network of transport infrastructure in Spain
25
associated with climate change. For the calculation of the reference flow rate, this draft incorporates the use of up‐to‐date maximum flow maps with historical data on major river floods. It also makes upward corrections for the calculation of the maximum daily precipitation in the Valencia‐Murcia area and southern mainland. In addition, it increases the minimum return period associated with cross‐drainage works and for the calculation of extreme river floods that affect the design of slopes that run parallel to rivers. On existing roads, it will be particularly important not to neglect tasks associated with surveillance and maintenance that guarantee appropriate road conditions and road safety, and that safeguard the integrity of certain road assets against predicted adverse weather events. In this regard, it is particularly important to regularly review the road drainage conditions, to increase efforts to clean the drainage elements if necessary, and to check the effectiveness of their design against extreme precipitation and flash floods. It will also be useful, for example, to assess the implementation of preventive measures on existing slopes that present a high risk of erosion or instability due to heavy rains, to maintain control of roadside vegetation to reduce the risk of fires during droughts, and to regularly review the state of erosion of piles, abutments and barriers in structures situated on rivers that are prone to heavy flooding. In addition to paying special attention to these preventive maintenance tasks, road management authorities are also advised to make efforts to improve their weather warning systems. In the short term, this improvement should focus on defining specific warning levels that are appropriate to the needs of the network operator in the event of rain, storms or wind, as well as more effectively identifying sections likely to be affected by extreme weather events.
In the rail sector, it is recommended in the short term to review the regulations and recommendations for the design of infrastructure with the aim of reducing its vulnerability to extreme and more intense precipitation. In particular, special attention should be paid to the design conditions of bridges and viaducts against high floodwaters (because of erosion to foundations, abutments and protections) and of tunnels, in order to prevent water leakage and platform flooding. A review of the recommendations for designing and constructing slopes is also advised in order to improve their stability in the event of high floodwaters. However, as is the case with the road network, the modifications incorporated by the current draft of Instruction 5.2‐IC on Road Surface Drainage, which is also used as a reference in the rail sector, are deemed sufficient to meet the needs for the short‐term adaptation of surface drainage on railways. With respect to newly constructed rail superstructure, a detailed assessment should be carried out on the risks associated with the distortion of the rail fastening system caused by the rise in maximum temperatures and the diurnal thermal oscillations, as well as damage to the catenary due to surges from more intense electrical storms and, if required, the design standards and recommendations should be updated. Although the construction of railway stations and technical buildings is currently regulated by the Technical Building Code, the sector also has specific recommendations concerning their design. From historical maintenance records, ADIF has identified occasional problems with sanitation and waste disposal, even where they comply with regulations. Therefore, a review of the systems is recommended to ensure that they have sufficient capacity to deal with the expected rise in heavy precipitation. It may also be appropriate to consider the opportunity to upgrade the air‐conditioning systems to above the minimum levels currently required by thermal load regulations; this upgrade would mean more expensive equipment, but in return the performance and reliability of the equipment would increase, and it would be adapted for the projected thermal load increase caused by climate change.

Climate change adaptation needs of the core network of transport infrastructure in Spain
26
On existing rail lines, a general review of the current prevention, maintenance and surveillance protocols relating to the infrastructure should be carried out. During this review, particular attention should be paid to the following: slopes and hillsides at risk of erosion and sliding due to intense rainfall; erosion affecting bridges due to water flow; the state of fence‐post foundations and the possible misalignment of gutters on railway platforms due to surface runoff; verification of the risk of flooding on the track and in tunnels, drainage works, access roads and gutters, as well as the risk of collapse of bridges and viaducts situated in areas where high flash floods occur; the state of the track (ballast, sleepers, rail and fastenings) in order to identify possible debris deposition and distortion caused by extreme rainfall or the rise in the thermal oscillation; the state of the catenary in order to detect any damage caused by surges from electrical storms; the state of the installations in electric traction substations in order to prevent possible fires caused by damage from electrical storms and high temperatures; and control of track‐side vegetation in order to reduce the risk of fire during drought periods. To reduce the risk of fires caused by rail operations, it would also be convenient to promote the use of composite brake blocks (type K or LL) in freight wagon braking systems, instead of conventional cast‐iron brake blocks. For existing railway stations, the protocol review should focus on the state of sanitation facilities in order to prevent defects caused by the rise in the water table as a result of heavy rainfall. It might also be useful to consider increasing the power of the air‐conditioning system installed as the equipment reaches the end of its life. Over the last few years, the rail sector has made a considerable effort to acquire efficient weather warning systems. However, it would be advisable to complete their development and implementation, and reinforce their integration with the decision‐making processes designed to minimize the impact on rail services and infrastructure, especially in the case of flooding.
The impact of climate change on port operations depends largely on the local conditions and the specific design of each port. Therefore, it is recommended in the short term that an in‐depth vulnerability and risk assessment, based on the climate forecasts available, is carried out on each port, with priority given to ports whose operation and/or integrity is likely to be more sensitive to climate change and adverse weather events. These studies will make it possible to assess – from a technical and port perspective ‐ whether the infrastructure can remain in service throughout its expected useful life, with suitable restrictions and operating rules, or whether it is necessary to plan measures to adapt its design before the end of its useful life. In studies on vulnerability and risk, special attention should be paid to the effectiveness and integrity of breakwaters and secondary breakwaters, piers, jetties, as well as subgrades, underground facilities, sea discharge elements and basements. In parallel, it is recommended a detailed assessment on the appropriateness of adapting some of the current technical regulations for the design of new infrastructure or the modification or rehabilitation of existing infrastructure to climate change forecasts, in particular ROM 1.0‐09 (Recommendations for the Design and Implementation of Protection Works) and ROM 1.0‐01 (General Procedure and Calculation Bases for Maritime and Port Works Projects). When undertaking this review, it is important to analyse the option of adjusting the useful design life based on the usage possibilities, and in doing so, to try as far as possible to avoid the use of life spans that involve excessive variations in the calculation parameters (thus, excessive insecurities and risks, or else excessively high design costs).

Climate change adaptation needs of the core network of transport infrastructure in Spain
27
In existing airports, it is generally advisable not to neglect the usual practices aimed at reducing risks associated with high temperatures and heat waves (e.g. the pruning and removal of dry vegetation in the vicinity of the airport, or campaigns for the prevention of fires) and with the changes in rainfall and the hydrological regime (e.g. the cleaning of drains on the runway). As is the case with ports, the impact of climate change on the existing airport infrastructure will depend largely on the local conditions and the specific design of each airport. Therefore, it is recommended that an in‐depth assessment of the risks posed by climate change at airport level is launched, despite the limited availability of evolution forecasts for some climatic variables. It would be particularly useful to assess what additional restrictions the current runway length may impose on the operation of aircrafts in warmer temperatures and the best operating alternatives when a runway requires lengthening and this is not possible. It would also be advisable to assess the risks posed by the increased intensity of short, extreme rainfall (e.g. the lack of capacity to discharge water from the drainage system and the airfield, and high river levels) and the decline in water resources (for the airport's water supply, for the behaviour of bird colonies as a result of changes in the water reserves in the service area and vicinity of the airport), and identify the need to promote appropriate preventive measures (e.g. the construction of new drains, improvements in the systems for the real‐time monitoring of floods and rising river levels).
6.2. MEDIUM‐TERM MEASURES For roads, it is recommended in the medium term that the opportunity to review regulations 6.1‐IC
and 6.3‐IC of the Road Instruction is assessed in detail, in order to adapt the design and the rehabilitation of bituminous pavements to the forecasted increase in maximum temperatures and decline in the average precipitation. The increase in maximum temperatures may lead to an increased risk of non‐structural ruts and cracks due to the premature oxidation of the binder, and therefore it would be wise to review the map of the summer thermal zone included in regulations 6.1 IC and 6.3 IC that is used to determine the type of bituminous binder used, as well as the relationship between its dosage by weight and that of the mineral powder. A decline in the average annual precipitation could preclude the use of porous asphalt over a larger area in the country, and make advisable to review the map of rainfall areas included in regulations 6.1 IC and 6.3 IC, which prohibit the use of porous asphalt in areas with an average annual precipitation below 600 mm (although, in contrast, a rise in temperature may allow porous asphalt to be used over new areas, and make advisable to review the limitation included in the abovementioned regulations that prohibits the use of porous asphalt on road surfaces at altitudes above 1,200 metres due to problems related to snow or ice formation). It is also important to bear in mind that part of the road network is operated and managed by the private sector, and that their investments meet the criteria of corporate benefit and economic profitability. This may hinder the implementation of certain adaptation measures when they do not produce any short‐term returns. In this context, it may be useful in the medium term to plan a review of the terms of reference in new concession contracts.
In the case of railway infrastructure, especially high‐speed lines, it may be necessary to review the design regulations relating to the catenary and barriers (acoustic, anti‐vandalism, for the protection of birds, etc.) based on the updated change forecasts related to extreme wind conditions.
For all linear infrastructure, it would be a good idea to review the current recommendations for the design and implementation of plantations, as well as the catalogues on vegetation species to be used in plantations, especially in the case of slope protection, in order to ensure that they are resistant and adequate under major drought conditions and rising temperatures. It should be noted, for

Climate change adaptation needs of the core network of transport infrastructure in Spain
28
example, that – for roads ‐ such recommendations were published by the Ministry of Fomento more than 20 years ago. In any case, the regular use of the systems for logging incidents and remedial/rehabilitation measures implemented in the short term will help identify the need to update other regulations and recommendations for the design of linear infrastructure. Similarly, these systems will help locate specific sections of the network where adaptation measures are recommended without the need to resort to changes in the design requirements (e.g. due to the inadequacy of the drainage capacity of the road surface or falling trees in the case of very strong winds, etc.).
The adaptation measures to be promoted in the medium term in existing ports and airports will
basically emerge from the results of the risk analysis studies carried out for each specific port/airport, and from the use of systems for logging incidents and repair/rehabilitation measures implemented in the short term. In the case of new port and airport infrastructure, it would be a good idea to request that the planning units include the impacts that climate change may have on operating conditions in their decisions regarding locations, since changes in some weather conditions may undermine the efficiency of infrastructure operations (e.g. in order to decide on the location of a new airport, it is essential to take into account wind distribution, visibility conditions, fog formation and turbulence). In terms of airport design, it would be useful to conduct a detailed assessment of the possible need to increase the length of the runway as a result of the rise in surface temperatures. The expected rise in maximum temperatures, combined with the certainty of this prediction, means that it would be advisable to undertake lines of research for the development of more heat‐resistant asphalt surfaces at the airfield. It would also be useful to promote detailed analysis and research and development initiatives on predictive models of wind conditions.
Together with the measures outlined above for each transport mode, it is recommended that other, more general measures are promoted for all modes. In particular, it is proposed that consideration of climate change is encouraged when applying bioclimatic criteria in the design of new buildings (railway stations, airport terminals, technical buildings, etc.). Likewise, it would be useful to promote new lines of research for the development of new materials and components that may be used under more severe climatic conditions, and encourage technological innovation processes aimed at adapting traditional construction processes to a context of widespread water shortage and execution of works under higher temperatures.
7. FINAL REFLECTIONS An overall assessment of the adaptation measures described above suggests that the greatest short‐term challenge in adapting the core network of Spanish transport infrastructure to climate change will be to promote awareness among those responsible for the network that climate change must be included as an additional determining factor in its design and operation. Climate change should also

Climate change adaptation needs of the core network of transport infrastructure in Spain
29
serve as a spur to strengthen some of the current infrastructure management practices related to some weather events. On the other hand, it should come as no surprise that some of the adaptation needs identified by the Working Group for the Spanish core network differ from those considered for transport networks in other European countries, given its specific characteristics. In northern European countries, for example, many of the concerns arise from the permafrost reduction and the rising number of freeze‐thaw cycles. In Central Europe, one of the biggest concerns lies in the effects of flooding caused by large rivers, and in the Netherlands and Denmark, which are mainly flat, in the rising sea level. Instead, in Spain, the adaptation needs are significantly influenced by the latitude of the country and its effect on the maximum temperatures, by its size (which means more nodal infrastructure, with specific design and operational requirements against weather conditions), and by its topography and the strong variability of its rainfall and hydrological regimes (which give rise to an abundance of slopes and structures on linear infrastructure and a large number of sites affected by high runoff and flash floods). It is also important to bear in mind that the analysis of the Working Group focused on the adaptation needs on the core network. The adaptation needs on this network may differ from those that require promoting as a matter of priority on the remainder of the Spanish transport network. When incorporating climate change amongst the conditioning factors involved in the design and operation of infrastructure, it is important to remember to contextualize climate risks within a broader set of non‐climatic conditions (including demographic, economic, technological and institutional conditions, etc.), since it is possible that some indirect effects (e.g. changes in population density, changes in transport demand, changes in vehicle fleet, etc.) may generate greater impacts on the transport network than climate change itself. Finally, in order to complete the analysis of adaptation needs, it is necessary to include a reference to climate change forecasts in Spain. The exercise carried out by the Working Group identified some limitations in this area. Firstly, it would be desirable to elaborate on the meaning of the variables provided by climate models in order to align them with the parameters with which infrastructure managers are familiar (in transport, for example, parameters that correspond to indirect phenomena, such as the water table and the hydrological regime, are often fundamental). Secondly, it would be useful if the predictive models and/or the climate scenarios incorporated some variables that may be particularly relevant for transport (such as wind conditions or fog), and to pay special attention to extreme events (for transport, the possible changes in the intensity and frequency of extreme weather events are fundamental, since the damage such events may produce, even if they are infrequent, can be considerable, and hard to accept from a social point of view). Lastly, it is also necessary to make an effort to provide local predictions (since the scale of downscaling currently available could be a limitation when assessing the vulnerability of nodal infrastructure) and gradually reduce the uncertainties currently associated with many of the predictions. As indicated at the start of this document, the objective of the Working Group was to perform a preliminary analysis of the needs to adapt the core network of transport infrastructure in Spain to climate change. With this analysis, the Working Group does not intend to cover every aspect of this subject, but rather to start the debate. The Working Group is aware of the need to enhance and supplement this analysis with other contributions, and to review it as and when there is access to updated climate change forecasts for Spain, a better understanding of the effects of weather conditions on the transport network, and experience and results of implementing the adaptation measures adopted.

Climate change adaptation needs of the core network of transport infrastructure in Spain
30

Climate change adaptation needs of the core network of transport infrastructure in Spain
31
APPENDIX I: CURRENT VULNERABILITY OF THE SPANISH CORE NETWORK
I.1. CURRENT VULNERABILITY OF THE ROAD NETWORK
I.1.1. Most frequent impacts on traffic conditions In order to assess the current vulnerability of the core road network, the group of road experts started by compiling information on the weather‐related incidents that involve having to close roads or that substantially affect the normal traffic conditions at a point or section of the road. In order to achieve this, they used the database linked to the Tele‐Ruta Service (which is managed by the General Directorate for Roads of the Ministry of Fomento) and the responses to an ad‐hoc questionnaire sent to all Road Units in the abovementioned General Directorate. The Tele‐Ruta Service is used to record road closures on the state‐owned network that may last more than 15 minutes, and daytime lane closures that are expected to last more than two hours or even less if the reduced capacity of the road results in traffic bottlenecks. In winter, it also logs all incidents on the state‐owned network that require snow chains to be fitted to vehicles, in which case the incidents refer to complete carriageways. The reasons for traffic restrictions are categorized as follows: roadworks, maintenance works, accidents, broken‐down vehicles, snow, ice, landslides, floods and other causes. The reasons most closely related to climatic events are considered to be snow, ice, landslides and floods, although incidents related to wind, for example, are sometimes included in the group other causes. Although some gaps were detected in the information recorded in the Tele‐Ruta Service by some of the Road Units, this database can probably be considered representative of the incidents that occur on the state‐owned network as a whole. Figure I.1 shows the result of exploiting the records of the Tele‐Ruta Service database over the last five years. It is immediately clear that the incidents directly associated with weather events represent a minority of the causes of road closures or traffic restrictions, even when accidents occur or maintenance works are necessary as a result of weather events.
Figure I.1 Annual incidents recorded in the Tele‐Ruta Service between 2008 and 2012
Of the incidents recorded in the Tele‐Ruta Service that are mostly associated with climatic variables (around 1,085 incidents per year on average), more than two thirds (69%) correspond to snow‐related
0 25.000 50.000 75.000 100.000 125.000
2008
2009
2010
2011
2012
Roadworks Maintenance works Accidents & Broken‐down vehicles
Snow & Ice & Landslides & Floods Other causes

Climate change adaptation needs of the core network of transport infrastructure in Spain
32
restrictions. The remainder are distributed almost equally between incidents due to landslides (16%) and floods (14%); only a very small percentage (1%) is due to ice. According to the information recorded in Tele‐Ruta, the vulnerability of the traffic conditions to climatic events on toll motorways appears, in general, to be lower than that of dual carriageways and conventional roads (Figure I.2). The vulnerability of state‐owned dual carriageways is also lower than that of state‐owned conventional roads to snow and landslides, but the same is not true in the case of flooding.
Figure I.2 Number of incidents per year recorded in the Tele‐Ruta Service per 100 km, depending on road type
(Data from 2010 to 2012)
Figure I.3 provides a summary of the current impact of different climatic factors on the traffic conditions perceived by the Road Units of the Ministry of Fomento on its roads. The responses correspond to 29 Road Units. The length of the network managed by these 29 Road Units totals 17,160 km, i.e. a little more than 73% of the total state‐owned road network if toll motorways are excluded10. When viewing Figure I.3, it is clear that the majority of the Road Units do not generally consider droughts and high temperatures to be a climatic risk factor in traffic, although three of the four Road Units in Galicia highlighted fires as one of the biggest factors affecting traffic conditions. Nine out of the 29 responses received correspond to coastal provinces; coastal storms and the sea level also appear to be irrelevant for most of them. By contrast, short‐term heavy rainfall is an important climatic factor in many provinces; persistent rainfall is important in a smaller number of provinces and to a lesser degree. Among the events associated with water, river flooding is one with the least impact. Some of the effects of heavy rainfall mentioned are the possibility of flooding on some stretches of road, increased erosion of slopes and structures, a rise in the need for maintenance of drainage due to the large accumulation of debris that causes the erosion of ravines that are dry for most of the year, etc. 10 It is important to bear in mind that the network run by the Road Units excludes not only toll motorways, but
also dual carriageways under first‐generation concession contracts.
0,00
0,50
1,00
1,50
2,00
2,50
3,00
Snow Ice Landslides Floods
Nu
mb
er
of i
nci
de
nts
pe
r 1
00
km
State-owned road network Toll motorways Dual carriageways Conventional roads
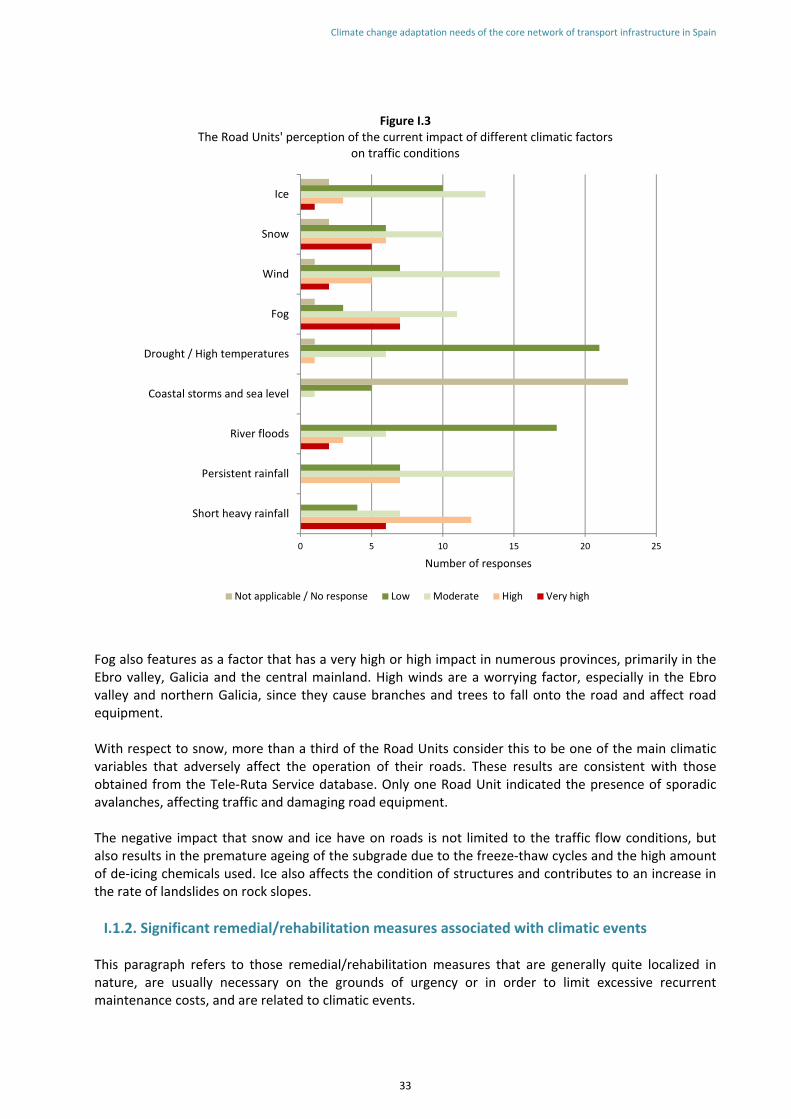
Climate change adaptation needs of the core network of transport infrastructure in Spain
33
Figure I.3 The Road Units' perception of the current impact of different climatic factors
on traffic conditions
0 5 10 15 20 25
Short heavy rainfall
Persistent rainfall
River floods
Coastal storms and sea level
Drought / High temperatures
Fog
Wind
Snow
Ice
Number of responses
Not applicable / No response Low Moderate High Very high
Fog also features as a factor that has a very high or high impact in numerous provinces, primarily in the Ebro valley, Galicia and the central mainland. High winds are a worrying factor, especially in the Ebro valley and northern Galicia, since they cause branches and trees to fall onto the road and affect road equipment. With respect to snow, more than a third of the Road Units consider this to be one of the main climatic variables that adversely affect the operation of their roads. These results are consistent with those obtained from the Tele‐Ruta Service database. Only one Road Unit indicated the presence of sporadic avalanches, affecting traffic and damaging road equipment. The negative impact that snow and ice have on roads is not limited to the traffic flow conditions, but also results in the premature ageing of the subgrade due to the freeze‐thaw cycles and the high amount of de‐icing chemicals used. Ice also affects the condition of structures and contributes to an increase in the rate of landslides on rock slopes.
I.1.2. Significant remedial/rehabilitation measures associated with climatic events This paragraph refers to those remedial/rehabilitation measures that are generally quite localized in nature, are usually necessary on the grounds of urgency or in order to limit excessive recurrent maintenance costs, and are related to climatic events.

Climate change adaptation needs of the core network of transport infrastructure in Spain
34
For roads managed by the General Directorate for Roads of the Ministry of Fomento (i.e. the whole state‐owned road network except toll motorways and dual carriageways under first‐generation concession contracts), these kind of measures are usually undertaken through multiannual maintenance contracts, from the budget for direct management expenses, from the budget for emergencies or by launching a specific tender for extraordinary works, depending on the entity and type of measure to be carried out. The General Directorate for Roads of the Ministry of Fomento has access to regular information on any emergency measures that are carried out on the network that it manages. In addition, its Road Units have been requested to identify, by means of an ad‐hoc questionnaire, any significant remedial/rehabilitation measures carried out on the network they manage over the last few years. An analysis of the information on the emergency measures carried out over the last six years shows that these relate primarily to slopes (59 measures), structures (40) and rainfall events (29). The number of measures carried out on pavements, tunnels or because of fires is considerably lower. The average cost of measures as a result of rainfall is €3.2 million and that of measures on slopes is €2.3 million. With respect to measures carried out on structures, the majority of these are not a direct result of climatic factors, although when they are caused by weather events, their cost is much higher than the average cost of such measures (€1.1 million). Although interpreting the information provided by the 29 Road Units via the questionnaire in aggregate form should be approached with caution, it is possible to observe some overall patterns. Figures I.5 and I.6 show, respectively, the weather events cited most frequently by the Road Units in the case of remedial/rehabilitation measures and the road infrastructure assets that are most often affected. In both figures, the remedial/rehabilitation measures carried out have been broken down depending on their size (i.e. cost).
Figure I.5 Main climatic events associated with remedial/rehabilitation measures on roads
Short heavy rainfall Persistent rainfall Rainfall Floods / River floods Ice Snow Wind Fires Temperatures
Measures > 1 M€(25 measures)
1 M€ > Measures > 0,1 M€(61 measures)
Measures < 0,1 M€(311 measures)

Climate change adaptation needs of the core network of transport infrastructure in Spain
35
Figure I.6 Main road infrastructure assets on which remedial/rehabilitation measures have been performed
due to climatic events
Figure I.5 identifies water (heavy rainfall, persistent rainfall and high water levels and flooding) as the biggest threat of local damage to roads. In the case of flooding / river floods, the level of damage tends to be relatively high. Heavy rainfall causes a high number of incidents of small‐scale damage. Ice (or more accurately, the freeze‐thaw cycle) is also a relatively frequent cause of expensive measures that tend to affect slopes and, to a lesser degree, pavements. Wind often causes small‐scale damage, especially to signage and beacons. The road infrastructure assets that are subject to the most frequent remedial/rehabilitation measures (see Figure I.6) are earthworks, which account for more than 50% of the most expensive measures and almost half of all small‐scale measures. High‐cost measures are also frequently carried out locally on pavements and structures. Some of the lower‐budget measures are repairs to drainage and minor work on signs and beacons. Of the 17,160 km that are the subject of the information provided by the Road Units, 37% are dual carriageways and the remaining 63% are conventional roads. The distribution of the number of remedial/rehabilitation measures by road type is very similar. Higher‐budget measures are somewhat more frequent on conventional roads. This could be the result of the higher level of vulnerability due to their more outdated design conditions. The proportion of measures on dual carriageways is slightly higher in the case of lower‐cost work, which could be explained by the higher standards of maintenance and by the fact that they were only recently constructed.
I.2. CURRENT VULNERABILITY OF THE RAIL NETWORK
I.2.1. Most frequent impacts on railway operations Both ADIF and Renfe Operadora have access to systematic information on the incidents that have occurred during operation of the rail network as a result of climatic events.
Measures < 0,1 M€(311 measures)
Cut slope Embankment Cut slope / Embankment Subgrade
Drainage Pavement Structures Tunnel
Vegetation Protection works Signing & Traffic guidance equipment Others
1 M€ > Measures > 0,1 M€(61 measures)
Measures > 1 M€(25 measures)

Climate change adaptation needs of the core network of transport infrastructure in Spain
36
Figure I.7 shows the average annual distribution of incidents caused by weather that were recorded by ADIF between 2009 and 2012, on both the high‐speed and the conventional networks. Of the almost 1,100 incidents logged every year on average, 97% correspond to the conventional network and only 3% to the high‐speed network, which could be interpreted as the incident rate per unit of length of the network being approximately 10 times higher on the conventional network than on the high‐speed network.
Figure I.7 Average annual distribution of incidents caused by weather events recorded by ADIF
Conventional network High‐speed network
However, in order to interpret Figure I.7 correctly, it is important to bear in mind that the concept of incident varies between the different areas of ADIF's work. In the case of the high‐speed network, an incident is defined by the section of rail that corresponds to a Maintenance Base within the same Regional Operational Area (six in Spain). In the case of the conventional network, an incident is defined by the section of rail that corresponds to the maintenance team, divided into specialities, that works under a Maintenance Base. Figure I.7 shows that the high‐speed network is particularly sensitive to short heavy rainfall and strong winds. The most frequent incidents on the conventional network are primarily associated with the occurrence of track‐side fires (directly related to high temperatures), heavy rainfall and storms, and, to a lesser extent, strong winds, ice and snow. Of the fires that have occurred at the side of the track, only a minority (less than 5%) are attributable to railway operations. Over the last few years, fires attributable to railway operations have only been recorded on conventional lines, especially in areas of the Ebro valley and the north of the peninsula. In the majority of cases, these have been the result of a failure to clear vegetation from track‐side areas and/or sparks caused by friction in train braking systems, normally of freight trains. The maps in Figure I.8 show the geographical distribution of some of the incidents recorded by ADIF. The higher concentration of incidents caused by torrential rains per length of network occurs in the south of the mainland. Conversely, the incidents caused by strong winds occur predominantly in the northwest and the north‐eastern third of the mainland. The concentration of incidents caused by lightning/storms is also higher in the northwest. Track‐side fires have a greater impact on rail operations in the south and northwest of the mainland, although they are also frequent in the northeast.
Torrential rain
Lightning / Storms
Snow
Ice
Fog
Strong winds
Track‐side fires

Climate change adaptation needs of the core network of transport infrastructure in Spain
37
Figure I.8
Geographical distribution of incidents recorded by ADIF according to Regional Operational Area (ATO). (Number of incidents / 100 km in the 2005‐2012 period)
Torrential rains Lightning / Storms
Strong winds
Fog
Track-side fires
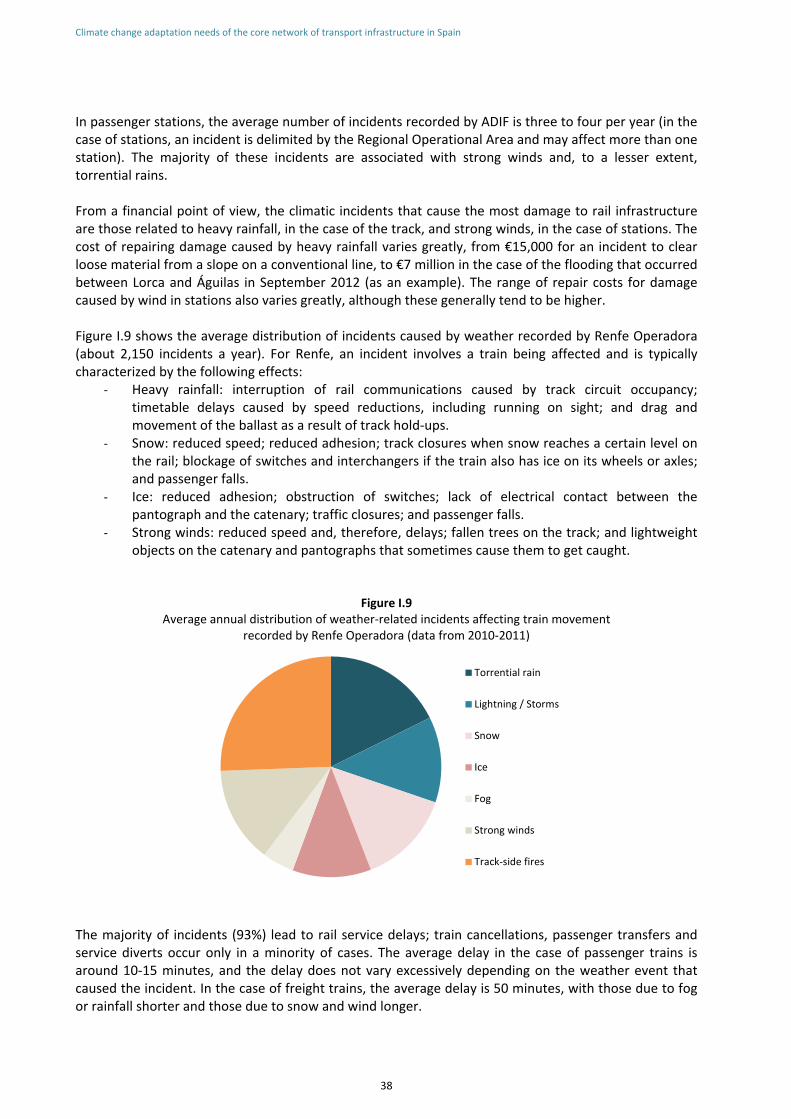
Climate change adaptation needs of the core network of transport infrastructure in Spain
38
In passenger stations, the average number of incidents recorded by ADIF is three to four per year (in the case of stations, an incident is delimited by the Regional Operational Area and may affect more than one station). The majority of these incidents are associated with strong winds and, to a lesser extent, torrential rains. From a financial point of view, the climatic incidents that cause the most damage to rail infrastructure are those related to heavy rainfall, in the case of the track, and strong winds, in the case of stations. The cost of repairing damage caused by heavy rainfall varies greatly, from €15,000 for an incident to clear loose material from a slope on a conventional line, to €7 million in the case of the flooding that occurred between Lorca and Águilas in September 2012 (as an example). The range of repair costs for damage caused by wind in stations also varies greatly, although these generally tend to be higher. Figure I.9 shows the average distribution of incidents caused by weather recorded by Renfe Operadora (about 2,150 incidents a year). For Renfe, an incident involves a train being affected and is typically characterized by the following effects:
‐ Heavy rainfall: interruption of rail communications caused by track circuit occupancy; timetable delays caused by speed reductions, including running on sight; and drag and movement of the ballast as a result of track hold‐ups.
‐ Snow: reduced speed; reduced adhesion; track closures when snow reaches a certain level on the rail; blockage of switches and interchangers if the train also has ice on its wheels or axles; and passenger falls.
‐ Ice: reduced adhesion; obstruction of switches; lack of electrical contact between the pantograph and the catenary; traffic closures; and passenger falls.
‐ Strong winds: reduced speed and, therefore, delays; fallen trees on the track; and lightweight objects on the catenary and pantographs that sometimes cause them to get caught.
Figure I.9 Average annual distribution of weather‐related incidents affecting train movement
recorded by Renfe Operadora (data from 2010‐2011)
The majority of incidents (93%) lead to rail service delays; train cancellations, passenger transfers and service diverts occur only in a minority of cases. The average delay in the case of passenger trains is around 10‐15 minutes, and the delay does not vary excessively depending on the weather event that caused the incident. In the case of freight trains, the average delay is 50 minutes, with those due to fog or rainfall shorter and those due to snow and wind longer.
Torrential rain
Lightning / Storms
Snow
Ice
Fog
Strong winds
Track‐side fires

Climate change adaptation needs of the core network of transport infrastructure in Spain
39
I.2.2. Maintenance and operation costs associated with climatic events The group of rail experts also compiled data on the costs associated with tasks to maintain facilities and ensure comfort, that aim at preventing or correcting aspects related to climatic variables. ADIF's Operations and Engineering Directorates provided the costs associated with the regular maintenance of drainage and bridges, and the control of vegetation for fire safety reasons (excluding the cost of herbicide treatment carried out on the platform itself for reasons of traffic safety). The Passenger Station Directorate carried out a study of the costs associated with air conditioning in stations and their correlation with thermal variations. The data provided by ADIF's Operations Directorates, although partial, reflect higher costs per kilometre of drain and bridge maintenance and vegetation control on the conventional network than on the high‐speed network (up to 10 times higher in the first case and 50% higher in the latter). The costs of air conditioning in stations are difficult to identify, since the electrical supply contract is comprehensive and does not have specific meters to measure the energy used for air conditioning alone. Based on data for Valladolid station, ADIF's Passenger Station Directorate estimated that air conditioning in summer involves an average increase of 7% in the annual energy consumption for each degree Celsius the average temperature rises; in winter, the gas consumption for heating decreases by around 15% for each degree Celsius the average annual temperature rises.
I.3. CURRENT VULNERABILITY OF THE PORT NETWORK The information on the impacts associated with the climatic events that currently have the greatest impact on port operations was compiled by means of an ad‐hoc questionnaire designed by the State Ports Agency and sent to the Port Authorities. The questionnaire distinguished between impacts caused by waves (waves at the entrance and in the outer area of the port, overtopping, internal agitation), the sea level (floods, draught restrictions due to low sea level, large waves), wind, rainfall and temperature, among others. Of a total of 27 Port Authorities, 24 responded to the questionnaire. Figure I.10 shows the percentage of these who indicated in their responses that they have operational problems in the port caused by some climatic variable. Figure I.10 shows that the majority of Port Authorities currently perceive wind and waves (due to wind seas or swell) to be the meteorological phenomena with the biggest impact on port operations. These carry the additional risk of paralysing activity in the majority of ports. Extreme precipitation also causes problems in almost half of ports, although it carries a lower risk of paralysing port activity. The potential for loss of life due to climatic events is generally low; the phenomena that cause most concern for Port Authorities are extreme winds, overtopping and waves at the entrance and in the outer area of the port. The responses submitted by the Port Authorities via the questionnaire indicate that the impact of climatic variables on port operations does not differ depending on the coastline on which the port is situated (Mediterranean or Atlantic).

Climate change adaptation needs of the core network of transport infrastructure in Spain
40
Figure I.10 Percentage of Port Authorities with port operation problems due to climatic variables
I.3.1. Vulnerability to waves The questionnaire responses show that excessive waves at the port entrance may impede the manoeuvrability of ships and limit the entry and exit of ships. They may also restrict towlines or affect towing operations (in the Port of Melilla, for example, the risk involved in carrying out entry manoeuvres with the sole assistance of a 1800‐HP tugboat is high enough that entry to the port is denied). In the case of swell, waves can reduce the water depth in the entry channel and restrict the passage of large vessels (as is the case in Huelva, for example). In many ports, strong waves may even prevent the embarkation and disembarkation of pilots, whether partially (e.g. for some large tankers and colliers in the Port of El Ferrol) or fully, which in practice means the suspension of services and, therefore, the paralysis of the port (the navigation channel for entry to the Port of Castellón has three alignments due to the berthing island owned by the oil company BP, so ships at the port entrance are laterally exposed to the effects of storms and pilots are not always willing to embark outside the port, which in practice represents its closure). Excessive waves outside the port may also prevent ships from anchoring or make some outer piers inoperative (as in Bilbao, where ship manoeuvres in some jetties in the port's industrial area are halted when an exterior significant wave height greater than 3 metres is recorded). They may also interrupt some short‐distance maritime services (as is the case with the regular passenger transport service across the Strait of Gibraltar between Algeciras and North Africa). As for overtopping events, these cause sporadic operational problems in around half of all Spanish ports. Much of the time, interrupting the passage of vehicles and people in the most exposed areas is usually enough to prevent damage. In fewer cases, overtopping can reduce port activity in certain piers by affecting port facilities, causing operations in some berths to stop or preventing mobility on the roads
Currents
Fog
0%
10%
20%
30%
40%
50%
60%
70%
80%
90%
100%
Waves at the entrance and
inside Overtopping
Interior agitation
Floods
Access problems at the
entran
ce
Draught restrictions
Large waves produced by
swell
Extrem
e winds
Air quality
Extrem
e precipitation
Cold or heat waves
Waves Sea level Wind OthersRainfall Temp.
With risk of suspension of port activity Without risk of suspension of port activity
Risk of suspension of port activity not specified

Climate change adaptation needs of the core network of transport infrastructure in Spain
41
on breakwaters and secondary breakwaters. The fact that the overtopping of breakwaters occurs fairly frequency is not necessarily a problem, provided it is taken into account at the design stage (e.g. in the Port of A Coruña, the overtopping of breakwaters starts when storms produce significant wave heights of 9‐10 metres, corresponding to a return period of 2.5 to 5 years). Internal agitation also has an impact on a considerable number of ports. Depending on its magnitude, the interior agitation may hinder navigation at the entry to piers (this applies especially to smaller vessels), make it difficult for some boats to moor (in the Port of El Ferrol, for example, operational experience over the last few years has shown that the unloading of solid bulk cargo has been affected during violent storms, resulting in the need to use tugboats that push the ship against dock bumpers to prevent damage to moorings), hinder operations in berths on inner slopes (as in the cases of berth 34B at the Energy Wharf in the Port of Barcelona, the operation of ro‐ro vessels at pier 13 in the Port of Alicante with a southern swell, and the embarkation of passenger ships connected to mechanical walkways in the Port of Málaga), or interfere with loading and unloading operations at inner jetties (e.g. for tankers in CEPSA's refinery jetty in the Port of Algeciras). In the case of Vigo, it causes occasional problems for passenger traffic in the estuary.
I.3.2. Vulnerability due to sea level Unlike waves, the current vulnerability of Spanish ports due to changes in sea level is somewhat limited and is not determined so much by its rise, but by the low water level that these changes will eventually cause in some ports. This will result in specific problems for some ships gaining access to piers with limited draught, the need for greater volumes of maintenance dredging (especially after storms), and certain access restrictions in low tide situations in some ports on the Atlantic coast. Flooding caused by the rise in sea level is unlikely to happen often and in a very small number of piers in ports. Problems caused by sea level changes in the event of a meteotsunami (a phenomenon of meteorological origin that typically occurs in certain areas of the Mediterranean), are also rare and are not responsible for halting activity in any of the state's ports. Problems affecting port operations as a result of large wave events caused by the swell occur in around a third of the ports, although very infrequently and with minimal impact. Among the effects mentioned are the movement of ships berthed at inner harbours, damage to moorings, and flooding and damage to jetties and some structures.
I.3.3. Vulnerability to extreme winds
Extreme winds occasionally restrict the access of certain kinds of ship to the port (e.g. in the Port of El Ferrol, tankers are especially sensitive to the wind as it passes through the entry channel) and their berthing and unberthing manoeuvres at jetties (e.g. if a wind greater than 25/35 knots from the north/south, respectively, is recorded in the industrial area of the Port of Bilbao). In rare cases, they may jeopardize the safe stay of ships moored and/or anchored in ports. When the forces
Two vessels stranded on El Saler beach after being trappedin Valencia anchorage because of a northeasterly wind witha speed of 60 knots and rough seas
Climate change adaptation needs of the core network of transport infrastructure in Spain
42
exerted on mooring cables are very high, it may be necessary to reinforce them and even use tugboats to assist large ships with a large surface area that is exposed to the wind. Extreme winds also hinder the loading and unloading operations of certain goods. In the case of containers, they may force the closure of port crane services or limit the height of stacks. In the Port of Cartagena, the loading and unloading of liquid bulk cargo is interrupted in the most exposed areas. In the Port of Melilla, lo‐lo operations may be stopped due to the risk of accidents. However, the most common problems in the Spanish port system arise from the handling of bulk powders (grains, soybeans, etc.), which causes an increase in the amount of solid particles in suspension and a decline in air quality; this affects adjacent port operators and nearby urban areas and can result in the interruption of operations if legal limits are exceeded, if there is a risk of allergens spreading, or in situations where the population affected is particularly sensitive. In addition to all of this, strong winds can cause damage to buildings within the port.
I.3.4. Vulnerability due to extreme precipitation As a result of extreme precipitation, some ports may experience problems with visibility affecting the manoeuvrability of ships, as well as flooding on inner roads and terminals, including access roads to the port. In the case of very heavy precipitation, it may be necessary to interrupt the loading/unloading of solid bulk cargo or limit some operations in other terminals. Power failures may also arise as a result of the water intrusion. In the Port of Cádiz, extreme precipitation causes sediment deposits in the Guadalete River, and this can result in navigation problems. In the specific case of the Port of Valencia, heavy precipitation sometimes makes it necessary to free up the berth opposite the mouth of the Turia River in order to drain off the water. The Mediterranean ports are especially sensitive to the phenomenon known as la gota fría (cold front), which typically occurs at the end of summer and the beginning of autumn. Flooding caused by heavy precipitation in the Atlantic ports may be exacerbated by high spring tides. Heavy rainfall also cause discharges in the inner harbours of the port due to the overflow of the city's sewage network (as is the case in Málaga and Ceuta), and this, in turn, may affect the water quality.
I.3.5. Vulnerability due to other phenomena According to the responses provided by the Port Authorities by means of the questionnaire sent by the State Ports Agency, intense fog, marine currents, extreme heat and electrical storms are phenomena that currently cause problems in a very small number of Spanish ports. Heavy fog causes a lack of visibility and significant danger for the operation of ships that can lead to port closures (in the Port of Avilés, for example, this occurs up to five times a year). The marine currents outside of ports can hinder approach manoeuvres in the South entrance of the Port of Barcelona and berthing operations at the piers outside the Port of Algeciras. Moreover, they affect the quality of the water by dispersing waste from ships and dredging sediments during extraction, transport and deposition operations. Electrical storms may affect ports' communication systems and the unloading operations of certain goods, such as liquefied natural gas. Meanwhile, heat waves can affect the unloading operations of reefer ships.

Climate change adaptation needs of the core network of transport infrastructure in Spain
43
I.4. CURRENT VULNERABILITY OF THE AIRPORT NETWORK Aena Aeropuertos has a historical record of incidents due to meteorological phenomena that may affect airport operations. The most common incident categories are wind shear, rainfall, snow/ice, storms, electrical storms/lightning, wind and poor visibility. These operational incidents are categorized according to the following impact levels:
Level 1 (maximum impact): the consequences caused by the incident are serious and entail: ‐ a complete or partial interruption of the service provided, and/or ‐ a significant reduction in the system capacity (>20%), and/or ‐ significant average delays in the overall scheduling of the airport (> 2 hours), and/or ‐ the establishment of some kind of emergency measure, and/or ‐ a significant social impact, and/or ‐ an accident, and/or ‐ a punctuality level below 30%.
Level 2 (medium impact): the consequences caused by the incident create difficulties in the normal operations of the airport system and/or air navigation. These involve: ‐ a significant reduction in the system capacity (between 10% and 20%), and/or ‐ significant average delays in the overall scheduling of the airport (1‐2 hours), and/or ‐ resolution of the impact through the usual established channels without the need to
activate a one‐off plan, and/or ‐ a minor social impact, and/or ‐ serious incidents, and/or ‐ a punctuality level between 30% and 50%.
Level 3 (low impact): the consequences caused by the incident do not alter operational scheduling, although they hinder the normal operation of the airport or air navigation centre and are resolved through the usual channels established. No significant social impact is expected. They involve: ‐ A significant reduction in system capacity, not greater than 10%, and/or ‐ significant average delays in the overall scheduling of the airport (between ½ and 1 hour),
and/or ‐ a low social impact, and/or ‐ incidents, and/or ‐ a punctuality level between 50% and 60%.
Aena Aeropuertos registers almost 900 incidents a year due to weather events in the whole Spanish airport system. The majority of these incidents have a low impact level, although 6%‐7% create difficulties in normal airport operations and 2%‐3% involve serious consequences. Figure I.11 shows the distribution of these incidents by airport. The majority of the incidents result from activation of the LVP due to poor visibility11 (see Figure I.12). The number of incidents that occur as a result of wind is also considerable. Snow and ice are other factors that cause a high percentage of level 1 incidents and storms are a major factor in level 2 incidents.
11 The LVP (acronym for Low Visibility Procedure) is a procedure that is activated to maintain safe and regular
conditions for the surface movement of aircraft, vehicles and people, when the visibility range is very low. The determining factor in activation of the LVP is the runway visual range (due to fog, as well as rain and snow) along with the height of the cloud base.
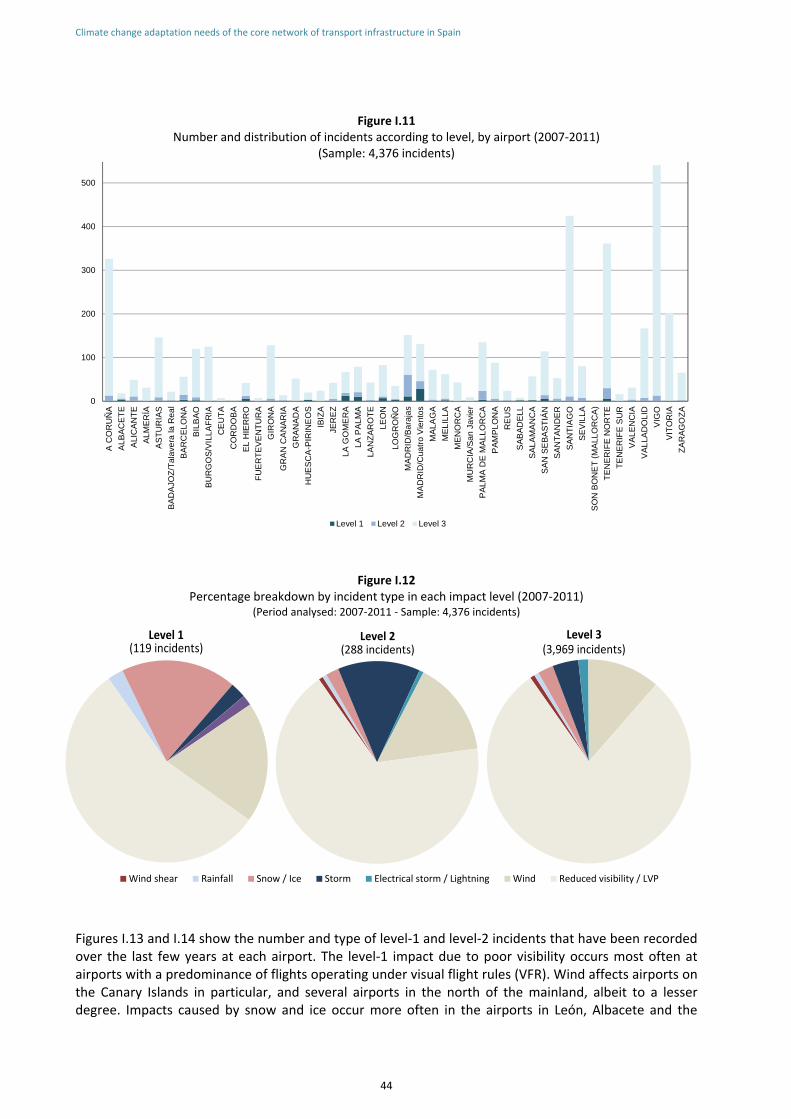
Climate change adaptation needs of the core network of transport infrastructure in Spain
44
Figure I.11 Number and distribution of incidents according to level, by airport (2007‐2011)
(Sample: 4,376 incidents)
Figure I.12 Percentage breakdown by incident type in each impact level (2007‐2011)
(Period analysed: 2007‐2011 ‐ Sample: 4,376 incidents)
Figures I.13 and I.14 show the number and type of level‐1 and level‐2 incidents that have been recorded over the last few years at each airport. The level‐1 impact due to poor visibility occurs most often at airports with a predominance of flights operating under visual flight rules (VFR). Wind affects airports on the Canary Islands in particular, and several airports in the north of the mainland, albeit to a lesser degree. Impacts caused by snow and ice occur more often in the airports in León, Albacete and the
0
100
200
300
400
500
A C
OR
UÑ
A
AL
BA
CE
TE
ALI
CA
NT
E
ALM
ER
ÍA
AS
TU
RIA
S
BA
DA
JOZ
/Ta
lave
ra la
Rea
l
BA
RC
ELO
NA
BIL
BA
O
BU
RG
OS
/VIL
LA
FR
IA
CE
UT
A
CO
RD
OB
A
EL
HIE
RR
O
FU
ER
TE
VE
NT
UR
A
GIR
ON
A
GR
AN
CA
NA
RIA
GR
AN
AD
A
HU
ES
CA
-PIR
INE
OS
IBIZ
A
JER
EZ
LA
GO
ME
RA
LA
PA
LM
A
LA
NZ
AR
OT
E
LEO
N
LOG
RO
ÑO
MA
DR
ID/B
ara
jas
MA
DR
ID/C
uatr
o V
ient
os
MA
LAG
A
ME
LILL
A
ME
NO
RC
A
MU
RC
IA/S
an
Javi
er
PA
LM
A D
E M
AL
LO
RC
A
PA
MP
LO
NA
RE
US
SA
BA
DE
LL
SA
LA
MA
NC
A
SA
N S
EB
AS
TIÁ
N
SA
NT
AN
DE
R
SA
NT
IAG
O
SE
VIL
LA
SO
N B
ON
ET
(M
ALL
OR
CA
)
TE
NE
RIF
E N
OR
TE
TE
NE
RIF
E S
UR
VA
LE
NC
IA
VA
LLA
DO
LID
VIG
O
VIT
OR
IA
ZA
RA
GO
ZA
Level 1 Level 2 Level 3
Wind shear Rainfall Snow / Ice Storm Electrical storm / Lightning Wind Reduced visibility / LVP
Nivel 2(288 incidencias)
Nivel 1(119 incidencias)
Nivel 3(3.969 incidencias)
Level 1 (119 incidents)
Level 2 (288 incidents)
Level 3 (3,969 incidents)

Climate change adaptation needs of the core network of transport infrastructure in Spain
45
Madrid area, while storms interfere primarily with airport operations in Madrid‐Barajas and Palma de Mallorca.
Figure I.13 Number of level‐1 incidents by airport and type (Period analysed: 2007‐2011 ‐ Sample: 119 incidents)
Figure I.14 Number of level‐2 incidents by airport and type (Period analysed: 2007‐2011 ‐ Sample: 288 incidents)
0
5
10
15
20
25
A C
OR
UÑ
A
ALB
AC
ETE
ALI
CA
NTE
AS
TUR
IAS
BA
DA
JOZ/
Tala
vera
la R
eal
BA
RC
ELO
NA
BIL
BA
O
EL
HIE
RR
O
GIR
ON
A
GR
AN
CA
NA
RIA
HU
ES
CA
-PIR
INE
OS
LA G
OM
ER
A
LA P
ALM
A
LEO
N
LOG
RO
ÑO
MA
DR
ID/B
araj
as
MA
DR
ID/C
uatro
Vie
ntos
ME
LILL
A
PA
LMA
DE
MA
LLO
RC
A
PA
MP
LON
A
RE
US
SA
BA
DE
LL
SA
LAM
AN
CA
SA
N S
EB
AS
TIÁ
N
TEN
ER
IFE
NO
RT
E
VA
LEN
CIA
VA
LLA
DO
LID
VIT
OR
IA
ZA
RA
GO
ZA
Rainfall Snow / Ice Storm Electrical storm / Lightning Wind Reduced visibility / LVP
Wind shear Rainfall Snow / Ice Storm Electrical storm / Lightning Wind Reduced visibility / LVP
0
10
20
30
40
50
A C
OR
UÑ
A
AL
BA
CE
TE
AL
ICA
NT
E
ALM
ER
ÍA
AS
TU
RIA
S
BA
DA
JOZ
/Tal
ave
ra la
Rea
l
BA
RC
ELO
NA
BIL
BA
O
BU
RG
OS
/VIL
LAF
RIA
CO
RD
OB
A
EL
HIE
RR
O
GIR
ON
A
GR
AN
CA
NA
RIA
GR
AN
AD
A
HU
ES
CA
-PIR
INE
OS
JER
EZ
LA
GO
ME
RA
LA
PA
LMA
LA
NZ
AR
OT
E
LE
ON
LO
GR
OÑ
O
MA
DR
ID/B
araj
as
MA
DR
ID/C
uatr
o V
ien
tos
MA
LAG
A
ME
LILL
A
PA
LM
A D
E M
ALL
OR
CA
PA
MP
LON
A
RE
US
SA
LAM
AN
CA
SA
N S
EB
AS
TIÁ
N
SA
NT
AN
DE
R
SA
NT
IAG
O
SE
VIL
LA
TE
NE
RIF
E N
OR
TE
VA
LE
NC
IA
VA
LL
AD
OL
ID
VIG
O
ZA
RA
GO
ZA

Climate change adaptation needs of the core network of transport infrastructure in Spain
46

Climate change adaptation needs of the core network of transport infrastructure in Spain
47
APPENDIX II: CURRENT WEATHER WARNING SYSTEMS
II.1. AEMET'S METEOALERTA WARNING PLAN In its capacity as a provider of meteorological services, AEMET monitors a large number of weather‐related phenomena and, in turn, has the alert plan Meteoalerta (National Plan for the Prediction and Monitoring of Adverse Weather Events). Meteoalerta establishes procedures for issuing the warnings provided by AEMET on a general basis and the threshold values used for each type of event, according to region (at province level or at provincial area level). According to this plan, situations associated with the following adverse weather events, among others, result in a warning being issued:
Rainfall (accumulation in mm/hour or shorter period, and/or mm/12 hours)
Snowfall (depth of accumulated snow on the ground in 24 hours)
Winds (speed of maximum wind gusts)
Storms (occurrence and degree of intensity)
Maximum temperatures
Minimum temperatures
Coastal phenomena: ‐ Wind in coastal areas ‐ Wind wave height ‐ Swell height
Galernas (a violent northwesterly wind that affects the north coast of Spain) in the Cantabria area (occurrence and intensity)
Meteotsunamis in the Balearic Islands
Fog
Heat waves (special warning)
Tropical storm (special warning) The warnings issued differentiate four different alert levels, depending on the adversity thresholds reached: green (no risk), yellow (risk for some activities only), orange (major risk) and red (extreme risk). The Meteoalerta threshold values are defined based on the effect the event has on the normal activity of the population, and the likelihood of it posing a danger to people or property. Therefore, the thresholds, which in some cases vary according to provincial area, are not adapted to the specific needs of operators or users of each mode of transport.
II.2. SPECIFIC WARNINGS FOR THE CORE ROAD NETWORK The current meteorological alert systems for the core road network are primarily based on the warnings provided by AEMET through its Meteoalerta plan. In the case of the state‐owned road network, AEMET issues daily information to the Tele‐Ruta Service concerning weather events that are particularly unfavourable for the operation of the road, and have a yellow, orange or red alert level. The Tele‐Ruta Service then reissues these warnings to the control centres of the maintenance companies, concessionaire companies, State Roads Delegations and Road Units, except in the case of yellow alerts, which are only issued when they relate to snow. For some road

Climate change adaptation needs of the core network of transport infrastructure in Spain
48
sections that are especially prone to snow and/or ice events, the corresponding State Roads Delegation and AEMET have redefined the pre‐emergency levels used in order to gain flexibility in the application of preventive measures in winter road maintenance. Some concessionaire and maintenance companies also hire private weather forecasting service companies to provide information on adverse winter road conditions. Meanwhile, although the Directorate‐General for Traffic does not produce weather forecasts, it issues information internally to road maintenance and operations centres, Provincial Traffic Headquarters and regional traffic control centres on the expected road conditions based on data obtained from its network of SEVAC (road weather sensors) stations.
The Directorate‐General for Traffic also has a system prototype that issues alerts for wind, precipitation, snow and ice events for part of the Spanish road network. This is being developed in collaboration with AEMET (see Figure II.1). The forecasts are produced 24 hours a day for 5‐km road sections and are updated on an hourly basis. The warning thresholds were defined by the Directorate‐General for Traffic based on the expected impact of each weather event on the road
conditions, and they are the same across the whole network.
II.3. WARNING SYSTEMS ON THE RAIL NETWORK For the rail network, AEMET also produces 24‐hour weather forecasts on wind speed, rainfall intensity and snow depth for every 5 km of certain sections of the conventional and high‐speed networks, and sends them to ADIF every six hours. AEMET issues a warning alert (yellow, orange and red levels) whenever the thresholds established by ADIF are exceeded in any of the four six‐hour sub‐periods that make up the 24‐hour forecast period. The warning thresholds are the same across the whole rail network agreed upon by ADIF and AEMET, except in the case of wind, for which different thresholds have been established for the conventional and high‐speed networks. Depending on the alert level, these warnings trigger preventive measures established by ADIF's Contingency Plan12 in order to minimize the impact of inclement weather on the railway infrastructure and the movement of trains. In the case of rainfall, ADIF has identified sections of the network and classed them as being at medium, medium‐high or high risk to heavy rain, and this allows it to set in motion preventive measures that differ depending on the alert and risk levels.
12 ADIF has a Contingency Plan that allows it to categorize and solve any problems that disrupt rail traffic. This
plan includes a series of fact sheets containing guidelines for acting in (pre‐)emergency situations for four types of impact associated with climatic events: rain intensity, wind intensity, depth of snow and fires.
Figure II.1 Prototype of the weather alert system developed
by the Directorate‐General for Traffic

Climate change adaptation needs of the core network of transport infrastructure in Spain
49
ADIF has recently added a module for adverse weather alerts to its software applications that provides a simple way of viewing the warnings generated daily by AEMET. This has led to considerable improvements in the way the weather warnings are processed, by allowing decisions to be taken as quickly as possible and optimizing mobilization of the human and technical resources required. In 2011, Renfe Operadora started using a software application called Borrasca, which was developed by a private company and provides Renfe with advance information on any changes in the weather conditions over the coming hours that could affect the movement of its trains, in order to allow it to establish preventive measures. This application provides information adapted to the railway system on the forecasting of snow, precipitation in the form of rain, extreme temperatures, wind (direction and speed), fog, ice formation and lightning. The information can be visualized graphically, by viewing the whole peninsula or by focusing on a specific point. Every time an adverse weather situation that exceeds the thresholds set out by Renfe is forecast for a section over the coming 24 hours, the application displays an alarm directly on the map that indicates to the operator the alert type, the cause, the start and finish times, and the section of railway that is expected to be affected by the weather event. The application also includes information on AEMET's general warnings. Thus, Renfe is able to access information on the evolution and intensity of the weather event and plan for its effects, thereby improving material scheduling, the planning of alternative means where necessary, and the activation of the emergency services, all of which results in cost reductions and customer service improvements. Since its implementation, the tool has been managed by the Control Operations Centre (CECON), and when the training process is complete, the Management Centres for the different activity areas affected will have access to it.
II.4. WARNING SYSTEMS DUE TO MARINE PHENOMENA The State Ports Agency, in collaboration with AEMET, has developed various networks for measuring marine variables and three‐day forecasting systems, which it has made available to the Port Authorities to enable them to make operational decisions based on alert systems. The abovementioned measuring networks include the deep‐water buoy network, which consists of 15 stations equipped with complex oceanographic buoys that measure oceanographic parameters (waves, currents, water temperature and salinity) and meteorological parameters (wind, air temperature and atmospheric pressure), and REDMAR, a tide‐gauge network, which consists of 40 stations for monitoring the sea level in real time. The forecasting systems provide three‐day predictions of oceanographic variables based on atmospheric fields supplied by AEMET and data from the measuring networks. The systems that are currently operational are the Sea‐level forecasting system. known as Nivmar ‐ which provides forecasts that include the effect of the atmosphere ‐, the Wave forecast system ‐ which provides information on the state of waves over the coming days and includes high‐resolution modules with the capacity to forecast the interior agitation of ports ‐ and, lastly, the System for predicting water currents in coastal areas ‐ which is based on complex ocean circulation models that provide forecasts for the currents around Spanish coasts ‐. The wave forecast system, which is currently being used in more than half of all Spanish mainland ports and two thirds of island ports, provides the significant wave height, its average direction of propagation and its average and peak periods (see Figure II.2). The forecast covers a region measuring around 600 km2 in the area outside the port; in some mainland ports a module for the prediction of the interior agitation of the port is also included.

Climate change adaptation needs of the core network of transport infrastructure in Spain
50
Based on data from the measuring networks and forecasting systems, alerts in real time and for the next few days, respectively, are generated. These alerts are made available to end users via the Internet or via IMar, an application for mobile devices, through the use of a colour code with four risk levels for different areas of the Spanish coastline (see Figure II.3). There are also personalized transmission mechanisms (email, SMS, etc.) for Port Authorities with specific needs.
II.5. WARNING SYSTEMS IN AIRPORTS In accordance with Spanish law, AEMET is responsible for providing the weather forecasting services required to ensure the safety and efficiency of air transport.
Figure II.3Graphic systems used by the State Ports Agency for communicating forecasts and alerts
Figure II.224‐hour forecast of the waves in the Port of Bilbao and of the internal agitation in the port

Climate change adaptation needs of the core network of transport infrastructure in Spain
51
The forecasting service provided by AEMET for all airports on the core network includes, firstly:
Terminal aerodrome forecasts (TAFs), which provide the most likely behaviour of different weather parameters (wind speed and direction, visibility, cloudiness, meteorological phenomena and temperature) in the aerodrome over the coming nine or 24/30 hours.
Trend type forecasts (Trends), which forecast the conditions of wind speed and direction, visibility, cloudiness and meteorological phenomena for landing over the following two‐hour period.
The thresholds for issuing TAFs and Trends, which are published in Spain's AIP (Aeronautical Information Publication), are common to all Spanish airports, except in the case of wind at Madrid‐Barajas airport, for which they are customized. AEMET's forecasting service also includes the following for all airports on the core network:
Aerodrome alerts, which provide information on the weather conditions that may occur in the following 24 hours and that may have an adverse effect on the aircraft on the ground, including parked aircraft, and the airport facilities and services. The predicted events that the aerodrome alerts relate to include the following: ‐ Average wind speed with maximum gust ‐ Average surface wind (direction and speed) with maximum gust ‐ Squall (a sudden, sharp increase in wind speed that generally lasts for at least a minute) ‐ Storm ‐ Hail ‐ Snow (including predicted snow accumulation) ‐ Freezing precipitation ‐ Frost or soft rime ‐ Ground frost ‐ Precipitation accumulated in 1 or 12 hours
The threshold values for issuing aerodrome alerts are available in Spain's AIP. The thresholds for maximum wind gusts and accumulated precipitation in 1 or 12 hours are specific to each airport. In some airports, the maximum wind gust thresholds also differ depending on the wind direction.
Very short‐term lightning and storm forecasts. Using data from its electrical discharge detector network, AEMET generates warnings about lightning observed in the vicinity of each airport, primarily to support aircraft‐refuelling activities. Depending on the location of the lightning detected in relation to the airport, four warning types are generated: pre‐alert (25 km), alert (8 km), maximum alert (5 km) and normal situation (when 10 minutes have passed without any new impacts in the inner areas). With the help of numerical prediction models, warnings of thunderstorms that may affect the airport in the next 20 minutes are also generated. Aena Aeropuertos uses electrical storm warnings to activate its procedure for suspending aircraft refuelling, if necessary.
II.6. FLOOD RISK WARNINGS The Norma Básica de Protección Civil (Basic Civil Protection Standard) considers the risk of flooding to be subject to a special plan of action. As a consequence, both the state and the Spanish regions should prepare a civil protection plan that establishes the organization of, and procedures for, measures against flood risk.

Climate change adaptation needs of the core network of transport infrastructure in Spain
52
The State Civil Protection Plan Against the Risk of Flooding, of September 2011, takes into account all flood events that pose a risk for people and their property, cause damage to basic infrastructure or interrupt essential services. This State Plan considers flood events that are the result of in situ
precipitation, as well as those caused by surface runoff, high floodwaters or overflowing rivers, caused or exacerbated by precipitation, snowmelt, obstruction of natural or artificial waterways, intrusion of water flow, siltation or drainage problems, and the action of the tides. To enable the National Civil Protection System authorities to make early decisions, the State Plan provides for the establishment of a hydro meteorological alert system based on the water administrations' hydrological information systems and AEMET's weather forecasting systems.
Currently, alert notifications are issued depending on AEMET's weather predictions, the state of ground saturation, the monitoring of the automatic hydrological information systems (SAIHs) of basin organizations, and the level of water in the reservoirs and the capacity to regulate them.
Flooded plots of land alongside the runway at Córdoba Airport due tofloodwaters from the Guadalquivir River following heavy rainfall

Climate change adaptation needs of the core network of transport infrastructure in Spain
53
APPENDIX III: LIST OF PARTICIPANTS
III.1. WORKING GROUP The Working Group that conducted this analysis was made up of the following units and bodies from the Grupo Fomento and the Ministerio de Agricultura, Alimentación y Medio Ambiente:
Grupo Fomento:
Dirección General de Carreteras: Fuencisla Sancho (Subdirectora General de Estudios y Proyectos).
Dirección General de Ferrocarriles: Jorge Ballesteros (Subdirector General de Planificación y Proyectos).
Administrador de Infraestructuras Ferroviarias – ADIF: Pedro Pérez (Gerente de Área de Medio Ambiente e Integración Ambiental. Dirección de Actuaciones Complementarias. Dirección General de Explotación y Construcción), apoyado por María del Amor García (Técnico de Sostenibilidad del Área de Medio Ambiente e Integración Ambiental).
RENFE Operadora: Gabriel Castañares (Técnico de Estudios Ambientales de la Gerencia de Sostenibilidad; Gerencia de Área de Estudios, Innovación y Sostenibilidad).
Puertos del Estado: Enrique Álvarez (Jefe del Área de Conocimiento de Medio Físico; Subdirección Medio Físico y Ayudas a la Navegación; Dirección Técnica).
AENA Aeropuertos: José Mª Guillamón (Jefe de la División de Estrategia, Mediación Ambiental y Sistemas de Gestión; Dirección de Planificación y Medio Ambiente) / Mónica Solbes (Jefa de la División de Mediación Ambiental; Dirección de Planificación y Medio Ambiente).
Subdirección General de Planificación de Infraestructuras y Transporte de la Secretaría de Estado de Infraestructuras, Transporte y Vivienda: Eduardo Pallardó (Subdirector General).
División de Prospectiva y Tecnología del Transporte de la Secretaría General de Transporte: Jesús Merchán (Coordinador).
Ineco, Ingeniería y Economía del Transporte: José de Oña (Director de Negocio Carreteras, Ineco).
Centro de Estudios y Experimentación de Obras Públicas – CEDEX: Alberto Compte (Director del Centro de Estudios de Técnicas Aplicadas), apoyado por Fernando Pardo (Director del Laboratorio de Geotecnia), Antonio Jiménez (Director de Estudios y Medio Ambiente del Centro de Estudios Hidrográficos) y Pablo Díaz (Jefe del Área de Estudios y Auscultación de Estructuras del Laboratorio Central de Estructuras y Materiales).
Ministerio de Agricultura, Alimentación y Medio Ambiente:
Oficina Española de Cambio Climático: José Ramón Picatoste (Jefe del Área de Estrategias de Adaptación; Subdirección General de Coordinación de Acciones frente al Cambio Climático).
Agencia Estatal de Meteorología – AEMET: Ernesto Rodríguez y Mª Jesús casado (Área de Modelización y Evaluación del Clima) y Ana Casals (Área de Predicción Operativa)
Dirección General de Calidad y Evaluación Ambiental y Medio Natural: Elisa Rivera (Vocal Asesora de la Subdirección General Calidad del Aire y Medio Ambiente Industrial).
The European Environment Agency (EEA) participated in the design of this initiative from the outset and in the Working Group's discussions. It was represented by Alfredo Sánchez (Project Manager Transport).

Climate change adaptation needs of the core network of transport infrastructure in Spain
54
III.2. GROUPS OF EXPERTS BY MODE OF TRANSPORT
Group of road experts The group of road experts was coordinated by the Subdirección General de Estudios y Proyectos of the General Directorate for Roads (Ministry of Fomento), and the following experts participated:
Mª Dolores Sánchez y Elena Mª López (Subdirección General de Estudios y Proyectos. Dirección General de Carreteras del Ministerio de Fomento).
José de Oña y Elena Puente (Ineco‐Carreteras).
Alejandro Mosquera (Subdirección General de Explotación y Gestión de Red. Dirección General de Carreteras del Ministerio de Fomento).
Álvaro Navareño y Guillermo Llopis (Subdirección General de Conservación. Dirección General de Carreteras del Ministerio de Fomento).
Camino Arce (Subdirección General de Construcción. Dirección General de Carreteras del Ministerio de Fomento).
Paola Ramírez (Unidad de Carreteras de Ávila. Ministerio de Fomento).
Juana I. González (Unidad de Carreteras de Cáceres. Ministerio de Fomento).
José I. Cuñado (Unidad de Carreteras de Madrid. Ministerio de Fomento).
José Vidal Corrales (Unidad de Carreteras de Palencia. Ministerio de Fomento).
Carlos Casas (Unidad de Carreteras de Teruel. Ministerio de Fomento).
Javier Payán (Unidad de Carreteras de Valladolid. Ministerio de Fomento).
Juan José Campos (Dirección General de Infraestructura Viaria. Consejería de Obras Públicas, Transporte y Política Territorial del Gobierno de Canarias).
Carmen Velilla (Dirección General de Infraestructuras. Consejería de Fomento y Vivienda de la Junta de Andalucía).
Group of rail experts The group of rail experts was coordinated by the Subdirección de Medio Ambiente of ADIF, and the following experts participated:
Pedro Pérez, María del Amor García y Beatriz Quevedo (Subdirección de Medio Ambiente, ADIF).
Fidel Corral y Santiago Rallo (Dirección de Proyectos y Obras de Alta Velocidad, ADIF).
Ana Espín, Javier Movilla, Marta Gómez y María Berlanga (Dirección de Operaciones e Ingeniería de Red de Alta Velocidad, Dirección General de Explotación y Desarrollo de la Red, ADIF).
Luis Esteras (Dirección de Operaciones e Ingeniería de Red Convencional, Dirección General Explotación y Desarrollo de la Red, ADIF).
Francisco José de la Vega (Dirección de Planificación y Gestión de la Red, Dirección General Explotación y Desarrollo de la Red, ADIF).
Alicia Murga y Jorge Pobo (Dirección de Estaciones de Viajeros, Dirección General Servicios a Clientes y Patrimonio, ADIF).
Gabriel Castañares (Gerencia de Sostenibilidad, RENFE Operadora).
Group de port experts The group of port experts was coordinated by the Area de Conocimiento de Medio Físico of the Spanish Ports Agency, and the following experts participated:

Climate change adaptation needs of the core network of transport infrastructure in Spain
55
Enrique Álvarez, Roland Aznar, Marta Gómez, Susana Pérez, Begoña Pérez, Gonzalo Gómez y Ana Lope (Puertos del Estado).
Jordi Vila (Autoridad Portuaria de Barcelona).
J.M. Basora (Autoridad Portuaria de Tarragona).
Fernando Berenguer (Autoridad Portuaria de Baleares).
I. Pascual (Autoridad Portuaria de Valencia).
José María Gómez (Autoridad Portuaria de Cartagena).
Juan Manuel Paramio (Autoridad Portuaria de Melilla).
Damià Gomis, Marta Marcos y Gabriel Jordà (Institut Mediterrani d'Estudis Avançats, IMEDEA).
Group of airport experts The group of airport experts was coordinated by the Dirección de Planificación y Medio Ambiente of Aena Aeropuertos, and the following experts participated:
Eduardo Milanés (Departamento de Gestión Internacional y Sostenibilidad. División de Mediación Ambiental. División de Calidad y Medio Ambiente. Dirección de Planificación y Medio Ambiente. Aena Aeropuertos).
Carlos Cadenas (Dirección de Consultoría y Medio Ambiente. Ineco).
Sergio Alonso (Departamento de Análisis y Control de la División de Operaciones. Dirección de Operaciones, Seguridad y Servicios. Aena Aeropuertos).
Julio Antoñanzas (División de Sistemas Eléctricos. Dirección de Construcción, Instalaciones y Energía. Dirección de Infraestructuras y Tecnología. Aena Aeropuertos).