accompanying the document report from the commission to
TRANSCRIPT

EN EN
EUROPEAN COMMISSION
Brussels, 15.6.2016
SWD(2016) 200 final
COMMISSION STAFF WORKING DOCUMENT
Accompanying the document
Report from the Commission to the European Parliament and the Council
on the review of the wholesale roaming market
{COM(2016) 398 final}

2
COMMISSION STAFF WORKING DOCUMENT
Accompanying the document
Report from the Commission to the European Parliament and the Council
on the review of the wholesale roaming market
Table of Contents
Table of Figures ...................................................................................................................................... 5
Table of Tables ....................................................................................................................................... 7
List of Acronyms .................................................................................................................................... 8
1. INTRODUCTION .............................................................................................................................. 11
2. THE COMMISSION'S APPROACH TO THE REVIEW OF NATIONAL WHOLESALE MARKETS AND ITS
LEGISLATIVE PROPOSAL ........................................................................................................................ 13
2.1. Information and data gathering on wholesale and retail roaming markets ........................... 13
2.2. Analysis of the data ............................................................................................................... 14
2.3. External study to estimate the costs of providing wholesale roaming services .................... 14
2.4. Public consultation ................................................................................................................ 15
2.5. BEREC input ........................................................................................................................ 15
2.6. Commission's inter-service group ......................................................................................... 16
2.7. The report on national wholesale roaming markets (this report) .......................................... 16
2.8. Impact assessment for the Commission's legislative proposal .............................................. 16
3. OVERVIEW OF THE EU ROAMING REGULATIONS AND MARKET DEVELOPMENTS (2007-2015) ... 16
3.1. Evolution of the EU Roaming Regulations (2007-2015) ...................................................... 16
3.2. Evolution of wholesale and retail roaming prices (2007-2015) ............................................ 20
3.2.1. Retail roaming prices .................................................................................................... 20
3.2.2. Wholesale roaming prices ............................................................................................. 22
3.3. Evolution of roaming traffic in Europe ................................................................................. 24
4. COMPETITION DEVELOPMENTS IN RETAIL ROAMING MARKETS .................................................... 26
4.1. Description of the Commission's approach ........................................................................... 26
4.1.1. Literature review ........................................................................................................... 26
4.1.2. Questionnaires to operators and analysis of the data .................................................... 26
4.2. Market failures in retail roaming markets ............................................................................. 27
4.2.1. Imperfect substitutes at the retail level .......................................................................... 27
4.2.2. Lack of tariff transparency and bill shock ..................................................................... 29

3
4.2.3. Inelastic demand for roaming services for a significant proportion of the customer base
29
4.3. Domestic price level and consumption pattern ..................................................................... 31
4.4. A comparison of retail roaming and domestic traffic ........................................................... 31
4.5. Retail roaming offers ............................................................................................................ 35
4.6. Current technological developments as potential substitutes to roaming ............................. 36
4.7. Conclusion ............................................................................................................................ 39
5. ASSESSMENT OF THE COST OF PROVIDING WHOLESALE ROAMING SERVICES IN THE EEA ........... 40
5.1. Introduction ........................................................................................................................... 40
5.2. Description of the Commission's approach ........................................................................... 40
5.2.1. Questionnaires to NRAs and operators ......................................................................... 41
5.2.2. External study to estimate wholesale roaming costs ..................................................... 41
5.2.2.1. The call for tenders ................................................................................................... 41
5.2.2.2. The objectives of the study ....................................................................................... 41
5.2.2.3. Consultation with NRAs and mobile operators ........................................................ 41
5.3. Previous estimates of wholesale roaming costs .................................................................... 42
5.4. The TERA Consultants cost model ....................................................................................... 42
5.4.1. The approach followed by TERA Consultants ............................................................. 43
5.4.2. High level assumptions in TERA's cost model ............................................................. 44
5.4.2.1. The choice of cost standard ....................................................................................... 44
5.4.2.2. The approach to cost modelling ................................................................................ 46
5.4.2.3. Estimation of network costs ...................................................................................... 47
5.4.2.4. Roaming-specific costs ............................................................................................. 54
5.4.2.5. Impact of seasonality ................................................................................................ 57
5.4.2.6. Total estimated wholesale roaming costs .................................................................. 59
5.5. Termination rates .................................................................................................................. 60
5.6. Transit costs .......................................................................................................................... 62
5.7. Comparison of the voice cost estimates derived from TERA's study against an alternative
approach based on national mobile termination rates ....................................................................... 63
5.8. Cost estimates for SMS services ........................................................................................... 66
5.9. Conclusion on the costs of wholesale roaming services ....................................................... 67
6. DEGREE OF COMPETITION IN WHOLESALE ROAMING MARKETS ................................................... 68
6.1. Description of the Commission's approach ........................................................................... 69
6.1.1. Literature review and previous studies ......................................................................... 69
6.1.2. Questionnaire to operators and analysis of the data ...................................................... 69
6.1.3. Public consultation ........................................................................................................ 70

4
6.2. Market failures in wholesale roaming markets ..................................................................... 70
6.2.1. Natural oligopoly structure, which fosters low intensity of competition ...................... 70
6.2.2. Imperfect wholesale roaming substitutes ...................................................................... 71
6.2.3. Double marginalisation and difficulties in coordination ............................................... 71
6.2.4. Bilateral nature of wholesale roaming agreements ....................................................... 72
6.2.5. Exclusion of MVNOs from wholesale roaming markets .............................................. 72
6.3. Overview of wholesale roaming agreements ........................................................................ 73
6.3.1. Standard Roaming Agreements and roaming discount agreements .............................. 73
6.3.2. Bilateral and unilateral roaming agreements ................................................................. 73
6.3.3. Number of roaming agreements in each destination country ........................................ 74
6.3.4. Pricing models .............................................................................................................. 74
6.3.5. Permanent roaming ....................................................................................................... 75
6.3.6. Machine-to-Machine communications (M2M) ............................................................. 76
6.4. Description of the wholesale roaming market in the EU ...................................................... 77
6.4.1. Wholesale roaming traffic flows between Member States............................................ 77
6.4.2. Wholesale roaming traffic compared to retail domestic traffic ..................................... 79
6.4.3. Wholesale roaming payments and revenues balance .................................................... 82
6.4.4. Wholesale roaming prices in the EU ............................................................................ 84
6.5. Degree of competition in national wholesale roaming markets ............................................ 87
6.5.1. Operators' views of the functioning of the national wholesale roaming markets ......... 87
6.5.2. Operators' views about the ability of the current functioning of national wholesale
roaming markets to enable RLAH in the EU ................................................................................ 90
6.5.3. MVNOs' views of the functioning of the national wholesale roaming markets ........... 90
6.5.4. Wholesale roaming prices vs wholesale and retail domestic prices and underlying costs
91
6.5.5. Presence of pan-European mobile operators ................................................................. 93
6.5.6. Inside vs outside group roaming ................................................................................... 95
6.5.6.1. Steering roaming traffic inside the group.................................................................. 95
6.5.6.2. Inside vs outside group wholesale roaming prices .................................................... 96
6.5.7. Competitive situation of operators with limited geographic scope ............................... 99
6.6. Conclusions ......................................................................................................................... 103
7. RLAH IN 2017 ............................................................................................................................. 104
8. CONCLUSIONS ............................................................................................................................. 105
BIBLIOGRAPHY ............................................................................................................................... 108
ANNEX 1: Existing 'Roam-Like-At-Home' (RLAH) offers .............................................................. 110
ANNEX 2: Wholesale roaming price paid and received ................................................................... 111

5
ANNEX 3: Roaming traffic flows between countries ....................................................................... 112

6
Table of Figures
Figure 1 - EEA average retail price per minute for intra-EEA roaming voice calls made ................... 20
Figure 2 - EEA average retail price for intra-EEA outgoing SMS ....................................................... 21
Figure 3 - EEA average retail price per MB ......................................................................................... 21
Figure 4 - EEA average price per minute for wholesale non-group roaming voice calls ..................... 22
Figure 5 - Average wholesale price per intra-EEA roaming SMS: charges to non-group companies .. 23
Figure 6 - Average wholesale data price per MB (prepaid+postpaid), EEA average ........................... 23
Figure 7 - Roaming traffic index: intra-EEA outgoing calls (Q3 2008=100) ....................................... 24
Figure 8 - Retail SMS sent traffic index (Q3 2008=100)...................................................................... 25
Figure 9 - Retail roaming data traffic index: (Q3 2008 = 100) ............................................................. 25
Figure 10 - Intra-EEA retail roaming revenues as % of total retail revenues (x-axis) .......................... 32
Figure 11 - Intra-EEA retail roaming traffic as % of total retail traffic (outgoing minutes) ................. 33
Figure 12 - Intra-EEA retail roaming consumption as % of total retail consumption (outgoing SMS) 33
Figure 13 - Intra-EEA retail roaming consumption as % of total retail consumption (data) ................ 34
Figure 14 - Intra-EEA retail roaming revenues and volumes as % of total retail revenues and volumes
(y-axis) by country, 2014 ...................................................................................................................... 35
Figure 15. Steps in the estimation of costs in the TERA cost model .................................................... 47
Figure 16: Re-allocation of costs not recovered through voice and SMS termination ......................... 48
Figure 17: Example of re-balancing of costs with effective mobile termination rates ......................... 49
Figure 18: TERA's cost estimates for voice origination after re-balancing for national MTRs under
Scenario B (€c/min) .............................................................................................................................. 50
Figure 19: TERA's cost estimates for data services (€c/MB) ............................................................... 50
Figure 20: Comparison of TERA's voice origination costs against retail unit voice prices (€c/min) ... 53
Figure 21: Comparison of TERA's data costs against retail unit data prices (€c/MB) ......................... 54
Figure 22: Mark-ups on voice services for roaming-specific costs (€c/min) ........................................ 56
Figure 23: Mark-ups on data services for roaming-specific costs (€c/MB) .......................................... 56
Figure 24: Mark-ups on voice services for seasonality (€c/min) .......................................................... 59
Figure 25: Total estimated wholesale roaming unit costs for voice origination (€c/min) .................... 60
Figure 26: Total estimated wholesale roaming unit costs for data services (€c/MB) ........................... 60
Figure 27: Fixed termination rates applicable in MS (S2 2015) – BU-LRIC rates in blue (€c/min) .... 61
Figure 28: Mobile termination rates applicable in MS (S2 2015) – BU-LRIC rates in blue (€c/min) . 61
Figure 29: Total estimated costs of wholesale roaming voice origination including the termination rate
and transit costs (€c/min) ...................................................................................................................... 64
Figure 30: Total estimated costs of wholesale roaming data services including transit costs (€c/MB) 64
Figure 31: Comparison between the TERA-based estimated cost for wholesale roaming voice,an
alternative approach to estimating costs for wholesale roaming voice, average wholesale roaming
market price for unbalanced traffic (€c/min) ........................................................................................ 65
Figure 32: Current wholesale roaming prices for SMS in MS (€c/SMS) ............................................. 67
Figure 33 – Intra-EEA wholesale roaming (inbound) revenue as % of retail domestic revenue all
services (x-axis) .................................................................................................................................... 79
Figure 34 – Intra-EEA wholesale roaming (inbound) traffic as % of retail domestic traffic (x-axis)
(outgoing voice) .................................................................................................................................... 80
Figure 35 – Intra-EEA wholesale roaming (inbound) traffic as % of retail domestic traffic (outgoing
SMS) ..................................................................................................................................................... 80
Figure 36 – Intra-EEA wholesale roaming (inbound) traffic as % of retail domestic traffic (x-axis)
(data) ..................................................................................................................................................... 81
7
Figure 37 – Intra-EEA wholesale roaming (inbound) revenues and traffic as % of retail domestic
revenues and traffic (y-axis), 2014 ....................................................................................................... 82
Figure 38 - Total intra-EEA wholesale roaming balance (revenues minus payments) as a % of total
retail domestic revenues (x-axis), all services included ........................................................................ 83
Figure 39 - Total intra-EEA wholesale roaming balance (revenues minus payments) as a % of total
retail domestic revenues (y-axis), all services included, per country.................................................... 84
Figure 40 - Average wholesale roaming prices for balanced and unbalanced traffic (inbound and
outbound): voice services (2015) .......................................................................................................... 85
Figure 41 - Average wholesale roaming prices for balanced and unbalanced traffic (inbound and
outbound): SMS services (2015)........................................................................................................... 86
Figure 42 - Average wholesale roaming prices for balanced and unbalanced traffic (inbound and
outbound): data services (2015) ............................................................................................................ 86
Figure 43 – Ratio inside group over outside group roaming volumes per operator and destination
country (voice - outbound roaming traffic) ........................................................................................... 95
Figure 44 - Ratio inside group over outside group roaming volumes per operator and destination
country (SMS - outbound roaming traffic) ........................................................................................... 96
Figure 45 - Ratio inside group over outside group roaming volumes per operator and destination
country (data - outbound roaming traffic) ............................................................................................. 96
Figure 46 – Ratio between inside group and outside group wholesale roaming unit prices per operator
and destination country (voice - outbound roaming traffic) ................................................................. 97
Figure 47 - Ratio between inside group and outside group wholesale roaming unit prices per operator
and destination country (SMS - outbound roaming traffic) .................................................................. 98
Figure 48 Ratio between inside group and outside group wholesale roaming unit prices per operator
and destination country (data - outbound roaming traffic) ................................................................... 98
Figure 49 – Average wholesale roaming price for unbalanced traffic vs operator size (voice -
outbound traffic) ................................................................................................................................. 100
Figure 50 – Average wholesale roaming price for unbalanced traffic vs operator size (SMS - outbound
traffic) ................................................................................................................................................. 101
Figure 51 – Average wholesale roaming price for unbalanced traffic vs operator size (data - outbound
traffic) ................................................................................................................................................. 101
Figure 52 - Difference between effective unit prices (payments/volumes) paid and received (data -
outside group traffic) ........................................................................................................................... 102
Figure 53 - Difference between effective unit prices paid and received (voice - outside group traffic)
............................................................................................................................................................ 111
Figure 54 - Difference between effective unit prices paid and received (SMS - outside group traffic)
............................................................................................................................................................ 111

8
Table of Tables
Table 1 - Regulatory measures introduced by the Roaming Regulations (2007-2016) ........................ 18
Table 2: When travelling to another EU country, you generally... ....................................................... 28
Table 3 - BEREC's estimations for upper bound, average and lower bound of wholesale costs for
wholesale roaming services (2010) ....................................................................................................... 42
Table 4 - BEREC's estimations wholesale costs for wholesale roaming services (2012) ..................... 42
Table 5: Allowances included in the baskets of the study considered to estimate retail prices ............ 51
Table 6: Country VAT rates used to derive domestic retail prices excluding VAT ............................. 51
Table 7: Country retail prices using the relative prices of wholesale roaming prices........................... 52
Table 8: Roaming-specific costs estimated by TERA .......................................................................... 55
Table 9: Termination rate to be considered within the cost of originating a mobile roaming call
(€c/min) ................................................................................................................................................. 62
Table 10: Wholesale roaming services' cost estimates in each of the 29 countries considered in TERA
Consultants' cost model......................................................................................................................... 68
Table 11 - Inbound/Outbound ratio for roaming services: voice, data and SMS (in green values above
150%, in blue values below 75%) ......................................................................................................... 78
Table 12 - Presence of pan-European mobile operators ....................................................................... 94
Table 13 - RLAH offers per country (add-ons are excluded), September 2015 ................................. 110
Table 14 - Roaming voice traffic flow between countries in the second semester of 2014 ................ 112

9
List of Acronyms
ARPM - Average Revenue Per Minute
ARRPU - Average Retail Revenue Per User
BEREC - Body of European Regulators in Electronic Communications
DG CNECT - Directorate General for Communications Networks, Content & Technology
EEA - European Economic Area
EU - European Union
EUR - Euro
EUR/PPP - EUR/Purchasing Power Parity
FUP - Fair Use Policy
GB - Gigabyte
GSM - Global System for Mobile communications
GSMA - GSM Association
HD - High Definition
IA - Impact Assessment
IMSI - International Mobile Subscriber Identity
IOT - Internet of Things
JRC - Joint Research Centre
LBO - Local Break Out
LTE - Long-Term Evolution
MB - Megabyte
MS - Member State
MNO - Mobile Network Operator
MTR - Mobile Termination Rate
MVNO - Mobile Virtual Network Operator
MWC - Mobile World Congress
M2M - Machine to Machine
NRA - National Regulatory Authority
OECD - Organisation for Economic Co-operation and Development

10
OTT - Over-the-top
VoIP - Voice over Internet Protocol
Q1 - Quarter 1
Q2 – Quarter 2
Q3 - Quarter 3
Q4 - Quarter 4
RLAH - Roaming Like At Home
SIM - Subscriber Identity Module
SME - Small and medium-sized enterprises
SMS - Short Message Service
STIRA - Standard Terms for International Roaming Agreements
US - United States
VAT - Value-added tax
VoIP - Voice over Internet Protocol
VoLTE - Voice over Long-Term Evolution
Wi-Fi - Wireless Fidelity
3G - 3rd Generation
4G - 4th Generation
€c - euro cent
Countries
BE - Kingdom of Belgium
BG - Republic of Bulgaria
CY- Cyprus
CZ - Czech Republic
DK - Kingdom of Denmark
DE - Federal Republic of Germany
EE - Republic of Estonia
IE - Ireland

11
EL - Hellenic Republic
ES - Kingdom of Spain
FR - French Republic
HR - Republic of Croatia
IS - Republic of Iceland
IT - Italian Republic
LI - Principality of Liechtenstein
LV - Republic of Latvia
LT - Republic of Lithuania
LU - Grand Duchy of Luxembourg
HU - Hungary
MT - Republic of Malta
NL - Kingdom of the Netherlands
NO - Kingdom of Norway
AT - Republic of Austria
PL - Republic of Poland
PT - Portuguese Republic
RO - Romania
SI - Republic of Slovenia
SK - Slovak Republic
FI - Republic of Finland
SE - Kingdom of Sweden
UK - United Kingdom of Great Britain and Northern Ireland

12
1. INTRODUCTION
In October 2015 the European Parliament and the Council adopted Regulation 2015/21201,
which, inter alia, amended Regulation 531/20122 (hereinafter Roaming III Regulation) and
entered into force on 29 November 2015. In this report, the Roaming III Regulation as
amended by Regulation 531/2012 is called the Roaming Regulation or simply the Regulation.
The Regulation mandates the abolition of retail roaming surcharges in the EU from 15 June
2017 (the Roam Like At Home – RLAH – regime), subject to fair usage of roaming services
and a sustainability clause. With the establishment of the obligation to charge retail roaming
services at domestic prices (no more retail roaming surcharges) subject to a fair use of these
services, Regulation EU 2015/2120 has substantially defined a new retail regulatory regime for
regulated roaming services: the roam-like-at-home (RLAH) regime.
However, while retail pricing of roaming and domestic services are aligned by regulation, the
provision of retail roaming services does not use the same wholesale inputs as retail domestic
services, in view of the fact that the provision of retail roaming service requires, by definition, the
use of a different (visited) network.
These wholesale roaming inputs are therefore to be bought in the market by the visiting operator.
Wholesale roaming inputs include a number of costs specific to roaming (i.e. not incurred in
providing domestic services), such as roaming operation and management costs, roaming
financial and data clearing costs, roaming negotiation and contract management costs. In order to
ensure that the retail roaming services can be provided at domestic retail prices, therefore, it is
necessary that wholesale roaming inputs are available at a price that makes generally possible for
the visiting (home) operators the provision of RLAH, eventually subject to fair use and without
prejudice to the possibility to ask for a sustainability derogation in exceptional circumstances,
while at the same time ensuring that visited operators can recover the costs of provision of these
services.
The Regulation therefore mandates the Commission to review the wholesale roaming market
by 15 June 2016, with a view to assessing measures necessary to enable abolition of retail
roaming surcharges by 15 June 2017.
On the one hand, with regard to retail roaming regulation, the choice to establish a RLAH
regime has been already taken by the co-legislators with Regulation 2120/2015; on the other
hand the correct working of wholesale roaming market is a precondition for the achievement
of the RLAH regime. Therefore the Commission has been entrusted with the specific task to
review the wholesale roaming markets, rather than the evaluation of the functioning of the
entire Roaming III Regulation. The review of roaming wholesale market was carried out with
a view to analyse the degree of competition in national roaming markets, any observable risk
of distortion of competition and investment incentives in domestic and visited markets in
order to assess the measures necessary to enable the achievement of the objective established
by the co-legislators, i.e. the abolition of retail roaming surcharges by 15 June 2017. This was
done taking into account the need to ensure that the visited network operators are able to
recover all costs of providing regulated wholesale roaming costs and the need to prevent
permanent roaming or anomalous or abusive use of wholesale roaming (Article 19 of the
Roaming Regulation).
1 http://eur-lex.europa.eu/legal-
content/EN/TXT/?uri=uriserv:OJ.L_.2015.310.01.0001.01.ENG&toc=OJ:L:2015:310:TOC 2 http://eur-lex.europa.eu/legal-content/EN/TXT/?uri=CELEX%3A32012R0531

13
In line with this mandate, therefore, the aim of this report, together with its associated impact
assessment, is not to review the entire functioning of the original Roaming III Regulation nor
the RLAH obligation for which the wholesale review is actually a pre-condition, but is rather
focused on the review of the wholesale roaming markets in the EU and to propose the most
appropriate legislation at the wholesale level to ensure the success of the RLAH regime. In
line with the mandate of the European Parliament and the Council set out in Article 19 of the
Regulation, the focus of the Commission's assessment in this report is on:
the developments in competition in the retail roaming markets (section 4);
the costs of providing wholesale roaming services in the EU (section 5); and
the degree of competition in national wholesale markets, including an assessment of
the wholesale charges applied, the competitive situation of operators with limited
geographic scope, the effects of commercial agreements on competition, as well as the
ability of operators to take advantage of economies of scale (section 6).
In addition, the Regulation mandates the Commission to have regard to specific criteria when
assessing the most appropriate measures at the wholesale level to enable the abolition of retail
roaming surcharges. The Commission has carefully considered the criteria set out by the
European Parliament and Council in the Regulation in its impact assessment and legislative
proposal accompanying this report, namely:
the risks of distortion of competition and investment incentives in domestic and
visited markets of any measure proposed for wholesale roaming markets;
the need to ensure that visited network operators are able to recover all costs of
providing regulated wholesale roaming services, including joint and common costs;
and,
the need to prevent permanent roaming or anomalous or abusive use of wholesale
roaming access for purposes other than the provision of regulated roaming services to
roaming providers' customers while the latter are periodically travelling within the
Union.
The remainder of this report is structured as follows:
section 2 describes the overall methodology followed by the Commission in the
review of national wholesale roaming markets;
section 3 provides an overview of the EU Roaming Regulations to date and their
impact on market developments;
section 4 describes the competition developments in retail roaming markets across the
EU to date3;
section 5 sets out the Commission's approach to assessing the costs of providing
wholesale roaming services and a summary of the outcome of the Commission's
assessment (more detail on this analysis can be found in the Final report of the
study4);
section 6 assesses the degree of competition in national wholesale roaming markets;
3We first look at retail developments, then assesses wholesale markets, according to the practice in wholesale
access regulation. Falch, M. and Tadayoni, R. (2014). Regulation of international roaming data services with the
EU. In International Economics and Economic Policy. 4 European Commission, Assessment of the cost of providing wholesale roaming services in the EEA, Final
report, study conducted by TERA Consultants, to be published.

14
section 7 assesses the possible impact of the future retail RLAH obligation on
competition on the wholesale roaming markets;
section 8 summarises the main conclusions of this report.
2. THE COMMISSION'S APPROACH TO THE REVIEW OF NATIONAL WHOLESALE MARKETS
AND ITS LEGISLATIVE PROPOSAL
In this section the Commission's approach in reviewing national wholesale markets and its
legislative proposal is described, in particular, as regards:
Information and data gathering on wholesale and retail roaming markets
Analysis of the data
The external study commissioned by the Commission to assess the costs of providing
wholesale roaming services
Public consultation
Body of European Regulators in Electronic Communications (BEREC) input
Commission's inter-service group
Report on national wholesale roaming markets (this report)
Impact assessment of the Commission's legislative proposal
2.1. Information and data gathering on wholesale and retail roaming markets
The first phase of the review process consisted in gathering quantitative and qualitative
information about wholesale and retail markets in the EU. On 28 July 2015, the Commission
sent an information request to BEREC specifying the data and information necessary to
conduct the review of national wholesale roaming markets in accordance with the Regulation
requirements5.
Following that request, BEREC, in collaboration with the Commission, sent two
questionnaires to, respectively, mobile (virtual) network operators M(V)NOs and national
regulatory authorities (NRAs) on 11 September 2015. These questionnaires aimed at
collecting detailed data, facts and figures about the degree of competition in national
wholesale markets, the level of wholesale roaming costs incurred by a visited operator,
including relevant joint and common costs, any observable risks of distortions of competition
and investment incentives in home and visited market, and the competition developments in
the retail roaming markets6. The questionnaire to NRAs also aimed at gathering information
on the cost models and input data used by NRAs to estimate mobile network costs. Replies
from operators and NRAs to these questionnaires were received in the course of September
and October 2015. Some operators provided updated replies in November-December 2015
and early January 2016.
Through this information gathering exercise, the Commission received quantitative and
qualitative information from 135 operators and from the 28 EU NRAs plus the Norwegian
NRA. In the remainder of this report to the information gathered from operators and NRAs is
referred as the 'autumn 2015 data collection'.
5 The Commission's request for input to BEREC of 28 July 2015 also covered the inputs needed for the
implementing acts mandated to the Commission by the Regulation on the weighted average of maximum MTRs
across the EU, fair use policy, and sustainability mechanism. 6 In addition, the questionnaire to operators included questions on fair use policies applied so far in unlimited
domestic offers and roam-like-at-home-type of offers already marketed (usually for a fixed add-on price).

15
In the course of December 2015 and January 2016, the Commission complemented this data
collection exercise with additional requests on the characteristics and inputs of NRAs' mobile
termination rates cost models, for the purpose of developing a cost model to assess the costs
of providing wholesale roaming services (a more detailed description of the external study
commissioned by the Commission to TERA Consultants for this purpose is included in
section 5.4 below).
In addition to these formal information requests, the Commission has held informal meetings
with NRAs and stakeholders since the start of the review in July 2015. The Commission's
approach has been to consult openly with NRAs and BEREC on the analysis contained in this
report and the conclusions of its legislative proposal (as further described in section 2.5
below).
2.2. Analysis of the data
The analysis of the qualitative and quantitative data received on wholesale and retail roaming
markets in the autumn 2015 data collection was conducted by DG CNECT and the
Competence Centre on Microeconomic Evaluation (CC-ME) of the Joint Research Centre
(JRC)7 from November 2015 to February 2016. DG CNECT has also relied on BEREC's
analysis of this data carried out in parallel to the Commission's analysis (see section 2.5).
2.3. External study to estimate the costs of providing wholesale roaming services
The assessment of the level of costs incurred by visited network operators to offer wholesale
roaming services provides, among other things, input for the analysis of the degree of market
competition. To this end, the Commission ordered an external study to TERA Consultants8.
The study was conducted between October 2015 and March 2016. Building upon cost models
used by NRAs for mobile networks, the contractor has developed a cost model to estimate the
costs of providing wholesale roaming services by a generic European mobile network
operator. The cost model was developed in close collaboration with the BEREC International
Roaming Expert Working Group and NRAs. Anonymised data on wholesale roaming specific
costs collected from operators in the autumn 2015 data collection described in section 2.1
above were used in the study to develop the cost model. In addition, BEREC updated its
wholesale roaming costing methodology in December 2015 and the Commission used this
assessment as an input to its external study to estimate the costs of providing wholesale
roaming services.
In addition, the Commission invited NRAs, operators and trade associations, as well as other
interested stakeholders, to a workshop organised together with TERA Consultants on 28
January 2016 in Brussels to present the interim results of the TERA study and to obtain
feedback on the study's cost model for wholesale roaming services. The feedback from
stakeholders has been incorporated into the cost model developed by TERA Consultants.
Finally, a reality check exercise was conducted in March 2016. During two weeks, NRAs
were invited to run and test the cost model on their input data. 20 NRAs provided comments
and further information, in particular input data, where they deemed relevant to improve the
7 The Joint Research Centre (JRC) is the European Commission's in-house science service employing scientists
to carry out research in order to provide independent, evidence-based scientific advice and support to EU policy.
For further information, please visit the JRC's website at: https://ec.europa.eu/jrc/. 8 Study SMART 2015/006 "Assessment of the cost of providing wholesale roaming services in the EU", TERA
Consultants.

16
model. The model and the country input data used were then revised by TERA Consultants to
take into account the feedback received from NRAs.
The final version of the cost model developed by the contractor is described in more detail in
Final report of the study9.
2.4. Public consultation
On 26 November 2015 the Commission launched a wide-ranging 12-week public
consultation to gather views on the functioning of, and level of competition on, the wholesale
roaming markets in the EU, on the need to regulate them in view of the abolition of retail
roaming surcharges by 15 June 2017, on possible options for doing so, and on the possible
risks associated with permanent roaming and the ways to address them10
. The public
consultation was closed on 18 February 2016. The Commission received 92 responses to the
online consultation from individual consumers, consumers' associations, mobile network
operators (MNOs), mobile virtual network operators (MVNOs), NRAs11
and governments, as
well as a couple of responses from other businesses from all over the EU and Norway12
.
Among the 32 MNOs that replied to the public consultation, the 9 group operators13
which
operate mobile networks in at least three Member States have responded to the public
consultation at the group level (i.e. 1 reply per group)14
.
The responses to the public consultation are summarised in the relevant sections of the
present report on wholesale roaming markets (sections 5.4.1, 6.5.1, 6.5.2 and 7) and of the
Commission's impact assessment (section 7.1) accompanying the legislative proposal. The
full analysis of the replies is available in Annex 2 of the Commission's impact assessment.
2.5. BEREC input
The Commission has worked closely with BEREC in its review of the wholesale roaming
market. BEREC provided information collected in autumn 2015 from operators and NRAs
(as described in section 2.1 above) and contributed to the Commission's assessment of the
costs of providing wholesale roaming services.
9 European Commission, Assessment of the cost of providing wholesale roaming services in the EEA, Final
report, study conducted by TERA Consultants, to be published. 10
In addition, the public consultation included two sets of questions on fair use policy and the sustainability
mechanism foreseen in the Regulation, in view of implementing powers conferred to the Commission by the
Regulation on these two topics. A short summary of the results of the public consultation is available here: https://ec.europa.eu/digital-single-market/en/news/summary-report-public-consultation-review-national-
wholesale-roaming-markets-fair-use-policy 11
Six NRAs replied on their own behalf. BEREC did not reply to the public consultation directly but provided
on 29 February 2016 its Report on the wholesale roaming market BoR(16)33. 12
In addition to the 92 replies to the online questionnaire, 3 respondents sent their replies by e-mail and 2
respondents sent separate position papers. . 13
Deutsche Telecom, Hutchinson Europe, Orange, Tele2, , Telefonica, Telekom Austria, Telenor, TeliaSonera,
Vodafone 14
Only one affiliate of one of these nine group operators provided a contribution in addition to the group
contribution. Therefore, 22 independent MNOs (operating in one or two Member States) have replied to the
public consultation. Since the 9 group operators represent in total 64 operators in the 28 Member States plus
Norway, the responses to the public consultation cover a total of 86 MNOs, plus 8 MVNOs, thus covering most
of the telecom sector in the EU plus Norway (the total number of MNOs and MVNOs is on the order of 140;
those having not responded are among the smaller operators).

17
On 29 February 2016, BEREC published its report on the wholesale roaming market15
which
analysed the data and information collected from operators in autumn 2015. The Commission
has relied on BEREC's report in the analysis contained in the present report. The present
report also draws on data from the 16th
International Roaming BEREC Benchmark Data
Report published on 29 February 201616
.
2.6. Commission's inter-service group
In order to support the preparation and drafting of this report and the impact assessment, a
Commission inter-service group was established. The following Commission services were
invited to participate: Secretariat General, Legal Service, Competition, Internal Market,
Industry, Entrepreneurship and SMEs, Justice and Consumers. The group met on a regular
basis throughout the wholesale roaming review process.
2.7. The report on national wholesale roaming markets (this report)
Based on the inputs received via the questionnaires, the external study and the public
consultation, this report analyses the functioning of the wholesale and retail roaming markets
and assesses whether these markets are working well for consumers. To this aim, the report
has also relied on previous work on roaming markets done by the Commission and more
generally. The overarching objective of this analysis is to determine whether it is necessary
to further intervene in wholesale roaming markets in order to enable the provision of roaming
services at domestic prices in the EU, within fair use limits, from 15 June 2017.
2.8. Impact assessment for the Commission's legislative proposal
Following the conclusion in this report that further regulatory measures are needed in
wholesale roaming markets to enable a sustainable provision of RLAH, the Commission's
impact assessment accompanying the legislative proposal assesses which is the best
regulatory option to intervene in wholesale roaming markets.
3. OVERVIEW OF THE EU ROAMING REGULATIONS AND MARKET DEVELOPMENTS (2007-
2015)
In this section the evolution of the EU Roaming Regulations and the associated market
developments at the wholesale and retail level over the period 2007-2015 are briefly
described.
3.1. Evolution of the EU Roaming Regulations (2007-2015)
Since the introduction of mobile phone services, European consumers have faced high
roaming charges (compared to the charges paid for equivalent domestic services) when using
their mobile phones while travelling abroad in other EU Member States. The 2003 EC
Recommendation on relevant markets included the "wholesale national market for
international roaming on public mobile networks" as one of the markets to be reviewed by
NRAs. However, competition problems in international roaming markets were difficult to
address using the regulatory tools provided by the 2002 EU Regulatory Framework, and none
15
BEREC Report on the wholesale roaming market, BoR(16)33, February 2016. 16
BEREC, International Roaming BEREC Benchmark Data Report, BoR(16)28, February 2016.

18
of the NRAs found any individual or joint-dominance justifying the regulation of this
wholesale market.17
Unable to tackle the problem nationally, national telecoms regulators requested the EU to
intervene to address the problem of excessive roaming prices within the EU18
. In order to
tackle the problems in EU roaming markets, the Commission proposed three regulations that
were adopted by the European Parliament and the Council in 2007, 2009 and 2012. The main
regulatory measures introduced by the Commission's Roaming Regulations are summarised
in Table 1 below.
17
Infante, J. and Vallejo, I. (2012), Regulation of international roaming in the European Union – Lessons
learned, In Telecommunications Policy. 18 European Regulators' Group (ERG) letter to the Directorate general of the Commission's DG information
society, Fabio Colasanti, December 2005

19
Table 1 - Regulatory measures introduced by the Roaming Regulations (2007-2016)
Roaming
Regulation
Period
Voice (outgoing calls)19
SMS (outgoing SMS)20
Data Other
Wholesale Retail Wholesale Retail Wholesale Retail
2007 August 2007-
June 2010
Price cap Price cap Not regulated Not regulated Not regulated Not regulated Free of charge SMS on retail
roaming prices
2009 July 2010 –
June 2012
Lower cap Lower cap Price cap Price cap Price cap Maximum bill
threshold (€50
by default)
Free of charge SMS on retail
roaming prices
2012 July 2012 –
April 2016
Lower cap Lower cap Lower cap Lower cap Lower cap Price cap Structural measures to increase
competition in the roaming
market
2016 April 2016-
June 2017
Unchanged Domestic price
+ wholesale cap
(RLAH+)
Unchanged Domestic
price +
wholesale cap
(RLAH+)
Unchanged Domestic price
+ wholesale cap
(RLAH+)
19
Incoming calls have been subject to a decreasing price cap over time at retail level but have not been subject to any price cap at wholesale level. 20
Incoming SMS are not charged while roaming.

20
The first EU Roaming Regulation was introduced in 2007, it included the following
regulatory measures:
Voice services: wholesale and retail price caps; and
Transparency measures: SMS informing about retail roaming prices when entering a
visited country free of charge.
The retail cap forced operators to respect the price caps by default (the so-called Eurotariff),
but allowed them to offer alternative retail tariffs for those customers that voluntarily opted
out of the Eurotariff. The aim was to protect consumers from excessive retail charges while at
the same time allowing competition to develop in the form of alternative tariffs. This first
regulation also included transparency measures to alert consumers of retail roaming charges
and avoid bill shock.
The first EU Roaming Regulation was reviewed in 2009. The second EU Roaming
Regulation included the following regulatory measures:
Voice services: lower wholesale and retail price caps;
SMS services: wholesale and retail price caps introduced for the first time;
Data services: wholesale price cap and maximum bill threshold introduced for the first
time; and
Continuation of transparency measures.
The second EU Roaming Regulation lowered the wholesale and retail price caps on voice
services to account for the reduction in the underlying costs of provision. In addition, it
introduced for the first time wholesale and retail price caps for SMS services. Finally, it
imposed a "safeguard cap" on data services at the wholesale level and a maximum bill
threshold for data services. The latter was designed to protect consumers from "bill shock" by
setting a maximum bill of €50 by default (that could be adjusted by the consumer).21
The third EU Roaming Regulation was adopted in June 2012, it included:
Voice services: lower wholesale and retail price caps;
SMS services: lower wholesale and retail price caps;
Data services: lower wholesale price cap and introduction of retail price caps;
Continuation of transparency measures;
Extension of maximum bill threshold to extra-EEA roaming; and
Obligation to publish a wholesale access reference offer and meet all reasonable
requests for wholesale roaming access;
Introduction of structural measures to foster competition in the roaming market.
Lastly, the fourth Regulation of 25 November 2015 includes the following measures:
From 30 April 2016 to 14 June 2017: the surcharges on roaming services applicable in
addition to domestic prices are capped by the last wholesale price caps set in the third
Roaming Regulation; the charge on incoming calls while roaming is capped at the
level of the weighted average of maximum MTRs across the EU;
21
Consumers were informed that their consumption had reached 80% of the maximum threshold via an SMS.
When consumption reached the maximum limit the data services were cut-off, unless customers gave explicit
consent to exceed that limit.

21
From 15 June 2017: RLAH, i.e. retail roaming services to be provided at domestic
prices, subject to fair use policy and to a sustainability clause, both to be detailed in an
implementing act to be adopted by the Commission before 15 December 2016;
Adaptation of transparency measures to the RLAH regime;
Commission mandated to conduct a wholesale roaming review and make appropriate
proposals by 15 June 2016 to enable a sustainable RLAH regime in the EU.
3.2. Evolution of wholesale and retail roaming prices (2007-2015)
The evidence on wholesale and retail roaming prices presented below shows that since the
introduction of the roaming regulations in 2007, wholesale and retail roaming prices have
steadily declined in line with the price caps introduced by these regulations. Below the
impact of the roaming regulations on the evolution of wholesale and retail roaming prices
since 2007 is described.
3.2.1. Retail roaming prices
In the third quarter of 2015, the EEA average retail prices for intra-EEA roaming voice, SMS
and data services were 13.1 €c/min, 5.2 €c/SMS and 5.9 €c/MB respectively (VAT excluded)
below the regulated caps of 19 €c/min, 6 €c/SMS and 20 €c/MB.22
Figure 1 to Figure 3 show the evolution of EEA average retail prices for intra-EEA roaming
voice, SMS and data services over the period 2007-2015.
Figure 1 - EEA average retail price per minute for intra-EEA roaming voice calls made
Source: International roaming BEREC Benchmark Data Report April – September 2015, BoR(16)28, February
2016
22
International roaming BEREC Benchmark Data Report April – September 2015, BoR(16)28, February 2016
22
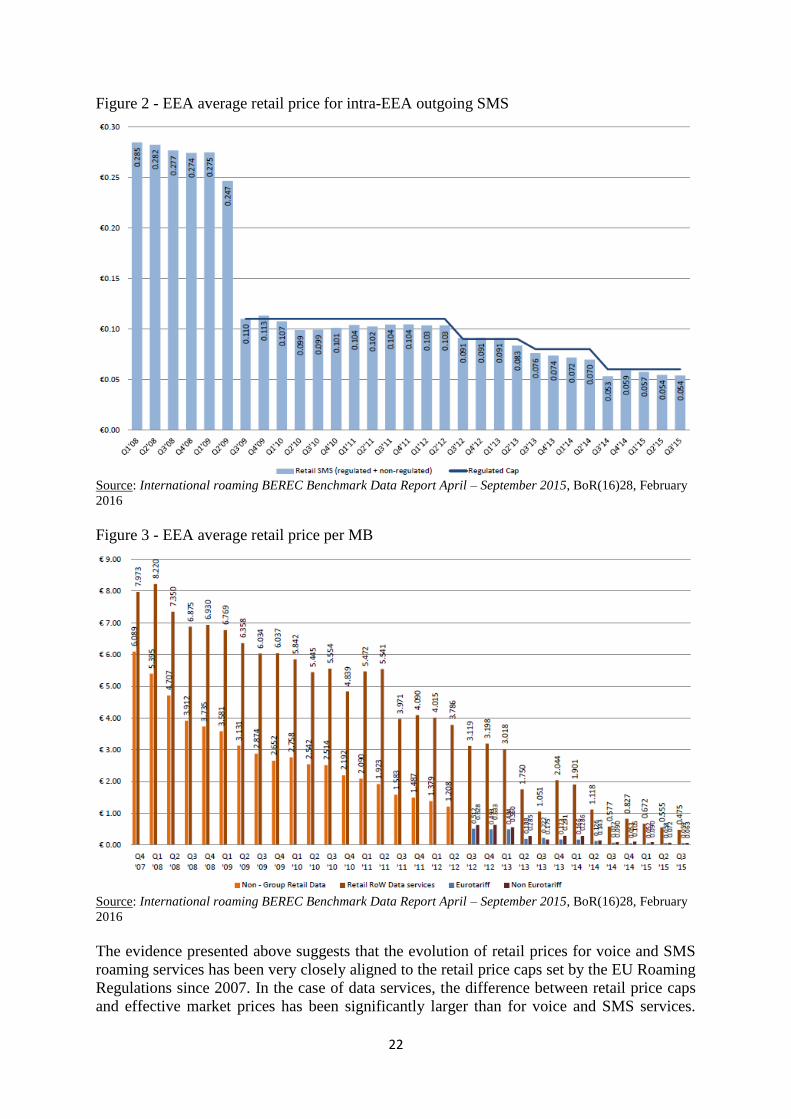
Figure 2 - EEA average retail price for intra-EEA outgoing SMS
Source: International roaming BEREC Benchmark Data Report April – September 2015, BoR(16)28, February
2016
Figure 3 - EEA average retail price per MB
Source: International roaming BEREC Benchmark Data Report April – September 2015, BoR(16)28, February
2016
The evidence presented above suggests that the evolution of retail prices for voice and SMS
roaming services has been very closely aligned to the retail price caps set by the EU Roaming
Regulations since 2007. In the case of data services, the difference between retail price caps
and effective market prices has been significantly larger than for voice and SMS services.

23
However, the evidence presented in Figure 3 shows that the three successive reductions
observed in retail data roaming prices since 2007 were triggered by the introduction of retail
wholesale data roaming caps in 2012 and its successive reductions in 2013 and 2014. Section
4 below assesses in more detail the reasons why effective retail roaming prices for data
services are lower than retail caps to a greater extent than in the case of voice and SMS
services.
3.2.2. Wholesale roaming prices
In the third quarter of 2015, the EEA average wholesale prices for intra-EEA roaming voice,
SMS and data services were 3.6 €c/min, 1.2 €c/SMS and 1.7 €c/MB respectively (VAT
excluded), below the regulated caps of 5 €c/min, 2 €c/SMS and 5 €c/MB.23
Figure 4 to Figure 6 show the evolution of EEA average wholesale prices for intra-EEA
roaming voice, SMS and data services over the period 2007-2015.
Figure 4 - EEA average price per minute for wholesale non-group roaming voice calls
Source: International roaming BEREC Benchmark Data Report April – September 2015, BoR(16)28, February
2016
23
International roaming BEREC Benchmark Data Report April – September 2015, BoR(16)28, February 2016

24
Figure 5 - Average wholesale price per intra-EEA roaming SMS: charges to non-group
companies
Source: International roaming BEREC Benchmark Data Report April – September 2015, BoR(16)28, February
2016
Figure 6 - Average wholesale data price per MB (prepaid+postpaid), EEA average
Source: International roaming BEREC Benchmark Data Report April – September 2015, BoR(16)28, February
2016

25
Similarly to the case of retail prices, the evidence presented above suggests that the evolution
of wholesale prices for voice and SMS roaming services has been very closely aligned with
the wholesale price caps set by the EU Roaming Regulations since 2007. In the case of
wholesale prices for data, the market prices have been significantly lower than wholesale
price caps over the period 2009-2014. While retail prices for data decreased in
correspondence with entry into force of the reduction of caps, the decrease in wholesale
prices for data also continued over each time period between two successive changes in cap
level. However, the gap between market prices and wholesale caps has substantially
decreased over time as wholesale price caps have been reduced.
3.3. Evolution of roaming traffic in Europe
The evidence on roaming traffic described below shows that the decline in wholesale and
retail roaming prices triggered by the roaming regulations since their introduction in 2007
have been accompanied by a steady increase in roaming traffic. The evolution of retail
roaming traffic since 2008 is described below.
Figure 7 to Figure 9 show the evolution of roaming traffic for voice, SMS and data since the
first quarter of 2008.
Figure 7 - Roaming traffic index: intra-EEA outgoing calls (Q3 2008=100)
Source: International roaming BEREC Benchmark Data Report April – September 2015, BoR(16)28, February
2016

26
Figure 8 - Retail SMS sent traffic index (Q3 2008=100)
Source: International roaming BEREC Benchmark Data Report April – September 2015, BoR(16)28, February
2016
Figure 9 - Retail roaming data traffic index: (Q3 2008 = 100)
Source: International roaming BEREC Benchmark Data Report April – September 2015, BoR(16)28, February
2016
There has been a significant increase in voice and SMS roaming traffic since 2008: on
average traffic in the EEA has increased by 51% in the case of voice and 56% in the case of

27
SMS sent between the third quarter of 2008 and the third quarter of 2015. This contrasts with
the relatively lower growth observed in the EU for domestic traffic for these services.24
This
shows that the decrease in retail roaming prices triggered by the successive roaming
regulations has enabled an increase in consumers' use of roaming voice and SMS services in
the EEA since 2008.
The increase in roaming data traffic since 2008 has been even greater. Data roaming traffic in
the EEA has increased by 796% between the third quarter of 2008 and the third quarter of
2015. While a significant share of this increase reflects the structural increase in mobile data
usage also observed in domestic markets25
, the increase in roaming data traffic has been
facilitated by the sharp reduction in retail roaming prices for data triggered by the roaming
regulations over the last years.
4. COMPETITION DEVELOPMENTS IN RETAIL ROAMING MARKETS
In this section the Commission reviews the developments in retail roaming markets observed
in the last years. The remainder of the section is structured as follows:
First, the Commission's approach to analysing developments in retail roaming markets
is provided;
Second, the market failures that have been traditionally associated with retail roaming
markets are reviewed;
Third, a comparison of retail roaming and domestic markets is presented;
Fourth, the retail roaming offers that exist in EU telecoms markets, with a special
focus on RLAH-type of offers, are described;
Fifth, the technological developments and potential substitutes to roaming that have
appeared in the last years are reported;
Finally, conclusions on the level of competition in retail roaming markets in the EU
are drawn.
4.1. Description of the Commission's approach
4.1.1. Literature review
The Commission has extensively reviewed economic analyses on roaming markets to inform
its assessment of the functioning of these markets in the EEA. Where relevant, this report
reflects on these analyses and confronts them with the data and information provided by EEA
mobile operators during the autumn 2015 data collection.
4.1.2. Questionnaires to operators and analysis of the data
The Commission requested information on competition developments in roaming markets in
the EU through a questionnaire sent in September 2015 by the Commission and BEREC to
M(V)NOs in all Member States.
24
For example, the average monthly outbound mobile voice minutes per person and the annual volumes of SMS
messages in the UK increased by 10% and 5%, respectively, between 2008 and 2013 (see Statista here and here)
and the number of outgoing call minutes on mobile networks and SMS sent in Germany increased by 29% and -
19%, respectively, between 2008 and 2014 (see Statista here and here). 25
For example, average monthly data volume per mobile internet subscription in Germany increased by 970%
between 2009 and 2014 (see Statista here) and total mobile data in the UK increased by 710% between March
2011 and June 2015 (see Statista here).

28
For the purpose of assessing competition developments in roaming markets in the EU,
operators were requested to provide information on: (i) specific retail roaming costs, (ii)
aggregated retail domestic and (intra-EU/extra-EU) roaming data consumption and revenues,
(iii) RLAH-type of offers already marketed and their impact on demand for roaming services.
The Commission's analysis relies on this information as well as BEREC's own assessment of
competition developments in retail roaming markets based on this information.
93 operators provided part or all of the quantitative data requested on retail domestic and
(intra-EU/extra-EU) roaming data consumption and revenue. The CC-ME of the JRC
extracted the original data and organized them in a unified database. Several inconsistencies
in the way data were reported were corrected, in particular as regards the unit of
measurement. In section 4.4, the results of the analysis are shown by operator and by country.
For each variable of interest (e.g. intra-EEA retail roaming volume as % of total retail
consumption) the operators' graph represents the distribution of the operators' values in the
sample of operators providing the necessary data as a cumulative fraction of the sample
(expressed as %). This means that for each value of the variable of interest on the x-axis, the
graph shows what % of the operators' sample is below that value. Operators are looked at on
a per-country basis, which means per subsidiary for the multi-country groups. The countries'
graphs show the aggregated value of the variable of interest over all operators operating in a
given country that have provided the necessary data.
4.2. Market failures in retail roaming markets
This sub-section provides an overview of the market failures that have been traditionally
associated with retail roaming markets, in particular:
Imperfect substitutes at retail level;
Lack of tariff transparency and bill shock; and
Inelastic demand for roaming services for a significant proportion of the customer
base.
4.2.1. Imperfect substitutes at the retail level
One of the main problems that has been typically associated with retail roaming services is
the lack of (or substantial imperfections in) substitutes, as customers have no effective means
of substituting for the roaming service at retail level.26
In 2011 the Commission assessed the
substitutability of retail roaming services with, among others:
Local SIM cards, which could be used in a dual-Sim handset as well)
VoIP, (directly linked to the availability of WiFi hotspots)
Global or regional SIM card (with multi-IMSI SIM cards or call back options).
The Commission concluded that none of the assessed possible alternatives was a perfect
substitute for roaming based on their level of (i) mobility; (ii) availability; (iii) accessibility;
(iv) affordability; and (v) ease of use.27
This lack of available substitutes at the retail level is
26
Falch, M. and Tadayoni, R. (2014). Regulation of international roaming data services with the EU. In
International Economics and Economic Policy. WIK-Consult (2010), Study on the Options for addressing
Competition Problems in the EU Roaming Market, SMART 2010/018, December, p. 8 and BEREC (2010),
International Mobile Roaming Regulation BEREC Report, December 2010. 27
European Commission (2011), Commission Staff Working Paper – Impact Assessment of Policy Options in
Relation to the Commission's Review of the Functioning of Regulation EC No 544/2009 of the European

29
mainly due to consumers' preference for using their mobile phone as they do at home over
any available alternative.
In relation to the Roaming III regulation, there are some changes to be considered, especially
in relation to OTTs. According to a study by Deloitte28
, OTT VoIP (Over-The-Top Voice
over Internet Protocol) players like Skype, Facetime and WhatsApp have been used for
international communications for years now, significantly affecting the roaming market.
What has changed? First of all, smartphones have now multiplied, making OTT VoIP
services much more available to the European consumer. Despite the lack of specific data, the
introduction of voice service into the massively used WhatsApp in 2015 should be considered
as an important development regarding the availability of OTT VoIPs as well. Second, Wi-Fi
hotspots, where the consumer can connect for free or for a fee, are more widespread now, a
growing trend that is likely to extend in the future29
. Third, LTE and 4G speeds are better
capable of providing OTTs good-quality voice calls than 3G. While the final cost of this
service (some estimates talk of around 800Kb/Min) is variable and difficult to calculate, it
could nonetheless be competitive depending on the specific roaming tariffs.
Yet, in spite of these trends, OTT VoIP services still present constrains in terms of mobility,
availability, accessibility and ease of use that should not be underestimated. Together with
local SIM cards, or global/regional SIM cards, OTTs are only imperfect substitutes for the
majority of consumers, as they limit mobility and do not allow subscribers to receive
incoming calls on their usual numbers (for voice and SMS). They are also less suited to
calling businesses, public authorities and other entities outside the circle of friends and
family, particularly those OTT that do not terminate to the PTSN. OTT services may also be
unable to access premium numbers, interactive automated services, micropayment services
and emergency services.
In addition, alternatives to roaming services (e.g. global and regional MVNOs and SIM
cards) lack sufficient uptake due to the lack of consumer awareness, complexity of usage for
customers, language barriers, and low brand recognition among consumers as regards the
service providers. A general problem with any roaming substitute that has to be purchased in
the visited country is that it imposes high search costs on the consumer, as s/he is obliged to
become knowledgeable about prices and services in each visited country.30
The lack of
availability of substitutes for retail roaming services is reflected in consumers' patterns of use
of mobile services when travelling to another EU country. Table 2 below shows the habits of
EU mobile subscribers' when travelling abroad to another EU country.
Table 2: When travelling to another EU country, you generally...
Switch off
mobile
phone
Switch off
data
capability
Activate
special data
roaming plan
Public or
private
WiFi access
Purchase
local SIM
card
Other Don't
know
Parliament and of the Council of 18 June 2009 on Roaming on Public Mobile Telephone Networks within the
Community, 6 July 2011, SEC(2011) 871, pp.58-65. 28
http://www2.deloitte.com/content/dam/Deloitte/de/Documents/technology-media-telecommunications/TMT-
Roaming_safe.pdf , p.10 29
For a discussion on the possible impact of traffic off-load on roaming, see Marcus, J.S. et al. (2013) Structural
solutions and the evolution of international mobile roaming (IMR) in Europe: Where are we headed?. WIK
Available at SSRN: http://ssrn.com/abstract=2342637. 30
WIK-Consult (2010), Study on the Options for addressing Competition Problems in the EU Roaming Market,
SMART 2010/018, December, p. 15.

30
EU 28 28% 25% 18% 16% 10% 9% 6%
Source: Eurobarometer (2014), E-Communications Household Survey and Telecom Single Market Survey –
Roaming Results, Special Eurobarometer no. 414, available here.
According to the 2014 Eurobarometer on roaming, only 10% of mobile users use a local SIM
card and 16% a public or private WiFi access when travelling abroad to another EU country.
The majority of mobile users prefer instead to either switch off their mobile phone (28%) or
switch off the data capability (25%).
While none of the available alternatives appears to be considered a good substitute for
roaming services, a series of technological developments, especially eSims, might change
this situation in the mid-term. These developments are briefly analysed in section 4.5 of this
report.
4.2.2. Lack of tariff transparency and bill shock
Mobile users typically purchase roaming services as part of a bundle including a domestic
subscription allowing access to domestic mobile services. In practice, this means that
roaming charges make up only a relatively small proportion of a user's total bill for its mobile
services.31
Furthermore, roaming charges tend to be intermittent, as these are only charged
when the subscriber uses its mobile subscription while travelling abroad from its home
country, which only happens occasionally for the majority of European mobile users.
These features of roaming services have tended to result in a lack of tariff transparency for
the majority of European mobile subscribers and have resulted in unexpected high roaming
charges or "bill shock", which are also the product of certain smart phone features, such as
hidden data consumption, which are difficult to control by the consumer. This lack of tariff
transparency and bill shock may have been mitigated by the Commission's Roaming
Regulations, which have included measures to increase transparency and mitigate bill shock
(as already described in section 3.1 above). However, for the reasons described above, lack of
tariff transparency and bill shock can be considered an intrinsic characteristic of retail
roaming services in the absence of adequate regulatory intervention. For example, in the 2006
Eurobarometer (prior to the introduction of the Roaming Regulations and the spreading of
smart phones), only 29% of respondents to the survey declared that they were familiar with
international roaming charges.32
Even currently, in spite of the successive regulations,
roaming within the EU is still one of the causes for unexpectedly high bills amongst users
experiencing bill shock.33
4.2.3. Inelastic demand for roaming services for a significant proportion of
the customer base
31
WIK-Consult (2010), Study on the Options for addressing Competition Problems in the EU Roaming Market,
SMART 2010/018, December, p. 8 32
Eurobarometer (2007), Roaming Summary, Special Eurobarometer no. 269, question QB9. 42% of
respondents declared that they did not have a clear idea of the cost of communications when abroad, 14% stated
they were not concerned with the question and 15% did not know. 33
For example, Ofcom's 2014 report on unexpectedly high bills cites roaming within the EU as one of the
causes of unexpectedly high bills amongst those users experiencing bill shock. See Ofcom (2014), Incidence of
unexpectedly high bills 2014 report, slide 14, available at here.

31
There has not been much research into the price elasticity of demand of roaming services. As
far as the Commission is aware, there have been the following empirical studies on the own
price elasticity of demand of outgoing voice calls while roaming:
European Commission (2006): three different scenarios for the welfare assessment
have been used, namely, -0.55, -1.0 and -1.2;34
GSMA (2008): considered that the elasticity of demand should be -0.25;35
Europe Economics (2008): estimated that elasticity of demand should range between -
0.35 to -0.44;36
CMT (2009): estimated the elasticity of demand around -0.37.37
In the Commission's 2011 Impact Assessment on the options for roaming the preparatory
study for the IA had assumed relatively low elasticities of demand for voice and SMS (in the
range of -0.2 to -0.3), albeit the elasticity for data was likely to be higher (it was difficult to
assess the elasticity of demand for data, since usage was growing due to the increase in use of
smartphones).38
Overall, a low price elasticity of demand has traditionally been associated
with retail roaming services.39
As described above, the low price elasticity of demand is likely to be due to the fact that
mobile operators typically set different prices for roaming services and bundle these with
domestic offers. The resulting lack of transparency and high search costs for consumers (for a
relatively small proportion of their total mobile bill) may drive the lack of responsiveness to
prices from consumers at the time of choosing their retail tariff.40
In addition, roaming bill
shocks are also likely to have resulted in lower price responsiveness from end users,
especially for data. Due to the comparatively high roaming prices, which are still mostly
based on per-unit pricing rather than flat-rates41
, and the lack of transparency and control in
34
European Commission (2006), Impact Assessment of Policy Options in Relation to a Commission Proposal
for a Regulation of the European Parliament and of the Council on Roaming on Public Mobile Networks Within
the Community. 35
GSMA (2008), GSMA Briefing Paper On the Impact Assessment Accompanying the Proposal for a
Regulation of the European Parliament and of the Council Amending Regulation (EC) No 717/2007 ON
Roaming on Public Mobile Phone Networks Within the Community. 36
Europe Economics (2008), Review of the Roaming Regulation, Study for the European Parliament's
committee on Internal Market and Consumer Protection, IMCO, IP/A/IMCO/FWC/2006-186 C. 37
CMT (2009), Report on the Analysis of the International Roaming Service in the Spanish Mobile Telephone
Market. 38
European Commission (2011), Commission Staff Working Paper – Impact Assessment of Policy Options in
Relation to the Commission's Review of the Functioning of Regulation EC No 544/2009 of the European
Parliament and of the Council of 18 June 2009 on Roaming on Public Mobile Telephone Networks within the
Community, 6 July 2011, SEC(2011) 871, p.16. 39
See, for example, WIK (2013), International Mobile Roaming Policy and Regulatory Actions: Theory and
Practice, ITU High-Level Workshop on Regulatory and Economic Aspects of Roaming, slide 2; Europe
Economics (2008), Roaming Regulation, Brief for European Parliament, 9 December, slide 5, available here. 40
European Commission (2011), Commission Staff Working Paper – Impact Assessment of Policy Options in
Relation to the Commission's Review of the Functioning of Regulation EC No 544/2009 of the European
Parliament and of the Council of 18 June 2009 on Roaming on Public Mobile Telephone Networks within the
Community, 6 July 2011, SEC(2011) 871, p.16. 41
See the latest BEREC Transparency and Comparability Report, Chapter 4. While the number of roaming
bundles, limited add-ons and RLAH-type offers is clearly on the rise, per-unit pricing generally applies even in
these tariffs, once the bundle restrictions are reached. For data roaming tariffs, for example, a significant number
of operators have a 1 day restriction.
http://berec.europa.eu/eng/document_register/subject_matter/berec/reports/5578-draft-report-on-transparency-
and-comparability-of-international-roaming-tariffs

32
smart phones' data consumption, the consumer is afraid of switching on the overall data
capabilities of his device regardless of specific price differences.
In this respect, it is highly possible that, especially regarding roaming data consumption, it is
not so much the lack of a linear price elasticity that matters. What matters is the consumer's
sense of control over such consumption, which has been severely damaged by both, the
structural features of the market, and the opportunistic strategies of its agents, especially
facilitated by the limits of steering technologies42
, which blurred the attribution of market
responsibilities (see section 6.2).
Indeed, the evidence presented above in section 4.2.1 shows that a significant proportion of
end users (53%) opt for either switching off their mobile or data capabilities when travelling
abroad. This is most likely the result of historical high per-unit roaming prices and the
incidence of bill shock on EU mobile users when using their mobile abroad.
The Commission therefore expects that the introduction of RLAH, which will eliminate the
possibility of roaming surcharges (within fair use limits), will give consumers a renewed
sense of security when using roaming services, what will not only limit the scope for bill
shocks in the EU, but also result in higher demand responsiveness to prices, and increase
consumption up to optimal economic levels for both consumers and operators43
.
4.3. Domestic price level and consumption pattern
BEREC analysis44
shows that the domestic annual retail revenue per user varies considerably
between EEA countries from 3.70 € per month in Lithuania and Latvia to 43.80 € per month
in Liechtenstein45
, with a weighted average of 14.30 €. There are also large differences in
domestic consumption patterns of mobile services (voice, SMS and data). These differences
in consumption are particularly high for data services whose average use per user per month
in 2014 varies from about 100 MB in Romania to almost 3000 MB in Finland.
4.4. A comparison of retail roaming and domestic traffic
Figure 10 to Figure 13 show, per operator, the share of intra-EEA retail roaming consumption
in total retail (i.e. domestic plus roaming intra-EEA and extra-EEA) consumption, in terms of
revenues and volumes for each service, based on operators' data from the autumn 2015 data
collection.
42 Dominguez Lacasa, Javier (2011). Competition for Partners: Strategic Games in Wholesale International
Roaming. In 22nd
European Regional Conference of the International Telecommunications Society.
Ambjornsen, T., et al. (2011). Customer ignorance, price-cap regulation, and rent-seeking in mobile roaming. In
Information Economics and Policy. 43
Juniper Research estimates that, thanks to the RLAH policy, Europe will experience the greatest decline on
"silent roamers" in the world, releasing also an important retail revenue opportunity for telecom operators,
especially on data. In Western Europe, Juniper Research estimates that the lost revenue opportunity for
operators will decrease from 723.9 billion dollars in 2016 to 261.3 billion dollars in 2017, once RLAH has been
implemented. In North America, for example, the lost revenue opportunity will increase from 909 billion
dollars to 1.022 billion dollars in the same period.
44
BEREC Report on the wholesale roaming market, BoR(16)33, February 2016, sections 2.1 and 2.2 45
Highest value among EU Member States: 23.80 € in Ireland
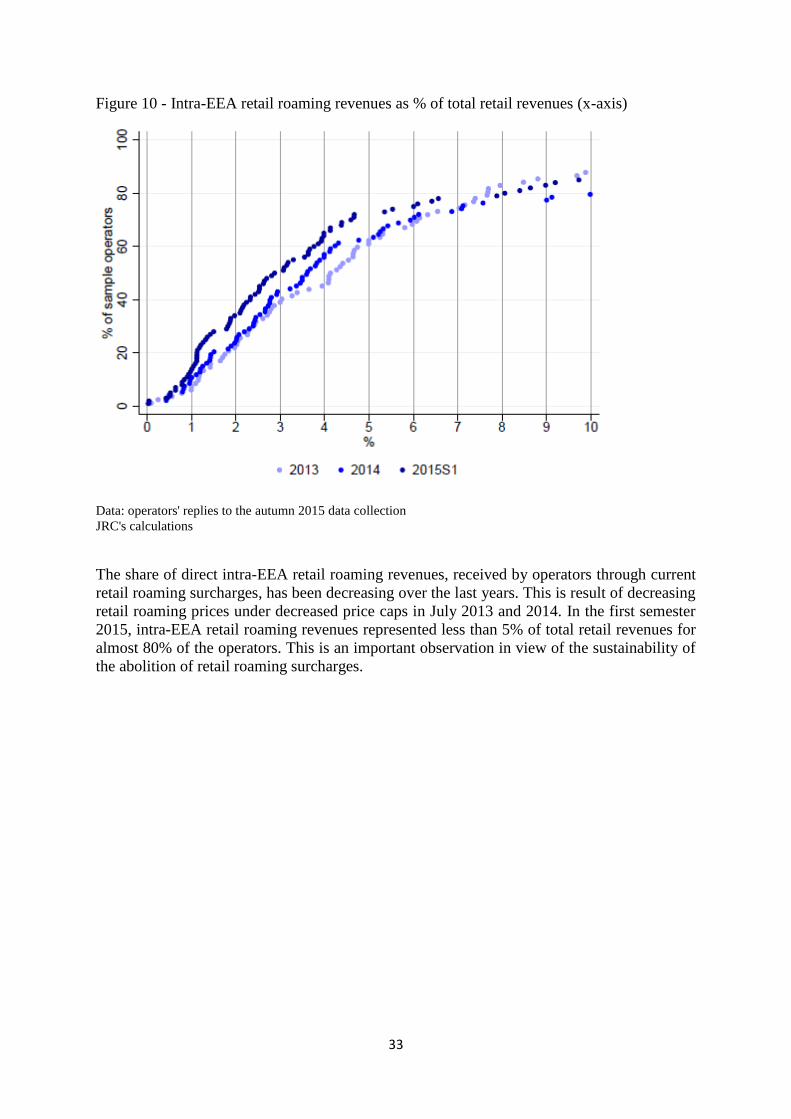
33
Figure 10 - Intra-EEA retail roaming revenues as % of total retail revenues (x-axis)
Data: operators' replies to the autumn 2015 data collection
JRC's calculations
The share of direct intra-EEA retail roaming revenues, received by operators through current
retail roaming surcharges, has been decreasing over the last years. This is result of decreasing
retail roaming prices under decreased price caps in July 2013 and 2014. In the first semester
2015, intra-EEA retail roaming revenues represented less than 5% of total retail revenues for
almost 80% of the operators. This is an important observation in view of the sustainability of
the abolition of retail roaming surcharges.

34
Figure 11 - Intra-EEA retail roaming traffic as % of total retail traffic (outgoing minutes)
Data: operators' replies to the autumn 2015 data collection
JRC's calculations
Figure 12 - Intra-EEA retail roaming consumption as % of total retail consumption (outgoing
SMS)
Data: operators' replies to the autumn 2015 data collection
JRC's calculations

35
Figure 13 - Intra-EEA retail roaming consumption as % of total retail consumption (data)
Data: operators' replies to the autumn 2015 data collection
JRC's calculations
In terms of volumes, for 80% of the operators, intra-EEA retail roaming consumption
represents less than 3% and 5% of total retail consumption of outgoing minutes and SMS
respectively. For data, the share of intra-EEA retail roaming consumption in total retail
consumption is below 1.5% for 80 % of the operators.
One can therefore make the following observations. First of all, the share of retail roaming
revenues in total retail revenues (Figure 10) is higher than the share of retail roaming
consumption in total retail consumption for voice and data (Figure 11 and Figure 13). This
reflects the higher prices paid by customers for retail roaming consumption than for domestic
consumption.
Second, the lower share of roaming consumption in total consumption for data services
indicates that roaming customers seem to use, proportionally to their domestic habits, less
data than voice and SMS while roaming in the EEA.
Third, the share of roaming consumption in total consumption for data has been increasing
since 2013. This means that intra-EEA roaming data consumption has increased more rapidly
than domestic data consumption. This is likely to be a direct effect of the two successive
retail roaming price cap regulations in July 2013 and 2014, which have to some extent
unleashed data usage in an intra-EEA roaming situation on top of the positive trend in data
consumption observed domestically. RLAH is likely to potentiate even more this trend, in a
general technological context where data consumption will be proportionally more and more
important in all settings (domestic and whole travelling).

36
Figure 14 shows per country, the share of intra-EEA retail roaming consumption in total
retail (domestic plus roaming intra-EEA and extra-EEA) consumption, in terms of revenues
and volumes for each service.
Figure 14 - Intra-EEA retail roaming revenues and volumes as % of total retail revenues and
volumes (y-axis) by country, 2014
Data: operators' replies to the autumn 2015 data collection
JRC's calculations
In 2014, the share of intra-EEA retail roaming revenues in total retail revenues was the
highest for operators in Luxembourg (~9%), Slovakia and Slovenia (~7%), Norway and
Belgium (~5%). The higher share observed for Luxembourg's operators is linked to the
longer time that residents of that country spend abroad in the EEA compared to residents of
other EEA countries. For operators in all other countries than these five countries, the share
of intra-EEA retail roaming revenues in total retail revenues is smaller than 5%. This is an
important observation in view of the sustainability of the abolition of retail roaming
surcharges.
As noted at operator level in Figure 11 to Figure 13 above, for almost all countries, the share
of retail roaming in total retail consumption is higher in terms of revenues than in terms of
volumes. This is due to the higher prices paid by customers for roaming services than for
domestic services. For almost all countries, the share of retail roaming in total retail
consumption is smaller for data services than for voice and SMS services, a sign of the higher
propensity of customers to limit data consumption than voice or SMS consumption while
roaming.
4.5. Retail roaming offers

37
This section is based on the information provided by EEA operators during the autumn 2015
data gathering exercise and draws on the analysis made by BEREC of the information
received about existing RLAH offers46
.
Recently an increasing number of operators have started to offer domestic tariff plans which
include roaming services in the domestic bundle. This reflects new competition dynamics in
the retail roaming market, the roaming part of a domestic tariff plan becoming a new
commercial argument to attract customers and increase market shares. This is indicative that,
in the RLAH context, "roaming revenues" will be in part transformed and included in the
revenues derived from the domestic tariffs, with which operators compete for customers.47
However, most of these tariff plans do not cover all EU Member States, or concern only
voice and SMS, or data only, and/or include roaming services in the domestic bundle as an
add-on package (i.e. for a fixed periodic - daily, weekly or monthly – charge which represents
a fixed roaming surcharge over the domestic price), In fact, most of the available offers do
not fully comply with the RLAH requirements set out in the Regulation. The geographical
scope of these offers usually reflects the countries where the operator is present, and
countries where good roaming deals were concluded.
The truly RLAH offers (with no add-on) which exist on the market are mostly high-end
domestic tariff plans aimed at high-end or professional users. The geographical scope of
these RLAH offers varies. In some Member States however, such offers also exist for (non-
business) consumers while in other Member States, such offers do not exist at all (see Table
13 in Annex 1).
In most existing RLAH offers (be they included in the domestic tariff plan for an add-on
price or not) the amount of roaming consumption included in the domestic tariff plan, is
subject to fair use clauses. These clauses may take very different forms across operators and
tariff plans. Fair use limits usually depend on the price of the tariff plan and are more often
expressed as a volume limitation per month. This volume limit may be on the amount of
domestic volume available while roaming or it may be on an extra specific roaming volume
available on top of the domestic volume. In some cases, fair use limits are expressed in terms
of days per year (e.g. from 10 to 60 days a year), often combined with an additional volume
limit per month on data. In most countries, the roaming data volumes in RLAH offers are
rather low, usually below 500 MB per month. The roaming data allowance in RLAH offers is
always capped, even if the offer includes unlimited voice and SMS units.
Once fair use limits are reached, users can usually continue using roaming services at
regulated prices. Data is often simply throttled beyond fair use.
4.6. Current technological developments as potential substitutes to roaming
In the questionnaire circulated by BEREC in mid-September 2015, many operators stated that
incipient technological developments such as eSIM or VoLTE among others will impact the
functioning of the roaming market. While these technological developments still are at an
46
BEREC Report on the wholesale roaming market, BoR(16)33, February 2016, section 2.3. 47
According to Juniper Research's estimates, Western Europe will continue to be, despite the immediate effects
on revenue of the RLAH regulation, the largest roaming market in the world, accounting for 14.011 billion
dollars in 2020.

38
early phase of implementation in the market, this section reviews their potential effect in the
roaming context, with a special focus on eSims.
What are eSims?
Electronic Sim cards (also known as virtual Sims) are here understood as a new type of
technologies that allow consumers to switch and combine mobile operators without having to
introduce a physical Sim card in their mobile devices.48
What are eSims theoretical market impact?
eSim cards can basically reduce consumer's transaction costs when switching/combining
operators. In theory, this opens up the possibility of greater choice and competition at both,
domestic and EU level. eSims can be a significant substitute for roaming (see below).
What is their current diffusion/situation?
While in the machine-to-machine context, eSIMs cards have been used for several years, its
introduction in consumer devices is only now taking-off. At the 2015 and 2016 editions of
Mobile World Congress in Barcelona, the GSMA staged its intention to align all ecosystem
participants on standardized reference architecture in order to introduce eSIMs. In the 2015
edition of the MWC, Simless, Inc., a US-based startup, unveiled the world's first GSM phone
without a SIM card slot. "Apple SIM", which works in several iPad models and in limited
countries, is a form of eSim that gives users the option to select from a number of carrier
partners. These include GigSky, a pay-as-you-go data provider that offers cellular data plans
in more than 90 countries.49
On July 16, 2015 The Financial Times reported that Apple and
Samsung were in talks with a significant amount of telecom groups to launch a standardized
eSim card50
.
eSims were cited as the second technology to have the greatest future impact on the
telecommunications market (below cognitive technology)51
in a survey conducted by IBM
(and presented in IDATE's Digiworld Summit). A recent report by McKinsey52
states that
"the ability to change providers easily means that eSim customers don’t have to carry
multiple Sims, have full tariff transparency, and can more easily avoid roaming charges".
eSims diffusion seems strongly aligned with the diffusion of "wearables", connected cars and
global roaming devices and containers53
, what has a strong international component. This is
confirmed by the results of the Public Consultation that the Commission undertook in 2015 in
view of the revision of the overall EU Telecommunications Framework, where a specific
question on eSims was asked to stakeholders.
48
In terms of their potential openness, eSims are related to the so called "network-agnostic Sim cards", first
regulated in the Netherlands in 2014. Companies (not costumers) are free to issue their own Sims, and then buy
minutes, SMS and data in bulk from operators, what could have an impact on roaming as well. See:
https://gigaom.com/2014/03/14/holland-says-yes-to-the-network-agnostic-sim-card/ 49
Juniper Research (December 2015). Mobile Roaming. Market Trends & Competitive Landscape. p 12. 50
http://www.ft.com/intl/cms/s/0/fc78a3ea-294b-11e5-acfb-cbd2e1c81cca.html#axzz3yv6cE3pN 51
http://www.digiworldsummit.com/wp-content/uploads/2015/07/DWS15_Rob_van_den_Dam_1.pdf 52
http://www.mckinsey.com/industries/telecommunications/our-insights/e-sim-for-consumers-a-game-changer-
in-mobile-telecommunications 53
http://rethink-wireless.com/2016/02/22/esim-extends-its-reach-to-wearables-cars-and-global-
roaming/?utm_source=Rethink+Wireless+List&utm_campaign=f06999aa53-
Rethink_Wireless_Monday_22_02&utm_medium=email&utm_term=0_80b97e02cb-f06999aa53-164266989

39
What is/can be their impact on roaming?
eSims are a technical development that constitutes a possible substitute to roaming, providing
a potentially less expensive solution for consumers, and thus introducing competition forces
at both retail and wholesale level. This entails not only a technical, but a subjective
perception: consumers must see eSims as a satisfactory solution to their international needs.
Following the RIII impact assessment report (Annex I)54
, 5 criteria to evaluate the potential
of eSims as substitutes for roaming were considered.
1. Mobility. Refers to the possibility of being able to move while using voice, SMS or
data service. eSims offer high mobility - the consumer can use a local plan throughout
the territory covered by the local chosen provider's network.
2. Availability. Refers to the availability of the alternative itself as well as of the
technical coverage. eSims themselves have currently a very limited availability, but
given the situation explained above, they might become a standard in the near future.
There will be a period of co-existence between Sim and eSim. In terms of the local
operators available to the consumer, eSims make it potentially very easy for the
consumer to choose between offered plans, as there is no need to switch the Sim card,
nor go to a foreign retail store to buy a local Sim. On the other hand, the availability
of operators will depend on potential blockages, especially likely to take place in
subsidized handsets.
3. Accessibility. Relates to the possibility of being reached at any time and at any
location on the same phone number. eSims offer high accessibility, as domestic home
numbers can potentially be combined with foreign numbers using the same headset.
The trend towards data and VoLTE is also a significant positive factor towards
accessibility.
4. Affordability. Concerns the investment (one-off cost) and the cost of using
(recurring cost depending on the volume of services) for using alternative services.
With eSims, the consumer can easily benefit from local tariffs (for example, easily
buying X GB of data), which can be potentially better than RLAH tariffs or RLAH +
sustainability tariffs. This introduces market pressure to RLAH-type of offers that
include more generous FUP (to avoid "educating" consumers on switching operators
once FUPs limits are surpassed).
5. Ease of use. Refers to the steps required / possible difficulties before being able to
use the service, as well as the ease of the actual use of the alternative service. eSims
have the potential to dramatically reduce the transaction costs related to the
consumer's research efforts to find and compare service providers in the area. There
might be, however, learning costs for users regarding different local tariffs.
In sum, the current availability of eSims, and of operators that are given access to the eSim
"market", is the main factor limiting eSIMs being a viable substitute for roaming. There is
still high uncertainty regarding the specific strategies that operators are going to follow in
relation to this new technological development. For example, if Local Break-Out (LBO)
technologies (see section 5.6) diffuse in parallel to eSims, visited operators may decide to
54
Other technologies considered have been: Local SIM cards, Over Wi-Fi, Over WiMax, Multi-IMSI, Call
back.

40
restrict eSims packages in order to avoid cannibalization. Nonetheless, eSims show indeed a
clear potential to introduce competitive pressure in the international roaming market, but this
will be contingent on the different strategies that will finally shape the technology.
Other technological developments related to roaming are VoLTE and Fi. VoLTE promises
HD voice over packet-switched technology to the consumer that has a supporting device. It is
associated to an infrastructural change towards all-data, so it can have a substitution effect in
relation to current voice and SMS roaming services, creating a new dynamic at both
wholesale and retail level. It terms of roaming, however, VoLTE use will still be dependent
on the data provisions of visited networks. While VoLTE, due to its better traffic
management, is widely seen by operators as a way of competing with OTTs (also in the
roaming context)55
, it is only now that plans around its deployment are being released in
Europe56
. It is indeed still soon to venture into the actual specific effects that this
technological development might have on international roaming markets57
.
Google has also developed a technology and an associated business model with a potential
high impact on international roaming. Google Fi lets users connect to the best available
network in each situation. The signal, which can come from different operators in one single
session, is in principle never dropped58
: The user automatically switches to Wi-Fi, 3G/4G, or
other different networks without noticing. Fi is currently available in certain Nexus models in
the US, where Google has become a de facto MVNO. Through its deals with mobile
operators, Google has secured competitive internationals roaming rates: Google Fi costumers
surf at the same rate (10$ per 1GB) than in the US in more than 120 countries, but at reduced
3G speeds. Google Fi-type of models/technologies, if coming to the European market, could
bring competitive pressure to RLAH offers.
4.7. Conclusion
There have been some important developments on the retail roaming markets recently, with
domestic offers proposing more and more affordable roaming prices to the customers.
However, most of the new, RLAH-like, retail roaming offers are not RLAH offers in the
sense of the Roaming Regulation, i.e. covering the full of the EU for no additional surcharge
at all (no add-on) within fair-use limits. In addition, these developments are unequal across
Member States . With the current levels of competition in wholesale roaming markets,
therefore, the retail markets have not been capable of delivering full EU-wide RLAH.
Regarding technological developments concerning roaming, there have also been significant
changes in some Member States, especially the diffusion of smartphones, OTT services and
the proliferation of Wi-Fi hotspots. Among the new emerging technologies, eSims might
have a significant impact in the mid-term, even though this is highly contingent to the
different strategies that will be play-out around them. Overall, however, none of the observed
technologies constitutes a perfect substitute for roaming services. Thus, their current market
pressure remains limited.
55
http://www.businesswire.com/news/home/20150224006896/en/81-Operators-VoLTE-Key-Competing-OTTs-
Expect 56
Orange announced in the MWC16 its plans to offer VoLTE and Wi-Fi calling services in Europe. 57
Juniper Research predicts a 783% growth on VoLTE connections until 2018. The same organization also
estimates that data will take an increasing proportion of the global roaming revenues at least until 2020. 58
Juniper Research (December 2015). Mobile Roaming. Market Trends & Competitive Landscape. p 14.

41
5. ASSESSMENT OF THE COST OF PROVIDING WHOLESALE ROAMING SERVICES IN THE
EEA
5.1. Introduction
This section describes the approach to assessing the costs of providing wholesale roaming
services in the EEA. This section is structured as follows:
Description of the Commission's approach in assessing the costs of providing
wholesale roaming services in the EEA;
brief overview of previous estimates of costs of wholesale roaming services;
description of the TERA Consultants' model that was commissioned to estimate the
costs of wholesale roaming services;
description of the approach to assessing the termination rates that should be
considered for the purposes of assessing the costs of originating voice calls by a
visited network operator;
assessment of international transit costs, relevant for roaming services;
sense-checks conducted on the estimates of wholesale roaming costs;
approach to assessing the costs of wholesale roaming SMS services; and
conclusions on the costs of providing wholesale roaming services in the EEA.
This section should be read jointly with the TERA Consultants' report on the cost model used
as an input to assess the costs of providing wholesale roaming services in the Final report of
the study59
.
5.2. Description of the Commission's approach
The Commission has relied on several sources of information to assess the costs of providing
wholesale roaming services in the EEA.
Firstly, an independent study to assess the level of costs incurred by visited network operators
when providing wholesale roaming services was commissioned60
. The study was conducted
from end of October 2015 to the end of March 2016. When developing the cost model, the
contractor had to take into account, as far as possible, the methodologies and approaches used
by NRAs in EU Member States to estimate mobile network costs. The aim was to build a cost
model that facilitated as far as possible the estimation of wholesale roaming costs in every
EEA Member State. Information on NRAs' cost models and relevant cost data necessary to
form a view on the costs of mobile network operators in the EEA were obtained via two
questionnaires sent in September 2015 by the Commission and BEREC to M(V)NOs in all
Member States and NRAs, as well as via additional requests from the Commission on the
characteristics and inputs of NRAs' mobile termination rates cost models in the course of the
study (December 2015 and January 2016). The public consultation itself did not have the
objective of providing information on wholesale roaming costs.
In addition, the Commission has relied on other sources of information, namely:
59
European Commission, Assessment of the cost of providing wholesale roaming services in the EEA, Final
report, study conducted by TERA Consultants, to be published 60
Study SMART 2015/006 "Assessment of the cost of providing wholesale roaming services in the EU", TERA
Consultants

42
Data on fixed and mobile termination rates currently in place in MS; and
Information on domestic retail prices.
These sources are described in more detail below.
5.2.1. Questionnaires to NRAs and operators
For the purpose of assessing the cost of providing wholesale roaming services in the EU,
NRAs were requested to provide data and information about: (i) the cost model they use to
estimate mobile network costs, including detailed information on characteristics of their cost
model (e.g. equipment utilisation factor, radio access network sites), and inputs to their cost
model (e.g. commercial traffic, busy hour traffic, geotypes, spectrum, cell radii); (ii) their
estimated network cost per service (voice origination/termination, SMS
origination/termination, data); (iii) any applicable wholesale price regulation for MVNOs in
their country; (iv) market data on overall volumes of retail consumption of each service
(minutes, SMS, MB) in their country.
For the purpose of assessing the cost of providing wholesale roaming services in the EEA,
operators were requested to provide data and information about: (i) current wholesale
roaming agreement structures and tariffs, including the situation of light MVNOs; (ii)
specific wholesale and retail roaming costs; (iii) wholesale roaming payments, revenues and
volumes by Member States of destination and origin; (iv) average wholesale prices for
balanced and unbalanced traffic, (v) expected wholesale roaming prices for the year 2016.
5.2.2. External study to estimate wholesale roaming costs
5.2.2.1. The call for tenders
On 24 July 2015, the Commission services published an advance notice for a contract to
assess the cost of providing wholesale roaming services in the EEA, to be awarded under the
negotiated procedure. On 11 August 2015, the Commission services invited eight companies
that had expressed interest to submit an offer. Four companies responded to the call and sent
their respective tenders by the deadline of 7 September 2015 set in the invitation to tender.
The contract was awarded to TERA Consultants and signed by the latest party on 21 October
2015. The last deliverable under this contract is due within 5 months after that date.
5.2.2.2. The objectives of the study
The study has estimated the efficient costs (including proportionate allocation of joint and
common costs) of providing wholesale roaming services (including voice, SMS and data
roaming services) by mobile network operators in 28 MS plus Norway.61
5.2.2.3. Consultation with NRAs and mobile operators
During the development phase of the cost model by the contractor, NRAs were regularly
consulted via the International Roaming Expert Working Group of BEREC on the
methodological approach. In order to take into account, as far as possible, the methodologies
61
The 29 countries included in the TERA cost model are: Austria (AT), Belgium (BE), Bulgaria (BG), Cyprus
(CY), Czech Republic (CZ), Germany (DE), Denmark (DK), Estonia (EE), Greece (EL), Spain (ES), Finland
(FI), France (FR), Croatia (HR), Hungary (HU), Ireland (IE), Italy (IT), Lithuania (LT), Luxembourg (LU),
Latvia (LV), Malta (MT), Netherlands (NL), Poland (PL), Portugal (PT), Romania (RO), Sweden (SE), Slovenia
(SI), Slovakia (SK), United Kingdom (UK) and Norway (NO).

43
and approaches used by NRAs in EEA Member States, NRAs were asked to provide detailed
information on characteristics of their respective cost models used for mobile termination
rates.
On 28 January 2016 the Commission and the contractor organised a public workshop where
the contractor presented the interim results of the study in order to obtain feedback on the
cost model from NRAs and operators. The feedback from stakeholders has been incorporated
into the final version of the cost model (described in more detail in Final report of the
study62
). In addition, between March – April 2016, the cost model developed by TERA
Consultants was shared with the NRAs from the countries included in the study. TERA
Consultants incorporated, as far as possible, the comments from NRAs into the final version
of the model.
5.3. Previous estimates of wholesale roaming costs
In December 2010 BEREC estimated the following upper bound, average and lower bound of
wholesale costs for wholesale roaming services63
:
Table 3 - BEREC's estimations for upper bound, average and lower bound of wholesale costs
for wholesale roaming services (2010)
Maximum Average Minimum
Outgoing voice call €9.7cents/min €5.4cents/min €3cents/min
Incoming voice call €3cents/min
SMS €2.7cents/SMS €0.8cents/SMS €0.6cents/SMS
Data €15cents/MB €8.1cents/MB €1.6cents/MB
These cost estimates were used in the Impact Assessment accompanying the Commission
proposal for Roaming Regulation III.
In February 2012, BEREC updated its analysis of wholesale roaming costs. BEREC's new
estimations were64:
Table 4 - BEREC's estimations wholesale costs for wholesale roaming services (2012)
Maximum
Outgoing voice call €5cents/min
SMS €1cent/SMS
Data €5cents/MB
These new cost estimates were used during the negotiations on Roaming Regulation III
between the co-legislators, and informed the setting of new wholesale roaming price caps
after 1 July 2014 set in Roaming Regulation III adopted in June 2012.
5.4. The TERA Consultants cost model
62
European Commission, Assessment of the cost of providing wholesale roaming services in the EEA, Final
report, study conducted by TERA Consultants, to be published 63
BEREC (2010), International Mobile Roaming Regulation BEREC Report, BoR(10)58, December 2010. 64
BEREC (2012), BEREC Analysis of Wholesale Roaming Costs, BoR(12)14, February 2012

44
This section briefly describes the main features of the TERA Consultants cost model
(hereinafter, the cost model). For additional information on the approach followed and the
results of the cost model, please refer to the TERA Consultants' Final report of the study65
.
5.4.1. The approach followed by TERA Consultants
The TERA Consultants cost model estimates the costs of providing wholesale roaming
services in 28 MS plus Norway. Two EEA countries, notably Iceland and Liechtenstein were
not part of the study as no information as part of the autumn information request was received
and due to the lack of publicly available information on the cost models used by these
countries' NRAs to set mobile termination rates. In addition, little information from certain
MS of the EU (e.g. Germany or Estonia) was provided.
The cost model focuses on the costs of providing wholesale roaming services by the visited
network operator and, in particular, on the following five mobile services:
Incoming voice calls (i.e. voice termination on the visited network);
Outgoing voice calls (i.e. voice origination on the visited network);
Incoming SMS (i.e. termination of SMS on the visited network);
Outgoing SMS (i.e. origination of SMS on the visited network); and
Data services.
It should be noted at the outset that the TERA cost model has mainly focused on estimating
the costs of voice and data services, as these are the most important wholesale roaming
services. Therefore the cost model's estimates of wholesale SMS costs are not considered as
robust as the estimates of voice and data services and therefore the approach followed to
assessing the costs of wholesale SMS services is described below. In addition, the TERA cost
model does not assess the costs of international transit, which are also relevant for roaming
voice and data services. The approach to estimating the costs of international transit is
described in more detail in section 5.6 below.
The cost model distinguishes between two different types of costs relevant for the provision
of wholesale roaming services, notably:
Network costs: the costs of rolling out the mobile network to provide mobile services
to both domestic and roaming customers in each of the 29 countries considered; and
Roaming specific costs: network and non-network costs that a mobile company incurs
in order to provide wholesale roaming services.
In addition, the cost model also estimates the impact of seasonality on the allocation of
underlying network costs between domestic and roaming customers. Seasonality can be
described as follows. Mobile network operators typically make decisions about network built
up (e.g. the capacity they need to build in certain areas) based on the traffic they expect in a
specific area at peak hour. A significant share of roaming traffic is seasonal, meaning that is
concentrated in certain periods of the year (typically, the summer period) and is also
concentrated in certain geographic locations (i.e. touristic areas). Thus, some operators (50%
in the public consultation) argue that roaming traffic drives operators' investment decisions to
65
European Commission, Assessment of the cost of providing wholesale roaming services in the EEA, Final
report, study conducted by TERA Consultants, to be published

45
build additional capacity in certain areas to accommodate the additional roaming traffic
received over the summer period. Furthermore, these operators argue that the investment cost
of building this additional capacity in touristic areas should be recouped from the roaming
traffic received over the short seasonal period, as roaming customers drive operators'
investment decisions. In practice, this approach would mean that a significant share of the
investment costs in touristic areas has to be recovered from a relatively low annualised
volume of traffic (the seasonal roaming traffic) and may therefore result in significantly
higher unit cost for roaming traffic than for domestic traffic.
In contrast, 40% of the operators responding to the public consultation defend the view that
there is no impact of seasonality on the costs of providing wholesale roaming services. These
operators argue that seasonality would concern only a very small part of the network, which
has no effect on the total network costs. They note that domestic traffic is also seasonal and
that the costs of meeting roaming capacity are not different than the costs of domestic
capacity. They finally underline that roaming seasonality also works in favour of the visited
operator, by optimising the use of some sites as domestic users move away while tourists
arrive ('inverse peaks’). The remaining 10% of the responding operators do not pronounce
themselves on this question.
Finally, TERA Consultants have run several sensitivities on their estimated costs of
wholesale roaming services (see the Final report of the study for further details). In particular,
they have assessed the impact on the estimated costs of changing several of the assumptions
used66
. This sensitivity analysis shows that the costs estimated by the model are robust, as the
changes in the unit costs estimated by the model are consistent with the expected changes in
the underlying assumptions and the unit costs estimated under these sensitivity scenarios are
broadly in line with those estimated under the main base case scenario.
The sections below look into these issues in more detail.
5.4.2. High level assumptions in TERA's cost model
When developing a cost model there are several decisions that need to be made regarding the
approach chosen to estimate costs. In developing their cost model TERA has made a
significant number of assumptions and modelling choices, however, this section only briefly
summarises and explains the justifications for some choices made in the TERA cost model
that were considered particularly important, namely:
The choice of cost standard;
The approach to cost modelling; and
The choice between modelling the costs of an existing operator or an hypothetical
efficient operator (HEO).
For further information on the modelling assumptions used by TERA Consultants in their
cost model, please refer to the Final report of the study67
.
5.4.2.1. The choice of cost standard
66
In particular, as regards the assumption of (i) Single RAN; (ii) cost allocation (in Erlang vs Mbps); (iii)
VoLTE; and (iv) volumes forecasts. 67
European Commission, Assessment of the cost of providing wholesale roaming services in the EEA, Final
report, study conducted by TERA Consultants, to be published

46
The two most common cost standards used to derive the costs of providing a service are the:
Long-Run Incremental Cost (LRIC); and
Long-Run Incremental Cost plus some allocation of common cost (LRIC+).
The LRIC is the cost of producing a specified additional increment of output in the long run
(the long run meaning that all production inputs, including capital investment, are considered
variable). The relevant increment considered may encompass the entire output of just one
service or that of a group services. Another way to look at it is that the incremental cost of a
service is the difference between the total costs in a situation where the service is provided
and the costs in another situation where the service is not provided (i.e. the incremental costs
are the costs avoided by no longer supplying the specific service).
In contrast, the LRIC+ cost standard includes, in addition to the incremental costs of the
specific service, a contribution to costs that are common or shared with other services
provided by the company. In the case of a mobile network, the incremental costs of data
services will be those costs that are solely driven by the provision of data services whereas
common costs would be costs associated with activities or equipment that are shared
between, say, data services and voice services. A LRIC+ approach ensures that all costs of
provision are fully allocated to services. In general, companies need to recover common costs
to ensure that their business is sustainable in the long term. For this reason, common costs are
typically allocated or shared among the different services that generate them, and recovered
in the prices for those services.
The TERA cost model estimates service costs using a combination of both cost standards:
LRIC and LRIC+. As a rule, it estimates costs based on LRIC+, as this is consistent with the
Roaming Regulation's Article 19, notably that:
"In assessing measures necessary to enable the abolition of retail roaming surcharges,
the Commission shall take into account the need to ensure that the visited network
operators are able to recover all costs of providing regulated wholesale roaming
services, including joint and common costs."
Thus, TERA's cost model estimates costs for the following services based on LRIC+:
Outgoing voice calls;
Outgoing SMS; and
Data services.
In the case of incoming voice (i.e. voice termination), the TERA cost model estimates these
costs based on pure LRIC. This is to ensure consistency with the Commission's 2009
Recommendation on Termination Rates, which recommends the estimation of termination
rates based on a bottom-up pure LRIC approach,68
and which has been implemented by the
majority of MS in the EU and consistently supported by BEREC. For incoming SMS
services, the TERA cost model does not allocate any cost to these services. This is to ensure
consistency with Regulation No 531/2012 which states that "roaming customers should not
be required to pay any additional charge for receiving a regulated roaming SMS or voicemail
68
Commission Recommendation of 7 May 2009 on the Regulatory Treatment of Fixed and Mobile Termination
Rates in the EU, available here.

47
message while roaming on a visited network, since such termination costs are already
compensated by the retail charge levied for the sending of a roaming SMS or voicemail
message".69
In practice, the approach for voice termination and incoming SMS means that some costs that
would have been otherwise allocated to these services have to be recovered from other
services. The approach to re-allocating costs between services to ensure full cost recovery of
joint and common service costs, consistent with the Roaming Regulation, is explained below.
5.4.2.2. The approach to cost modelling
There are two main approaches to modelling costs:
Top-down cost modelling based on the accounts of an existing operator; and
Bottom-up cost modelling based on a hypothetical efficient operator.
Top-down cost models derive the costs from the operator's accounts and allocate these to
each service using some allocation rule. In contrast, bottom-up cost models use detailed data
and engineering rules to build an hypothetical network of an efficient operator using the most
advanced and efficient technologies available in the timeframe considered by the model, to
the extent they can be identified.
The TERA cost model uses a mix of both approaches. For network costs it estimates these
costs using a bottom-up approach, consistent with the approach followed by the majority of
NRAs when estimating mobile termination costs. In the case of roaming specific costs,
however, as there is no data and/or engineering rules available to derive the efficient costs
bottom-up, TERA relied instead on the data provided by operators in the autumn information
request.
There have been some operators that have disagreed (both during the January 2016
Workshop and in response to the public consultation) with the use of a bottom-up approach
based on efficient costs to estimate wholesale roaming costs, advocating instead for a top-
down approach based on actual costs. It does not seem possible to agree with the views of
these operators, however, for the following reasons.
First of all, the purpose of the cost model is to provide an estimation of costs for the provision
of wholesale roaming, as one of the input for the overall assessment of the functioning of
wholesale roaming markets and eventually the adoption of appropriate measures to address
any failure in this regard. In this regard, a bottom-up approach based on efficient costs is
more appropriate as it would reflect the workings of a competitive market and therefore
represents a reliable benchmark to assess how the wholesale roaming market is functioning
and which appropriate measures may be needed. In a competitive environment, operators
would be forced to be productively efficient and would not be compensated for inefficiently
incurred costs. Furthermore, in the context of two-way access services such as roaming
services, where operators need to purchase wholesale access from each other, it would not be
appropriate to compensate some operators for being inefficient to the detriment of more
efficient operators. Moreover, network costs are already subject to cost modelling across the
69
Regulation No 531/2012 of 13 June 2012 on roaming on public mobile communications networks within the
Union, available here.

48
Union, in the context of the determination of MTRs, and the adoption of the hypothetical
efficient operator approach for the calculation of the network costs would ensure that any cost
estimation of roaming costs across the Union is generally consistent with the cost-modelling
approach usually adopted for MTRs across Europe70
.
5.4.2.3. Estimation of network costs
The first step in TERA's cost model is to estimate the network costs in each of the 29
countries considered. Estimating the network costs consists of several steps in which the
model takes into account the costs of building up the network for the expected future demand,
as shown in Figure 15 below.
Figure 15. Steps in the estimation of costs in the TERA cost model
Source: TERA Consultants report.
The estimation of the network costs in the cost model consists of the 8 steps shown above. As
described in more detail in TERA's report71
, the approach followed by TERA is consistent
with the typical approach used by NRAs to estimate mobile termination costs in the EEA. In
order to populate the model with relevant national data TERA relied on:
Publicly available cost models used by NRAs to estimate mobile termination costs;72
and/or
70
Also in previous cost estimation exercises related to roaming, one of the indicators was based on the cost-
modelling exercise carried out by NRAs, see for instance BEREC Analysis of Wholesale Roaming Costs carried
out in 2012, BoR(12)14, also based on the assumption of the efficient network operator. 71
European Commission, Assessment of the cost of providing wholesale roaming services in the EEA, Final
report, study conducted by TERA Consultants, to be published 72
TERA relied on publicly available cost models from 9 countries, namely: Portugal, Spain, France, UK,
Netherlands, Norway, Sweden, Czech Republic and Romania.
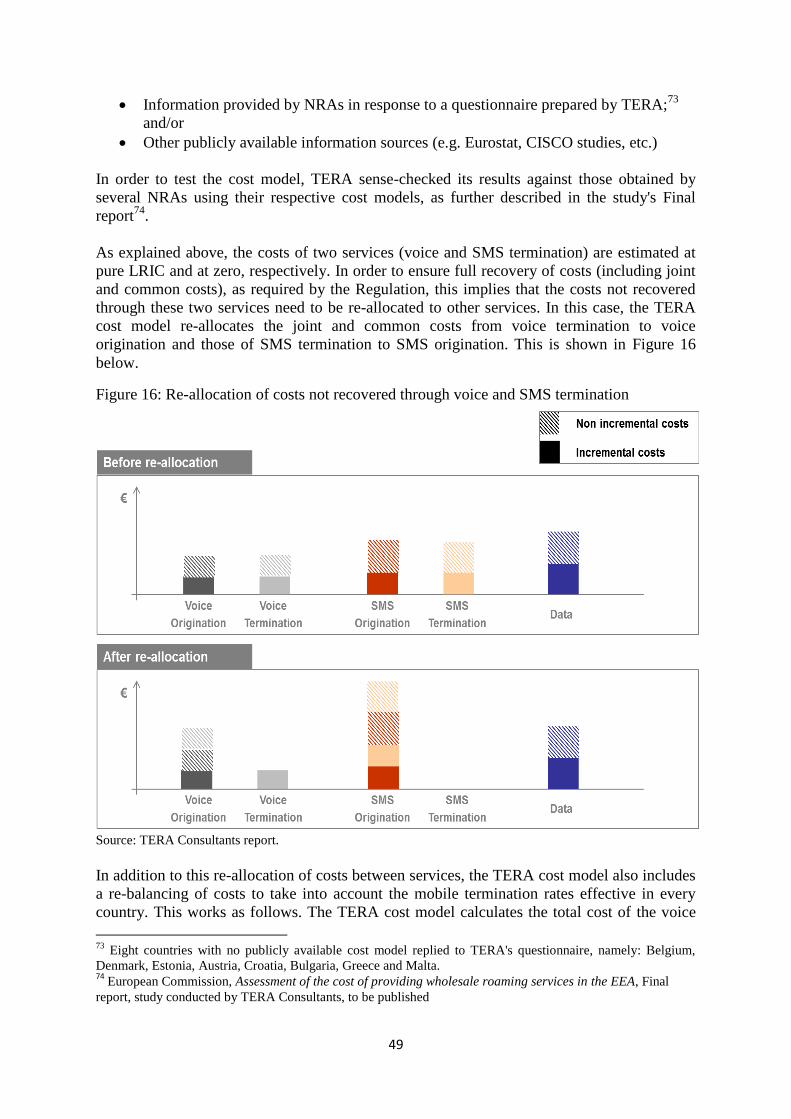
49
Information provided by NRAs in response to a questionnaire prepared by TERA;73
and/or
Other publicly available information sources (e.g. Eurostat, CISCO studies, etc.)
In order to test the cost model, TERA sense-checked its results against those obtained by
several NRAs using their respective cost models, as further described in the study's Final
report74
.
As explained above, the costs of two services (voice and SMS termination) are estimated at
pure LRIC and at zero, respectively. In order to ensure full recovery of costs (including joint
and common costs), as required by the Regulation, this implies that the costs not recovered
through these two services need to be re-allocated to other services. In this case, the TERA
cost model re-allocates the joint and common costs from voice termination to voice
origination and those of SMS termination to SMS origination. This is shown in Figure 16
below.
Figure 16: Re-allocation of costs not recovered through voice and SMS termination
Source: TERA Consultants report.
In addition to this re-allocation of costs between services, the TERA cost model also includes
a re-balancing of costs to take into account the mobile termination rates effective in every
country. This works as follows. The TERA cost model calculates the total cost of the voice
73
Eight countries with no publicly available cost model replied to TERA's questionnaire, namely: Belgium,
Denmark, Estonia, Austria, Croatia, Bulgaria, Greece and Malta. 74
European Commission, Assessment of the cost of providing wholesale roaming services in the EEA, Final
report, study conducted by TERA Consultants, to be published

50
services, including the pure LRIC and common costs of both voice termination and
origination. However, the model includes three different scenarios regarding termination
rates:
Voice termination rates are equal to mobile termination rates effective in each country
on the second semester of 2015 (Scenario A in the model);
Voice termination rates are capped at the highest pure LRIC rate effective in the EEA
as of the second semester of 2015 (the Slovak termination rate at €1.23c/min). In
other words, if the national termination rate is lower than that level, then the national
rate applies but if it is higher, the Slovak termination rate applies (Scenario B in the
model).
Voice termination rates are considered to be equal to the pure LRIC for each country
estimated by the cost model from TERA Consultants (Scenario C).
In practice, the impact of the above re-balancing is that if the termination rate considered is
higher than the pure LRIC estimated by TERA, then the model considers that the termination
rate contributes towards the joint and common costs (and potentially the costs of origination
if the termination rate considered is higher than the LRIC+ cost of termination estimated by
TERA). This is shown in Figure 17 below.
Figure 17: Example of re-balancing of costs with effective mobile termination rates
Figure 18 below shows TERA's estimates of the network costs in Scenario B (taking into
account national MTRs when lower than the Slovak pure LRIC MTR or the latter if higher)
for voice origination.

51
Figure 18: TERA's cost estimates for voice origination after re-balancing for national MTRs
under Scenario B (€c/min)
Figure 19 presents the costs estimated by TERA for data services.
Figure 19: TERA's cost estimates for data services (€c/MB)
In addition, the unit cost estimates from TERA have been sense checked against the retail
unit prices derived from a Commission study for each of the 29 countries considered.75
This
section relied on the study's assessment of the prices for 5 mobile baskets in the 29 countries,
namely:
75
The study Mobile Broadband prices was prepared for the European Commission by Van Dijk Management
Consultants (prices from February 2015), March 2016: https://ec.europa.eu/digital-single-
market/en/news/mobile-broadband-prices-february-2015

52
Table 5: Allowances included in the baskets of the study considered to estimate retail prices
Handset use
Voice calls SMS Data
Basket 1 51 min 100 100 MB
Basket 2 191 min 140 500 MB
Basket 3 576 min 225 1 GB
Basket 4 1809 min 350 2 GB
Basket 5 191 min 140 2 GB
The baskets used in the study are consistent with the OECD methodology for mobile
telecommunications price baskets.76
Domestic retail prices have been derived by subtracting
from the VAT-inclusive prices the VAT in every MS considered in the analysis. The VAT
rates considered were as follows:
Table 6: Country VAT rates used to derive domestic retail prices excluding VAT
Country VAT rate
AT 20%
BE 21%
BG 20%
CY 19%
CZ 21%
DE 19%
DK 25%
EE 20%
EL 23%
ES 21%
FI 24%
FR 20%
HR 25%
HU 27%
IE 23%
IT 22%
LT 21%
LU 17%
LV 21%
MT 18%
NL 21%
PL 23%
PT 23%
RO 24%
SE 25%
SI 22%
SK 20%
UK 20%
76
Namely OECD (2012), “Methodology for Constructing Wireless Broadband Price Baskets”, OECD Digital
Economy Papers, No. 205, OECD Publishing. http://dx.doi.org/10.1787/5k92wd5kw0nw-en and OECD (2009),
“Revision of the methodology for construction telecommunications price basket”
(DSTI/ICCP/CISP(2009)14/FINAL).

53
NO 25% Source:
http://ec.europa.eu/taxation_customs/resources/documents/taxation/vat/how_vat_works/rates/vat_rates_en.pdf
(page 16)]
In order to allocate basket prices to each service, we use the average wholesale roaming
prices effective in the 28 MS plus Norway that were gathered during the autumn information
request to derive relative prices between services (voice, SMS and data). The basket prices
have been allocated to each service ensuring that the relative retail prices derived are the
same as for average wholesale roaming prices in the 29 countries considered.
Table 7 below presents the retail prices for each of the 29 countries considered.
Table 7: Country retail prices using the relative prices of wholesale roaming prices
Voice (€c/min) SMS (€c/SMS) Data (€c/MB)
AT 3.84 1.18 1.31
BE 3.87 1.19 1.32
BG 8.74 2.70 2.99
CY 5.77 1.78 1.98
CZ 7.43 2.29 2.54
DE 4.41 1.36 1.51
DK 3.09 0.95 1.06
EE 3.83 1.18 1.31
EL 6.21 1.92 2.13
ES 5.86 1.81 2.01
FI 3.91 1.21 1.34
FR 3.75 1.16 1.29
HR 5.24 1.62 1.79
HU 8.61 2.66 2.95
IE 4.69 1.45 1.61
IT 4.04 1.25 1.38
LT 1.77 0.55 0.61
LU 4.80 1.48 1.64
LV 4.33 1.34 1.48
MT 8.54 2.64 2.93
NL 5.60 1.73 1.92
PL 3.72 1.15 1.27
PT 7.16 2.21 2.45
RO 3.88 1.20 1.33
SE 3.80 1.17 1.30
SI 4.69 1.45 1.61
SK 5.40 1.67 1.85
UK 2.91 0.90 1.00
NO 3.80 1.17 1.30
In order to compare TERA's cost estimate for voice origination against retail unit prices,
Figure 20 below compares TERA's cost estimates for voice origination after re-allocation of
termination common costs but before the re-balancing against effective national mobile
termination rates, as this is the TERA cost estimate that is more appropriate to compare
against retail prices.

54
Figure 20: Comparison of TERA's voice origination costs against retail unit voice prices
(€c/min)
Figure 20 shows that the costs estimated by TERA Consultants for voice origination are well
below estimated retail prices in all countries considered. It also shows that countries for
which TERA Consultants have estimated relatively low voice costs (e.g. Lithuania, Poland
and Romania) similarly have relatively low retail prices. There are however countries for
which TERA Consultants have estimated relatively low costs in contrast to relatively higher
retail prices. This is not necessarily an inconsistency of the costs estimated by TERA
Consultants, given that retail prices are not solely determined by underlying costs but also
other factors such as competitive conditions present in every country. No country was
identified where very low domestic retail prices would directly put in question the plausibility
of the underlying TERA cost estimates.

55
Figure 21: Comparison of TERA's data costs against retail unit data prices (€c/MB)
The comparison of TERA Consultants' cost estimates with the data retail prices estimated for
each country (Figure 21) yields similar results to the comparison of voice services.
TERA Consultants conducted additional sensitivity checks on its estimates that are explained
in detail in its Final report77
.
5.4.2.4. Roaming-specific costs
Roaming-specific costs are considered as mobile operators' costs that can be solely attributed
to the provision of wholesale roaming services (as opposed to domestic mobile services). In
other words, mobile network and non-network costs that are incremental to the provision of
the wholesale roaming service.
In order to assess the magnitude of these costs, data from mobile operators on roaming-
specific costs were included in the autumn information request. Following this request, 90
operators replied with data on roaming-specific costs. TERA Consultants analysed the
information provided by operators and identified four separate categories of roaming-specific
costs, namely:
Roaming network related costs: operating network costs specific to roaming
services such as roaming route testing/monitoring and route provisioning. No capital
expenditures specific to roaming services were identified at the network level.
Roaming Operation and Management (O&M) costs: costs relating to all business
intelligence systems and software dedicated for roaming O&M, including: accounting,
77
European Commission, Assessment of the cost of providing wholesale roaming services in the EEA, Final
report, study conducted by TERA Consultants, to be published

56
payment, fraud prevention, revenue assurance, roaming steering and quality
assurance.
Roaming data clearing and payment costs: costs relating to roaming clearing costs
including both data clearing costs (DCH: Data Clearing House) incurred with the
exchange of TAP/RAP files between the home and the visited operator, as well as the
financial clearing of payments between operators.
Roaming contract negotiation costs: costs relating to the administration and
negotiation of wholesale roaming contracts, including external fees (consulting
services) or internal expenses (e.g. settlement of roaming agreements, contract
monitoring and regulatory expenses).
The approach followed by TERA Consultants to derive roaming-specific costs consists of
two steps. First, for each of the cost categories of roaming-specific costs described above,
using regression analysis they derive a relationship between the total cost provided by
operators in response to the information request and its assumed underlying cost driver. In
particular:
For roaming network-related costs, TERA assumes that these costs are driven by the
total roaming traffic (expressed in GB).
For O&M and data clearing and payment costs, TERA assumes that these costs are
driven by the number of TAP records78
generated;
For contract negotiation costs, TERA assumes that the costs are fixed and independent
of traffic or any other underlying driver.
Using regression analysis, TERA estimates a fixed and variable (i.e. depending on the value
of the underlying cost driver) cost for each category of roaming-specific costs. This is shown
in Table 8 below.
Table 8: Roaming-specific costs estimated by TERA
Network costs O&M costs Clearing
costs
Negotiation
costs
Capex Opex Capex Opex Opex Opex
Fixed cost €225K €14K €55K €70K €190K
Cost driver Traffic
(GB)
TAP TAP TAP No
Variable cost €2.1/GB €10/100K
TAP
€30/100K TAP €40/100K
TAP
No
Second, using the relationships obtained in the first step, TERA calculates roaming-specific
costs for each country based on the size of the operators (i.e. the number of TAP records and
traffic GB of the operators) in the country.
Figure 22 and Figure 23 below present the roaming-specific unit costs estimated by TERA
for both voice and data services respectively.
78
Transferred Account Procedures (TAP) records are a collection of procedures used by mobile operators to
send billing records on roaming subscribers from the visited network operator to the home network operator of
the roaming subscriber.

57
Figure 22: Mark-ups on voice services for roaming-specific costs (€c/min)
Figure 23: Mark-ups on data services for roaming-specific costs (€c/MB)
In general, TERA Consultants have estimated higher roaming-specific cost mark-ups for
smaller size countries with relatively high wholesale roaming-in traffic. This is because a
significant proportion of roaming-specific costs are fixed, thus, resulting in relatively higher
unit costs for small countries with small mobile operators. Similarly, countries with
proportionally higher wholesale roaming-in traffic (when compared to their size) are also
likely to have a relatively higher unit cost for roaming-specific costs, as the variable part of
these costs is mainly driven by the level of roaming-in traffic.

58
5.4.2.5. Impact of seasonality
As explained in section 5.4.1 above, half of the operators in the public consultation have
argued that the seasonal character of roaming traffic and its geographic concentration in
certain touristic areas implies that roaming traffic may drive network investment decisions in
certain areas to accommodate the additional network capacity required by roaming
subscribers over the short holiday period (typically the summer period running from June
until August). These operators argue that a relatively higher share of network costs in these
areas should be allocated to roaming traffic (rather than domestic traffic) in order to reflect
the impact of roaming traffic on mobile operators' decisions to invest in additional capacity.
TERA Consultants investigated the impact of seasonal roaming traffic on mobile operators'
underlying network costs. In a nutshell, the approach followed by TERA Consultants consists
of:
Identifying the month with the highest total traffic (roaming and domestic), as the
month with highest total traffic will drive the mobile operator's investment decision
(i.e. the maximum capacity that it needs to build to accommodate for the traffic on the
network);
Assessing the share of traffic corresponding to domestic and roaming subscribers in
the month with the maximum total traffic; and
Allocating total network costs to domestic and roaming traffic based on their relative
share of traffic in the month with the maximum total traffic.
In order to estimate the impact of seasonality, TERA Consultants has used different sources
of information:
data from Eurostat on the number of nights spent by non-residents in EU countries;
quarterly inbound traffic per country in 2014 obtained from BEREC;
publicly available data on roaming from ANACOM (Portugal), ARCEP (France),
MCA (Malta) and HAKOM (Croatia);
national monthly domestic and roaming traffic from an operator active in several
Southern Member States; and
monthly domestic and roaming traffic disaggregated by geographical location in (a
Southern European country obtained from (the NRA of that country).
Based on the evidence analysed, TERA concludes that seasonal roaming traffic:
has a significant effect only in suburban and rural areas, excluding cities from the
scope of the analysis. In cities, the peak of network traffic is typically in months other
than the summer period, given that the traffic generated by seasonal roaming
subscribers is balanced out by a reduction in the traffic of domestic subscribers, which
move to touristic areas outside of the cities;
only has a significant impact on voice traffic but not on data traffic. This is due to the
fact that the structural increase observed in data traffic from domestic users is likely to
have a more significant weight on operators' network-build decisions than the increase
in data traffic from seasonal roaming subscribers during the holiday period. Thus,
seasonal roaming data traffic during the summer period is unlikely to determine the
decision to build additional capacity by mobile operators. Instead, this decision is
likely to be driven by the growth in demand for data services from domestic users;
and

59
is only relevant in a sub-set of EU countries. Based on TERA Consultants' analysis,
the impact of seasonality is only significant in 9 countries out of the sample of 29,
namely: Croatia, Greece, Bulgaria, Spain, Malta, France, Italy, Slovenia and Cyprus.
Using the above information, TERA Consultants have modelled two different scenarios:
Scenario 1: assumes that domestic traffic in touristic areas remains constant over the
year (i.e. does not show seasonality); and
Scenario 2: assumes that domestic traffic in touristic areas also increases over the
summer period, in parallel to seasonal roaming traffic.
The second seasonality Scenario 2 appears more appropriate to assess the true impact of
seasonality. This is because the first Seasonality 1 scenario assumes that domestic traffic in
touristic areas over the holiday periods is similar to the domestic traffic in these areas over
the rest of the year. In contrast, it should be considered that domestic traffic in these areas
over the holiday period is likely to increase, as national mobile users typically share the same
touristic areas as roaming subscribers over the same period. In other words, domestic traffic
is likely to reflect some seasonality and geographic concentration, in the same way as
roaming traffic. Thus, the Seasonality 1 scenario is likely to overestimate the proportion of
network costs in touristic areas that should be allocated to roaming subscribers, whereas the
Seasonality 2 scenario more accurately reflects that domestic traffic is also likely to increase
in touristic areas over the holiday periods.
In addition, there are other factors that suggest that the impact of seasonality is likely to be
relatively small. In particular, seasonal roaming traffic is typically concentrated in a small
number of geographic locations. This implies that roaming traffic is only likely to affect
mobile operators' investment decisions in a small proportion of their network locations,
limiting any impact of roaming traffic on the mobile operators' total costs of building their
national mobile network.
Figure 24 presents the impact of seasonality on voice origination costs estimated by TERA
for each country under the Seasonality 2 scenario.
Figure 24: Mark-ups on voice services for seasonality (€c/min)

60
5.4.2.6. Total estimated wholesale roaming costs
The total costs for wholesale roaming services estimated by TERA are the sum of the three
different components described above, namely, the:
network costs;
roaming-specific costs; and
a re-allocation of network costs between roaming and domestic customers to take into
account the impact of seasonality.
The figure below presents the total wholesale roaming costs estimated by TERA for voice
and data services, respectively.
Figure 25: Total estimated wholesale roaming unit costs for voice origination (€c/min)

61
Figure 26: Total estimated wholesale roaming unit costs for data services (€c/MB)
5.5. Termination rates
When a roaming customer originates a call on a visited network, this call is then terminated
on the network of the customer receiving the call. Similarly to the situation with a domestic
call, the originating network operator pays the terminating network operator for terminating
the call. In this sense, the termination rate charged by the terminating network operator is part
of the total cost of originating the call for the visited network operator, as the latter has to pay
the terminating network operator for terminating the call.
Fixed and mobile termination rates are currently regulated in all countries of the EEA, with
the exception of Finland for fixed termination rates. However, the rates applicable are
different in every MS, as shown in Figure 27 and Figure 28, respectively.

62
Figure 27: Fixed termination rates applicable in MS (S2 2015) – BU-LRIC rates in blue
(€c/min)
Source: BEREC Report on the implementation of the Termination Rate Recommendation, BoR (15) 209,
December 2015.
Figure 28: Mobile termination rates applicable in MS (S2 2015) – BU-LRIC rates in blue
(€c/min)
Source: BEREC Report on the implementation of the Termination Rate Recommendation, BoR (15) 209,
December 2015.

63
For the purposes of assessing the cost that needs to be considered to compensate the visited
network operator for paying the terminating network operator's termination rate, the
following assumptions were made:
13% of calls are likely to be terminated on landlines and 87% on mobiles79
;
only mobile and fixed termination rates that have been set by NRAs using a BU-LRIC
approach were considered, consistent with the Commission's 2009 Termination Rates
Recommendation (i.e. only the MTRs in blue in Figure 27 and Figure 28 were
considered); and
for the fixed and mobile termination rates considered, in the interests of prudence, an
average of the five highest BU-LRIC fixed and mobile termination rates, respectively,
currently in place in the EEA was used.
Table 9 presents the calculation of the termination rates that were considered for the purposes
of assessing the total costs of originating a roaming call by a visited network operator,
including a compensation for the termination rate paid to the terminating network operator.
As shown in Table 9 the termination rate to be accordingly considered should be €1.02c/min.
Table 9: Termination rate to be considered within the cost of originating a mobile roaming
call (€c/min)
Country SK BE SI EL ES
Mobile termination rate 1.23 1.18 1.14 1.1 1.09
Average mobile termination rate 1.15
Country BG LU RO HU SK
Fixed termination rate 0.256 0.14 0.14 0.131 0.123
Average fixed termination rate 0.16
Weighted average termination rate 1.02 Note: In each case the five highest BU-LRIC fixed and mobile termination rates were considered, their averages
and finally the weighted average assuming 13% mobile-to-fixed and 87% mobile-to-mobile calls.
Source: BEREC Report on the implementation of the Termination Rate Recommendation, BoR (15) 209,
December 2015.
The above termination rate estimations are likely to be relatively conservative for the
following reasons:
the M/FTRs effective on the second semester of 2015 were considered, however,
RLAH will only be implemented in June 2017. We expect that by that time both
M/FTRs will be lower due to efficiency savings that are likely to reduce termination
price caps in EU countries; and
a significant share of calls will be terminated in countries with M/FTRs lower than the
five highest considered in the analysis. Thus, the weighted average termination rate
effectively paid by the visited network operator is likely to be lower than the one
estimated above.
5.6. Transit costs
79
This assumption is based on data collected from NRAs and Eurostat by TERA Consultants in the context of
the study SMART 2015/0008 – Assessment of the 2009 Termination Rates Recommendation and costing
methodologies for estimating termination rates.

64
International transit costs are also relevant for voice and data services:
Voice services: when originating a call on a visited network operator, the originating
operator interconnects with an international transit carrier of its choice that then routes
the call to the terminating network operator; and
Data services: data traffic needs to be routed back to the home network for real-time
billing and measures for customer protection (e.g. to prevent bill shock) and charging
transparency.
In the case of data, several mobile network operators were consulted and there is currently
very little use of Local Break-Out (LBO), a technical development that would avoid the need
to route data traffic back to the home network, in the EEA80
. All operators consulted agreed
that it is very unlikely that LBO will develop to any significant extent in the EEA by the time
of implementation of RLAH in June 2017. In contrast, all roaming data traffic is routed to the
home network using a IPX/GRX provider, and each network pays a charge that covers both
sending and receiving data traffic. It is therefore appropriate to account for transit costs for
both voice and data services.
In its report on International Mobile Roaming Regulation of December 201081
, BEREC
concluded that transit costs "represent an insignificant share of the total cost of roaming
services" and therefore excluded transit costs from the quantitative analysis of wholesale
roaming costs.
In order to estimate transit costs, data provided by operators in their response to the autumn
information request were used. Based on this evidence, it is concluded that it is appropriate to
consider the following transit costs:
Voice services: a cost of €0.4c/min; and
Data services: a cost of €0.2c/min.
5.7. Comparison of the voice cost estimates derived from TERA's study against
an alternative approach based on national mobile termination rates
In light of the above, we present in Figure 29 and Figure 30 the cost estimates for wholesale
roaming voice and data services, respectively, including an allowance for termination rates
and transit costs (in the case of voice) and transit costs (in the case of data), as described in
the previous sections.
Figure 29: Total estimated costs of wholesale roaming voice origination including the
termination rate and transit costs (€c/min)
80
See also the evidence provided in International Roaming BEREC Benchmark Data Report April – September
2015 BoR(16)28, page 11, reporting only one operator offering LBO services submitting data to BEREC. 81
BEREC Report on International Mobile Roaming Regulation, BoR(10)58, December 2010, section 5
"Assessment of costs", p 137.

65
Figure 30: Total estimated costs of wholesale roaming data services including transit costs
(€c/MB)
The cost estimates derived from TERA's study have been sense checked against an
alternative approach to estimating wholesale roaming voice costs based on NRAs' estimated
mobile termination costs. In particular, wholesale roaming voice costs under this alternative
approach were estimated as follows:
the cost of origination is assumed equal to the cost of termination. Also, in each
country the cost of origination will be equal to the BU-LRIC cost estimated by the

66
NRA (MS that do not estimate mobile termination costs based on a BU-LRIC
approach were excluded from this analysis);
the average joint and common costs estimated by TERA Consultants for voice
services were added (equal to €0.55c/min);
the roaming-specific costs estimated by TERA Consultants for each country were
included;
a mark-up to account for the seasonality impact estimated by TERA Consultants,
where relevant, was included;
a compensation was included for the termination rates that visited network operators
are, on prudent assumptions, exposed to paying to terminating network operators for
terminating calls on their network (€1.02c/min, as estimated above);
transit costs equal to €0.4c/min, as described above, were added.
Figure 31 presents below a comparison of the wholesale roaming cost for voice services
estimated using this alternative approach against the estimated wholesale roaming cost for
voice services derived from the TERA study and the average wholesale roaming market price
for unbalanced traffic.
Figure 31: Comparison between the TERA-based estimated cost for wholesale roaming
voice, an alternative approach to estimating costs for wholesale roaming voice, average
wholesale roaming market price for unbalanced traffic (€c/min)
The comparison between the cost estimates for voice derived from TERA's study and the
estimates using an alternative approach in Figure 31 above shows that:
the TERA-derived cost estimates are always below the cost estimates using the
alternative approach, with the only exception of Malta and Sweden. In the case of

67
Malta, the TERA approach estimates a cost of €4.20c/min and the alternative
approach shows a cost of €3.10c/min. In the case of Sweden, the TERA approach
estimates a cost of €3.22c/min and the alternative approach shows a cost of
€3.03c/min. In both cases, the lower cost estimate using the alternative approach is
mainly due to the low termination rates effective in Malta and Sweden (€0.4c/min and
€0.81c/min, respectively, in the second semester of 2015);
the maximum cost estimate derived from TERA (€4.20c/min in Malta) is above, but
broadly consistent with, the maximum cost estimate derived using the alternative
approach (€3.81c/min in Spain);
the cost estimates derived using the TERA cost model exceed the average market
price for wholesale roaming voice services in several countries (namely: Malta, Spain
and France). Similarly, the cost estimates derived using the alternative approach
exceed the prices in several countries (namely: Spain, France and Greece). This
supports the view that both the TERA cost model and the alternative approach provide
conservative estimates of the costs of wholesale roaming voice services82
.
Furthermore, it suggests that in the case of voice services, the effective wholesale
roaming prices should be given due weight when assessing the costs of voice services.
5.8. Cost estimates for SMS services
As described above, TERA Consultants' cost estimates for SMS services do not appear robust
enough to derive conclusions on actual SMS costs. For this reason, it is more appropriate to
rely on other sources of information. Figure 32 below presents the average wholesale
roaming prices for SMS services currently in place in EEA MS obtained in the autumn
information request.
82
The alternative approach uses the country's effective MTR to estimate the cost of origination, the other
components of the costs being derived from TERA's model (i.e. average common costs, average roaming-
specific costs, country-specific seasonality) and from operators' data on transit costs.
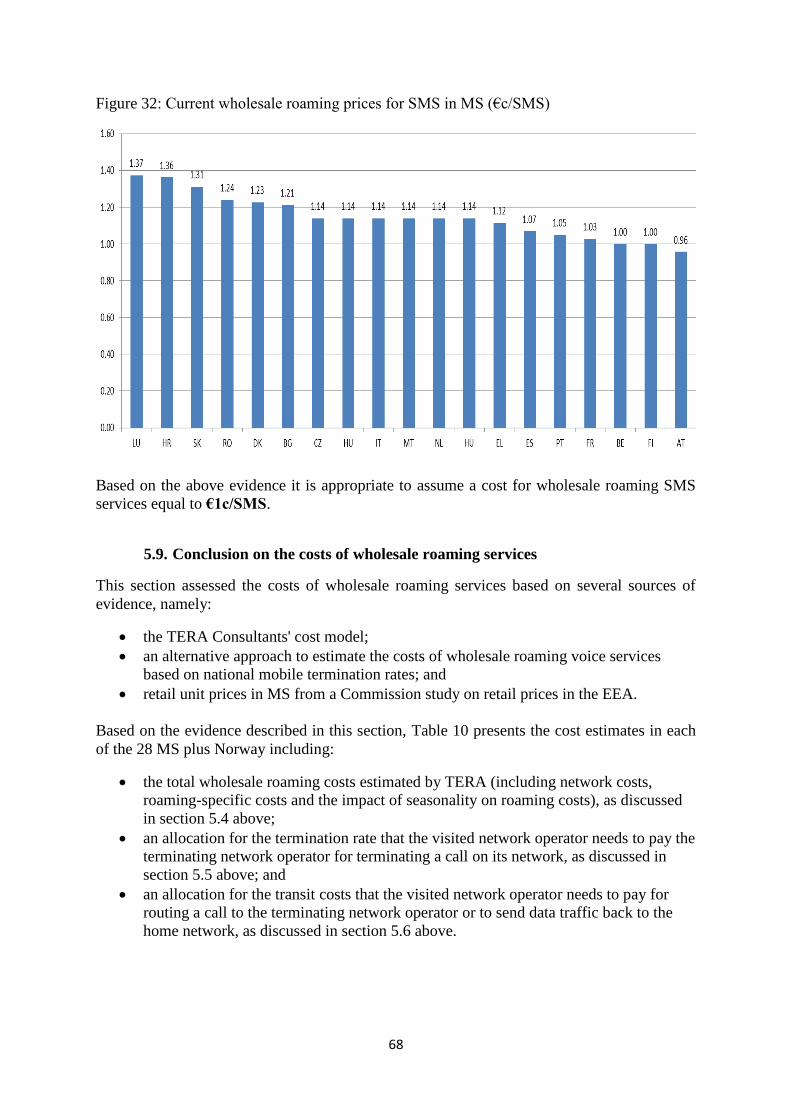
68
Figure 32: Current wholesale roaming prices for SMS in MS (€c/SMS)
Based on the above evidence it is appropriate to assume a cost for wholesale roaming SMS
services equal to €1c/SMS.
5.9. Conclusion on the costs of wholesale roaming services
This section assessed the costs of wholesale roaming services based on several sources of
evidence, namely:
the TERA Consultants' cost model;
an alternative approach to estimate the costs of wholesale roaming voice services
based on national mobile termination rates; and
retail unit prices in MS from a Commission study on retail prices in the EEA.
Based on the evidence described in this section, Table 10 presents the cost estimates in each
of the 28 MS plus Norway including:
the total wholesale roaming costs estimated by TERA (including network costs,
roaming-specific costs and the impact of seasonality on roaming costs), as discussed
in section 5.4 above;
an allocation for the termination rate that the visited network operator needs to pay the
terminating network operator for terminating a call on its network, as discussed in
section 5.5 above; and
an allocation for the transit costs that the visited network operator needs to pay for
routing a call to the terminating network operator or to send data traffic back to the
home network, as discussed in section 5.6 above.

69
Table 10: Wholesale roaming services' cost estimates in each of the 29 countries considered
in TERA Consultants' cost model
Voice (€c/min) SMS (€c/SMS) Data (€c/MB)
AT 2.60 1.00 0.30
BE 1.85 1.00 0.41
BG 2.74 1.00 0.53
CY 1.63 1.00 0.35
CZ 1.86 1.00 0.42
DE 1.70 1.00 0.31
DK 1.86 1.00 0.29
EE 1.82 1.00 0.34
EL 1.94 1.00 0.35
ES 2.81 1.00 0.41
FI 1.65 1.00 0.28
FR 2.79 1.00 0.39
HR 2.31 1.00 0.36
HU 2.39 1.00 0.39
IE 1.24 1.00 0.31
IT 1.75 1.00 0.31
LT 1.62 1.00 0.43
LU 2.63 1.00 0.44
LV 2.81 1.00 0.52
MT 4.20 1.00 0.67
NL 2.57 1.00 0.37
PL 1.72 1.00 0.32
PT 1.78 1.00 0.36
RO 1.79 1.00 0.59
SE 3.22 1.00 0.29
SI 2.52 1.00 0.57
SK 1.63 1.00 0.55
UK 2.65 1.00 0.36
NO 1.96 1.00 0.38
Section 6 below presents evidence on current prices for wholesale roaming services and
national wholesale prices for MVNOs. This evidence is broadly consistent with the costs
estimated by TERA Consultants for wholesale roaming services presented in this section. In
addition, evidence on wholesale roaming services' prices and MVNO rates supports the level
of the wholesale price caps used in each of the options considered in the Impact Assessment.
6. DEGREE OF COMPETITION IN WHOLESALE ROAMING MARKETS
In this section the Commission describes the functioning of wholesale roaming markets and
assesses the degree of competition currently existing in these markets. The section is
structured as follows:
First the Commission's approach to analysing developments in wholesale roaming
markets is described;

70
Second, the market failures that have been traditionally associated with wholesale
roaming markets are reviewed;
Third, an overview of wholesale roaming agreements is provided;
Fourth, the wholesale roaming markets in the EU is described;
Finally, the degree of competition in wholesale roaming markets is assessed;
6.1. Description of the Commission's approach
6.1.1. Literature review and previous studies
Market failures that have been associated with wholesale roaming markets in the literature
(section 6.2) have been confronted in the subsequent sections with the data and information
provided by EEA operators during the autumn 2015 data gathering exercise described in
section 6.1.2.
6.1.2. Questionnaire to operators and analysis of the data
The necessary data to analyse the functioning of, and level of competition in, the wholesale
roaming markets in the EU were obtained via the questionnaire sent in September 2015 by
the Commission and BEREC to M(V)NOs in all Member States.
For the purpose of assessing the degree of competition in wholesale roaming markets,
operators were requested to provide data and information about: (i) current wholesale
roaming agreement structures and tariffs, including the situation of light MVNOs; (ii) current
and future wholesale competition situation, (iii) aggregated retail domestic and (intra-
EU/extra-EU) roaming data consumption and revenue, (iv) wholesale roaming payments,
revenues and volumes by Member States of destination and origin, (v) aggregated balanced-
unbalanced traffic volumes and related average wholesale prices, (vi) expected wholesale
roaming prices for the year 2016. In this questionnaire, operators were also asked to provide
their views about the current functioning of the wholesale roaming market in the EU and
about future wholesale roaming price regulation.
127 operators provided at least part of the quantitative data requested above. The CC-ME of
the JRC extracted the original data and organized them in a unified database. Several
inconsistencies in the way data were reported were corrected, in particular as regards the unit
of measurement.
In order to analyse the representativeness of the sample of operators with respect to the whole
market and the presence of potential response bias, NRAs were asked through BEREC to
provide information on where the operators that provided data appeared in the distribution of
national operators, when sorted according to size. This information was provided for all
Member States that contributed data for the analysis; the Member States that did not provide
data were: CY, DE, HU, IT, LU, SI, UK.
For Member States contributing some data, the fraction of operators providing data over the
total was on average equal to 79%. When restricting attention to the largest 50% of operators,
this fraction was equal to 93%. This means that the sample of 127 operators providing data
slightly over-represents large operators. Due to the small absolute number of operators, this
difference does not appear to be large.
In the remainder of this section, the results of the analysis are shown by operator and by
country. For each variable of interest (e.g. inbound wholesale roaming volume as % of retail

71
domestic consumption) the operators' graph represents the distribution of the operators'
values in the sample of operators providing the necessary data as a cumulative fraction of the
sample (expressed as %). This means that for each value of the variable of interest on the x-
axis, the graph shows what % of the operators' sample is below that value. Operators are
looked at on a per-country basis, which means per subsidiary for the multi-country groups.
The countries' graphs show the aggregated value of the variable of interest over all operators
operating in a given country that have provided the necessary data.
6.1.3. Public consultation
The first part83 of the 12-week public consultation was dedicated to gathering views on the
functioning of, and level of competition in, the wholesale roaming markets in the EU, on the
need to regulate them in view of the abolition of retail roaming surcharges by 15 June 2017,
on possible options for doing so, and on the possible risks associated with permanent roaming
and the ways to address them. The results of the consultation concerning the functioning of
national wholesale roaming markets are analysed in sections 6.5.1 and 6.5.2.
6.2. Market failures in wholesale roaming markets
This section provides an overview of the market failures that have been traditionally
associated with wholesale roaming markets, in particular:
Natural oligopoly structure, which fosters low intensity of competition
Imperfect wholesale roaming substitutes;
Double marginalisation and coordination problem;
Bilateral nature of wholesale roaming agreements:
Exclusion of MVNOs from wholesale roaming market.
6.2.1. Natural oligopoly structure, which fosters low intensity of competition
An argument generally raised is that the roaming market presents many characteristics of a
natural oligopolistic market.84
High infrastructural costs of mobile communications limit the
entrance of players, and the situation creates low competitive pressure. There seems not to be
indications that this has substantially changed, in one direction or another. In wholesale
domestic roaming markets, there is generally more than one operator effectively competing
for attracting visiting network, but the number does not rise to substantial competitive levels
so that the overall structure of the market is affected. Moreover, the number of competitors is
significantly reduced when it comes to those who offer full coverage, network quality, or
traffic exchange deals (see section 6.2.4) which is seen by operators as key factors explaining
their final roaming deals, generally tide to only one preferred network (see section 6.3).
Moreover, according to investigations carried out by the Commission services, access
measures applied at the domestic level do not significantly change this situation, as MVNOs
83
The two other sections of the public consultation covered respectively fair use policy and the sustainability
mechanism provided for in the Regulation. 84
Alkatheeri, S. (2013). The Economics of Mobile International Roaming. Doctoral Dissertation. University of
East Anglia School of Economics. WIK-Consult (2010), Study on the Options for addressing Competition
Problems in the EU Roaming Market, SMART 2010/018, December, p. 9. European Commission (2011),
Commission Staff Working Paper – Impact Assessment of Policy Options in Relation to the Commission's
Review of the Functioning of Regulation EC No 544/2009 of the European Parliament and of the Council of 18
June 2009 on Roaming on Public Mobile Telephone Networks within the Community, 6 July 2011, SEC(2011)
871. p. 15.

72
do not resell, in the wholesale roaming market, their domestic wholesale access (a different
situation is the role played by Global MVNOs, analysed below).
6.2.2. Imperfect wholesale roaming substitutes
Similarly to the situation at the retail level, where end users have limited alternatives to
retail roaming services, operators have only imperfect substitutes at the wholesale level as
well, a situation that a previous report ordered by the Commission already analysed 85
.
Developments in steering technology, which give control to operators over which visited
mobile network their clients attached to, sparked an “internalisation” trend in the form of
growing roaming alliances, hubs and other groupings86
. These changes, however, do not
seem to have, in view of many operators, contributed much in perfecting the functioning of
the wholesale market (see section 6.4)87
, nor did it improve the incentives to pass-by
potential savings to the consumers via retail discounts88
.
“Localization” (where roaming is offered to costumers at local terms) is another trend that
does not seem to have had much impact at the wholesale level. Beside all the limits
analysed in the retail dimension of these trend (see section 4.2.1), it does not seem that
operators have so far designed localization strategies with a mass-market impact (for how
eSims might or might not change this situation, see section 4.4). A special case in point are
global MVNOs. Global MVNOs have access to networks in different countries on local
terms and conditions based on domestic wholesale agreements or MVNO regulations. They
typically use these agreements to interconnect their customers at local terms and conditions,
thereby bypassing the IOT system. At the retail level, this enables local pricing for roaming
services. However, global MVNOs typically target a niche market of mainly business
customers and subscribers, who then need to pass on different numbers to business
associates for each country they travel to. Given this level of inconvenience, it is unlikely
that global MVNOs may develop into a fully effective roaming substitute for the mass
market of residential users.89
6.2.3. Double marginalisation and difficulties in coordination
The problem of double marginalisation has also been invoked as a possible market failure
operating in the wholesale roaming market.90
Prices in the roaming market might be even
above the monopoly price, it is argued, due to separate uncoordinated mark-ups applied by
both retail suppliers and providers of wholesale roaming access. MNOs charge an
oligopolistic price at wholesale, and at retail level, each MNO takes as given the wholesale
85
WIK-Consult (2010), Study on the Options for addressing Competition Problems in the EU Roaming Market,
SMART 2010/018, December, p. 20-23. 86
Alkatheeri, S. (2013). The Economics of Mobile International Roaming. Doctoral Dissertation. University of
East Anglia School of Economics. WIK-Consult (2010), Study on the Options for addressing Competition
Problems in the EU Roaming Market, SMART 2010/018, December, p. 21. 87
In fact, they might have even further harmed competition: see Buhler, B. (2009) Do international roaming
alliances harm consumers? In Institutions and Markets Series (ed. Fausto Panunzi). 88
WIK-Consult (2010), Study on the Options for addressing Competition Problems in the EU Roaming Market,
SMART 2010/018, December, p. 21. 89
WIK-Consult (2010), Study on the Options for addressing Competition Problems in the EU Roaming Market,
SMART 2010/018, December, p. 22-23. 90
Lupi, P. and Manenti, F. (2008). Traffic Management in Wholesale International Roaming: Towards a More
Efficient Market?. Paper presented in the 2007 Annual Conference of the European Economic Association ,
Budapest. WIK-Consult (2010), Study on the Options for addressing Competition Problems in the EU Roaming
Market, SMART 2010/018. P 39

73
price and adds a retail mark-up to the wholesale tariff. Ultimately, market agents prefer to
charge oligopolistic mark-ups to a small volume of roaming transactions than expanding the
market with lower prices.
It has therefore been argued that both social welfare and overall profits could improve if it
was possible to coordinate an outcome with lower retail and wholesale prices that increase
roaming demand and profits for both parties. However, there are difficulties in coordinating
such an outcome due to uncertainties in future roaming demand and the sharing of risks from
uncertain roaming demand following the reduction in prices at wholesale and retail level.
This idea is supported by the evidence showing that RLAH-type of offers have been typically
offered by MNOs active in several national markets, where this trans-national vertical
integration would reduce the risks and costs of coordination
It is also the case that the difficulties in coordination between a wholesale and retail provider
might have been somewhat mitigated with the improvement in steering technologies (see
previous section), which have enabled MNOs to direct traffic generated by their customers to
a visited network of their choice, making other market problems more prominent.
6.2.4. Bilateral nature of wholesale roaming agreements
Wholesale roaming agreements are generally driven by the amount of traffic that that the
visiting operator is able to offer during bilateral negotiation91
. Operators typically agree to
"balance" their respective traffic, and then the net sender of traffic gets an additional discount
on the amount of traffic that exceeds the amount of traffic received from the roaming partner
(see Section 6.3.4). It has been argued that this creates a situation where operators with low
traffic are in practice unable to both, obtain a good price during the negotiations with visited
networks, and effectively compete for visiting traffic, no matter their price offers.92
The fact
that they cannot offer significant "traffic balancing" deals reduce their negotiation power, as
operators are ultimately interested not so much on lowering costs, but on meeting overall
revenue targets. This is in principal maximized by exchanging traffic, thus effectively
hampering those who cannot deal in such terms. Section 6.3 of the report analyses current
bilateral agreements.
6.2.5. Exclusion of MVNOs from wholesale roaming markets
The exclusion of full MVNOs from the wholesale inbound market is another problem often
raised by these operators. This problem arises from the fact that bilateral negotiations for
roaming services are most often based on Standard Terms for International Roaming
Agreements (STIRA) (i.e. standard documents regularly amended giving a general
framework to conclude agreements with foreign MNOs), which can currently only be used by
GSMA members. In contrast, MVNOs cannot have the required GSMA membership.
Although in theory, other types of contracts could be concluded, in practice these introduce
higher uncertainty resulting in greater transaction costs for MVNOs. To improve this
91
European Commission (2011), Commission Staff Working Paper – Impact Assessment of Policy Options in
Relation to the Commission's Review of the Functioning of Regulation EC No 544/2009 of the European
Parliament and of the Council of 18 June 2009 on Roaming on Public Mobile Telephone Networks within the
Community, 6 July 2011, SEC(2011) 871. p. 38. WIK-Consult (2010), Study on the Options for addressing
Competition Problems in the EU Roaming Market, SMART 2010/018, December, p. 10. 92
Shortall, T. (2010). A Structural Solution to Roaming in Europe. Robert Schuman Centre for Advanced
Studies.

74
situation, the GSMA mentioned that they were preparing to allow MVNOs use standard
commercial documents such as STIRA.93
The exclusion of MVNOs implies that they typically buy roaming services from a domestic
MNO, most of the time their host MNO. As there are no price caps on the wholesale resale
market, and MNOs are at the same time suppliers for the MVNOs (at wholesale level) and
competitors of these MVNOs (at retail level), MVNOs often encounter margin squeeze
problems.94
6.3. Overview of wholesale roaming agreements
BEREC has provided the following description of the wholesale roaming agreements that
operators negotiate for roaming in the EEA, based on the information provided by EEA
operators during the autumn 2015 data collection 95
.
6.3.1. Standard Roaming Agreements and roaming discount agreements
Operators report that they sign two types of wholesale roaming agreements. The first type
called International Roaming Agreements or Standard Roaming Agreements defines the
operational and technical aspects of the roaming relationship. In addition, roaming discount
agreements are annexes to the international roaming agreements and specify the commercial
aspects of the agreement including the prices that have to be paid. While standard roaming
agreements are ongoing (with the possibility to terminate them after a period of notice of six
months), the discount agreements typically have a duration of 12 months (one calendar year).
These bilateral roaming agreements are based on common principles developed by the GSM
Association.96
Operators regularly renegotiate discount agreements because of the unpredictable nature of
the market with a high degree of regulatory uncertainty, unpredictable traffic volumes and
frequent mergers and other changes of ownership. These uncertainties need to be balanced by
the transaction cost of negotiating agreements. Some discount agreements are automatically
renewed every year unless one party objects.
6.3.2. Bilateral and unilateral roaming agreements
Roaming agreements are usually negotiated bilaterally, so that each operator gets roaming
access to the other operator’s network. Operators describe a number of advantages of bilateral
agreements: they build partnerships, enlarge roaming coverage to the benefit of customers
and not least secure inbound roaming traffic and revenue that can (partly) offset the outbound
roaming cost. Sometimes, bilateral agreements are (initially) used unilaterally by one
93
European Commission (2011), Commission Staff Working Paper – Impact Assessment of Policy Options in
Relation to the Commission's Review of the Functioning of Regulation EC No 544/2009 of the European
Parliament and of the Council of 18 June 2009 on Roaming on Public Mobile Telephone Networks within the
Community, 6 July 2011, SEC(2011) 871, p. 14-15. 94
European Commission (2011), Commission Staff Working Paper – Impact Assessment of Policy Options in
Relation to the Commission's Review of the Functioning of Regulation EC No 544/2009 of the European
Parliament and of the Council of 18 June 2009 on Roaming on Public Mobile Telephone Networks within the
Community, 6 July 2011, SEC(2011) 871, p. 15. 95
BEREC (2016), BEREC Report on the wholesale roaming market, BoR(16)33, February 2016, section 3.1 96
WIK-Consult (2010), Study on the Options for addressing Competition Problems in the EU Roaming Market,
SMART 2010/018, December, p. 7.

75
roaming partner. Unilateral agreements are signed when the requesting MNO has bad
geographical coverage or network quality, or is a late entrant, or when a full MVNO requests
access.
Typically, operators who are part of a group negotiate international roaming agreements
individually but negotiate discount agreements as a group. By negotiating commercial terms
for the whole group companies can get more attractive terms and prices because of higher
volumes. However, in some cases these operators negotiate discount agreements individually
when it is commercially relevant or for practical reasons. MNOs that are not part of a group
negotiate individually.
6.3.3. Number of roaming agreements in each destination country
Generally, operators have agreements with more than one operator in each EU country, in
order to address gaps in geographic coverage and get more inbound roaming revenue.
Operators in big groups report that they have agreements with almost all operators.
Nevertheless, operators typically have one preferred network in each country to which they
try to steer their traffic.
Some smaller operators or operators from small countries only sign more than one agreement
in countries where they have a lot of traffic (inbound or outbound) in order to prioritize
resources.
6.3.4. Pricing models
Operators tend to apply a range of discount price models. The following are the most
common types:
Fixed rate model where there is a fixed (discounted) rate per unit per service or a
discount as a percentage of the regulated cap.
The balanced/unbalanced model is a typical pricing method in bilateral discount
agreements. Each party exchanges traffic and the net sender of traffic gets an
additional discount on the amount of traffic that exceeds the amount of traffic
received from the roaming partner. This gives both parties an incentive to send more
traffic to each other since additional outbound traffic will reduce the net sender’s
average cost and the net receiver will increase its average revenue if it sends more
traffic.
When using traffic or volume commitments the roaming party commits to sending a
certain amount of traffic for a discounted price. A version of this often used is tiered
pricing where the price goes down if a certain volume threshold is reached.
Sometimes prices go down from the first unit or just for the incremental volume
above the threshold. Tiered pricing mean that higher outbound volumes result in
lower per unit cost for the home operator.
With a financial or revenue commitments or send-or-pay the visiting operator
commits to paying at least a minimum amount in wholesale roaming charges across
all services. This can be based on defined tariffs for each service or bundled volumes
for each service. Additional discounts may apply if these thresholds are exceeded.
These agreements secure a certain level of revenue for the visited network and lower
prices for the net buyer if the included volumes are consumed. Typically, the higher
the committed revenue the higher discounts can be achieved.

76
For voice services sometimes a per destination pricing model is applied where prices
vary depending on the destination of calls made in order to account for differences in
interconnection cost.
These different pricing models are in many cases combined. For example a
balanced/unbalanced agreement might include a minimum volume/revenue commitment.
There can also be different price models for different services in the same discount agreement
– e.g. one for voice and one for data services.
A number of elements specific to each individual negotiation determine the choice of pricing
model and the level of discounts that can be negotiated. These elements include traffic
volumes and the level of imbalances in inbound and outbound volumes. Other important
elements are national market share, network quality and MTR cost. An operator with a high
national market share and good network quality will, ceteris paribus, secure better discount
agreements. Alliance networks are more likely to offer discounts.97
Some operators report that a high amount of outbound traffic gives operators bargaining
power that can result in higher discounts for the net buyer of roaming services than they have
to give to the net receiving party. Other operators report that the net seller of roaming
services has the advantage since it is usually the seller who has the geographical advantage
e.g. the best network in a popular roaming country.
Some operators report that if they compete in the domestic market with an operator that is
part of a pan-European group they are not able to negotiate reasonable roaming discounts
with other members of this group in visited markets and thus have to rely on agreements with
smaller operators in those countries.
Most group operators report that they apply internal transfer pricing that is based on an arm’s
length principle. In these cases the internal rate is based on the market rates offered to
external partners. One group reports that this market rate is calculated as the average rate
charged to the main trading partners. One group apply bill and keep while another group uses
zero pricing between subsidiaries.
6.3.5. Permanent roaming
A majority of MNOs responded that they have so far not implemented any measure to
prevent a foreign operator from permanently roaming on their network. They claim that there
has so far been no compelling reason to implement any such measure since under past and
current wholesale roaming caps wholesale roaming providers have been able to recover their
costs with a good margin. Some even highlight that they seek to increase the roaming traffic
on their network by using mechanisms like volume commitments, revenue commitments in
their wholesale roaming agreements.
About 20% of the responding MNOs have however some kind of mechanism in their
wholesale roaming agreement which could be used to discourage permanent roaming. This is
usually done by excluding permanent roaming from any price discount. The difference
between discounted and non-discounted wholesale roaming prices therefore seems to be a
crucial element for operators to control permanent roaming. In one case, the operator includes
97
Alkatheeri, S. (2013). The Economics of Mobile International Roaming. Doctoral Dissertation. University of
East Anglia School of Economics.

77
a maximum number of days per year per visiting SIM card in some of its wholesale roaming
agreements: beyond that number of days, the roaming traffic generated on its network by a
visiting SIM card is charged at the wholesale roaming cap level by the operator to the
operator owning that visiting SIM card. In another example given by a respondent, individual
roaming data consumption beyond 10 GB per month is subject to revised commercial
negotiations, and if the parties do not agree on a less discounted price, the wholesale roaming
cap is applied beyond the monthly 10 GB limit.
Some operators indicate that they might introduce mechanisms in the future to prevent
unwanted permanent roaming if wholesale roaming caps are decreased below relevant costs.
A few operators also mention that they have mechanisms in their wholesale roaming
agreement to prevent losses on terminating calls to destination with high MTRs. Countries
with high MTRs might be excluded from special negotiated low wholesale rates or a
consumption limit can be added for the total number of minutes to specific countries.
6.3.6. Machine-to-Machine communications (M2M)
SIM cards are introduced, possibly soldered, in the connected object at manufacture. The
manufacturer of connected objects often sells them globally and cannot predict in which
country a particular object will be sold and used ultimately. As a result, once sold, the
connected object may well have to be permanently roaming on a network of the country
where it is used. Permanent roaming may therefore be an important feature of many M2M
applications98
. In addition, the traffic patterns many of them generate, with a lot of signalling
and less data, are different from those of traditional communications generated by humans
where data traffic largely dominates over signalling traffic. Permanent roaming and different
traffic patterns might be two reasons why M2M communications could be subject to specific
roaming agreements, distinct from those covering traditional person-to-person
communications.
About 20% of the responding MNOs indicate that they have signed separate agreements for
M2M communications. This shows that most operators do not, under the current regulatory
regime, see the scope of such traffic as significant enough to enter into specific negotiations
with their roaming partners. Many operators explicitly state that separate agreements for
M2M are not necessary.
The majority of operators do not apply specific prices or conditions for M2M traffic. They
seem to treat this traffic the same way as ordinary traffic when it comes to financial terms in
the contracts. However, some operators also express concerns as they see some challenges in
covering the production costs of traffic generated by some M2M communications because of
the small amount of data they generate. In those cases, signalling traffic dominates the traffic,
which is hard to recover from their roaming partners within today’s standard roaming prices
structure. A few operators have special conditions and rates for M2M traffic, one operator
says that M2M is typically excluded from discounts.
98
This is different from the case of mobile phones for which the SIM card is introduced only when the phone is
sold to the end-user. Usually the smartphone is sold by the operator itself to the customer, together with its own
SIM card.

78
None of the respondents that engage into M2M agreements employ any exclusivity clause for
the use of their network. One operator states that such clauses would harm the M2M services,
since the offered quality could suffer if the applications could not select the best network at
any given time.
Several respondents call for transparency regarding the type of traffic generated by visiting
SIM cards (i.e. traditional traffic generated by a person or M2M communication). This is
necessary to implement a specific M2M roaming contract if there is one. And those who do
not have any specific roaming contract for M2M still want to monitor the extent and
evolution of M2M traffic. Some respondents reveal that they intend to more and more closely
monitor SIM cards that visit their network for longer periods.
Such monitoring is foreseen to become a necessity in the RLAH regime. National networks
are dimensioned and built to host domestic SIM cards and if RLAH is introduced without
proper safeguards, some see a risk that foreign SIM cards will be located on a permanent
basis on their networks – creating problems of capacity management and possible network
congestion.
A couple of MNOs refer to agreements that aim to reduce the risk of having many foreign
M2M devices in their network on a permanent basis. These agreements allow a maximum
percentage of traffic out of the total observed from that visiting operator to permanently
roam. It is pointed out however, that for the visited network this percentage/limit is difficult
to detect and control.
6.4. Description of the wholesale roaming market in the EU
6.4.1. Wholesale roaming traffic flows between Member States
As noted in BEREC's Report on the wholesale roaming market99
, observed patterns of voice
roaming traffic between EEA countries reflect to some extent particular historical, linguistic,
cultural and economic links between countries (see Table 14 in Annex 3 showing the detailed
roaming voice traffic flows between countries).
There has also traditionally been a North-South divide in Europe between high-tourism
Southern locations (e.g. Spain, Italy, Greece, Malta, Cyprus) and lower-tourism Northern
locations (e.g. the UK, Germany, Netherlands). In this regard, roaming traffic flows are likely
to be highly influenced by the patterns of tourism and travelling in the EU.
In order to assess the countries that are net senders and net receivers of roaming traffic, one
can look at the ratio of inbound-to-outbound wholesale roaming traffic. A ratio greater than 1
(or 100%) implies that the country is a net receiver of roaming traffic whereas a ratio below 1
(or 100%) implies that the country is a net sender.
Table 11 below shows the inbound/outbound ratio for each country for each of the three
services. Cyprus, Greece, Malta and Spain stand out as very pronounced net receivers in all
three services. Bulgaria, Croatia, Hungary, Poland and Portugal have a particularly high data
unbalance. This is likely to be due to low data consumption of customers from these countries
99
BEREC's Report on the wholesale roaming market, BoR(16)33, 29 February 2016

79
when they roam abroad, and lower outbound travel patterns, in addition to a large inflow of
tourists in some of these countries; Belgium and Luxembourg as well are marked net
receivers in data, which might be related to the intensive data usage by business users coming
to these countries all over the year.
In contrast, Ireland, the Netherlands, Norway, Romania, Slovakia and the UK are pronounced
net senders in all three services. Other important net senders are Denmark, Finland and
Poland, (voice and SMS), Czech republic and Slovenia (data and SMS), and Austria (data).
The other countries have a more balanced situation (France, Italy, Latvia, Lithuania, Sweden)
or operators have not provided the necessary data (Estonia, Germany).
Table 11 - Inbound/Outbound ratio for roaming services: voice, data and SMS (in green
values above 150%, in blue values below 75%)
Voice (Inbound/ outbound ratio)
Data (Inbound/ outbound ratio)
SMS (Inbound/ outbound ratio)
Country 2013 2014 1H2015 2013 2014 1H2015 2013 2014 1H2015
Austria 81% 87% 96% 30% 57% 78% 120% 115% 120%
Belgium 114% 131% 168% 161% 170% 247% 102% 107% 127%
Bulgaria 124% 117% 82% 670% 383% 147% 191% 190% 145%
Croatia 144% 155% 122% 3610% 4238% 1400% 91% 91% 61%
Cyprus 153% 177% 180% 165% 1053% 1025% 186% 170% 154%
Czech Republic 107% 90% 86% 52% 77% 121% 48% 49% 50%
Denmark 72% 77% 79% 119% 152% 157% 48% 43% 40%
Estonia Finland 72% 77% 72% 96% 84% 78% 55% 55% 51%
France 144% 141% 149% 219% 125% 113% 102% 80% 70%
Germany Greece 289% 323% 240% 559% 709% 497% 733% 890% 658%
Hungary 101% 94% 80% 229% 255% 269% 101% 111% 124%
Ireland 37% 45% 55% 27% 39% 40% 41% 42% 48%
Italy 98% 95% 116% 110% 100% 128% 125% 152% 186%
Latvia 88% 100% 97% 123% 123% 105% 52% 58% 47%
Lithuania 85% 96% 94% 113% 115% 98% 51% 57% 47%
Luxembourg 104% 120% 145% 153% 176% 247% 131% 137% 151%
Malta 330% 305% 343% 800% 760% 722% 274% 277% 314%
Netherlands 45% 51% 58% 23% 34% 49% 62% 70% 77%
Poland 63% 61% 65% 108% 219% 503% 42% 38% 38%
Portugal 150% 100% 88% 348% 237% 219% 128% 143% 136%
Romania 72% 40% 21% 86% 37% 20% 35% 30% 24%
Slovakia 51% 46% 43% 62% 18% 14% 46% 42% 39%
Slovenia 115% 99% 88% 34% 31% 49% 62% 55% 58%
Spain 325% 373% 350% 523% 531% 391% 1445% 1692% 1913%
Sweden 100% 111% 117% 107% 116% 76% 52% 56% 61%
UK 75% 76% 90% 58% 55% 70% 63% 63% 74%
Iceland Liechtenstei
n Norway 54% 55% 71% 37% 48% 97% 53% 57% 60%
Switzerland Min 37% 40% 21% 23% 18% 14% 35% 30% 24%
Mean 100% 101% 100% 270% 311% 218% 139% 152% 152%
Median 100% 96% 90% 113% 123% 121% 63% 70% 70%
Max 330% 373% 350% 3610% 4238% 1400% 1445% 1692% 1913%
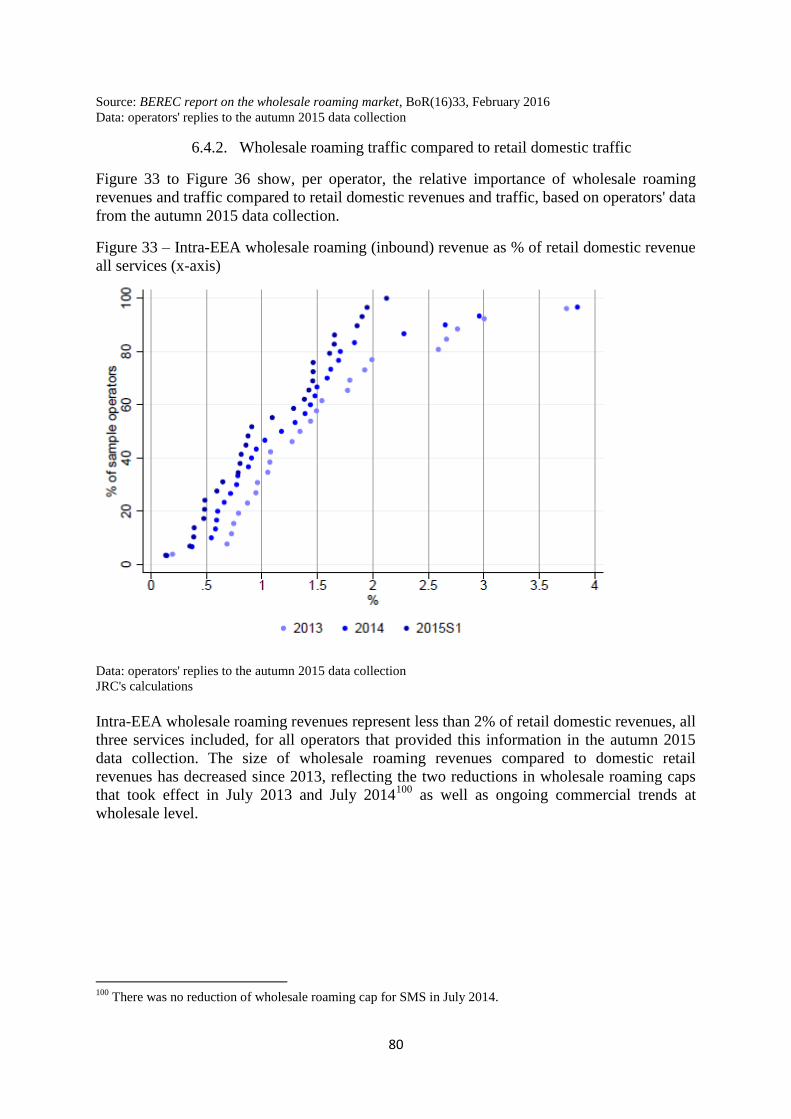
80
Source: BEREC report on the wholesale roaming market, BoR(16)33, February 2016
Data: operators' replies to the autumn 2015 data collection
6.4.2. Wholesale roaming traffic compared to retail domestic traffic
Figure 33 to Figure 36 show, per operator, the relative importance of wholesale roaming
revenues and traffic compared to retail domestic revenues and traffic, based on operators' data
from the autumn 2015 data collection.
Figure 33 – Intra-EEA wholesale roaming (inbound) revenue as % of retail domestic revenue
all services (x-axis)
Data: operators' replies to the autumn 2015 data collection
JRC's calculations
Intra-EEA wholesale roaming revenues represent less than 2% of retail domestic revenues, all
three services included, for all operators that provided this information in the autumn 2015
data collection. The size of wholesale roaming revenues compared to domestic retail
revenues has decreased since 2013, reflecting the two reductions in wholesale roaming caps
that took effect in July 2013 and July 2014100
as well as ongoing commercial trends at
wholesale level.
100
There was no reduction of wholesale roaming cap for SMS in July 2014.

81
Figure 34 – Intra-EEA wholesale roaming (inbound) traffic as % of retail domestic traffic (x-
axis) (outgoing voice)
Figure 35 – Intra-EEA wholesale roaming (inbound) traffic as % of retail domestic traffic
(outgoing SMS)
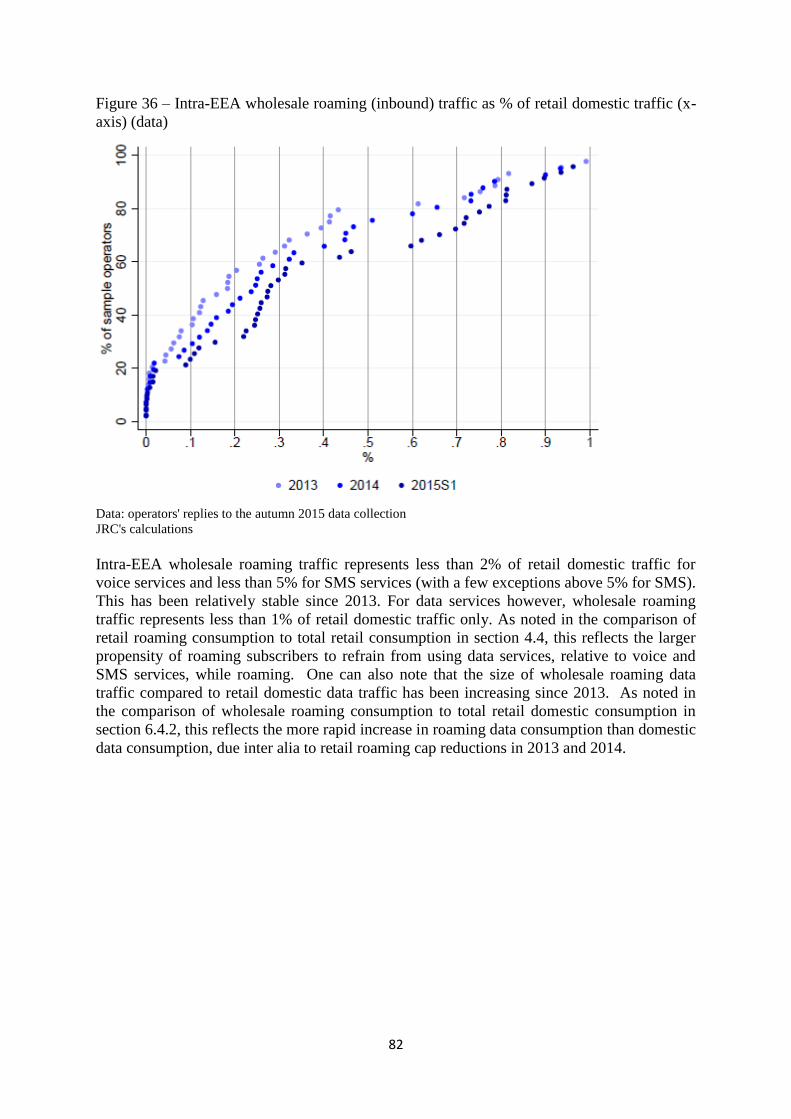
82
Figure 36 – Intra-EEA wholesale roaming (inbound) traffic as % of retail domestic traffic (x-
axis) (data)
Data: operators' replies to the autumn 2015 data collection
JRC's calculations
Intra-EEA wholesale roaming traffic represents less than 2% of retail domestic traffic for
voice services and less than 5% for SMS services (with a few exceptions above 5% for SMS).
This has been relatively stable since 2013. For data services however, wholesale roaming
traffic represents less than 1% of retail domestic traffic only. As noted in the comparison of
retail roaming consumption to total retail consumption in section 4.4, this reflects the larger
propensity of roaming subscribers to refrain from using data services, relative to voice and
SMS services, while roaming. One can also note that the size of wholesale roaming data
traffic compared to retail domestic data traffic has been increasing since 2013. As noted in
the comparison of wholesale roaming consumption to total retail domestic consumption in
section 6.4.2, this reflects the more rapid increase in roaming data consumption than domestic
data consumption, due inter alia to retail roaming cap reductions in 2013 and 2014.

83
Figure 37 – Intra-EEA wholesale roaming (inbound) revenues and traffic as % of retail
domestic revenues and traffic (y-axis), 2014
Data: operators' replies to the autumn 2015 data collection
JRC's calculations
In all countries, intra-EEA wholesale roaming revenues and traffic represent less than 4% of
retail domestic revenues and traffic, except for SMS services in some countries. Countries
where intra-EEA wholesale roaming revenues are the highest compared to domestic retail
revenues as Luxembourg (almost 4%), Croatia (3%), Spain and Malta (both slightly below
2%).
6.4.3. Wholesale roaming payments and revenues balance
Figure 38 shows the total (i.e. the three services included) intra-EEA wholesale roaming
balance (i.e. revenues minus payments) expressed as a % of total retail domestic revenues,
per operator, based on operators' data from the autumn 2015 data collection.

84
Figure 38 - Total intra-EEA wholesale roaming balance (revenues minus payments) as a % of
total retail domestic revenues (x-axis), all services included
Data: operators' replies to the autumn 2015 data collection
JRC's calculations
About 60% of the operators providing the data have balanced intra-EEA wholesale roaming
revenues and payments within the [-1%; +1%] range of total retail domestic revenues. About
20% of them have a negative intra-EEA wholesale roaming imbalance below -1% of total
retail domestic revenues and about 20% a positive imbalance above +1%. The EEA
wholesale roaming balance has stayed relatively stable since 2013.
Figure 39 shows the total intra-EEA wholesale roaming balance expressed as a % of total
retail domestic revenues per country.

85
Figure 39 - Total intra-EEA wholesale roaming balance (revenues minus payments) as a % of
total retail domestic revenues (y-axis), all services included, per country
Data: operators' replies to the autumn 2015 data collection
JRC's calculations
Operators in Croatia have the largest positive imbalance (i.e. wholesale roaming revenues
exceeding wholesale roaming out-payments), which however decreased from slightly above
3% to slightly less than 3% of total retail domestic revenues. Other inbound roaming
countries are Spain, Greece, Malta and Luxembourg, with a positive imbalance wholesale
roaming representing about +1% of total retail domestic revenues in 2014. In contrast,
operators in Slovenia, the Netherlands, Denmark, have the strongest negative imbalances (i.e.
wholesale roaming payments exceeding wholesale roaming revenues), followed by Norway,
Poland, Slovakia. The data therefore illustrate the North/South divide of outbound/inbound
countries in Europe. They also show the modesty of the size of the wholesale roaming
imbalance in either direction compared to total retail domestic revenues.
6.4.4. Wholesale roaming prices in the EU
Section 6.3 above described the process of negotiating wholesale access roaming prices and
the contractual agreements typically observed between wholesale roaming operators in the
EU. This section describes the wholesale roaming prices resulting from those negotiations, as
well as the revenues derived from wholesale roaming services in different Member States.
In general, two MNOs in two different Member States will have a certain amount of roaming
traffic (minutes, SMS, MB) that balance out ("balanced traffic")101
and a certain amount of
101
In certain cases however an MNO may not receive any in-coming roaming traffic. This is typically the case
of late entrants that entered domestic markets after the existing MNOs had already reached wholesale access
agreements with all MNOs abroad.
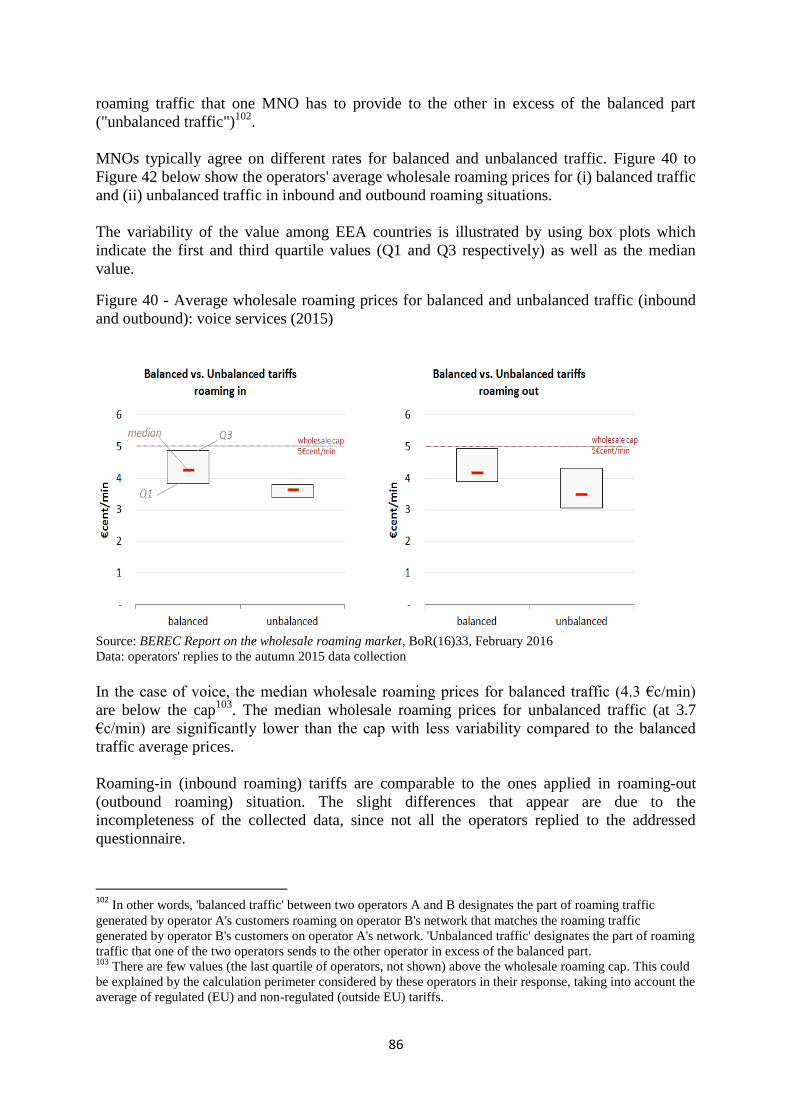
86
roaming traffic that one MNO has to provide to the other in excess of the balanced part
("unbalanced traffic")102
.
MNOs typically agree on different rates for balanced and unbalanced traffic. Figure 40 to
Figure 42 below show the operators' average wholesale roaming prices for (i) balanced traffic
and (ii) unbalanced traffic in inbound and outbound roaming situations.
The variability of the value among EEA countries is illustrated by using box plots which
indicate the first and third quartile values (Q1 and Q3 respectively) as well as the median
value.
Figure 40 - Average wholesale roaming prices for balanced and unbalanced traffic (inbound
and outbound): voice services (2015)
Source: BEREC Report on the wholesale roaming market, BoR(16)33, February 2016
Data: operators' replies to the autumn 2015 data collection
In the case of voice, the median wholesale roaming prices for balanced traffic (4.3 €c/min)
are below the cap103
. The median wholesale roaming prices for unbalanced traffic (at 3.7
€c/min) are significantly lower than the cap with less variability compared to the balanced
traffic average prices.
Roaming-in (inbound roaming) tariffs are comparable to the ones applied in roaming-out
(outbound roaming) situation. The slight differences that appear are due to the
incompleteness of the collected data, since not all the operators replied to the addressed
questionnaire.
102
In other words, 'balanced traffic' between two operators A and B designates the part of roaming traffic
generated by operator A's customers roaming on operator B's network that matches the roaming traffic
generated by operator B's customers on operator A's network. 'Unbalanced traffic' designates the part of roaming
traffic that one of the two operators sends to the other operator in excess of the balanced part. 103
There are few values (the last quartile of operators, not shown) above the wholesale roaming cap. This could
be explained by the calculation perimeter considered by these operators in their response, taking into account the
average of regulated (EU) and non-regulated (outside EU) tariffs.
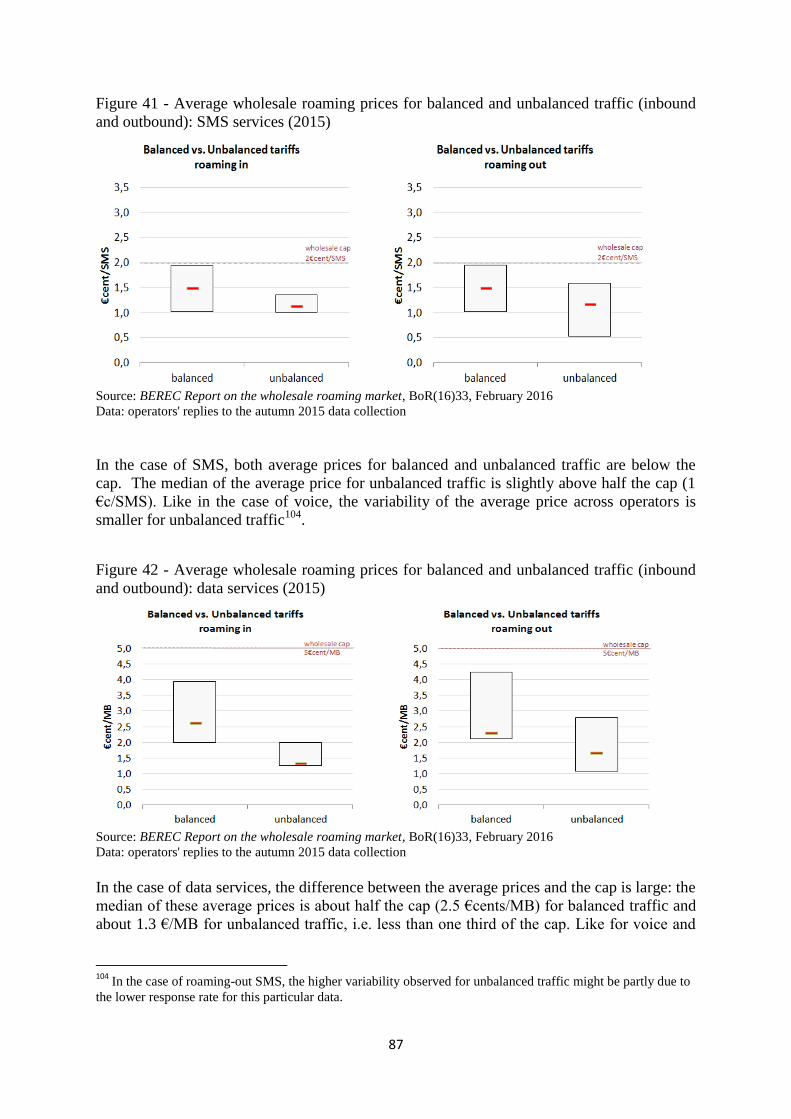
87
Figure 41 - Average wholesale roaming prices for balanced and unbalanced traffic (inbound
and outbound): SMS services (2015)
Source: BEREC Report on the wholesale roaming market, BoR(16)33, February 2016
Data: operators' replies to the autumn 2015 data collection
In the case of SMS, both average prices for balanced and unbalanced traffic are below the
cap. The median of the average price for unbalanced traffic is slightly above half the cap (1
€c/SMS). Like in the case of voice, the variability of the average price across operators is
smaller for unbalanced traffic104
.
Figure 42 - Average wholesale roaming prices for balanced and unbalanced traffic (inbound
and outbound): data services (2015)
Source: BEREC Report on the wholesale roaming market, BoR(16)33, February 2016
Data: operators' replies to the autumn 2015 data collection
In the case of data services, the difference between the average prices and the cap is large: the
median of these average prices is about half the cap (2.5 €cents/MB) for balanced traffic and
about 1.3 €/MB for unbalanced traffic, i.e. less than one third of the cap. Like for voice and
104
In the case of roaming-out SMS, the higher variability observed for unbalanced traffic might be partly due to
the lower response rate for this particular data.

88
SMS, the variability of the average prices across operators is smaller for unbalanced traffic
than for balanced traffic.
The general pattern observed for the three services is that for balanced traffic MNOs usually
agree to mutually charge each other a higher price than for unbalanced traffic.
Since the number of minutes, (or SMS or MB) of balanced traffic is the same for both
operators, and the price is the same for both operators, this price can be considered altogether
irrelevant – the flow of payments in one direction (from operator A to operator B) is netted
off by the flow of payments in the opposite direction (from operator B to operator A).105
Operators have therefore limited incentives to negotiate a lower price for that part of the
traffic.
In contrast, the price for the unbalanced traffic matters as this part of the traffic is paid by
only one MNO to the other. For this part of the traffic, the interests of the MNOs in the
negotiation are therefore not aligned: the MNO that expects to sell more traffic (i.e. the net-
receiver of roaming traffic) will tend to seek a high rate for excess traffic, whereas the MNO
that expects to buy more minutes (i.e. the net sender of roaming traffic) will tend to seek a
low rate.106
It results from the above that price negotiation in wholesale roaming agreements is mostly
about the unbalanced part of the traffic. The price for balanced traffic is by definition never
paid, in the sense that it cannot lead to a payment deficit; only the rate for unbalanced traffic
can lead to a payment deficit. For this reason, it can be considered that the lower, negotiated
price for unbalanced traffic is the one that sets an effective lower bound on wholesale
roaming prices.107
6.5. Degree of competition in national wholesale roaming markets
It has traditionally been assumed that the incentives as regards wholesale roaming pricing are
aligned with the specific position of the MNO as a net-receiver or net-sender of traffic.
According to this view, mobile operators which are net-senders of traffic and net out-payers
(e.g. in Northern location), therefore viewing wholesale roaming as a cost rather than a
source of revenue, will have an incentive in setting and seeking low wholesale access prices.
In contrast, net receivers, for whom wholesale roaming prices are a source of revenue, are
likely to favour keeping wholesale rates higher, and might be reluctant to enter into
alliances.108
6.5.1. Operators' views of the functioning of the national wholesale roaming
markets
105
WIK-Consult (2010), Study on the Options for addressing Competition Problems in the EU Roaming
Market, SMART 2010/018, December, p. 36. 106
WIK-Consult (2010), Study on the Options for addressing Competition Problems in the EU Roaming
Market, SMART 2010/018, December, p. 36. 107
WIK-Consult (2010), Study on the Options for addressing Competition Problems in the EU Roaming
Market, SMART 2010/018, December, p. 38. 108
WIK-Consult (2010), Study on the Options for addressing Competition Problems in the EU Roaming
Market, SMART 2010/018, December, p. 34.

89
The responses to the public consultation shows that mobile operators are split as regards their
view of the functioning of national wholesale roaming markets currently: 50% of MNOs
replied that they are well functioning for voice, SMS and data, and another 6% that they are
well functioning for voice and SMS only. 75% of MNOs are able to negotiate prices well
below the cap for voice, 62.5% for SMS and 97% for data. MVNOs claim they never get
prices well below the caps.
Only 10% of MNOs and MVNOs combined do not steer traffic over one or more networks in
the visited country. MVNOs in particular say they have no incentive to steer traffic since they
get a unique price from visited networks. 61% of the operators which steer traffic steer all
traffic, and 39% steer only a fraction. However, most of the latter specify that they steer a
very large part of their traffic (typically 95%), claiming that there is always a residual traffic
that cannot be steered (coverage, capacity).
There is a Sender/Receiver divide among MNOs (i.e. incumbent/operators with large
footprint vs smaller operators, operators with large inbound vs large outbound roaming
traffic) in the appreciation of the functioning of national wholesale roaming markets:
operators sending out more roaming traffic and/or with smaller roaming volumes to offer find
the wholesale roaming market not properly functioning (smaller operators, MVNOs, large
outbound operators), while operators receiving more roaming traffic and/or with large
roaming volumes to offer (incumbents/operators with large footprint, large inbound
operators) find it properly functioning. All MVNOs find the market not properly functioning.
Operators that consider the national wholesale roaming markets as well-functioning 'function
well' mainly argue that:
Regulated wholesale caps serve as references from which operators commercially
negotiate the prices;
Actual negotiated prices are below regulated caps and have decreased continuously in
between two successive cap changes;
The visiting operator can choose between several operators in the visited country and
steer traffic to its chosen partner(s) only;
Continuous and expected growth of retail roaming volumes increases the competition
among visited operators in a country in order to obtain those volumes (and the related
revenues) on their own networks;
Because they only have roaming-out wholesale volumes to buy and cannot offer
roaming-in wholesale traffic in return, full MVNOs are in a good negotiation position,
as visited operators compete with each other to offer their best prices to get this net
traffic on their network and the corresponding additional revenue;
There are already true RLAH offers on the market which shows that the wholesale
roaming markets currently enable RLAH already.
Operators that consider the national wholesale roaming markets as not well-functioning
mainly argue that:
Prices obtained by some market players (MVNOs, smaller operators not part of a
group) are at or close to cap level;
Prices are much higher than the costs;
Prices are much higher than domestic wholesale MVNO access prices, which are
unregulated; this shows that MNOs do not compete for MVNO roaming traffic, while
they do compete for MVNO domestic traffic;

90
Prices are much higher than domestic retail prices;
Even if there are several operators to choose from in each national market, the visiting
operator is dependent on certain operators (coverage, capacity), which in practice
limits the bargaining power of the visiting operator and hence competition on the
visited market;
There are structural differences in negotiation positions of different market players:
o Operators in travel surplus countries attract inbound roamers anyway and do
not need to decrease prices; they seek to maximise their inbound roaming
revenues; in these countries, all network operators have a common interest in
keeping wholesale rates at a high level;
o Discount rates from the cap depend on roaming volumes, so that smaller
operators and MVNOs, which send less traffic than bigger MNOs, benefit
from no or very limited discount rates;
o For coverage and quality of service reasons, the visiting operator may have to
negotiate roaming agreements with several operators in a given visited
countries, which reduces its roaming volume commitments to each visited
network, and thereby reduces its ability to negotiate discount rates; in addition,
for the same reasons of coverage and quality of service, there is always a
residual part of the roaming traffic that the visiting operator cannot steer to the
visited network(s) with which it has a wholesale roaming discounted rates;
o Large groups with significant footprints in several countries can take
advantage of the imbalance in European roaming; they have stronger
negotiation power against smaller groups or individual operators;
MVNOs are unilateral buyers, as they cannot host any inbound roaming, hence they
do not have any traffic to trade;
As shown by the much higher international non-EU wholesale roaming prices, the
market needs caps to deliver lower prices, which implies that the market is not well-
functioning by itself but is structurally not well-functioning.
It is interesting to note that although voice and SMS prices are closer to the cap than data
prices are, voice and SMS markets are judged well-functioning by slightly more operators
than data. This may be an indication that these operators are of the view that voice and SMS
prices are approaching a (cost) floor. These operators are also of the view that, although data
prices are usually well below the cap (a sign of competition dynamics), there is still large
room for further decrease while remaining above costs, a sign of lack of competition on this
market.
For most operators, the functioning of the market does not depend on the Member State.
According to most operators what matters are the relative positions and bargaining powers of
the two operators in roaming negotiations, more than the visited country itself. However,
many operators also argue that the relative bargaining power of two operators heavily
depends on geographical features that structurally make some countries large inbound
countries while others are large outbound countries.
NRAs and governments express views similar to those of the operators of their countries.
Large inbound roaming countries see national wholesale roaming markets as well-
functioning, while large outbound roaming countries are of the opposite view.
As regards consumers and their associations, they are cautious in expressing views on
wholesale roaming markets since they do not face these markets directly. More than half and
up to 72% of consumers and up to 6 out of 7 consumers' associations do not express views
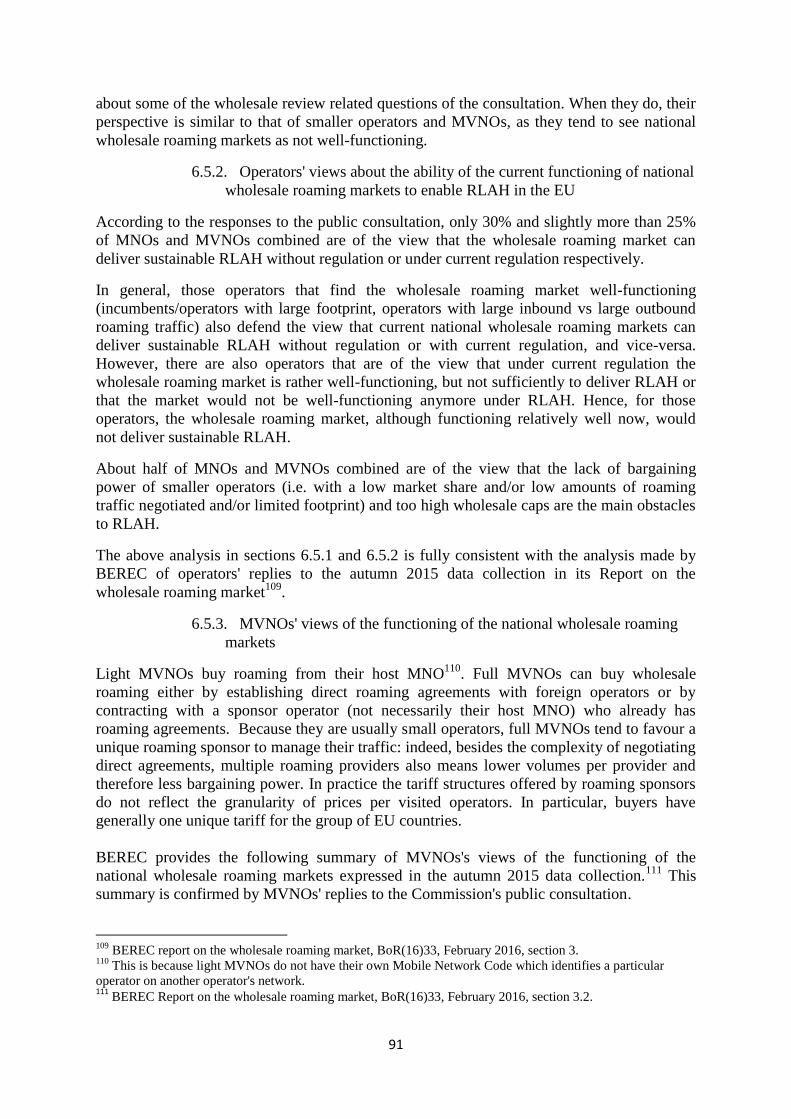
91
about some of the wholesale review related questions of the consultation. When they do, their
perspective is similar to that of smaller operators and MVNOs, as they tend to see national
wholesale roaming markets as not well-functioning.
6.5.2. Operators' views about the ability of the current functioning of national
wholesale roaming markets to enable RLAH in the EU
According to the responses to the public consultation, only 30% and slightly more than 25%
of MNOs and MVNOs combined are of the view that the wholesale roaming market can
deliver sustainable RLAH without regulation or under current regulation respectively.
In general, those operators that find the wholesale roaming market well-functioning
(incumbents/operators with large footprint, operators with large inbound vs large outbound
roaming traffic) also defend the view that current national wholesale roaming markets can
deliver sustainable RLAH without regulation or with current regulation, and vice-versa.
However, there are also operators that are of the view that under current regulation the
wholesale roaming market is rather well-functioning, but not sufficiently to deliver RLAH or
that the market would not be well-functioning anymore under RLAH. Hence, for those
operators, the wholesale roaming market, although functioning relatively well now, would
not deliver sustainable RLAH.
About half of MNOs and MVNOs combined are of the view that the lack of bargaining
power of smaller operators (i.e. with a low market share and/or low amounts of roaming
traffic negotiated and/or limited footprint) and too high wholesale caps are the main obstacles
to RLAH.
The above analysis in sections 6.5.1 and 6.5.2 is fully consistent with the analysis made by
BEREC of operators' replies to the autumn 2015 data collection in its Report on the
wholesale roaming market109
.
6.5.3. MVNOs' views of the functioning of the national wholesale roaming
markets
Light MVNOs buy roaming from their host MNO110
. Full MVNOs can buy wholesale
roaming either by establishing direct roaming agreements with foreign operators or by
contracting with a sponsor operator (not necessarily their host MNO) who already has
roaming agreements. Because they are usually small operators, full MVNOs tend to favour a
unique roaming sponsor to manage their traffic: indeed, besides the complexity of negotiating
direct agreements, multiple roaming providers also means lower volumes per provider and
therefore less bargaining power. In practice the tariff structures offered by roaming sponsors
do not reflect the granularity of prices per visited operators. In particular, buyers have
generally one unique tariff for the group of EU countries.
BEREC provides the following summary of MVNOs's views of the functioning of the
national wholesale roaming markets expressed in the autumn 2015 data collection.111
This
summary is confirmed by MVNOs' replies to the Commission's public consultation.
109
BEREC report on the wholesale roaming market, BoR(16)33, February 2016, section 3. 110
This is because light MVNOs do not have their own Mobile Network Code which identifies a particular
operator on another operator's network. 111
BEREC Report on the wholesale roaming market, BoR(16)33, February 2016, section 3.2.

92
Full and light MVNOs report that they have access to the wholesale roaming market at the
level of the current wholesale roaming caps. They therefore do not benefit from the lower
wholesale roaming prices observed on the current wholesale roaming markets. In addition,
MVNOs most often buy from the MNO providing them with roaming services the different
services necessary to comply with the retail roaming obligations set in Roaming Regulation
III (e.g. bill shock measure, welcome SMS). The prices for these services are not covered by
the wholesale roaming caps. These services therefore have to be paid by the MVNO to the
host MNO in addition to the capped wholesale roaming price. As a result, in practice
MVNOs often pay higher wholesale roaming prices than the wholesale roaming caps. A
minority of MNOs offer all services needed to comply with Roaming Regulation III at the
level of current wholesale roaming caps.
MVNOs with a dual IMSI platform who are member of a group are usually in a more
favourable situation as the group can bundle their individual volumes and therefore has
buying power to enjoy the benefits of the lower wholesale roaming tariffs in the market.
6.5.4. Wholesale roaming prices vs wholesale and retail domestic prices and
underlying costs
Domestic unit prices at retail and wholesale level are expected to be above the costs of
providing the domestic wholesale service.
Domestic retail prices
Deriving domestic retail prices per service implies some assumption about the allocation of
the domestic bundle prices to the three services (voice, SMS, data) usually including in
domestic bundles.
As shown in Table 7 in section 5, based on a recent Commission study on mobile broadband
prices112
, retail domestic prices for voice vary considerably across countries, from less than 2
€c/min to more than 9 €c/min, depending on the allocation method considered.
Retail domestic prices for data in the least expensive domestic bundles are mostly between 1
€c/MB and 2 €c/MB. As to retail domestic data prices in the least expensive data-only
domestic tariff plans of 5 GB and 10 GB for laptops and tablets, they are always below 1
€c/MB in all countries.113
However, the latter prices are likely to include certain assumptions
about customers' actual use of the full data package, so effective aggregate unit prices may be
higher.
Retail domestic prices for SMS in bundles are mostly between 0.8 €c/SMS and 2 €c/SMS.
However, since more and more domestic bundles include unlimited SMS, the actual unit
price of SMS entirely depends on the actual consumption of the subscriber.
Domestic wholesale prices
112
European Commission, Mobile Broadband Prices (prices from February 2015), study conducted by van Dijk
Management Consultants, March 2016: https://ec.europa.eu/digital-single-market/en/news/mobile-broadband-
prices-february-2015 113
Ibid.
93
According to information provided by MVNOs to the Commission, domestic wholesale
prices for data are usually below 0.8 €c/MB on national wholesale markets and may be as
low as0.1 €c/MB.
For voice, the domestic wholesale prices are usually below 1 €c/min for call origination. For
a direct comparison to wholesale roaming caps, termination and transit costs need to be added
to origination. Adding transit costs and an allocation for the termination rate that the visited
network operator needs to pay the terminating network operator for terminating a call on its
network, as discussed in sections 5.6 and 5.5 respectively, gives a total below 2.4 €c/minute.
As to SMS, 0.2-0.3 €c/SMS is commonly observed on national wholesale markets. The
sample of prices provided to the Commission is however limited and relates to countries
which are not at the higher end of the TERA Consultants' cost estimates.
Estimated wholesale roaming costs
Wholesale roaming costs estimated in TERA Consultants' cost model for voice (including re-
allocation of joint and common costs of incoming calls, roaming specific costs, seasonality,
and transit costs) is at 4.2 €c/minute in Malta, 3.2 €c/minute in Sweden, and below 3
€c/minute in all other Member States and Norway (see Table 10 in section 5). Based on an
alternative method using the national effective MTR as an estimate of origination costs114
, the
highest cost estimates are below 4 €c/minute for all countries.
For data, wholesale roaming costs estimated in TERA Consultants' cost model (including
roaming-specific costs) and including transit costs to be borne by the visited operator are
below 0.67 €c/MB in all Member States and Norway.
Wholesale roaming market prices
As shown in section 3.2, in the third quarter of 2015, according to BEREC's last Benchmark
Report on roaming115
, the EEA average wholesale prices for intra-EEA roaming voice, SMS
and data services were respectively:
3.6 €c/minute (minimum = 2.1 €c/minute in Portugal, maximum = 5 €c/minute in
Malta),
1.2 €c/SMS (minimum = 0.8 €c/SMS in Portugal, maximum = 1.8 €c/SMS in Cyprus,
Finland, Iceland, Latvia, Lithuania),
1.7 €c/MB (minimum = 1.0 €c/MB in Portugal, maximum = 4.4 €c/MB in Malta).
Section 6.4.4 shows that average prices for wholesale roaming unbalanced traffic range
from:
2.7 to 3.9 €c/min for voice (median at 3.7 €c/min),
from 1 to 1.4 €c/SMS (median at 1.1 €c/SMS),
from 1 to 1.9 €c/MB for data (median at 1.3 €c/MB)
114
And using TERA's estimates of average common costs, average roaming-specific costs and country
seasonality effect, as well as the same transit cost estimate as in the first method. 115
International roaming BEREC Benchmark Data Report April – September 2015, BoR(16)28, February 2016

94
according to the data provided by operators in the autumn 2015 data collection. Standard
deviations of these prices are relatively small for voice and SMS (0.32 and 0.12 respectively),
larger for data (0.6).
Wholesale roaming prices for SMS and data are therefore above cost estimates as they can be
inferred from the cost model and domestic wholesale prices. For voice, wholesale roaming
prices are closer to the cost estimates.
6.5.5. Presence of pan-European mobile operators
Nine operators in the EEA provide mobile services in three or more EEA countries. Their
respective footprints are shown in Table 12. As shown in section 6.5.6, these group operators
have the possibility and the ability to steer roaming traffic on the networks of their affiliates
in the countries where they are present, thereby internalising wholesale roaming costs and
reducing their wholesale roaming out-payments to other operators. In addition, the group
operators are usually able to negotiate better wholesale roaming prices with other operators,
as they usually negotiate at the group level, thereby benefiting from higher volume
commitments. The different affiliates of a group can then benefit from the wholesale roaming
prices obtained by that group.

95
Table 12 - Presence of pan-European mobile operators BE BG CZ DK DE EE IE EL ES FR HR IT LV LT LU HU MT NL AT PL PT RO SI SK FI SE UK NO LI IS
Deutsche Telekom
x x x x x x x x x x
Hutchison Europe
x x x x x x
Orange x x x x x x x x
Tele2 x x x x x x x x
Telefonica x x x
Telekom Austria Group
x x x x
Telenor x x x x x
TeliaSonera x x x x x x x x
Vodafone x x x x x x x x x x x x
Sources: Company annual reports 2014 (2015 for Vodafone) – 11 January 2016

96
6.5.6. Inside vs outside group roaming
6.5.6.1. Steering roaming traffic inside the group
Operators with a presence in different countries steer the roaming traffic of their roaming
customers (outbound roaming traffic) on their own network (inside group traffic or on-net
roaming traffic) (Figure 43 to Figure 45). For voice and SMS, when an operator owns a
network in the destination country, the ratio between on-net and off-net roaming traffic in
that destination country is respectively above 9 and 7 in 80% of the cases (i.e. below 9 and 7
in 20% of the cases). This means that when an operator owns a network in a destination
country, in 80% of the cases it steers 9 times more of its outbound roaming voice traffic on its
own network than on another network in that destination country. This on-net/off-net ratio
can go above 100 for the top 20% of the cases as shown in Figure 43 and Figure 44. For data,
the ratio is even higher: above 17 for 80% of the cases and goes beyond 100 for the top 40%
of the cases.
For all three services, this ratio has markedly increased between 2013 and 2015, showing an
increase in intra-group traffic steering over the last years. This is likely to reflect an increase
in geographical coverage of the operators in destination countries where they are present and
possibly some acquisitions. Such high on-net/off-net ratios show that only residual roaming
traffic is hosted by a roaming partner when an operator owns a network in the destination
country. The size of this residual off-net roaming traffic depends on the coverage of the
operator's network in the destination country.
Figure 43 – Ratio inside group over outside group roaming volumes per operator and
destination country (voice - outbound roaming traffic)
Data: operators' replies to the autumn 2015 data collection
JRC's calculations

97
Figure 44 - Ratio inside group over outside group roaming volumes per operator and
destination country (SMS - outbound roaming traffic)
Data: operators' replies to the autumn 2015 data collection
JRC's calculations
Figure 45 - Ratio inside group over outside group roaming volumes per operator and
destination country (data - outbound roaming traffic)
Data: operators' replies to the autumn 2015 data collection
JRC's calculations

98
6.5.6.2. Inside vs outside group wholesale roaming
prices
Operators with a presence in different countries charge the wholesale roaming traffic of their
roaming customers (outbound roaming traffic) at a lower price on their own network (inside
group traffic or on-net roaming traffic) than the price they have to pay to other networks of
the same destination (visited) country.
This is confirmed by the operators' data shown in Figure 46 to Figure 48. These figures show,
for each service, the ratio between the effective wholesale roaming unit price
(payments/revenues) inside the group and outside the group. A ratio below 1 indicates a
smaller price inside the group than outside the group.
Figure 46 – Ratio between inside group and outside group wholesale roaming unit prices per
operator and destination country (voice - outbound roaming traffic)
Data: operators' replies to the autumn 2015 data collection
JRC's calculations

99
Figure 47 - Ratio between inside group and outside group wholesale roaming unit prices per
operator and destination country (SMS - outbound roaming traffic)
Data: operators' replies to the autumn 2015 data collection
JRC's calculations
Figure 48 Ratio between inside group and outside group wholesale roaming unit prices per
operator and destination country (data - outbound roaming traffic)
Data: operators' replies to the autumn 2015 data collection
JRC's calculations

100
For voice and SMS, the ratio between inside group and outside group wholesale roaming
prices homogeneously ranges from 0 to 1, with a median at 0.6 for voice in the first semester
2015 (0.5 for SMS), across operators and destination countries with on-net (inside group)
traffic. In other words, in half of the operator-destination country pairs, wholesale roaming
prices for voice are more than 1.7 (twice for SMS) cheaper inside group than outside group;
and in the other half of the cases they are less than 1.7 (twice for SMS) cheaper. One can note
than in 10% of the cases, the inside group price is higher than outside group (ratio above 1)
bot for SMS and data.
For data the median is at 0.2. The inside group discount on data is therefore much larger than
on voice and SMS: for data, in half of the cases, the inside group wholesale roaming price is
more than 5 times cheaper than the outside group wholesale roaming price. For data there is
no case where the price is higher inside group than outside group.
Finally, the ratio between inside and outside group prices has increased since 2013 for voice
and data. This reflects decreasing outside group prices following the reductions in wholesale
roaming caps in July 2013 and July 2014.
6.5.7. Competitive situation of operators with limited geographic scope
In the system of bilateral negotiations summarised above, operators with limited geographic
scope (e.g. present in one country) structurally face a number of challenges as they tend to
have:
no possibility to internalise roaming costs while operators with a footprint in several
countries may internalise those costs in their countries of operation (see section 6.5.6
above).
higher unit costs of bilateral negotiations and contract management: operators with
limited geographic scope tend to be smaller in size and thus do not benefit to the same
extent from economies of scale because, as shown by the cost analysis in section 5,
the costs of bilateral negotiations and contract management are overall approximately
the same for larger and smaller operators116
less favourable discounted prices due to smaller volume commitments: smaller
operators are not able to secure as beneficial discounts as larger operators because
discounts are highly influenced by the amount of outbound traffic that can be
committed. This is the object of the analysis below.
In addition, as they may also not be able to secure discount agreements with several operators
in some visited countries (lack of resources, insufficient volume commitments to be split on
several networks), smaller operators may more often have their roaming traffic hosted on
networks with which no bilateral agreement have been passed and where the price cap is
therefore automatically applied.
Due to the anonymity of the data collected in the autumn 2015, it is not possible to analyse
any relationship between wholesale roaming prices and the actual geographical scope of
116
Consistent with the finding of TERA Consultants, WIK-Consult (2010), Study on the Options for addressing
Competition Problems in the EU Roaming Market, SMART 2010/018, December, p. 22, also found that
bilateral negotiations and contract management costs are similar for larger and smaller operators.

101
operators. As a proxy, it was used the number of subscribers to account for the size of the
operators, as several of the group operators have a large domestic customer base.
Figure 49 to Figure 51 show, for each service, the relationship between the size of the
operator, expressed in number of subscribers, and the average wholesale roaming price for
unbalanced traffic paid by that operator for outbound roaming traffic. It should be noted that
operators are looked at on a per-country basis, which means per subsidiary for the multi-
country groups.
Figure 49 – Average wholesale roaming price for unbalanced traffic vs operator size (voice -
outbound traffic)

102
Figure 50 – Average wholesale roaming price for unbalanced traffic vs operator size (SMS -
outbound traffic)
Figure 51 – Average wholesale roaming price for unbalanced traffic vs operator size (data -
outbound traffic)
Data: operators' replies to the autumn 2015 data collection
JRC's calculations

103
The average wholesale roaming price paid for unbalanced outbound traffic tends to be lower
for larger operators than for smaller operators. This negative correlation between average
price and size is more marked for data. While some of the smaller operators may on average
obtain comparable prices to larger operators, there is no large operator with high average
prices. In addition, several of the smaller operators benefitting from average prices in the
same price range as larger operators (e.g. below 0.025 €c/MB) are affiliates of larger groups
which provided consolidated group average prices for their different affiliates, while the
number of subscribers reported is that of the country affiliate itself. Smaller independent
operators and MVNOs are mostly represented by the dots in the upper left part of the graphs
above, which shows that the operators are subject to higher wholesale roaming prices for
unbalanced traffic on average.
Figure 52 shows the average difference between the effective wholesale roaming unit price
for data paid by the operator to an EEA country117
and the unit price received from the
operator from that EEA country118
(outside group). This average difference between the
effective unit price paid and received for data is represented against the size of the operator,
expressed in terms of number of subscribers. For all larger operators, the difference is null,
which indicates that larger operators effectively pay the same price to their partners for
outbound roaming as they receive from them for inbound roaming. This is also the case for
most of the smaller operators. However, some of the smaller operators do experience
effective higher prices to be paid than received. For voice and SMS, the difference between
prices paid and received is about zero for all operators (see Figure 53 and Figure 54 in Annex
2).
Figure 52 - Difference between effective unit prices (payments/volumes) paid and received
(data - outside group traffic)
Data: operators' replies to the autumn 2015 data collection
117 Total wholesale roaming payments of the operator to country A / total wholesale roaming volumes sent by
the operator to country A 118
Total wholesale roaming charges received by the operator from country A / total wholesale roaming volumes
received by the operator from country A

104
JRC's calculations
Altogether, the data shown in the figures above indicate higher wholesale roaming prices paid
by smaller independent MNOs than group MNOs.
6.6. Conclusions
In this section, different types of information have been used to assess the competitive
dynamics under current regulation: a description of roaming traffic flows in the EU plus
Norway, a description of wholesale roaming agreements between operators and the different
pricing models used, the description and assessment of the functioning of wholesale roaming
markets by operators, different sources of effective wholesale roaming prices compared to
cost estimates and to domestic wholesale and retail prices.
The analysis shows that, due to a number of identified market failures (oligopolistic character
of national wholesale markets, bilateral nature of roaming agreements, imperfect wholesale
roaming substitutes, exclusion of MVNOs from wholesale roaming markets), wholesale
roaming markets under current regulation continue to not function correctly despite some
competitive dynamics.
The different sources of wholesale roaming prices that are available and have been
considered119
show that:
i) average wholesale roaming prices have remained below successive regulated caps
for all three services over the last years. This is a sign of competition dynamics in
the three markets. The gap between the cap and market prices is particularly high
and continuously growing for data.
ii) wholesale prices for balanced roaming traffic are substantially larger than for
unbalanced roaming traffic; only the prices for unbalanced roaming traffic are the
real focus of bilateral roaming negotiations and subject to competition and one of
the main negotiation drivers in bilateral roaming agreements is the amount of
inbound and outbound traffic that can be balanced between each pair of operators.
iii) considerable difference between intra- and extra-group wholesale prices and the
resulting advantage in providing RLAH services for group operators with
footprint in several countries.
Overall, the comparisons of the sources of wholesale roaming prices with the costs estimates
of the cost model summarized in section 5.9 and with domestic retail and wholesale prices
analysed in section 6.5.4 lead to the same conclusion: wholesale roaming prices remain
appreciably above costs. This is a sign that wholesale roaming markets under current
regulation are not functioning well – wholesale roaming charges are not yet at a level that
reflects underlying costs. The analysis shows that the gap between prices and estimated
underlying costs is likely to be larger for data than for voice.
119
i.e. (i) BEREC Benchmark report's average wholesale roaming prices in the EU and per EEA country per
quarter, and their evolution compared to successive caps; (ii) Autumn 2015 data from operators on their
individual average wholesale roaming prices collected for the purpose of this wholesale roaming review. These
data distinguish between average prices for balanced and unbalanced roaming traffic; (iii) Autumn 2015 data on
operators' effective wholesale roaming prices obtained by dividing wholesale roaming payments by wholesale
roaming volumes. These data allow distinguishing in particular between intra- and extra-group prices.

105
The report also shows that a number of market players, in particular smaller operators with
less traffic volumes and MVNOs, do not generally benefit from lower wholesale roaming
prices than the caps.
7. RLAH IN 2017
In the public consultation, 70% of mobile operators (including MVNOs) anticipate an effect
of retail RLAH obligation on the functioning of the wholesale roaming market. However they
have different and opposite views as to what this effect will be.
Operators note that RLAH will objectively modify two aspects of the bilateral roaming
negotiations between two mobile operators. First it will increase wholesale roaming traffic
due to increased retail roaming demand. Second it will limit one degree of freedom in the
wholesale roaming negotiations, namely a certain capacity of the home (visiting) operator to
influence, via its retail roaming offers, the volume of traffic it will send to the visited
operator: since RLAH will (save in exceptional cases) be an obligation of the home operator,
the latter will have fewer means to restrict or boost the retail roaming demand created by its
customers on the visited operator's network. As explained in the remainder of this section, the
overall impact on wholesale roaming prices of these two new features is ambivalent and may
vary according to the relative situations of the two negotiating operators.
RLAH will increase competition on the wholesale roaming markets
On the one hand, the RLAH-triggered increase in roaming traffic at the wholesale level is
likely to reduce wholesale roaming unit costs due to economies of scale. Since in a given
national market, a number of wholesale roaming providers are potentially in competition to
obtain the increased inbound roaming traffic generated by RLAH from a given visiting
operator, that competition may drive wholesale roaming prices downwards as unit costs
decrease in the country.
RLAH will decrease competition on the wholesale roaming markets
On the other hand, it is also claimed that even if there are several operators to choose from in
each national market, the visiting operator is dependent on certain operators in the visited
country (e.g. for coverage, capacity) and that there are relatively high switching costs for the
provision of wholesale roaming services, which may limit competition on the visited market
in practice. If the visiting operator is small and only brings, under RLAH, small volumes
relative to those brought by larger operators, it might find even less competition in the
provision of wholesale roaming services.
Some operators have also expressed concerns that the visited operator may attempt to recover
part of the lost revenues on their retail roaming side (as home operators) through wholesale
roaming prices. Therefore the willingness of visited operators to provide discounts may
decline. This would imply that RLAH would exert some upward pressure on the wholesale
roaming prices currently observed in the market.
In addition, the retail degree of freedom lost by the home operator implies that, for the visited
operator, the RLAH inbound roaming traffic sent by the home operator will take place
whatever the wholesale roaming price the visited operator imposes on the home operator.
Under RLAH, the home operator may keep a certain capacity to influence the roaming traffic

106
volumes it sends to the visited operator, but it will lose the bargaining power linked to the
current possibility not to provide RLAH at all.
RLAH will have no effect on competition on the wholesale roaming markets
Under the hypothesis that RLAH would have no effect on competition dynamics in wholesale
roaming markets and current wholesale roaming prices obtained by the different market
players could be maintained under RLAH, some stakeholders argue that RLAH would
mechanically increase the impact of the wholesale roaming prices discrimination between
market players (i.e. large groups vs smaller operators and MVNOs), as the negative impact of
paying higher wholesale roaming prices will not be mitigated by retail roaming
surcharges/margins and RLAH will increase roaming volumes.
Finally, as increased roaming volumes under RLAH would contribute to reduce unit costs of
providing wholesale roaming services, under this hypothesis of unchanged wholesale
roaming prices, the wholesale roaming margins of the wholesale roaming provider would
increase.
Conclusion
Altogether, it seems that RLAH may intensify both the competitive and anti-competitive
dynamics that may be at work on the wholesale roaming market. Increased roaming volumes
under RLAH may contribute to strengthen competition for those volumes between wholesale
roaming providers in the visited market. At the same time, by increasing roaming volumes
considerably and associating them to certain obligations for the home (visiting) operator,
RLAH could exacerbate and aggravate the structural differences and imbalances in the
relative negotiation positions of market players in bilateral roaming negotiations (North vs
South, large operators with footprint vs smaller operators and MVNOs). RLAH could
therefore strengthen further the negotiation position of net receivers of roaming traffic and
weaken that of net senders, potentially allowing net receivers to reduce discount rates on the
wholesale caps compared to the current situation.
From the above considerations, it is not possible to anticipate with certainty a unique and
unidirectional effect of the retail RLAH obligation on competition on wholesale roaming
markets. It is simply uncertain whether RLAH volumes by themselves will contribute to a
general decrease of wholesale roaming prices of a magnitude that would reduce the cost of
RLAH to an acceptable level, especially for countries where this cost is high in comparison to
domestic revenues. Even if the evolution of new business models and of negotiation
dynamics among operators with the establishment of RLAH is not excluded, the risk that the
negotiation position of the net sender of roaming traffic, including the weaker market players
on wholesale roaming markets, would in fact deteriorate due to the obligation to impose
RLAH cannot be excluded in the absence of countervailing measures.
8. CONCLUSIONS
This report provides an analysis of competition in retail and wholesale roaming markets in
the EU, from which the following conclusions can be drawn.
With specific regard to the developments of retail roaming markets, the conclusions in
Section 4.7 indicate that there have been some important developments recently, with
domestic offers proposing more and more affordable roaming prices to the customers.
However, most of the new, RLAH-like, retail roaming offers are not RLAH offers in the

107
sense of the Roaming Regulation, i.e. covering the full of the EU for no additional surcharge
at all (no add-on) within fair-use limits. In addition, some Member States have experienced
much less of these developments than others. With the current levels of competition in
wholesale roaming markets, therefore, the retail markets have not been capable of delivering
full EU-wide RLAH.
Regarding the wholesale roaming market in the EU, the report looked at different types of
information in order to assess the competitive dynamics under current regulation: a
description of roaming traffic flows in the EU plus Norway, a description of wholesale
roaming agreements between operators and the different pricing models used, the description
and assessment of the functioning of wholesale roaming markets by operators, different
sources of effective wholesale roaming prices compared to cost estimates and to domestic
wholesale and retail prices.
The analysis shows that, due to a number of identified market failures (oligopolistic character
of national wholesale markets, bilateral nature of roaming agreements, imperfect wholesale
roaming substitutes, exclusion of MVNOs from wholesale roaming markets), wholesale
roaming markets under current regulation continue to not function correctly despite some
competitive dynamics.
Overall, the comparisons of the sources of wholesale roaming prices with the costs estimates
of the cost model and with domestic retail and wholesale prices lead to the same conclusion:
wholesale roaming prices remain appreciably above costs. This is a sign that wholesale
roaming markets are not functioning well – wholesale roaming charges are not yet at a level
that reflects underlying costs. The analysis shows that the gap between prices and estimated
underlying costs is likely to be larger for data than for voice. The report also shows that a
number of market players, in particular smaller operators with less traffic volumes and
MVNOs, do not generally benefit from lower wholesale roaming prices than the caps.
In June 2017 Regulation 2120/2015 foresees the entry into force of the RLAH obligation,
subject to outcome of the review of wholesale roaming markets, while in the meantime
during the transition period the possibility to impose roaming surcharges on top of domestic
retail price equal to the wholesale roaming cap (s.c. RLAH+) ensures full recovery of all
wholesale costs incurred when providing roaming. The applicability of the full RLAH
regime, therefore, depends on the outcomes of the wholesale roaming review and the
adoption by co-legislators of measures proposed by the Commission and considered
appropriate in view of the functioning of wholesale roaming market and the objective to
enable RLAH across the Union. In the absence of adoption of these measures the current
transition regime will continue to apply, entailing on the one hand that a) cost recovery for
both the visited operator (since existing wholesale roaming caps would remain and they
ensure cost recovery) as well as for the visiting operator (since the retail roaming surcharge
will allow to recover any wholesale roaming costs, plus a potential margin in the event of real
wholesale roaming prices below the cap level) is ensured but, on the other hand b) that the
objective laid down in Regulation 2015/2120 (i.e. RLAH) will not be achieved.
If, on the contrary, any measure proposed by the Commission as a consequence of the
analysis of the wholesale roaming market is adopted, and RLAH enters into force, section 7
concludes that the future retail RLAH obligation cannot be predicted per se to substantially
increase competition on wholesale roaming markets and solve the observed market failures.
The opposite situation cannot in fact be completely excluded. RLAH may lead to less

108
competition at wholesale level, with in particular a weaker position of market players not
benefiting from lower prices and of net senders of roaming traffic, compared to the current
situation.
In conclusion, further regulation of the wholesale roaming market in the EU is necessary in
order to enable RLAH in 2017. The accompanying impact assessment seeks to determine the
best option for doing so.

109
BIBLIOGRAPHY
Alkatheeri, S. (2013). The Economics of Mobile International Roaming. Doctoral
Dissertation. University of East Anglia School of Economics.
Ambjornsen, T., et al. (2011). Customer Ignorance, Price-cap Regulation, and Rent-seeking
in Mobile Roaming. In Information Economics and Policy.
Buhler, B. (2009). Do International Roaming Alliances Harm Consumers? In Institutions and
Markets Series (ed. Fausto Panunzi).
BEREC. (2010). International Mobile Roaming Regulation. (BoR(10)58).
BEREC. (2012). Analysis of Wholesale Roaming Costs. (BoR(12)14).
BEREC (2014). Analysis of the impacts of "Roam Like At Home. (BoR(14)209)
BEREC. (2015). The implementation of the Termination Rate Recommendation. (BoR (15)
209).
BEREC. (2015). Draft Report on Transparency and Comparability of International Roaming
Tariffs. (BoR (15) 192).
BEREC. (2016). International roaming BEREC Benchmark Data Report April – September
2015. (BoR(16)28).
BEREC. (2016). BEREC Report on the wholesale roaming market. (BoR(16)33).
CMT. (2009). Report on the Analysis of the International Roaming Service in the Spanish
Mobile Telephone Market. Comision del Mercado de las Telecomunicaciones.
Dominguez Lacasa & Javier. (2011). Competition for Partners: Strategic Games in
Wholesale International Roaming. In 22nd
European Regional Conference of the
International Telecommunications Society.
Eurobarometer. (2007). Roaming. Special Eurobarometer no. 269.
Eurobarometer (2014), E-Communications Household Survey and Telecom Single Market
Survey. Special Eurobarometer no. 414.
Europe Economics. (2008). Review of the Roaming Regulation, Study for the European
Parliament's committee on Internal Market and Consumer Protection.
(IP/A/IMCO/FWC/2006-186 C).
Europe Economics. (2008). Roaming Regulation. Brief for European Parliament.
European Commission. (2006). Impact Assessment of Policy Options in Relation to a
Commission Proposal for a Regulation of the European Parliament and of the Council on
Roaming on Public Mobile Networks Within the Community. (SEC(2006) 926).

110
European Commission. (2011). Commission Staff Working Paper – Impact Assessment of
Policy Options in Relation to the Commission's Review of the Functioning of Regulation EC
No 544/2009 of the European Parliament and of the Council of 18 June 2009 on Roaming on
Public Mobile Telephone Networks within the Community. (SEC(2011) 871).
Falch, M. and Tadayoni, R. (2014). Regulation of International Roaming Data Services with
the EU. In International Economics and Economic Policy.
GSMA. (2008). GSMA Briefing Paper On the Impact Assessment Accompanying the
Proposal for a Regulation of the European Parliament and of the Council Amending
Regulation (EC) No 717/2007 On Roaming on Public Mobile Phone Networks Within the
Community.
Infante, J. and Vallejo, I. (2012). Regulation of International Roaming in the European Union
– Lessons learned. In Telecommunications Policy.
Juniper Research. (2015). Mobile Roaming. Market Trends & Competitive Landscape.
Lupi, P. and Manenti, F. (2008). Traffic Management in Wholesale International Roaming:
Towards a More Efficient Market?. In 2007 Annual Conference of the European Economic
Association , Budapest.
Marcus, J.S. et al. (2013). Structural Solutions and the Evolution of International Mobile
Roaming (IMR) in Europe: Where are We Headed?. Available at SSRN:
http://ssrn.com/abstract=2342637.
OECD. (2012). Methodology for Constructing Wireless Broadband Price Baskets. (OECD
Digital Economy Papers, No. 205).
Ofcom. (2014). Incidence of Unexpectedly High Bills 2014 Report.
Shortall, T. (2010). A Structural Solution to Roaming in Europe. In Robert Schuman Centre
for Advanced Studies.
TERA Consultants. (2016). Assessment of the Cost of Providing Wholesale Roaming Services
in the EU. (SMART 2015/006).
Van Dijk Management Consultants. (2016). Mobile Broadband Prices. (SMART 2014/049).
WIK-Consult. (2010). Study on the Options for addressing Competition Problems in the EU
Roaming Market. (SMART 2010/018).
WIK-Consult. (2013). International Mobile Roaming Policy and Regulatory Actions: Theory
and Practice. In ITU High-Level Workshop on Regulatory and Economic Aspects of Roaming
Geneva, Switzerland; 24 September 2013.
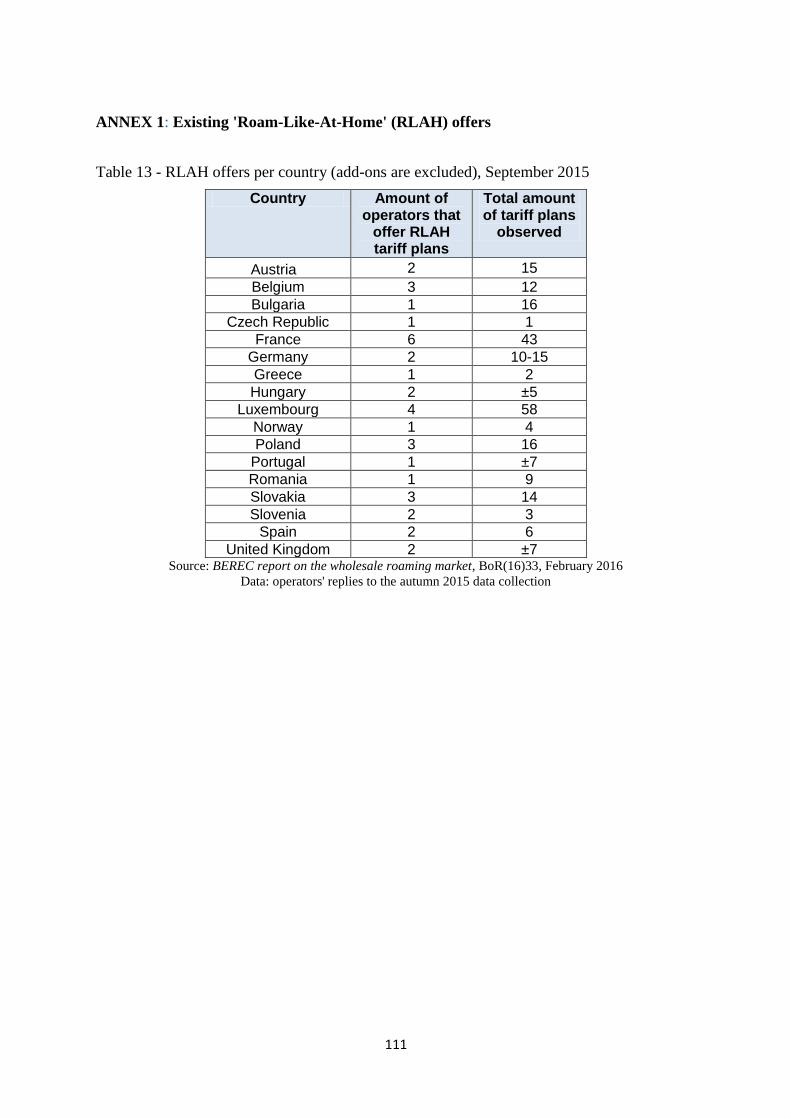
111
ANNEX 1: Existing 'Roam-Like-At-Home' (RLAH) offers
Table 13 - RLAH offers per country (add-ons are excluded), September 2015
Country Amount of operators that
offer RLAH tariff plans
Total amount of tariff plans
observed
Austria
2 15
Belgium 3 12
Bulgaria 1 16
Czech Republic 1 1
France 6 43
Germany 2 10-15
Greece 1 2
Hungary 2 ±5
Luxembourg 4 58
Norway 1 4
Poland 3 16
Portugal 1 ±7
Romania 1 9
Slovakia 3 14
Slovenia 2 3
Spain 2 6
United Kingdom 2 ±7 Source: BEREC report on the wholesale roaming market, BoR(16)33, February 2016
Data: operators' replies to the autumn 2015 data collection

112
ANNEX 2: Wholesale roaming price paid and received
Average difference between the effective wholesale roaming unit price for voice and SMS
paid by the operator to an EEA country and the unit price received from the operator from
that EEA country (outside group prices)
Figure 53 - Difference between effective unit prices paid and received (voice - outside group
traffic)
Figure 54 - Difference between effective unit prices paid and received (SMS - outside group
traffic)
Data: operators' replies to the autumn 2015 data collection
JRC calculations

113
ANNEX 3: Roaming traffic flows between countries
Table 14 - Roaming voice traffic flow between countries in the second semester of 2014120
Country of destination Country of origin
Au
stri
a
Be
lgiu
m
Bu
lgar
ia
Cro
atia
Cyp
rus
Cze
ch R
.
De
nm
ark
Esto
nia
Fin
lan
d
Fran
ce
Ge
rman
y
Gre
ece
Hu
nga
ry
Ice
lan
d
Ire
lan
d
Ital
y
Latv
ia
Lie
chte
nst
ein
Lith
uan
ia
Luxe
mb
ou
rg
Mal
ta
Ne
the
rlan
ds
No
rway
Po
lan
d
Po
rtu
gal
Ro
man
ia
Slo
vaki
a
Slo
ven
ia
Spai
n
Swe
de
n
UK
Austria 0,0% 0,9% 0,7% 4,9% 0,1% 3,0% 0,5% 0,1% 0,3% 3,0% 36,9% 2,0% 6,4% 0,0% 0,5% 18,5% 0,1% 0,7% 0,1% 0,1% 0,2% 2,0% 0,4% 2,3% 0,5% 1,9% 2,3% 2,3% 4,1% 1,1% 3,9%
Belgium 2,1% 0,0% 0,6% 0,4% 0,1% 0,5% 0,5% 0,1% 0,2% 34,1% 9,2% 1,6% 0,6% 0,1% 0,3% 6,4% 0,1% 0,0% 0,1% 4,4% 0,1% 17,6% 0,3% 1,5% 1,9% 0,8% 0,2% 0,1% 11,5% 0,7% 3,8%
Bulgaria 6,1% 4,2% 0,0% 1,2% 0,6% 2,0% 1,2% 0,1% 0,3% 9,8% 19,6% 16,1% 2,9% 0,1% 0,2% 9,2% 0,1% 0,0% 0,1% 0,3% 0,4% 2,9% 0,5% 1,3% 0,4% 5,4% 0,6% 0,8% 5,8% 1,0% 6,9%
Croatia 3,4% 2,7% 0,5% 0,0% 0,5% 1,0% 6,0% 1,4% 7,8% 6,4% 13,3% 2,8% 1,3% 0,2% 0,6% 6,2% 2,5% 0,0% 1,9% 0,2% 0,3% 2,4% 7,2% 4,9% 1,0% 0,5% 0,3% 2,8% 12,5% 3,2% 6,1%
Cyprus 0,0% 0,0% 0,0% 0,0% 0,0% 0,0% 0,0% 0,0% 0,0% 0,0% 0,0% 0,0% 0,0% 0,0% 0,0% 0,0% 0,0% 0,0% 0,0% 0,0% 0,0% 0,0% 0,0% 0,0% 0,0% 0,0% 0,0% 0,0% 0,0% 0,0% 0,0%
Czech Rep. 10,0% 2,4% 1,2% 4,7% 0,2% 0,0% 0,6% 0,1% 0,2% 5,9% 29,5% 2,3% 2,5% 0,1% 0,2% 7,5% 0,1% 0,0% 0,1% 0,2% 0,1% 2,6% 0,6% 4,8% 0,4% 0,9% 14,3% 0,6% 3,6% 0,9% 3,5%
Denmark 2,7% 1,3% 0,3% 0,4% 0,2% 0,7% 0,0% 0,2% 1,3% 6,0% 18,0% 1,5% 0,5% 0,5% 0,6% 4,7% 0,3% 0,0% 0,3% 0,1% 0,2% 2,7% 9,2% 2,1% 0,8% 0,4% 0,1% 0,1% 7,9% 30,0% 7,1%
Estonia 0,0% 0,0% 0,0% 0,0% 0,0% 0,0% 0,0% 0,0% 0,0% 0,0% 0,0% 0,0% 0,0% 0,0% 0,0% 0,0% 0,0% 0,0% 0,0% 0,0% 0,0% 0,0% 0,0% 0,0% 0,0% 0,0% 0,0% 0,0% 0,0% 0,0% 0,0%
Finland 1,6% 1,9% 0,5% 0,7% 0,3% 1,0% 2,6% 15,3% 0,0% 4,5% 10,0% 3,0% 1,1% 0,2% 0,4% 4,1% 1,0% 0,0% 0,6% 0,2% 0,3% 2,4% 3,3% 1,8% 1,5% 0,2% 0,2% 0,2% 16,9% 19,5% 4,8%
France 1,0% 14,8% 0,4% 0,6% 0,1% 0,9% 0,6% 0,1% 0,3% 0,0% 10,2% 2,2% 0,5% 0,1% 1,0% 12,7% 0,1% 0,0% 0,2% 4,0% 0,3% 3,5% 0,5% 2,2% 9,1% 1,8% 0,2% 0,1% 20,1% 1,0% 11,2%
Germany 0,0% 0,0% 0,0% 0,0% 0,0% 0,0% 0,0% 0,0% 0,0% 0,0% 0,0% 0,0% 0,0% 0,0% 0,0% 0,0% 0,0% 0,0% 0,0% 0,0% 0,0% 0,0% 0,0% 0,0% 0,0% 0,0% 0,0% 0,0% 0,0% 0,0% 0,0%
Greece 2,7% 3,5% 8,9% 0,7% 6,5% 1,1% 0,9% 0,1% 0,4% 9,0% 15,7% 0,0% 1,2% 0,3% 0,3% 16,6% 0,1% 0,1% 0,1% 0,3% 0,5% 4,0% 0,6% 1,6% 0,9% 3,6% 0,5% 0,3% 5,1% 1,0% 13,6%
Hungary 22,2% 2,6% 0,5% 2,7% 0,2% 3,0% 0,6% 0,0% 0,2% 5,7% 28,4% 1,8% 0,0% 0,3% 0,0% 7,7% 0,1% 0,0% 0,1% 0,2% 0,2% 2,9% 0,5% 1,8% 0,2% 4,4% 3,5% 1,7% 2,8% 1,1% 4,8%
Iceland 0,0% 0,0% 0,0% 0,0% 0,0% 0,0% 0,0% 0,0% 0,0% 0,0% 0,0% 0,0% 0,0% 0,0% 0,0% 0,0% 0,0% 0,0% 0,0% 0,0% 0,0% 0,0% 0,0% 0,0% 0,0% 0,0% 0,0% 0,0% 0,0% 0,0% 0,0%
Ireland 0,7% 1,2% 0,3% 0,2% 0,1% 0,6% 0,5% 0,1% 0,2% 5,4% 4,2% 0,5% 0,5% 0,0% 0,0% 3,0% 0,3% 0,0% 0,5% 0,1% 0,3% 1,7% 0,3% 2,1% 3,3% 0,3% 0,3% 0,0% 19,6% 0,6% 53,1%
Italy 4,7% 3,1% 0,8% 2,6% 0,1% 1,4% 0,7% 0,1% 0,3% 22,4% 14,9% 4,4% 1,4% 0,1% 0,9% 0,0% 0,1% 0,0% 0,2% 0,4% 1,4% 2,7% 0,5% 2,2% 1,3% 4,6% 0,4% 1,6% 13,9% 0,8% 12,0%
Latvia 2,1% 2,9% 0,5% 1,1% 0,5% 0,9% 6,8% 1,6% 9,0% 6,8% 12,5% 3,1% 0,9% 0,2% 0,6% 4,9% 0,0% 0,0% 2,2% 0,2% 0,3% 2,5% 8,2% 5,5% 1,1% 0,4% 0,2% 0,7% 14,1% 3,6% 6,6%
Liechtenstein 0,0% 0,0% 0,0% 0,0% 0,0% 0,0% 0,0% 0,0% 0,0% 0,0% 0,0% 0,0% 0,0% 0,0% 0,0% 0,0% 0,0% 0,0% 0,0% 0,0% 0,0% 0,0% 0,0% 0,0% 0,0% 0,0% 0,0% 0,0% 0,0% 0,0% 0,0%
Lithuania 2,1% 2,9% 0,5% 1,1% 0,5% 0,9% 6,8% 1,5% 8,9% 6,7% 12,4% 3,1% 0,9% 0,2% 0,6% 4,8% 2,8% 0,0% 0,0% 0,2% 0,3% 2,4% 8,2% 5,5% 1,1% 0,4% 0,2% 0,7% 14,0% 3,6% 6,6%
Luxembourg 2,0% 3,8% 0,3% 0,4% 0,1% 0,6% 0,5% 0,1% 0,3% 35,0% 10,4% 1,6% 0,6% 0,1% 0,4% 6,6% 0,1% 0,0% 0,1% 0,0% 0,1% 16,0% 0,4% 1,3% 2,5% 0,5% 0,2% 0,1% 11,3% 0,7% 4,0%
Malta 2,1% 2,7% 0,8% 0,6% 1,0% 0,8% 0,6% 0,1% 0,3% 6,3% 9,4% 2,0% 1,0% 1,2% 0,3% 33,4% 0,3% 0,0% 0,2% 0,3% 0,0% 2,9% 0,6% 0,9% 0,8% 0,9% 0,3% 0,4% 5,8% 2,0% 22,2%
Netherlands 3,2% 18,2% 0,5% 0,6% 0,1% 0,7% 1,9% 0,2% 1,3% 11,7% 24,9% 1,6% 0,8% 0,2% 0,7% 6,3% 0,4% 0,0% 0,4% 0,5% 0,1% 0,0% 1,8% 2,5% 1,5% 0,9% 0,2% 0,2% 8,7% 1,9% 8,3%
Norway 1,0% 0,9% 0,7% 1,3% 0,6% 0,5% 10,2% 0,5% 1,9% 4,5% 5,7% 3,4% 0,6% 0,4% 0,7% 3,3% 0,6% 0,0% 0,7% 0,0% 0,2% 2,7% 0,0% 3,1% 1,0% 0,3% 0,1% 0,1% 20,7% 25,9% 8,4%
120
The value is in green when the share of roaming voice traffic from the roamers is between 5% and 25%.The value is in red when the share is over 25%.

114
Poland 3,7% 4,4% 0,7% 1,6% 0,1% 3,1% 1,7% 0,2% 0,5% 8,0% 37,5% 1,8% 1,3% 0,1% 0,6% 6,2% 0,3% 0,0% 0,8% 0,2% 0,1% 6,0% 3,5% 0,0% 0,5% 0,6% 2,0% 0,3% 3,5% 3,2% 7,4%
Portugal 0,7% 4,3% 0,2% 0,2% 0,0% 0,5% 0,5% 0,1% 0,2% 30,9% 7,6% 0,4% 0,3% 0,0% 0,6% 3,8% 0,1% 0,0% 0,1% 1,6% 0,1% 2,7% 0,5% 0,7% 0,0% 0,5% 0,1% 0,1% 34,1% 0,5% 8,5%
Romania 7,1% 4,6% 3,1% 0,4% 0,3% 1,4% 1,0% 0,0% 0,1% 10,5% 20,0% 4,0% 6,7% 0,1% 0,1% 11,7% 0,0% 0,0% 0,0% 0,4% 0,1% 2,9% 0,5% 1,1% 0,4% 0,0% 0,5% 1,0% 4,4% 1,4% 15,6%
Slovakia 16,8% 2,0% 0,6% 3,0% 0,1% 32,6% 0,4% 0,0% 0,2% 3,6% 16,9% 0,7% 6,9% 0,0% 0,3% 4,7% 0,0% 0,0% 0,0% 0,1% 0,1% 1,7% 0,5% 2,7% 0,1% 0,5% 0,0% 0,5% 1,5% 0,5% 3,0%
Slovenia 20,0% 1,5% 0,3% 34,9% 0,0% 1,3% 0,3% 0,1% 0,1% 2,9% 14,4% 0,8% 1,6% 0,1% 0,0% 13,6% 0,0% 0,0% 0,0% 0,2% 0,1% 1,3% 0,1% 0,6% 0,3% 0,3% 0,8% 0,0% 1,9% 0,5% 1,7%
Spain 1,2% 3,6% 0,5% 0,3% 0,1% 0,8% 0,6% 0,1% 0,4% 31,6% 12,4% 0,8% 0,6% 0,1% 1,6% 11,7% 0,1% 0,0% 0,1% 0,3% 0,3% 3,2% 0,7% 1,5% 12,1% 1,8% 0,2% 0,2% 0,0% 0,9% 12,5%
Sweden 2,0% 2,1% 0,4% 0,9% 0,6% 0,9% 15,9% 1,0% 6,8% 6,1% 9,9% 2,6% 0,8% 0,3% 0,5% 4,7% 1,5% 0,0% 1,2% 0,2% 0,3% 2,3% 13,3% 3,8% 1,1% 0,3% 0,2% 0,4% 13,8% 0,0% 6,4%
UK 1,8% 2,7% 0,6% 0,5% 1,3% 0,8% 1,4% 0,1% 0,6% 17,7% 8,3% 2,9% 0,8% 3,2% 10,1% 8,8% 0,2% 0,0% 0,3% 0,4% 0,6% 4,6% 1,5% 2,1% 3,5% 0,8% 0,2% 0,1% 21,7% 2,0% 0,0%
Source: BEREC Report on wholesale roaming market, BoR(16)33, February 2016
Data: operators' replies to the autumn 2015 data collection