accounting accruals and stock returns: evidence from ... annual meetings/2012... · 3 1....
TRANSCRIPT
1
Accounting Accruals and Stock Returns:
Evidence from European Equity Markets
Georgios Papanastasopoulos*
Department of Business Administration of the University of Piraeus
E-mail: [email protected]
First Draft: December 13, 2011
* The author thanks Dimitrios Thomakos for insightful comments and suggestions. The usual disclaimer applies.

2
Accounting Accruals and Stock Returns:
Evidence from European Equity Markets
Abstract: In this paper, I show a generalizability of the negative relation of traditional
accruals and percent accruals with future returns in eleven countries of the European
Union. Positive abnormal returns from hedge portfolios on both accrual measures
summarize the economic significance of this generalizability, while the magnitude of
returns is higher for traditional accruals (in contrary with current evidence from the
U.S. capital market). The magnitude of the accrual effect on stock returns based on
both accrual measures is stronger in countries with higher individualism, higher
equity-market development and lower concentration ownership. Equity-market
liquidity has a positive impact only on the accrual effect based on traditional accruals,
while shareholder protection and permission to use accrual accounting have a positive
impact only on the accrual effect based on percent accruals. Nevertheless, legal origin
and earnings opacity do not exhibit a significant influence. Overall, the paper suggests
inability to adjust for potential managerial empire building tendencies and/or
overconfidence & self attribution bias about a firm’s investment opportunities as
underlying driving forces of the accrual anomaly.
Keywords: traditional accruals, percent accruals, stock returns, european equity
markets
JEL Descriptors: M41

3
1. Introduction
The accrual anomaly, first documented by Sloan (1996), refers to the negative
relation between working capital accruals and stock returns. Investors tend to
overestimate accruals when forming earnings expectations and are systematically
surprised when accruals turn out to have low persistence in the future. Further,
Sloan (1996) shows that hedge trading strategies constructed by purchasing low-
accrual firms and selling high-accrual firms generate positive risk-adjusted returns.
Subsequent research in the U.S. capital market, presents extensive evidence on the
robustness of the accrual anomaly, but consensus has not been yet reached on what
causes the accrual anomaly.
Pincus et al. (2007) in a novel paper, investigate the accrual anomaly in an
international setting. They show that accruals’ overweighting occurs outside the
U.S. capital market (Australia, Canada and U.K.), and its occurrence is associated
with specific accounting and institutional factors (legal tradition, shareholder
protection, permission to us accrual accounting and ownership concentration).
Further, they provide some preliminary evidence on the magnitude of the accrual
effect on stock returns throughout the world. Regarding the underlying cause of the
global accrual anomaly, Pincus et al. (2007) conclude that it is driven by earnings
management and barriers to arbitrage.
My motivation in this paper, similarly with other studies documenting
evidence on the generalizability of market anomalies (see for example Fama and
French 1998, McLean et al. 2009, Pincus et al. 2007, Rouwenhorst 1998, Titman et
al. 2011) is to provide evidence about the occurrence and the magnitude of accrual
anomaly worldwide. In particular the objective of the paper is threefold. (1)
4
investigate the possible occurrence and economic significance of the negative
relation between accounting accruals and stock returns; (2) examine whether the
magnitude of accrual effect on stock returns could be linked with important
country-level factors1; (3) distinguish between possible underlying forces of the
accrual anomaly.
My study differs from Pincus et al. (2007), at least in three ways. First, I
consider total accruals scaled by average total assets and total accruals scaled by
absolute earnings as accrual measures in my analysis. Prior research by Richardson
et al. (2005) and Hazfalla (2011) in the U.S. capital market, suggests that the
magnitude of the accrual anomaly based on both measures is substantially higher
than that based on working capital accruals. Second, I examine whether the
magnitude, and not just the occurrence, of the accrual effect on stock returns could
be affected by fundamentals factors of each country. Third, my work is conducted
on a sample of 16 countries of the European Union (EU) prior to its enlargement in
2004 and thus, focuses on a set of countries with developed economies2, high
legal-tradition harmonization3 and high accounting harmonization (see Van Hulle,
2004)4.
The remainder of the paper is organized as follows. Section 2 expands on the
development of the hypotheses and presents the research design; Section 3
1 For convenience, “country” and “market” are used interchangeably in the paper. 2 According to the International Monetary Fund (IMF) all countries of the European Union (EU) prior to the 2004 enlargement are identified as advanced economies. Further, all countries are OECD members. According to International Financial Corporation of the World Bank Group among these countries only Greece and Portugal are characterized as emerging economies, while these countries along with Ireland request a bailout loan package from EU and IMF during the recent financial crisis. 3 European Union prior to the 2004 enlargement consists mainly of code-law countries. Only, Ireland and United Kingdom are common-law countries. Ball et al. (2000) argue that legal-tradition is a very important country-level characteristic in institutional structures. In code law countries, asymmetric information between stakeholders and firm executives is lower than in common law countries and thus, a priori, one could expect a better understanding of the implications of earnings and earnings components for future firm performance (see Pincus et al. 2007). 4 Burgstahler et al. (2006) argue that accounting standards across European Union member states are fairly similar, though not necessarily equal in every respect.

5
provides details about data, sample formation and variable measurement; section 4
critically discusses empirical results. Finally, I offer some concluding remarks in
section 5.
2. Hypothesis Development and Research Design
Sloan (1996) in a seminal paper shows that the accrual component of earnings
is negatively associated with subsequent stock returns. Sloan (1996) interprets his
finding as evidence of investors’ naïve fixation on earnings and failure to
understand the lower persistence of accruals; investors overweight the lower
persistence of accruals and consequently overprice accruals. The negative relation
of accruals with future returns has come to be known as the accrual anomaly. Sloan
(1996) summarizes the economic significance of the accrual anomaly through the
exhibition of positive abnormal returns on hedge trading portfolios consisting of a
long position on firms with low accruals and a short position on firms with high
accruals.
Sloan (1996), examines a sample of NYSE/AMEX firms over the period
1962-1991 and calculates abnormal returns through the CAPM (i.e., one factor
alphas) and a characteristic-based benchmark approach that controls for the risk
premium associated with firm size (i.e., size-adjusted returns). Subsequent research
based on U.S. data, shows that Sloan’s (1996) findings are robust to more recent
sample periods (Lev and Nissim 2006), the inclusion of Nasdaq firms (Lev and
Nissim, 2006) and considerations of additional risk factors (Chan et al. 2006 and
Hirshleifer et al. forthcoming).
6
In all above-mentioned studies, accruals are measured as working capital
accruals scaled by contemporaneous average total assets. Following Healy (1985),
working capital accruals are defined as the change in net working capital (i.e., net
current operating assets) less depreciation expense. However, this measure is
narrow since it ignores long-term accruals (i.e., accruals relating to net noncurrent
operating assets). To address this issue, Richardson et al. (2005) include long-term
accruals to the definition of accruals and find that the extended measure of total
accruals improves the magnitude of size-adjusted returns on accrual-hedge
portfolios by more than 40%.
Recently, Hafzalla et al. (2011) show that a significant improvement on the
performance of accrual-hedge portfolios can be achieved when working capital
accruals or total accruals are scaled by the absolute value of earnings instead of the
mean value of total assets. Hafzalla (2011) label accruals scaled by the average
total assets as “traditional” accrual measures and accruals scaled by the absolute
earnings as “percent” accrual measures, and argue that latter measures reflect more
accurately investors’ misunderstanding of the reverting nature of accruals. In
particular, Hafzalla et al. (2011) provide evidence that the hedge size-adjusted
return on percent total accruals is more than 45% larger to the respective return on
traditional total accruals, while the hedge size-adjusted return on percent working
capital accruals is about 75% larger to the respective return on traditional working
capital accruals.
While, there is extensive evidence on the robustness of the accrual anomaly in
the U.S. capital market, the underlying driving force of the anomaly is far to be
resolved. Several non risk-based, but not mutually exclusive explanations, can be
7
put forward in order to interpret the accrual anomaly.5 The most common line of
thought follows the conjecture of Sloan (1996) that the anomaly arises from
investors’ naïve fixation on earnings and a failure to anticipate the lower
persistence of accruals. In this line, extrapolative biases concerning future growth
(see Bradshaw et al. 2001) and/or inability to adjust for potential earnings
management (see Chan et al. 2006, Dechow and Dichev 2002, Richardson et al.
2005, Xie 2001) can be considered as possible driving forces.
Other studies follow the hypothesis that the anomaly is driven from investors’
misunderstanding of diminishing marginal returns to new investment and/or
overinvestment. In this line, overreaction to past growth can be considered as
underlying driver of the accrual anomaly (see Fairfield et al. 2003 and Zhang
2007). At the same time, inability to adjust for potential managerial empire
building tendencies and/or overconfidence & self attribution bias about a firm’s
investment opportunities can be also considered as possible driving forces (see
Dechow et al. 2008). A third stream of the literature follows Mashruwala et al.
(2006) who hypothesize that it risky and costly for arbitrageurs to find close
substitutes for mispriced stocks and thus, the accrual anomaly can not fully
arbitraged away. In this line, barriers to arbitrage such as high idiosyncratic
volatility, high transaction costs and high stock liquidity can be considered as
possible underlying sources of the accrual anomaly.
Pincus et al. (2007) contributes to the growing literature on the accrual
anomaly, by providing evidence that the market overweights the lower persistence
of working capital accruals on three capital markets outside U.S.: Australia,
Canada and U.K. Notably, Pincus et al. (2007) show an underweighting of accrual 5 The rational (i.e., risk-based) explanation suggests that low-accrual firms are fundamental riskier than high-accrual firms and thus, are priced to yield higher expected returns (see Khan 2006 and Wu et al. 2010)

8
persistence in Germany, Malaysia, Singapore, Spain and Indonesia. They also
show that accruals’ overweighting is more likely to occur in countries with a
common law tradition, higher allowance of accrual accounting and lower
concentration of share ownership. For shareholder protection, an important
characteristic in international studies concerning the generalizability of asset
pricing regularities, findings are controversial: accruals’ overweighting is more
likely to occur in countries with weaker outside shareholder rights and less likely
to occur in countries with stronger legal enforcement.
Further, Pincus et al. (2007) provide out-of-U.S. sample evidence about the
profitability of trading strategies on working capital accruals. Based on regressions
estimated with decile-ranks of accruals6, they show that significantly positive size-
adjusted returns can be earned from an accruals’ overweighting strategy in
Australia, Canada and U.K. They also show that significantly positive size-
adjusted returns can be earned from an accruals’ underweighting strategy in
Indonesia and Singapore. Pincus et al. (2007) conclude that the accrual anomaly
may arise from earnings manipulation and limits to arbitrage.7
Recognizing that the accrual anomaly is not just a freak occurrence in the U.S.
forms my essential motivation to examine the accrual anomaly in european capital
markets setting. The first objective of my research is to investigate the possible
occurrence and economic significance of the negative relation between accounting
accruals and stock returns. In particular, I examine whether total accruals scaled by
6 Desai et al. (2004) and Pincus et al. (2007) argue that under this regression approach, zero-investment portfolios are constructed by taking long (short) in firms within the lowest (highest) decile of accruals. 7 In a recent study, Leippold and Lohre (2012) show that hedge trading portfolios on working capital accruals can generate significantly positive raw returns in Australia and UK, but not in Canada, Indonesia and Singapore. Among these countries, they document significantly positive risk-adjusted alphas from the Fama – French (1993) three-factor model on hedge portfolios only for Australia. Additionally, they show that hedge raw and risk-adjusted alphas are both positive and statistically significant in Hong Kong, Denmark, Germany, Italy, Japan and Switzerland. France exhibit significant raw returns and insignificant alphas, while South Korea and Thailand exhibit the opposite pattern.
9
average total assets (traditional accruals, hereafter) and total accruals scaled by
absolute value of net income (percent accruals, hereafter) are negatively related
with future returns in 16 major european equity markets: Austria, Belgium,
Denmark, Finland, France, Germany, Greece, Ireland, Italy, Netherlands, Norway,
Portugal, Spain, Sweden, Switzerland and the U.K. Then, I assess the return-
performance of portfolios on traditional accruals and percent accruals.
In this way, I extend the work of Pincus et al. (2007) who consider in their
analysis only working capital accruals scaled by average total assets as basic
accrual measure. Based on Richardson et al. (2005), traditional accruals are more
properly defined than working capital accruals in that they incorporate the
investment in net long-term assets. Richardson et al. (2005) using U.S. data,
demonstrate that by using traditional accruals one can obtain larger hedge
abnormal returns than those obtained from working capital accruals. According to
Hafzalla et al. (2011), percent accruals are superior to traditional accruals in
identifying mispriced stocks in that they successfully rank observations that are
more extreme into the extreme portfolios than do traditional accruals. Hafzalla et
al. (2011) provide evidence from the U.S. capital market that percent accruals
produces higher excess returns than traditional accruals. These issues raise
important questions about whether and how traditional and percent accruals are
related with future returns outside the U.S. stock market. Does the negative relation
of traditional and percent accruals with future returns occurs in european capital
countries? Which is the economic effect from this possible relation? The first
testable hypothesis of the paper is as follows:

10
H1: The negative relation of traditional and percent accruals with future
returns can be generalized in european capital markets.
The hypothesis is examined through regressions of future size and book to
market adjusted returns (i.e., abnormal characteristic-adjusted returns) on
traditional and percent accruals, after controlling for size and book to market ratio.
Further, I investigate the magnitude of future raw and abnormal returns generated
from hedge portfolios formed on traditional and percent accruals.
The second objective of the study is examine whether the magnitude of
accrual effect on stock returns could be linked with differences in important
country-level factors. In particular, I consider seven country-level characteristics
that, a priori, could affect differently the magnitude of hedge abnormal returns
earned from traditional and percent accruals. These are: cultural environment,
equity market development, shareholder protection, permission of accrual
accounting, earnings opacity, ownership concentration and limit to arbitrage. My
work differs from that of Pincus et al. (2007) in two ways: First, Pincus et al.
(2007) examines whether the occurrence of accruals’ overweighting is associated
with several country-level characteristics. Second, Pincus et al. (2007) focus on a
set of international stock markets. Instead, I focus on set of european stock markets
that are likely to be developed economies and to enjoy high legal-tradition and
accounting harmonization.8
Starting with cultural environment, I rely on social psychologists who argue
that in individualistic (collectivistic) cultures people tend view themselves less
(more) connected to the social context and more (less) differentiated from others
8 Pincus et al. (2007) focus on sample that consists of: Australia, Canada, U.S., eight asian capital markets and nine european capital markets.

11
(see Markus and Kitayama, 1991). Further, in individualistic cultures people think
more positively about themselves and focus on their own internal attributes (see
Markus and Kitayama, 1991). As a result, there is a positive link between
individualism and overconfidence & self attribution bias. Chui et al. (2010),
provide empirical evidence for this link. Note also, that based on Heaton (2002),
overconfidence can also lead to overinvestment. Thus, it is reasonable to expect a
positive relation between individualism and the magnitude of hedge abnormal
returns attributable to accruals. My second hypothesis is:
H2: The accrual effect on stock returns is stronger in countries with higher
individualism.
Watanabe et al. (2011) argue that the effects of the effects of decreasing return
to scale should be more (less) visible in more (less) developed markets due to
easier access to external financing (financing constraints). In a similar vein, Titman
et al. (2011) argue that the degree of equity-market development may be positively
associated with managerial overinvestment tendencies. Firm executives in
countries with more developed capital markets are more likely to invest due to the
easiness of their access to external markets, than firm executives in countries with
less developed external capital markets.
According to Alford et al. (1993) and Ali and Hwang (2000), earnings are
more (less) value relevant in more (less) developed equity markets. Heron and Lie
(2004), Rangan (1998) and Teoh et al. (1998) argue that managers often
opportunistically manipulate earnings around periods in which they raise equity
financing. As a consequence, firm executives may have higher (lower) motives to

12
engage in earnings management in more (less) developed equity markets with
easier to external financing (constraints in external financing). Thus, I predict a
positive relation between equity market development and the magnitude of hedge
abnormal returns attributable to accruals. My third hypothesis is:
H3: The accrual effect on stock returns is stronger in countries with higher equity -
market development.
There is substantial evidence in the literature suggesting that a positive link
between investor protection and corporate governance. Strong investor protection
and corporate governance mechanisms may reduce managerial tendency to
overinvest and managerial ability to manipulate earnings. Thus, one can expect a
negative relation between shareholder protection and the accrual effect on stock
returns. Nevertheless, John et al. (2008) show a positive relation of investment
activities by firm executives with investor protection mechanisms or corporate
governance. This implies a positive impact of investor protection on the magnitude
of the accrual effect on stock returns. Thus, while I include in the analysis
shareholder protection as an important country-level characteristic, I do not make
any hypothesis about its influence on the accrual effect.
For the extent of accrual accounting usage, one needs to recognize that the
bottom-line earnings number reported in the income statement is the result of an
extended accounting process with considerable room for managerial discretion at
every step. Hung (2001) argues that within countries that allows a higher use of
accrual accounting, motives for earnings management by firm executives are
higher. Hence, the degree of allowance to use accrual accounting is expected to be

13
positively with the magnitude of hedge abnormal returns attributable to accruals.
This leads to the following hypothesis:
H4: The accrual effect on stock returns is stronger in countries that allow a higher
use of accrual accounting.
Bhattacharya et al. (2003) define the earnings opacity of a country “as the
extent to which the distribution of reported earnings in that country fails to provide
information about the distribution of the true, but unobservable, economic earnings
in that country”. They argue that, at least, three factors could affect earnings
opacity: earnings management, accounting standard setting and the enforcement of
accounting standards (i.e., audit quality). Thus, to the extent that earnings opacity
is subject to managerial discretion, one can expect a positive impact of earnings
opacity on the magnitude of hedge abnormal returns attributable to accruals. This
leads to the fifth hypothesis:
H5: The accrual effect on stock returns is stronger in countries with higher
earnings opacity.
Warfield et al. (1995) argue that as the concentration of share ownership
decreases, investors focus more in financial statements to minimize asymmetric
information between firm executives and equity market participants. Indeed, as
investors rely more on reported accounting figures, managers may have greater
motives to engage in earnings manipulation. On the other hand, as the
concentration of share ownership increases, owners are more likely to be insiders,

14
and thus, have a greater access to information about a firm’s “true” underlying
economic condition: quality of accounting numbers, managerial investment
incentives, strength of investment opportunities. Therefore, it is reasonable to
expect a negative association between ownership concentration and the magnitude
of hedge abnormal returns attributable to accruals. This leads to the following
hypothesis:
H6: The accrual effect on stock returns is stronger in countries with lower
ownership concentration.
The final characteristic used in my analysis is equity-market liquidity since it
could be associated with higher barriers to arbitrage. High liquidity in equity
markets implies that stock prices stay closer to fundamental values due to lower
arbitrage cost. Thus, liquidity is expected to be positively related with magnitude
of hedge abnormal returns attributable to accruals. This leads to the final
hypothesis:
H7: The accrual effect on stock returns is stronger in countries with higher equity-
market liquidity.
In order to test my cross-country hypotheses about fundamental factors
associated with the magnitude of the accrual effect on stock returns, I consider
regressions of abnormal returns earned from country-specific hedge portfolios
(formed on traditional and percent accruals) on country-level characteristics, after
controlling for the level of size and book to market ratio in each country. Further, I

15
assess the performance of the magnitude of future abnormal returns earned from
hedge portfolios formed on traditional and percent accruals, conditional on the
level of selected country-level characteristics.
The third objective of the paper is to distinguish between possible underlying
forces of the accrual anomaly. The current evidence on what causes the negative
relation between accruals and stock returns in the U.S. capital market is still
inconclusive. Importantly, my analysis on the relation of country-level
characteristics with the magnitude of the accrual effect on stock returns could help
in distinguishing among possible driving forces of the accrual anomaly, in a
european capital markets setting. If inability to adjust for potential earnings
management is the driving force, the accrual effect on stock returns should be
stronger among countries with higher accrual usage allowance, higher earning
opacity and weaker shareholder protection. If overconfidence is the driving force,
the accrual effect should be found stronger among countries with higher
individualism. A similar prediction applies, if the underlying source is inability to
adjust for potential empire building incentives.
Notably, if the accrual anomaly arises from at least one of the above
mentioned sources, the accrual effect on stock returns is expected to be stronger
among markets with higher equity-market development and lower ownership
concentration, since suboptimal behavior by firm executives such as earnings
manipulation and overinvestment may be more prevalent in these markets. At the
same time, investor protection is predicted to be negatively associated with
managerial bookkeeping mischief, while the relation of investor protection with
managerial investment discretion is unclear; it can be negative or positive. Further,
if the accrual anomaly is associated with limits to arbitrage, then the accrual effect
16
on stock returns should be stronger in countries with higher equity-market
liquidity.
3. Data, Sample Formation and Variable Measurement
Data for firm-level accounting and market variables are obtained from
Worldscope and Datastream International provided by Thomson Financial and
cover all listed firms from 1988 to 2009 for countries of the European Union prior
to its enlargement at 2004. In particular, the European Union, before this
enlargement, consists of the following countries: Austria, Belgium, Denmark,
Finland, France, Germany, Greece, Ireland, Italy, Luxembourg, Netherlands,
Norway, Portugal, Spain, Sweden, Switzerland and the U.K. However,
Luxembourg is excluded from the sample since the average percentage of foreign
firms listed on Luxembourg stock exchange amounts up to 82% between 1995 and
2008.
I select non-financial common stocks that are listed on the major stock
exchange in each country from both active and defunct research files of
Worldscope and Datastream in order to avoid the survivorship bias. I exclude,
closed-end funds, trusts, ADRs, REITs, units of beneficial interest, other financial
institutions and foreign firms.9 I also exclude firm-year observations with negative
book value of equity or with no valid data to calculate accrual measures, market
capitalization and book to market ratio. All firm-level accounting and market
variables are expressed in U.S. dollars.10
9 I also perform initial data screenings for basic coding errors via the methods outlined in Ince and Porter (2006). 10 All results remain qualitatively similar when I repeat the analysis using the local-currency converted firm-level variables for all countries.

17
Traditional and percent accruals are calculated through the indirect (balance)
method. In particular, the numerator on both accrual measures is equal to the
annual change in net operating assets (NOA). Net operating assets are equal to the
difference between operating assets (OA) and operating liabilities (OL). Operating
assets are calculated as the residual amount from total assets after subtracting cash
& cash equivalents (i.e., financial assets), and operating liabilities as the residual
amount from total assets after subtracting minority interest, preferred stock, total
debt (i.e., financial liabilities) and total common equity, as follows:
ttt CASHTAOA −= (1)
where:
•••• tTA : Total assets (Worldscope data item 02999).
•••• tCASH : Cash and cash equivalents (item 02001).
ttttt OPSTDMINTTAOL −−−= (2)
where:
•••• tMINT : Minority interest (item 03426).
•••• tTD : Total debt (item 03255).
•••• tOPS : Ordinary and preferred shares (item 03995).
ttt OLOANOA −= (3)
Traditional total accruals (TACC) are measured as the annual change in NOA
scaled by contemporaneous average total assets (AVTA) and percent total accruals
(PACC) are measured as the annual change in NOA scaled by the absolute value of
net income (NI):
t
tt AVTA
NOATACC
∆= (4)

18
t
tt
NOAACC
ΝΙ
∆=P (5)
where:
•••• tNI : Net Income (item 01551).
Market capitalization (MV, item 08001) is measured six months after the
financial year-end (e.g. June). Book to market ratio (BV/MV) is defined as the
ratio of the financial year-end book value of equity (item 03501) to the market
capitalization. I also use the natural logarithm of market capitalization (SIZE) and
the natural logarithm of book to market ratio (BM). Consistent with previous
research, TACC, PACC, SIZE and BM are winsorized at the top and bottom 1% of
their distribution within each country.
Stock returns are calculated inclusive of dividends using the return index
provided by Datastream (item RI), which is defined as the theoretical growth in the
value of a share holding unit of equity at the closing price applicable on the ex-
dividend date. The raw equity return for a firm at month j is calculated
as: 11−=
+
j
jj RI
RIr . In order to eliminate extreme outcomes from the calculation of
monthly raw returns, I impose the following filters: i) following Ince and Porter
(2006), I delete all the zero returns from the last observation to the first observation
with non-zero return; ii) following Ince and Porter (2006), I set the returns of two
consecutive months as missing if an increase over 300% at month and a decrease
more than 50% is observed; iii) following McLean et al. (2009), I trim monthly
returns at the top and bottom 1% of their distributions within each country.
Once, I get firm-monthly returns, I calculate one-year ahead annual raw stock
return (RETt+1) using compounded 12-monthly buy-and-hold returns. The 12-
19
month return cumulation period begins six months after financial year-end. For the
measurement of abnormal returns, I follow the approach based on the matching
return to the benchmark portfolio based on market capitalization and book-to-
market ratio (i.e., characteristic-based benchmark approach). In this way, returns
are adjusted for size and book to market effects.11 In particular, the one-year ahead
annual abnormal return (ARETt+1) is calculated as follows. Each year, firms are
first sorted into four quintile portfolios by market capitalization (MV) and in each
of the resulted quintile portfolios are further sorted into other four quintile
portfolios by the book-to-market ratio (BV/MV). This procedure results in 16
benchmark portfolios and the matching return is the annual one-year ahead
weighted average return of all firms in the benchmark portfolio. Then, the
abnormal return (ARETt+1) for a firm is the difference between the raw return
(RETt+1) and the matching return of the benchmark portfolio to which the firm
belongs. If a firm delists during the period, then the last available return index (RI)
before delisting is used to calculate the delisting return and the proceeds are
reinvested into the benchmark portfolio.
All the above mentioned criteria on data collection, sample formation and
variable measurement yield a final sample that consists of 62,019 firm-year
observations (i.e., equivalent to 744,228 firm-month observations) with non-
missing financial statement and stock market firm-level variables. Note that, I
require each country to have at least 30 stocks in any year during the sample
period, in order to ensure a reasonable number of firms for the portfolio and
regression tests. Appendix A provides details about the final sample, while
Appendix B provides the definition of firm-level variables. As expected, the U.K.
11 Fama and French (2008) argue that size and book to market-adjusted returns are almost similar to factor alphas from the Fama-French (1993) three-factor model.

20
equity market represents the largest part of the overall sample, accounting for
about 32% of the total firm-year observations. France is the second largest and
Germany is the third largest, accounting for about 14.5% and 12% of the total
observations, respectively. Austria, Ireland and Portugal belong to the smallest part
of the overall sample, with each country accounting for about 1.5% of the total
firm-year observations. Each of the remaining countries typically account for less
than 6% of the total firm-year observations.
Data for country-level characteristics are taken from various publicly available
sources. As a measure of individualism, I use the index constructed and extended
by Greet Hofstede (1980, 2001). The individualism index (IDV) is based on a
psychological survey of IBM employees in 72 countries and included about 88,000
responses. The value of the index is calculated from the country mean scores on 14
questions about the employees’ attitudes towards their work and private lives and
ranges from 0 to 100. A high value of the index indicates a high level of
individualism. Chui et al. (2010) use the individualism index to study the
momentum anomaly in an international setting, while Titman et al. (2011) to study
the asset growth anomaly in an international setting. Data for individualism index
are taken from the website of Hofstede (http://geert-hofstede.com).
For equity market development I use two proxies: the access-to-equity market
index (ACCESS) and the importance-of-equity market index (IMP). The access-to-
equity index is based on annual surveys, published at Global Competitiveness
Report from 1999 to 2006, about the ability of firms to raise equity in local stock
markets. The survey question is the statement “stock markets are open to new
firms and medium-sized firms and responses by firm executives to the statement
are scaled from 1 (strongly agree) to 7 (strongly disagree). A high value of the
21
index indicates better and easier access to equity markets. Data for the access-to-
equity market index is taken from LaPorta et al. (2006) as the average of the
annual scores for the period 1999-2006. The importance-of-equity market index
(IMP) is the average of the ratio of stock market capitalization held by small
shareholders to gross domestic product for the period 1996-2000. A high value of
the index indicates a high level of equity market importance. Both measures of
equity market development are used by Titman et al. (2011) to examine the
international asset growth anomaly and by Watanabe (2009) in investigating the
relation between the international value/growth anomaly and the international asset
growth anomaly. Data for the importance-of-equity market is taken from LaPorta
et al. (2006).
For shareholder protection, I also consider two proxies: the legal origin of a
country (LEG) and the anti-self dealing index (ANTISELF). In particular, I create
an indicator on a country’s legal origin, equalling 1 for a country with English,
German and Scandinavian origin and 0 for a country with French origin. This
indicator is based on findings of Gugler et al (2003, 2004) and LaPorta (2002) that
French origin countries are less effective in corporate governance than English,
German and Scandinavian countries. The anti-self dealing is developed by
Djankov et al. (2008) for 72 countries and represents the protection of minority
shareholders against self-dealing transactions. It is an average of ex-ante and ex-
post private control of self-dealing. As argued, this index is a more appropriate
measure than the anti-director index constructed by LaPorta et al. (1997, 1998).
The anti-self dealing index takes values from 0 to 1, with higher values indicating
stronger shareholder protection. Titman et al. (2011) and Watanabe et al. (2011)
consider the anti-self dealing index as a measure of shareholder protection in their
22
studies on the global asset growth anomaly, while Watanabe (2010) on a study
about the global external financing anomaly. Data for a country’s legal origin and
the anti-self dealing index can be found in Djankov et al. (2008).
As proxy of the degree of allowance of accrual accounting, I use the accrual
index (ACCI) developed by Hung (2001). It is an equally weighted index of 11
accrual-related accounting standards, where countries are ranked based on the
existence of specific accrual standards.12 The higher the index, the higher the use
of accrual accounting in a country is permitted. Pincus et al. (2007) consider the
accrual index in examining the global accrual anomaly. Data for the index are
given in Hung (2001).
Turning to earnings opacity, I consider the earning quality index (EOP)
developed by Bhattacharya et al. (2003). This index is an average across three
indices associated with earnings aggressiveness, loss avoidance and earnings
smoothing. A high value of the index indicates a high level of earnings opacity. To
my knowledge, this is the first paper that uses earnings opacity to investigate
market anomalies in an international setting. Data for the index are available in
Bhattacharya et al. (2003).
The median percentage of common shares owned by the three largest
shareholders in the ten largest nonfinancial firms is used as ownership
concentration proxy (OWCR). As proxy of equity-market liquidity (LIQ), I use the
total value of stocks traded as a percentage of GDP averaged over 1996-2000.
Pincus et al. (2007) consider ownership concentration in investigating the global
accrual anomaly, while Watanabe (2009) consider equity-market liquidity in
12 In particular, Hung’s (2001) accrual intensity index is based on accounting standards associated with goodwill, equity method, deprecation and accelerated depreciation, purchased intangibles, internally developed intangibles, research and development costs, interest capitalization, lease capitalization, allowance of the percentage of completion method, pension accounting, and accounting for other post retirement benefits.
23
investigating the relation between the international value/growth anomaly and the
international asset growth anomaly. Data for both proxies are given by LaPorta et
al. (2006). Appendix C summarizes the definition of all country-level
characteristics.
4. Results
4.1. Summary Statistics on Traditional and Percent Accruals
Table 1 reports summary statistics for accrual measures. Panel A provides
univariate statistics (mean, median, standard deviation). Starting with traditional
accruals, the mean value of TACC is the highest (0.104) in Greece and the lowest
in Switzerland (0.037). Similarly, the median value of TACC is the highest (0.096)
in Greece and the lowest in Switzerland (0.033). Ireland and Norway exhibit mean
values of TACC close to that of Greece, while Germany and Netherlands exhibit
median values of TACC close to that Switzerland. The mean value of TACC
across the rest sample of countries ranges from 0.052 to 0.074, while the median
value of TACC ranges from 0.04 to 0.069. Ireland, Norway, Sweden and U.K.
exhibit the higher standard deviations of TACC of about 0.23, while Austria,
France, Italy and Switzerland the lower standard deviations TACC of about 0.15.
Standard deviation of TACC across other countries range from 0.16 to 0.196. The
country-average mean, median and standard deviation of TACC is 0.066, 0.049
and 0.186, respectively. When all countries are considered together, univariate
statistics are almost similar to the country-averages.

24
Turning to percent accruals, Greece is the country with the highest mean,
median and standard deviation of PACC: 7.06, 1.988 and 27.92, respectively. Italy
and Norway, as Greece, exhibit high standard deviations: 23.392 and 21.185,
respectively. Netherlands is the country with the lowest mean value of PACC
(0.84). U.K. has the lowest median value (0.488). Netherlands has the lowest
standard deviation of PACC (5.605), followed by U.K. (8.125). Accross other
countries, the mean value of PACC ranges from to 1.078 to 5.125, while the
median value of PACC ranges from 0.519 to 1.163. Standard deviation of PACC
across other countries ranges from 9.823 to 16.21. The country-average mean,
median and standard deviation of PACC is 2.768, 0.856 and 14.335, respectively.
When all countries are considered together, the mean, median and standard
deviation of PACC is 2.408, 0.677 and 13.565, respectively. Overall, findings in
Panel A reveal a substantial variation of traditional and percent accruals across
countries, and confirm Hazfalla (2011) findings that percent accruals are more
extreme measures than traditional accruals.
Panel B presents pair-wise correlations - Pearson (above diagonal) and
Spearman (below diagonal) between TACC and PACC. Starting with Pearson
correlations, Netherlands has the highest correlation of about 0.61, followed by
Switzerland and U.K with a correlation around 0.555. Greece has the lowest
correlation between TACC and PACC of about 0.363, followed by Italy, Norway
and Finland with a correlation around 0.42. Across other countries, correlation
between TACC and PACC ranges from 0.442 to 0.526. The average-correlation is
about 0.482, while when all countries are consider together the correlation lowers
to 0.427

25
Spearman correlations are noteworthy: they are extremely high and almost
similar between countries. Greece has again the lowest correlation of about 0.815.
Netherlands, Switzerland and U.K. have again the highest correlation of about
0.915. The average-correlation between TACC and PACC is about 0.891. By
looking at Pearson correlations, one could argue that at first glance traditional
accruals are not highly correlated with percent accruals. Nevertheless, Spearman
correlations suggest that when traditional and percent accruals are converted to
ranked variables, they do not differ and they are almost similar measures. Thus, it
is really a very interesting exercise to examine whether the profitability of an
accrual-based hedge trading portfolio in european equity markets can be improved,
if percent accruals are considered as the ranking measure instead of traditional
accruals.
[Table 1 about here]
4.2. Rank-Regressions of Abnormal Returns on Traditional and Percent Accruals
In this section, I test the first hypothesis of the paper concerning the
occurrence of the negative relation of traditional and percent accruals with future
stock returns in european capital markets. For this purpose, I consider Fama-
MacBeth (1973) regressions of one-year ahead abnormal (size and book to market
adjusted) returns (ARET) on accrual measures, after controlling for the natural
logarithm of market capitalization (SIZE) and the natural logarithm of book to
market ration (BM), and report the time-series averages of the resulting parameter
coefficients (resulted t-statistics are based on the time-series variation of
coefficients).

26
All explanatory variables (i.e., SIZE, BM, TACC, PACC) are expressed as
scaled decile ranks: I rank the values of each measure into deciles (0 to 9) each
year and divide the decile number by 9 so that each firm-year observation related
to each measure takes a value ranging between 0 and 1. Desai et al. (2004) argue
that the estimation of regressions using scaled decile ranks has two main
advantages. First, the slope coefficient can be interpreted as the abnormal return to
a zero-investment strategy that takes a long (short) position on firms with high
(low) levels of the respective measure. Second, scaled decile ranks control for
potential non-linearities and ensure that results are not driven from extreme
observations. The test of the first hypothesis of the paper involves the estimation of
two models that take the following forms:
Model 1: 132101 ++ ++++= tdect
dect
dectt TACCBMSIZEARET υγγγγ
Model 2: 132101 ++ ++++= tdect
dect
dectt PACCBMSIZEARET υγγγγ
In Table 2, I report separate coefficients for each country, averages of
coefficients across countries and coefficients when countries are consider all-
together. Panel A presents results for TACC. Results reveal negative and
statistically significant at the 1% level coefficients on TACC in 11 out of 16
countries of the sample. Denmark has the largest negative coefficient of about -
0.16. Put another way, in Denmark a zero-investment portfolio in TACC that
consists of a long position on firms within the lowest decile and a short position on
firms within the highest decile generates an abnormal return of 16%. Interestingly,
countries accounting together for about 60% of the total firm-year observations
exhibit large coefficients: for U.K., France and Germany they are -0.125, -0.122
and -0.118, respectively. The coefficient for Belgium is -0.12, while for Sweden -
0.123. Netherlands, Norway, Spain and Switzerland have coefficients around -0.1,
27
while Italy has the lowest negative & statistically significant coefficient of about -
0.061. Austria, Finland, Greece, Ireland, Portugal have coefficients statistically
indifferent from zero. The country-average coefficient is -0.087, while when all
countries are considered together the coefficient increases to -0.1.
Panel B presents results for percent accruals. Results reveal negative
coefficients on PACC in 12 out of 16 countries that are statistically significant at
the 1% level in 9 countries, at the 5% level in 2 countries and at the 10% level in 1
country. Denmark (Italy) is again at the top (bottom) of the distribution with a
statistically significant coefficient of -0.12 (-0.055). The coefficients for U.K.,
France and Germany are -0.094, -0.108 and -0.095, respectively. Belgium has a
coefficient equal to -0.112, while Sweden and Switzerland have a coefficient equal
to -0.106. Ireland, Norway and Spain have coefficients close to -0.085, while
Netherlands equal to -0.061. Austria, Finland, Greece, Portugal have coefficients
statistically indifferent from zero. The country-average coefficient is -0.067, while
when all countries are considered together the coefficient increases to -0.08. Note
that the magnitude of the latter coefficients is about 20% lower than the magnitude
of the respective coefficients based on traditional accruals.
Overall, the evidence in Table 2 supports the first hypothesis (H1) about the
existence of the negative relation between accounting accruals and stock returns in
european equity markets. Though, my findings are not directly comparable with
Pincus et al. (2007) respective regression due to different sample formation, time-
period, measures of abnormal returns and control variables, they indicate a greater
occurence and magnitude of the accrual effect on stock returns based on traditional
total accruals and percent accruals relative to working capital accruals in european
equity markets.
28
[Table 2 about here]
4.3. Raw and Abnormal Returns of Portfolios on Traditional and Percent Accruals
In this section, in order to test the first hypothesis of the paper, I assess the
performance of portfolios based on traditional and percent accruals. Specifically, I
investigate whether one-year ahead raw and abnormal returns can be earned from
country-specific portfolios, country-average portfolios and portfolios when
countries are considered all-together. Country-specific portfolios are formed as
follows: each year (six months after the financial year-end) firms are sorted on
each accrual measure and allocated into five equal-sized portfolios (quintiles)
based on these ranks. Then, I report time-series averages of one-year ahead raw &
abnormal returns for the lowest portfolio, the highest portfolio and the hedge (i.e.,
consisting of a long position in the lowest quintile and a short position in the
highest quintile) portfolio (resulted t-statistics are based on the time-series
variation of returns). A “country-average” portfolio is formed as a portfolio that
puts an equal weight on each country-specific portfolio (resulted t-statistics are
based on the variation of country-specific returns). The “all-countries” portfolios
are formed with the same procedure used for country-specific portfolios with firms
from all countries (results are reported for lowest, highest and hedge accrual
portfolio).
In Table 3, I report one-year ahead raw returns (RET) from country-specific
portfolios, country-average portfolios and portfolios when countries are considered
all-together. Panel A presents results based on TACC. Hedge raw returns are
29
positive in 10 out of 16 countries. Among positive hedge raw returns, 6 are
statistically significant at the 1% level, 2 is at the 5% level and 2 at the 10% level.
Norway (Switzerland) has the highest (lowest) hedge raw return of about 0.146
(0.056). Hedge raw returns for U.K., France and Germany are equal to 0.085,
0.081 and 0.099, respectively. Belgium and Denmark have hedge raw returns of
about 0.09 and 0.095, respectively. The hedge raw return for Spain is equal to
0.081. Austria, Finland, Greece, Ireland, Italy and Sweden exhibit insignificant raw
returns. The country-average hedge raw return is 0.064, while when all countries
are considered together increases to 0.081.
Panel B present results for PACC. Hedge raw returns are now positive and
statistically significant at the 1% level in 7 countries, at the 5% in 2 countries and
at the 10% level in 2 countries. Norway has the highest hedge raw return of 0.13,
followed by Belgium with a hedge return of about 0.121. Italy has the lowest
hedge raw return of 0.041, followed by Netherlands with a hedge return of 0.053.
The magnitude of hedge returns obtained from percent accruals for UK., France
and Germany is similar to that obtained from traditional accruals (0.086, 0.091 and
0.088, respectively). In contrary, hedge raw returns for Sweden turn now to be
large and significant (0.102), while for Portugal turn to be insignificant. For Spain
and Denmark returns range from 0.07 to 0.079, while for Austria, Finland, Greece
and Ireland are insignificant. The country-average hedge raw return is equal to
0.066, while when all countries are considered together increases to 0.094. Thus,
the performance of the country-average hedge portfolios based on PACC is similar
with that based on TACC. When all countries are consider together, hedge raw
returns obtained from PACC are about 15% larger than those obtained from TACC
due to the performance of the lowest portfolio.

30
[Table 3 about here]
In Table 4, I report one-year ahead abnormal returns (ARET) from country-
specific portfolios, country-average portfolios and portfolios when countries are
considered all-together. Panel A presents results based on TACC. Abnormal
returns are positive in 10 countries. Out of these countries, returns are statistically
significant at the 1% level in 6 countries and statistically significant at the 5% level
in 4 countries. Denmark has the highest hedge abnormal return of about 0.102.
Hedge abnormal returns near 0.09 appear for U.K., France and Germany (0.097,
0.089 and 0.092, respectively). The hedge abnormal return for Netherlands is
0.085, while for Belgium is 0.082. Norway, Spain, Sweden and Switzerland have
hedge abnormal returns around 0.075 (0.075, 0.077, 0.074 and 0.076, respectively).
Abnormal returns for Austria, Finland, Greece, Ireland, Italy and Portugal are
insignificantly different from zero. The country-average hedge raw return is equal
to 0.064, while when all countries are considered together increases to 0.078.
Panel B presents results for PACC. Hedge abnormal returns are positive and
statistically significant at the 1% level, 5% level and 10% level in 7, 3 and 2
countries, respectively. Belgium has the highest hedge abnormal return of about
0.101, followed by Denmark with a return of about 0.097. Large abnormal returns
near 0.085 appear for Spain and Sweden. For France and U.K. hedge abnormal
returns range from 0.07 to 0.075. Germany, Netherlands, Norway and Switzerland
have hedge abnormal returns around 0.065 (0.062, 0.062, 0.064 and 0.067,
respectively). The hedge abnormal return is the lowest for Italy (0.045) and
insignificant for Austria, Finland, Greece and Portugal. The country-average hedge

31
raw return is equal to 0.053, while when all countries are considered together
increases to 0.062. Thus the hedge returns obtained either from the country-
average portfolio or the “all-countries”-portfolio on PACC are about 20% lower
than those obtained from the respective portfolios on TACC. Note also that hedge
abnormal returns from TACC portfolios are higher in 11 countries than those from
PACC portfolios.
Overall, findings in Table 3 and Table 4 confirm earlier regression results and
are consistent with the first hypothesis of the paper (H1) that the negative relation
between accruals and stock returns occurs in european equity markets. At the same
time, they suggest that the ability of accrual hedge portfolios to earn abnormal
returns can be improved if sorting is based on traditional accruals instead of
percent accruals. As such, traditional accruals are superior to percent accruals in
european equity markets, in contradiction to Hazfalla et al (2001) findings in U.S.
capital markets on the same issue.13
[Table 4 about here]
4.4. Summary Statistics on Country-level Characteristics
Table 5 summarizes basic information about statistics of the country-level
characteristics. Those characteristics are: the individualism index (IDV), the
access-to-equity market index (ACCESS), the importance-to-equity market index 13 Leippold and Lohre (2012) document that hedge quintile portfolios based on working capital accruals generate a country-average annualized raw return of about 0.066 and a country-average annualized alpha from the Fama-French three factor model of about 0.048 in 13 out of 16 european equity markets of my sample (Austria, Finland and Portugal that generate insignificant returns in study are not included in their study) from 1994 to 2008. The respective country-average returns in my sample (i.e., when Austria, Finland and Portugal are excluded) are: raw return of 0.072 based on traditional total accruals, raw return of 0.077 based on percent accruals, abnormal return of 0.075 based on traditional total accruals and abnormal return of 0.065 based on percent accruals.

32
(IMP), the legal tradition index (LEG), the anti-self dealing index (ANTISELF),
the accrual accounting index (ACCI), the earnings opacity index (EOP), the
ownership concentration ratio (OWCR) and the equity-market liquidity index
(LIQ).
Panel A reports univariate statistics (mean, median standard deviation,
minimum, maximum). IDV ranges from 27 (for Portugal) to 89 (for United
Kingdom) with a mean value around 65, a median value near 70 and a high
standard deviation around 16. ACCESS ranges from 4.89 (for Austria) to 6.43 (for
Netherlands), has a mean and median value close to 6, and a standard deviation
equal to 0.635. IMP has a minimum value of 0.07 (for Austria) and a maximum
value of 1.44 (for Switzerland). The mean value, median value and standard
deviation of IMP is equal to 0.529, 0.325 and 0.408, respectively.
7 countries have a French origin (i.e., LEG equals zero) and 9 countries have a
German, Scandinavian and English origin (i.e., LEG equals one). The lowest
(highest) value of ANTISELF is 0.203 for Netherlands (0.95 for United Kingdom).
It has a mean value, median and standard deviation equal to 0.422, 0.4 and 0.204,
respectively.
Accrual accounting is permitted to the lowest extent in Switzerland with a
minimum value of 0.32 and to greatest extent in Ireland and United Kingdom
(which are the only common-law countries in the sample) with a maximum value
of 0.82. ACCI has a mean value of about 0.613, a median value of about 0.57 and a
standard deviation of about 0.152. EOP has a minimum value of -0.246 for Ireland
and maximum value of -0.083 for Greece. The European Union prior to 2004
enlargement has a mean value of EOP equal to -0.166 with a standard deviation of
33
about 0.051. Note that the standard deviations of ACCI and EOP are much lower
relative to the standard deviations of the other indices used in the paper.
The lowest value of OWCR is 0.19 for United Kingdom, while the highest
value is 0.67 for Greece. The average of OWCR is 0.441 and the standard
deviation is 0.124. The most liquid market is Switzerland with LIQ equal to 206.27
and the least liquid market is Austria with LIQ equal to 6.71. The mean value,
median value and standard deviation of the LIQ are 62.863, 41.35 and 49.825,
respectively. Overall, summary statistics suggest a substantial cross-country
variation across the selected characteristics.
Panel B presents pair-wise correlations - Pearson (above diagonal) and
Spearman (below diagonal) between country-level characteristics. IDV exhibits a
positive correlation with the ACCESS (both Pearson and Spearman) and negative
correlation (only Pearson) with the OWCR. As expected, measures of equity-
market development are highly correlated: the Pearson (Spearman) correlation
between ACCESS and IMP is 0.723 (0.827). Both measures have a strong negative
correlation (both Pearson and Spearman) with OCWR. ACCESS and IMP have
also a strong positive correlation (both Pearson and Spearman) with LIQ. Further,
ANTISELF is positively correlated with the ACCI (only Pearson) and negatively
correlated with EOP (both Pearson and Spearman) and OWCR (only Pearson).
Finally, results reveal a negative correlation between ACCI and EOP (both Pearson
and Spearman). Overall, the evidence suggests the presence of significant
correlations between some of the selected country-level characteristics.
[Table 5 about here]
34
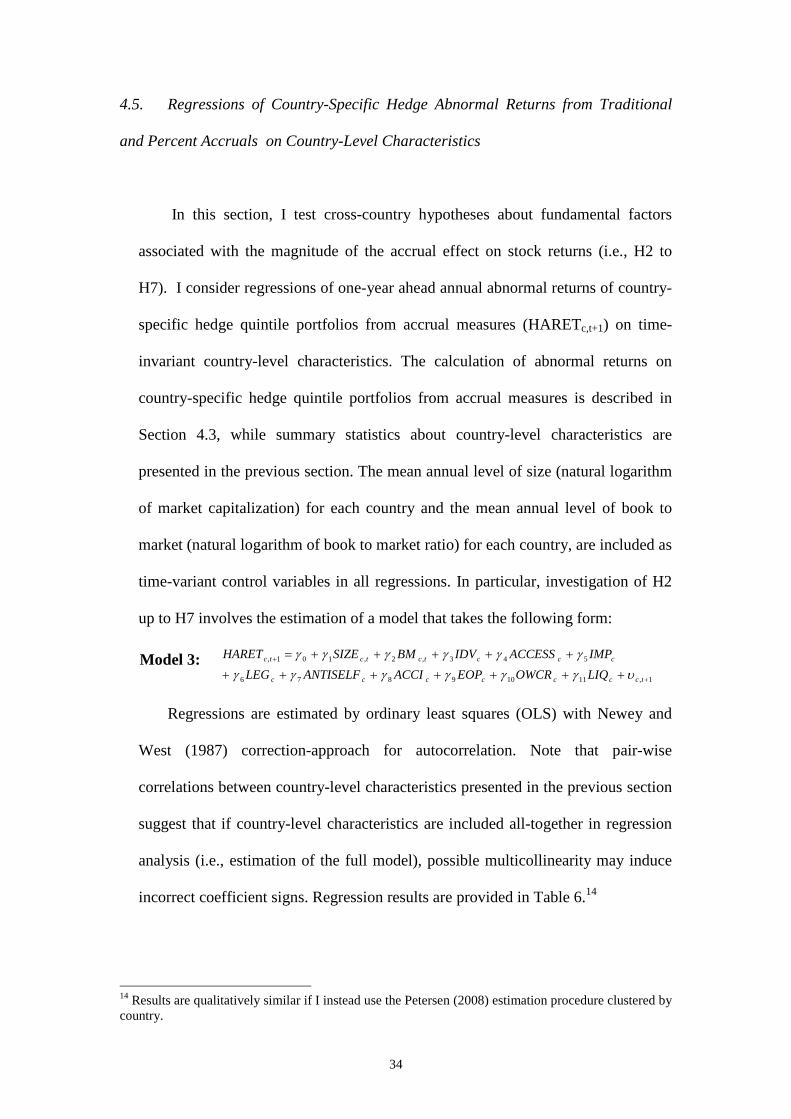
4.5. Regressions of Country-Specific Hedge Abnormal Returns from Traditional
and Percent Accruals on Country-Level Characteristics
In this section, I test cross-country hypotheses about fundamental factors
associated with the magnitude of the accrual effect on stock returns (i.e., H2 to
H7). I consider regressions of one-year ahead annual abnormal returns of country-
specific hedge quintile portfolios from accrual measures (HARETc,t+1) on time-
invariant country-level characteristics. The calculation of abnormal returns on
country-specific hedge quintile portfolios from accrual measures is described in
Section 4.3, while summary statistics about country-level characteristics are
presented in the previous section. The mean annual level of size (natural logarithm
of market capitalization) for each country and the mean annual level of book to
market (natural logarithm of book to market ratio) for each country, are included as
time-variant control variables in all regressions. In particular, investigation of H2
up to H7 involves the estimation of a model that takes the following form:
Model 3: 1,11109876
543,2,101,
+
+
+++++++
+++++=
tccccccc
ccctctctc
LIQOWCREOPACCIANTISELFLEG
IMPACCESSIDVBMSIZEHARET
υγγγγγγ
γγγγγγ
Regressions are estimated by ordinary least squares (OLS) with Newey and
West (1987) correction-approach for autocorrelation. Note that pair-wise
correlations between country-level characteristics presented in the previous section
suggest that if country-level characteristics are included all-together in regression
analysis (i.e., estimation of the full model), possible multicollinearity may induce
incorrect coefficient signs. Regression results are provided in Table 6.14
14 Results are qualitatively similar if I instead use the Petersen (2008) estimation procedure clustered by country.

35
Panel A present results based on country-specific hedge abnormal returns from
TACC. Results reveal that the coefficient IDV is positive and statistically
significantly at the 1% level, supporting the second hypothesis (H2) that the
accrual effect on stock returns is stronger in countries with higher individualism.
Further, the coefficient on ACCESS and IMP are positive and statistically
significant at the 5% level and 10% level, respectively. This finding is consistent
with the third hypothesis (H3) that the accrual effect on stock returns is stronger in
countries with higher equity-market development.
The coefficients on LEGAL and ANTISELF, ACCI, and EOP are statistically
indifferent from zero. Recall, that for shareholder protection, I do not make any
conjecture about how it impacts the cross-country variation of the accrual effect on
stock returns. Further, these findings contradict the fourth hypothesis (H4) that the
accrual effect on stock returns is stronger in countries that allow a higher use of
accrual accounting and the fifth hypothesis (H5) that it is stronger in countries with
higher earnings opacity.
The coefficient on OWCR is negative and statistically significant at the 10%
level, supporting the sixth hypothesis (H6) that the accrual effect on stock returns
is stronger in countries with lower ownership concentration. The coefficient on
LIQ is positive and statistically significant at the 5% level, supporting the final
hypothesis (H7) that the accrual effect on stock returns is stronger in countries with
higher equity-market liquidity. In the full model, the coefficient on IDV, ACCESS
and LIQ have similar signs (i.e., positive) and are statistically significant at the
10% level, 10% level and 1% level, respectively. At the same time, in the full
model the coefficient on IMP is statistically significant at the 5% level but with
36
opposite sign (i.e., negative), while the coefficient on OWCR turns to be
insignificant.
Panel B present results based on country-specific hedge abnormal returns from
PACC. The coefficients on IDV, ACCESS are positive and statistically significant
at the 1% level, while the coefficient on IMP is positive and statistically significant
at the 5%. Thus, these findings suggest that the accrual effect on stock returns is
stronger in countries with higher individualism and higher equity-market
development, confirming the second hypothesis (H2) and the third hypothesis (H3)
of the paper, respectively.
The coefficient on LEGAL is insignificant, while on ANTISELF positive and
statistically significant at the 10% level, suggesting that the accrual effect on stock
returns may possibly be stronger in countries with stronger shareholder protection.
The coefficient on ACCI is now positive and statistically significant at 10% level,
confirming the fourth hypothesis (H4) that the accrual effect on stock returns is
stronger in countries that allow a higher use of accrual accounting. The coefficients
on EOP and LIQ are insignificant, a finding inconsistent with the fifth hypothesis
(H5) and the final hypothesis (H7) that the accrual effect on stock returns is
stronger in countries with higher earnings opacity and higher equity-market
liquidity, respectively.
The coefficient on OWCR is negative and statistically significant at the 1%
level, confirming the sixth hypothesis (H6) that the accrual effect on stock returns
is stronger in countries with lower ownership concentration. In the full model,
coefficients on IDV and ACCESS are statistically significant (at the 1% level and
10% level, respectively) with similar signs (i.e., positive), while the coefficient on
IMP is statistically significant at 1% level but with opposite sign (i.e., negative).

37
The coefficients on ANTISELF, ACCI and OWCR turn to be insignificant, while
on LIQ turns to be significant at 1% level with a positive sign.
Overall, the evidence suggests that the accrual effect on stock returns is likely
to be stronger in countries with higher individualism, higher equity-market
development and lower concentration ratio. Equity-market liquidity has a strong
positive impact on the magnitude of the accrual effect based on traditional
accruals, but possibly a weaker positive influence when percent accruals are
considered as accrual measure. Further, shareholder protection may have a
positive impact only on the magnitude of the accrual effect based on percent
accruals. Similarly, permission to use accrual accounting has a positive influence
only on the effect generated by percent accruals.
Importantly, findings seem to support investors’ misunderstanding of
diminishing marginal returns to new investment and/or overinvestment as the most
consistent explanation of the accrual anomaly (Dechow et al. 2008). Thus, inability
to adjust for potential managerial empire building tendencies and/or
overconfidence & self attribution bias about a firm’s investment opportunities can
be considered as possible driving forces of the anomaly. At the same time, findings
do not rule out completely the possibility that it is risky and costly for arbitrageurs
to find close substitutes for mispriced stocks and thus, the accrual anomaly can not
fully arbitraged away (Mashruwala et al. 2006). Thus, limits to arbitrage can be
considered as a force associated with the persistence of the accrual anomaly.
[Table 6 about here]
38
4.6. Abnormal Portfolios of Portfolios on Traditional and Percent Accruals,
conditional on Country-Level Characteristics
In this section, I provide additional evidence on cross-country hypotheses
about fundamental factors associated with the magnitude of the accrual effect on
stock returns (i.e., H2 to H7). In particular, I investigate the magnitude of one-year
ahead abnormal returns (ARET) earned from portfolios on traditional and percent
accruals, conditional on country-level characteristics. The portfolio formation
procedure is as follows. Each year (six months after the financial year-end)
countries are classified based on the level of each characteristic into 3 groups: low
group (bottom 25%), medium group (middle 50%), high group (top 25%). Then,
for each of these groups, I report the country-average abnormal return on the
lowest accrual quintile-portfolio, highest accrual quintile-portfolio and the accrual
hedge-portfolio, by putting an equal weight on each country-specific accrual
portfolio (resulted t-statistics are based on the variation of country-specific
abnormal returns).
For LEG, I repeat the same portfolio procedure by considering only two
groups since this index takes two values: 0 for countries with French origin and 1
for a country with English, German and Scandinavian origin. For ACCI, I repeat
the same procedure by considering tow equal-sized groups, since based on this
index I cannot effectively include in the low group the bottom 25% of countries.
Panels A, B, C, D, E, F, G, H, and J present results for individualism, access-to-
equity market, importance-of-equity market, legal origin, anti-self dealing,
permission to use accrual accounting, earnings opacity, ownership concentration
39
and equity market liquidity, respectively. Country-specific abnormal returns from
portfolios on traditional and percent accruals are reported in Table 4.
Table 7 presents results based on TACC. Panel A reveals that countries with
high level of IDV have an average hedge abnormal return equal to 0.076 and
statistically significant at the 5% level, while countries with low level of IDV have
an insignificant hedge abnormal return. Similarly, within the group of countries
with high ACCESS and IMP hedge abnormal returns are statistically significant at
the 5% level and equal to 0.072 and 0.07, respectively, while within the group of
countries with low ACCESS and IMP hedge abnormal return are statistically
indifferent from zero.
The hedge abnormal return for countries with French origin is exactly similar
in magnitude with that of countries with English-German-Scandinavian origin. The
performance of countries with high ANTSELF, ACCI and EOP differs slightly
relative to the performance of countries with low ANTISELF, ACCI and EOP.
Countries with low OWCR have a hedge abnormal return of about 0.084
(statistically significant at the 1% level), while countries with high OWCR a hedge
abnormal return of about 0.044 (statistically significant at the 10% level).
Abnormal returns for countries with low and high LIQ are equal to 0.048
(statistically significant at the 10% level) and 0.078 (statistically significant at the
1% level), respectively.
Overall, results reveal that the accrual effect is stronger (disappears) in
countries with high (low) individualism and equity-market development. The
accrual effect is also stronger (weaker) in countries with low (high) ownership
concentration and countries with high (low) equity-market liquidity. These

40
findings, entirely in accordance with earlier regression results in Panel A of table 6,
support H2, H3, H6 and H7, but contradict H4 and H5.
[Table 7 about here]
Table 8 presents results based on PACC. Hedge abnormal returns for countries
with high IDV, ACCESS and IMP are statistically significant at the 5% level (for
IDV it is also significant at the 1% level) and equal to 0.071, 0.063 and 0.065,
respectively. Hedge abnormal returns for countries with low IDV, ACCESS, IMP
are statistically indifferent from zero. Within the group of countries with high
ANTISELF the hedge abnormal return is 0.083 and statistically significant at the
1% level, while within the group with low ANTISELF it turns to be insignificant
The performance of countries with French origin differs slightly from the
performance of countries with English-German-Scandinavian origin. Similar
findings are reported for countries with high EOP and LIQ relative to countries
with low EOP and LIQ.
In countries with high ACCI the hedge abnormal return is equal to 0.076 and
statistically significant at the 1% level, while in countries with low ACCI it is
equal to 0.031 and statistically significant at the 10% level. Larger differences are
identified for OWCR: hedge portfolio in countries with low OWCR earn abnormal
returns of about 0.074 (statistically significant at the 1% level), while in countries
with high OWCR earn abnormal returns that are statistically indifferent from zero.
Overall, results reveal that the accrual effect on stock returns is stronger
(disappears) in countries with high (low) individualism and equity-market
development. They also reveal that the accrual effect on stock returns is stronger

41
(disappears) in countries with stronger (weaker) shareholder protection and low
(high) ownership concentration. The accrual effect is also stronger (weaker) in
countries with high (low) permission to use accrual accounting. These findings,
similarly with earlier results in Panel B of table 6, are consistent with H2, H3, H4,
H6, but inconsistent with H5 and H7.
[Table 8 about here]
5. Conclusion
In this paper, I investigate the relation of accounting accruals with future
returns in the countries that belong to the European Union prior to its 2004
enlargement. 15 Adopting the most resent advances in the accounting literature, my
analysis is based on traditional total accruals and percent accruals. Recent studies
in the U.S. capital market, document that the magnitude of the accrual effect on
stock returns based on both measures is substantially higher than that based on
working capital accruals. I also investigate whether and how the magnitude of the
accrual effect on stock returns is affected by fundamentals factors of each country.
Further, the selected research design allows to distinguish between possible
underlying forces of the relation between accounting accruals and stock returns
Regression results reveal that the accrual anomaly, based either on traditional
accruals or percent accruals, exists in eleven countries of the European Union:
Belgium, Denmark, France, Germany, Italy, Netherlands, Norway, Spain, Sweden,
Switzerland and United Kingdom. Based on both accrual measures, the accrual
15 Only Luxembourg is excluded since it has mainly foreign listed firms.

42
anomaly is not present in Austria, Finland, Greece and Portugal, while based on
traditional accruals it is also absent in Ireland. Abnormal returns from hedge
portfolios based on traditional accruals range from -0.001 for Austria to 0.102 for
Denmark with a country-average equal to 0.064. Abnormal returns from hedge
portfolios based on percent accruals range from -0.004 for Austria to 0.101 for
Belgium with a country-average equal to 0.053.
The magnitude of the accrual effect on stock returns is affected by country-
level factors associated with cultural environment, characteristics of equity
markets, shareholder protection, usage of accrual accounting, but not by factors
associated with legal origin and quality of reported accounting figures. In
particular, the accrual effect on stock returns is stronger in countries with higher
individualism, higher equity-market development and lower concentration ratio.
Equity-market liquidity has a strong positive impact only on the effect generated
by traditional accruals. Shareholder protection and permission to use accrual
accounting have a positive influence only on the effect generated by percent
accruals.
The findings of the paper have several implications to the existing literature:
First, they suggest a great generalizability of the accrual anomaly in the European
Union that consists of countries that are more likely to have developed economies,
legal-tradition and accounting harmonization. They also provide an economic
summary from the occurrence of the anomaly. In contrary with documented
evidence in the U.S. capital market, my evidence indicates that the magnitude of
accrual effect on stock returns obtained from traditional accruals is larger than that
obtained from percent accruals.
43
Second, they suggest that the magnitude of the accrual effect on stock returns
is related with cultural, informational, corporate governance and capital market
factors of a country. Thus, my findings extent Pincus et al. (2007) work on the link
between the possible occurrence of accruals’ overweighting and cross-country
differences in some of these fundamental factors.
Third, findings corroborate Pincus et al. (2007) argument that a naïve version
of Sloan’s (1996) functional fixation hypothesis is unlikely to be a complete
explanation of the accrual anomaly. In this line, they suggest that Dechow et al.
(2008) hypothesis about investors’ misunderstanding of diminishing marginal
returns to new investment and/or overinvestment is likely to be the most consistent
explanation of the anomaly.
Fourth, they indicate inability to adjust for potential managerial empire
building tendencies and/or overconfidence & self attribution bias about a firm’s
investment opportunities as underlying driving forces of the accrual anomaly.
Similarly, with Pincus et al. (2007) they indicate limits to arbitrage as an important
force associated with the persistence of the anomaly.
I believe that my work provides some clearer avenues for future research.
Recognizing the limitations associated with the research design in international
studies (see the discussion Bushman and Smith 2001), it is important to offer
separately in countries outside the U.S. stock market, additional analysis
concerning the explanation and the underlying driving forces of the accrual
anomaly. I pursue some of these extensions in ongoing research.
44
References
Alford, A., Jones, J., Leftwich, R., Zmijewski, M. 1993. The relative informativeness
of accounting disclosures in different countries. Journal of Accounting
Research, 31, 183-223.
Ali, A., Hwang, L. 2000. Country-specific factors related to financial reporting and
the value relevance of accounting data. Journal of Accounting Research, 38, 1–
21.
Ball, R., Kothari, S., Robin, A. 2000. The effect of institutional factors on properties
of accounting earnings. Journal of Accounting and Economics, 29, 1–51.
Bhattacharya, U., Daouk, H., Welker, M. 2003. The world price of earnings opacity.
The Accounting Review, 78, 641–678.
Bradshaw, M., Richardson, S., Sloan, R. 2001. Do analysts and auditors use
information in accruals? Journal of Accounting Research, 39, 45-74.
Bushman, R., Smith, A. 2001. Financial accounting information and corporate
governance. Journal of Accounting and Economics, 32, 237–333.
Burgstahler, D., Hail, L., Leuz, C. 2006. The importance of reporting incentives:
earnings management in european private and public firms. The Accounting
Review, 81, 983-1016.
Chan, K., Chan, L., Jegadeesh, N., Lakonishok, J. 2006. Earnings quality and stock
returns. Journal of Business, 79, 1041-1082.
Chui, A., Titman, S., Wei, J. 2010. Individualism and momentum around the world.
Journal of Finance, 65, 361-392.
Dechow, P., Dichev, I. 2002. The quality of accruals and earnings: The role of accrual
estimation errors. The Accounting Review, 77, 35-59.
45
Dechow, P., Richardson, S., Sloan, R. 2008. The persistence and pricing of the cash
component of earnings. Journal of Accounting Research, 46, 537-566.
Desai, H., Rajgopal, S., Venkatachalam, M. 2004. Value-glamour and accruals
mispricing: one anomaly or tow? The Accounting Review, 79, 355-385.
Djankov, S., La Porta, R., Lopez-De-Silanes, F., Shleifer, A., Vishny, R. 2008. The
law and economics of self-dealing. Journal of Financial Economics, 88, 430-
465.
Fairfield, P., Whisenant, J., Yohn, T. 2003. Accrued earnings and growth:
implications for current profitability and market mispricing. The Accounting
Review, 78, 353–371.
Fama, E., MacBeth, J. 1973. Risk, return, and equilibrium: empirical tests. Journal of
Political Economy, 81, 607-636.
Fama, E., French, K. 1993. Common risk factors in the returns on stocks and bonds.
Journal of Financial Economics, 33, 3–56.
Fama, E., French, K. 1998. Value versus growth: The international evidence. Journal
of Finance, 53, 1975–1999.
Fama, E., French, K. 2008. Dissecting anomalies. Journal of Finance, 63, 1653-1678.
Gugler, K., Mueller, D., Yurtuglo, B. 2003. The Impact of corporate governance on
investment returns in developed and developing countries. The Economic
Journal, 113, 511-539
Gugler, K., Mueller, D., Yurtoglu, B. 2004. Corporate governance and the returns on
investment. Journal of Law and Economics, 47, 589-633.
Hafzalla, N., Lundholm, R. Van Winkle, M. 2011. Percent accruals. The Accounting
Review, 86, 209-236.

46
Healy, P. 1985. The effect of bonus schemes on accounting decisions. Journal of
Accounting and Economics, 7, 85-107.
Heaton, J.B. 2002. Managerial optimism and corporate finance. Financial
Management, 31, 33-45.
Heron, R., Lie, E. 2004. A comparison of the motivations for and the information
content of different types of equity offerings. Journal of Business, 77, 605- 632.
Hirshleifer, D., Hou, K., Teoh, S. Forthcoming. The accrual anomaly: risk or
mispricing? Management Science.
Hofstede, G. 1980. Culture’s consequences: international differences in work-related
values. Sage Publication: Beverly Hills, CA.
Hofstede, G. 2001. Culture’s consequences: comparing values, behaviors, institutions,
and organizations across nations. 2nd edition, Sage Publication: Beverly Hills,
CA.
Hung, M. 2001. Accounting standards and value relevance of financial statements: An
international analysis. Journal of Accounting and Economics, 30, 401–420.
Ince, O., Porter, R.B. 2006. Individual equity return data from Thomson Datastream:
Handle with care. Journal of Financial Research, 29, 463-479.
John, K., Litov, L., Bernard Yeung, B. 2008. Corporate governance and risk-taking.
Journal of Finance, 63, 1679-1728
Khan, M. 2008. Are accruals really mispriced? Evidence from tests of an
intertemporal capital asset pricing model. Journal of Accounting and
Economics, 45, 55-77.
La Porta, R., Lopez-De-Silanes, F., Shleifer, A., Vishny, R. 1997. Legal determinants
of external finance. Journal of Finance, 52, 1131-1150.
47
La Porta, R., Lopez-De-Silanes, F., Shleifer, A., Vishny, R. 1998. Law and finance.
Journal of Political Economy, 106, 1113-1155.
La Porta, R., Lopez-De-Silanes, F., Shleifer, A., Vishny, R. 2002. Investor protection
and corporate valuation. Journal of Finance, 57, 1147-1170.
La Porta, R., Lopez-De-Silanes, F., Shleifer, A. 2006. What works in securities laws?
Journal of Finance, 61, 1-32.
Leippold, M., and H. Lohre. 2012. Data snooping and the global accrual anomaly.
Applied Financial Economics, 7, 509-535.
Lev, B., Nissim, D. 2006. The persistence of the accruals anomaly. Contemporary
Accounting Research, 23, 193-226.
Markus, R., Kitayama, S. 1991. Culture and the self: implications for cognition,
emotion, and motivation. Psychological Review, 98, 224-253.
Mashruwala, C., Rajgopal, S., Shevlin, T. 2006. Why is the accrual anomaly not
arbitraged away? The role of idiosyncratic risk and transaction costs. Journal of
Accounting and Economics, 42, pp. 3-33.
McLean, D., Pontiff, J., Watanabe, A. 2009. Share issuance and cross-sectional
returns: International evidence. Journal of Financial Economics, 94, 1-17.
Newey, W., West, K. 1987. A simple, positive semi-definite, heteoskedasticity and
autocorrelation consistent covariance matrix. Econometrica, 55, 703–708.
Petersen, M. A. 2008. Estimating standard errors in finance panel data sets:
comparing approaches. Review of Financial Studies, 22, 435-480.
Pincus, M., Rajgopal, S., Venkatachalam, M. 2007. The Accrual anomaly:
international evidence. The Accounting Review, 82, 169-203.
Rangan, S. 1998. Earnings management and the performance of seasoned equity
offerings. Journal of Financial Economics, 50, 101–122.
48
Richardson, S., Sloan, R., Soliman, M., Tuna, I. 2005. Accrual reliability, earnings
persistence and stock prices. Journal of Accounting and Economics, 39, 437-
485.
Rouwenhorst, G. 1998. International momentum strategies. Journal of Finance. 53,
267-284.
Sloan, R. 1996. Do stock prices fully reflect information in accruals and cash flows
about future earnings? The Accounting Review, 71, 289-315.
Teoh, S., Welch, I., Wong, T.J. 1998. Earnings management and the
underperformance of seasoned equity offerings. Journal of Financial Economics,
50, 63–99.
Titman, S., Wei, J., Xie, F. 2011. Access to equity markets, corporate investments and
stock returns: International Evidence. Hong Kong University of Science and
Technology working paper.
Van Hulle, K. 2004. From accounting directives to international accounting standards.
In The Economics and Politics of Accounting (edited by C. Leuz, C., Pfaff, D.,
Hopwood, A.), 351-76, Oxford University Press: Oxford.
Warfield, T., Wild, J., Wild, K. 1995. Managerial ownership, accounting choices, and
informativeness of earnings. Journal of Accounting and Economics, 20, 61–91.
Watanabe, A. 2009. Asset growth effect and international value premium. University
of Alberta working paper.
Watanabe, A. 2010. External financing and cross-sectional returns: a global analysis.
University of Alberta working paper.
Watanabe, A., Xu, Y., Yao, T., Yu, T. 2011. The asset growth effect: insights from
international equity markets. University of Alberta working paper.

49
Wu. J., Zhang, L., Zhang, F. 2010. The q-theory approach to understanding the
accrual anomaly. Journal of Accounting Research, 48, 177-223.
Xie, H. 2001. The mispricing of abnormal accruals. The Accounting Review, 76, 357-
373.
Zhang, X. 2007. Accruals, investment, and the accrual anomaly. The Accounting
Review, 82 , 1333-1363.
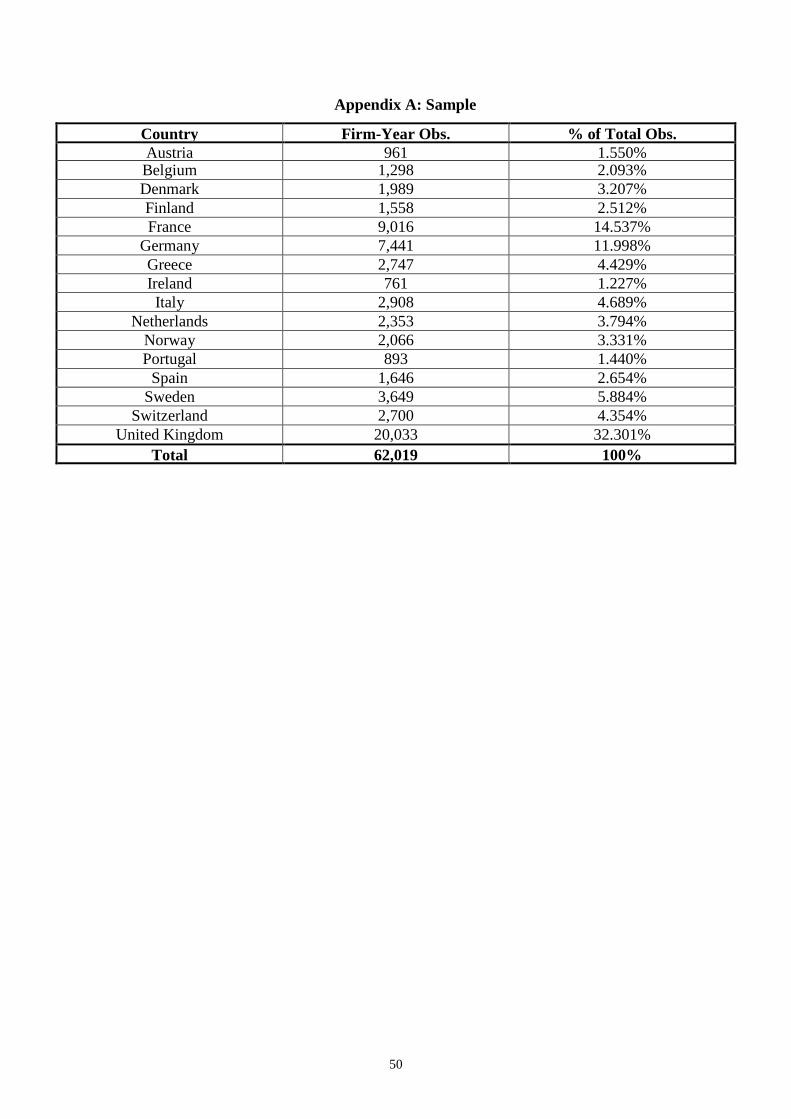
50
Appendix A: Sample
Country Firm -Year Obs. % of Total Obs. Austria 961 1.550% Belgium 1,298 2.093% Denmark 1,989 3.207% Finland 1,558 2.512% France 9,016 14.537%
Germany 7,441 11.998% Greece 2,747 4.429% Ireland 761 1.227% Italy 2,908 4.689%
Netherlands 2,353 3.794% Norway 2,066 3.331% Portugal 893 1.440% Spain 1,646 2.654%
Sweden 3,649 5.884% Switzerland 2,700 4.354%
United Kingdom 20,033 32.301% Total 62,019 100%

51
Appendix B: Definition of Firm-Level Variables
Variable Measurement (W=Worldscope data item)
Total assets (TA ) W02999
Cash & cash equivalents (CASH ) W02001
Minority interest ( MINT ) W03426
Total debt (TD ) W03255
Ordinary and preferred shares (OPS ) W03995
Total equity (TE ) W03501
Net income (NI ) W01551
Operating assets (OA) 0200102999 WW −
Operating liabilities ( OL) 03995032550342602999 WWWW −−−
Net operating assets (NOA ) OLOA −
Average total assets (AVTA ) Average value of TA at the beginning and at the end of a financial year
Total accruals (TACC) AVTANOA∆
Percent accruals (PACC ) INNOA∆
Market capitalization ( MV ) 08001W (measured six months after financial year-end)
Book to market ratio ( MVBV ) TEMV
Natural logarithm of market capitalization ( SIZE )
( )MVLn
Natural logarithm of book to market ratio ( BM )
( )TEMVLn
Return index (RI ) RI : The theoretical growth in the value of a share holding unit of an equity at the closing price applicable on the ex-dividend date.
Monthly raw return ( r ) RIRI∆
Annual one-year ahead raw return (RET ) RET is calculated using compounded 12-monthly buy-and-hold returns. The return cumulation period begins six months after financial year-end.
Annual one-year ahead abnormal return ( ARET )
Six months after each financial year-end, firms are first sorted into four quintile portfolios by MV and in each of the resulted quintile portfolios are further sorted into other four quintile portfolios by
MVBV . This procedure results in 16 benchmark portfolios and the matching return is the annual one-year ahead weighted average return for each benchmark portfolio. ARET is the difference between the RET and the matching return of the benchmark portfolio to which the firm belongs.
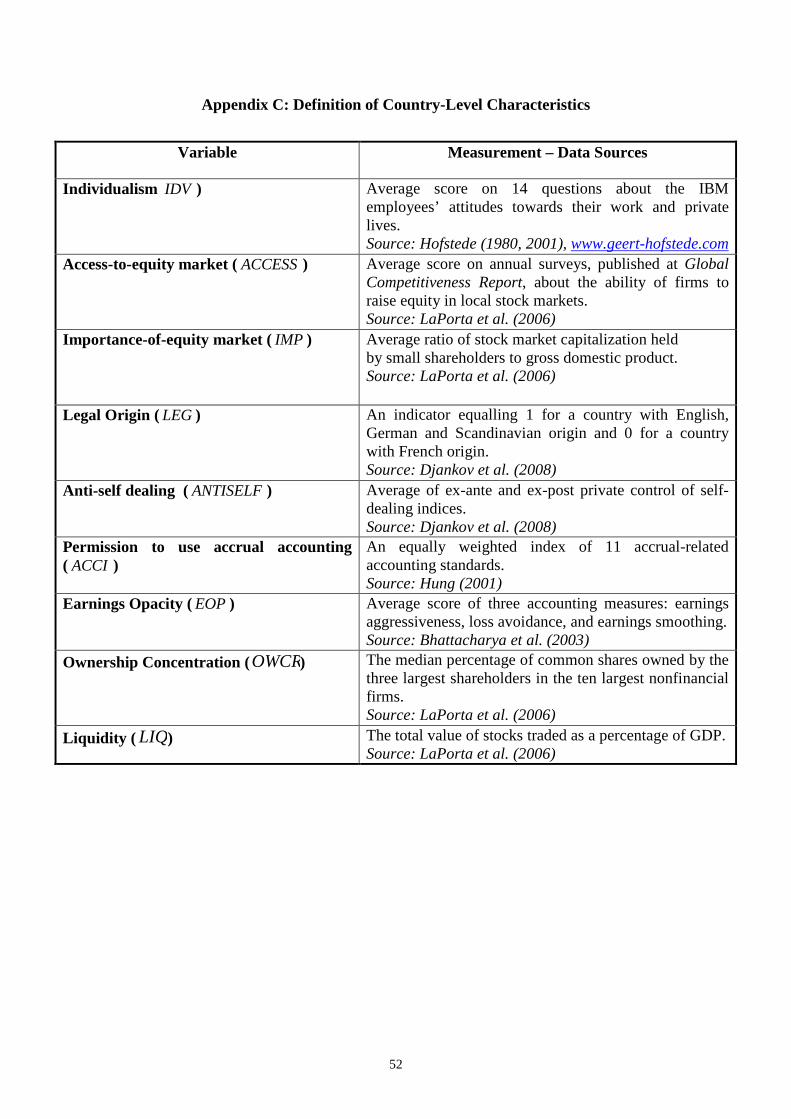
52
Appendix C: Definition of Country-Level Characteristics
Variable Measurement – Data Sources
Individualism IDV ) Average score on 14 questions about the IBM employees’ attitudes towards their work and private lives. Source: Hofstede (1980, 2001), www.geert-hofstede.com Access-to-equity market (ACCESS ) Average score on annual surveys, published at Global Competitiveness Report, about the ability of firms to raise equity in local stock markets. Source: LaPorta et al. (2006)
Importance-of-equity market ( IMP ) Average ratio of stock market capitalization held by small shareholders to gross domestic product. Source: LaPorta et al. (2006)
Legal Origin ( LEG ) An indicator equalling 1 for a country with English, German and Scandinavian origin and 0 for a country with French origin. Source: Djankov et al. (2008)
Anti-self dealing (ANTISELF ) Average of ex-ante and ex-post private control of self-dealing indices. Source: Djankov et al. (2008)
Permission to use accrual accounting ( ACCI )
An equally weighted index of 11 accrual-related accounting standards. Source: Hung (2001)
Earnings Opacity (EOP ) Average score of three accounting measures: earnings aggressiveness, loss avoidance, and earnings smoothing. Source: Bhattacharya et al. (2003)
Ownership Concentration (OWCR) The median percentage of common shares owned by the three largest shareholders in the ten largest nonfinancial firms. Source: LaPorta et al. (2006)
Liquidity ( LIQ) The total value of stocks traded as a percentage of GDP. Source: LaPorta et al. (2006)
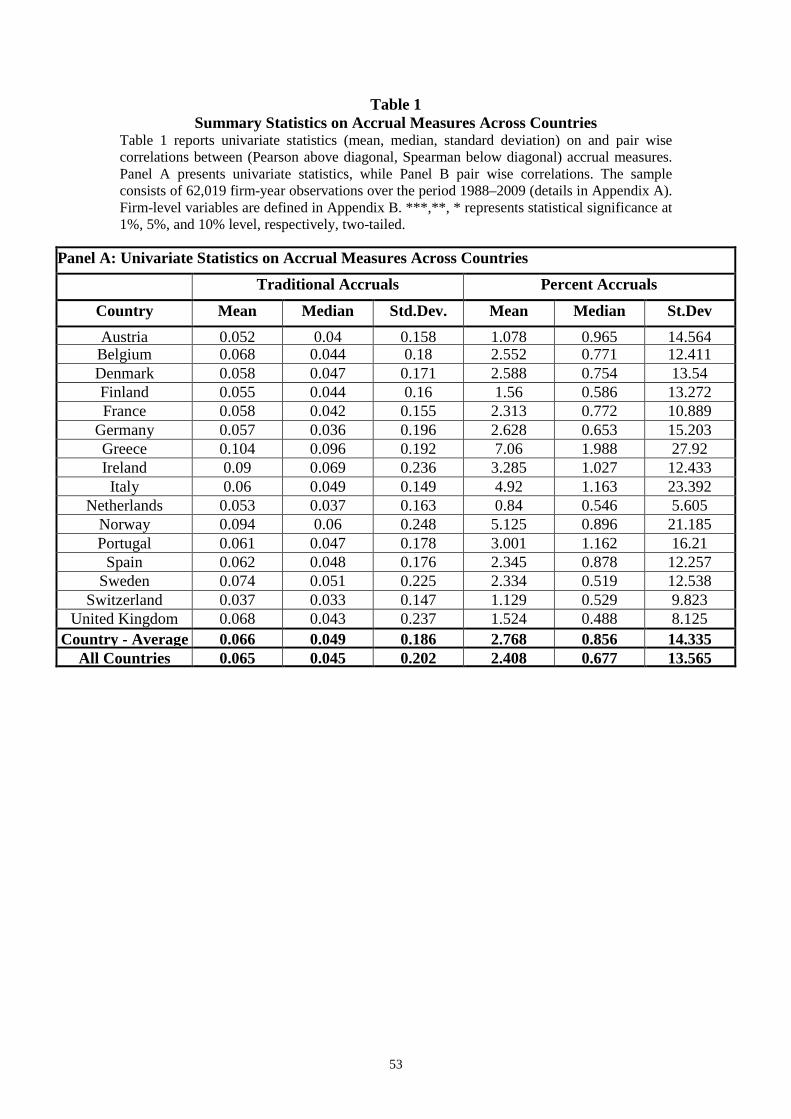
53
Table 1 Summary Statistics on Accrual Measures Across Countries
Table 1 reports univariate statistics (mean, median, standard deviation) on and pair wise correlations between (Pearson above diagonal, Spearman below diagonal) accrual measures. Panel A presents univariate statistics, while Panel B pair wise correlations. The sample consists of 62,019 firm-year observations over the period 1988–2009 (details in Appendix A). Firm-level variables are defined in Appendix B. ***,**, * represents statistical significance at 1%, 5%, and 10% level, respectively, two-tailed.
Panel A: Univariate Statistics on Accrual Measures Across Countries
Traditional Accruals Percent Accruals
Country
Mean Median Std.Dev. Mean Median St.Dev
Austria 0.052 0.04 0.158 1.078 0.965 14.564 Belgium 0.068 0.044 0.18 2.552 0.771 12.411 Denmark 0.058 0.047 0.171 2.588 0.754 13.54 Finland 0.055 0.044 0.16 1.56 0.586 13.272 France 0.058 0.042 0.155 2.313 0.772 10.889
Germany 0.057 0.036 0.196 2.628 0.653 15.203 Greece 0.104 0.096 0.192 7.06 1.988 27.92 Ireland 0.09 0.069 0.236 3.285 1.027 12.433 Italy 0.06 0.049 0.149 4.92 1.163 23.392
Netherlands 0.053 0.037 0.163 0.84 0.546 5.605 Norway 0.094 0.06 0.248 5.125 0.896 21.185 Portugal 0.061 0.047 0.178 3.001 1.162 16.21 Spain 0.062 0.048 0.176 2.345 0.878 12.257
Sweden 0.074 0.051 0.225 2.334 0.519 12.538 Switzerland 0.037 0.033 0.147 1.129 0.529 9.823
United Kingdom 0.068 0.043 0.237 1.524 0.488 8.125 Country - Average 0.066 0.049 0.186 2.768 0.856 14.335
All Countries 0.065 0.045 0.202 2.408 0.677 13.565

54
Table 1 (continued)
Panel B: Pair-wise Correlations between Accrual Measures Across Countries Country
Pearson Spearman
Austria 0.489*** 0.891*** Belgium 0.526*** 0.896*** Denmark 0.478*** 0.904*** Finland 0.425*** 0.901*** France 0.501*** 0.887***
Germany 0.45*** 0.887*** Greece 0.363*** 0.815*** Ireland 0.442*** 0.896*** Italy 0.41*** 0.869***
Netherlands 0.61*** 0.919*** Norway 0.424*** 0.878*** Portugal 0.509*** 0.892*** Spain 0.519*** 0.906***
Sweden 0.457*** 0.885*** Switzerland 0.555*** 0.91***
United Kingdom 0.554*** 0.912*** Country - Average 0.482*** 0.891***
All Countries 0.427*** 0.891***
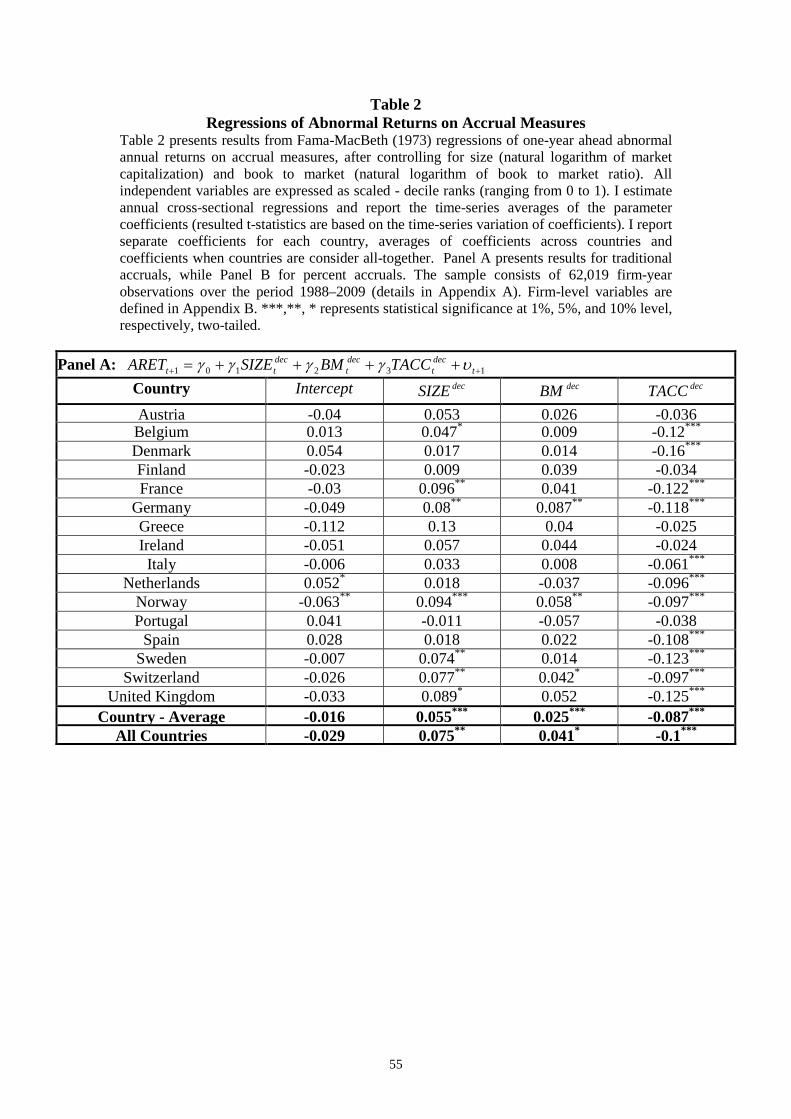
55
Table 2 Regressions of Abnormal Returns on Accrual Measures
Table 2 presents results from Fama-MacBeth (1973) regressions of one-year ahead abnormal annual returns on accrual measures, after controlling for size (natural logarithm of market capitalization) and book to market (natural logarithm of book to market ratio). All independent variables are expressed as scaled - decile ranks (ranging from 0 to 1). I estimate annual cross-sectional regressions and report the time-series averages of the parameter coefficients (resulted t-statistics are based on the time-series variation of coefficients). I report separate coefficients for each country, averages of coefficients across countries and coefficients when countries are consider all-together. Panel A presents results for traditional accruals, while Panel B for percent accruals. The sample consists of 62,019 firm-year observations over the period 1988–2009 (details in Appendix A). Firm-level variables are defined in Appendix B. ***,**, * represents statistical significance at 1%, 5%, and 10% level, respectively, two-tailed.
Panel A: 132101 ++ ++++= tdect
dect
dectt TACCBMSIZEARET υγγγγ
Country
Intercept decSIZE
decBM decTACC
Austria -0.04 0.053 0.026 -0.036 Belgium 0.013 0.047* 0.009 -0.12*** Denmark 0.054 0.017 0.014 -0.16*** Finland -0.023 0.009 0.039 -0.034 France -0.03 0.096** 0.041 -0.122***
Germany -0.049 0.08** 0.087** -0.118*** Greece -0.112 0.13 0.04 -0.025 Ireland -0.051 0.057 0.044 -0.024 Italy -0.006 0.033 0.008 -0.061***
Netherlands 0.052* 0.018 -0.037 -0.096*** Norway -0.063** 0.094*** 0.058** -0.097*** Portugal 0.041 -0.011 -0.057 -0.038 Spain 0.028 0.018 0.022 -0.108***
Sweden -0.007 0.074** 0.014 -0.123*** Switzerland -0.026 0.077** 0.042* -0.097***
United Kingdom -0.033 0.089* 0.052 -0.125*** Country - Average -0.016 0.055*** 0.025*** -0.087***
All Countries -0.029 0.075* * 0.041* -0.1***
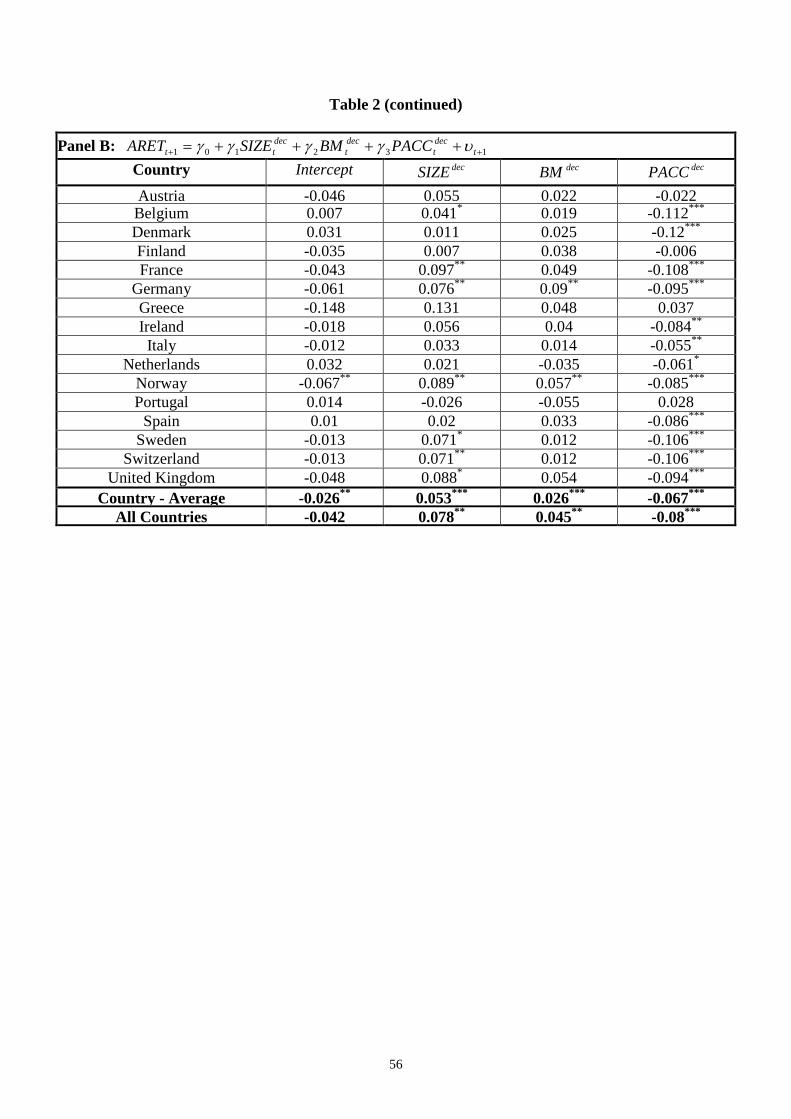
56
Table 2 (continued)
Panel B: 132101 ++ ++++= tdect
dect
dectt PACCBMSIZEARET υγγγγ
Country
Intercept decSIZE decBM decPACC
Austria -0.046 0.055 0.022 -0.022 Belgium 0.007 0.041* 0.019 -0.112*** Denmark 0.031 0.011 0.025 -0.12*** Finland -0.035 0.007 0.038 -0.006 France -0.043 0.097** 0.049 -0.108***
Germany -0.061 0.076** 0.09** -0.095*** Greece -0.148 0.131 0.048 0.037 Ireland -0.018 0.056 0.04 -0.084** Italy -0.012 0.033 0.014 -0.055**
Netherlands 0.032 0.021 -0.035 -0.061* Norway -0.067** 0.089** 0.057** -0.085*** Portugal 0.014 -0.026 -0.055 0.028 Spain 0.01 0.02 0.033 -0.086***
Sweden -0.013 0.071* 0.012 -0.106*** Switzerland -0.013 0.071** 0.012 -0.106***
United Kingdom -0.048 0.088* 0.054 -0.094*** Country - Average -0.026** 0.053*** 0.026*** -0.067***
All Countries -0.042 0.078** 0.045** -0.08***
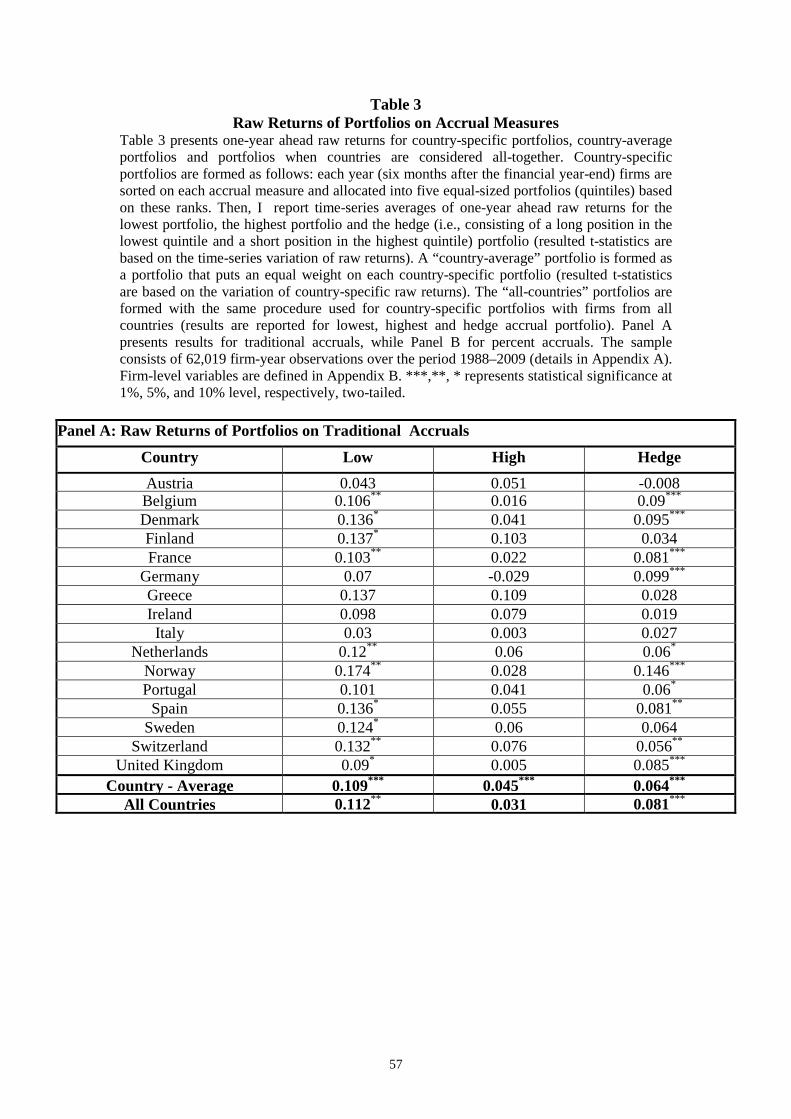
57
Table 3 Raw Returns of Portfolios on Accrual Measures
Table 3 presents one-year ahead raw returns for country-specific portfolios, country-average portfolios and portfolios when countries are considered all-together. Country-specific portfolios are formed as follows: each year (six months after the financial year-end) firms are sorted on each accrual measure and allocated into five equal-sized portfolios (quintiles) based on these ranks. Then, I report time-series averages of one-year ahead raw returns for the lowest portfolio, the highest portfolio and the hedge (i.e., consisting of a long position in the lowest quintile and a short position in the highest quintile) portfolio (resulted t-statistics are based on the time-series variation of raw returns). A “country-average” portfolio is formed as a portfolio that puts an equal weight on each country-specific portfolio (resulted t-statistics are based on the variation of country-specific raw returns). The “all-countries” portfolios are formed with the same procedure used for country-specific portfolios with firms from all countries (results are reported for lowest, highest and hedge accrual portfolio). Panel A presents results for traditional accruals, while Panel B for percent accruals. The sample consists of 62,019 firm-year observations over the period 1988–2009 (details in Appendix A). Firm-level variables are defined in Appendix B. ***,**, * represents statistical significance at 1%, 5%, and 10% level, respectively, two-tailed.
Panel A: Raw Returns of Portfolios on Traditional Accruals Country
Low High Hedge
Austria 0.043 0.051 -0.008 Belgium 0.106** 0.016 0.09*** Denmark 0.136* 0.041 0.095*** Finland 0.137* 0.103 0.034 France 0.103** 0.022 0.081***
Germany 0.07 -0.029 0.099*** Greece 0.137 0.109 0.028 Ireland 0.098 0.079 0.019 Italy 0.03 0.003 0.027
Netherlands 0.12** 0.06 0.06* Norway 0.174** 0.028 0.146*** Portugal 0.101 0.041 0.06* Spain 0.136* 0.055 0.081**
Sweden 0.124* 0.06 0.064 Switzerland 0.132** 0.076 0.056**
United Kingdom 0.09* 0.005 0.085*** Country - Average 0.109*** 0.045*** 0.064***
All Countries 0.112** 0.031 0.081***
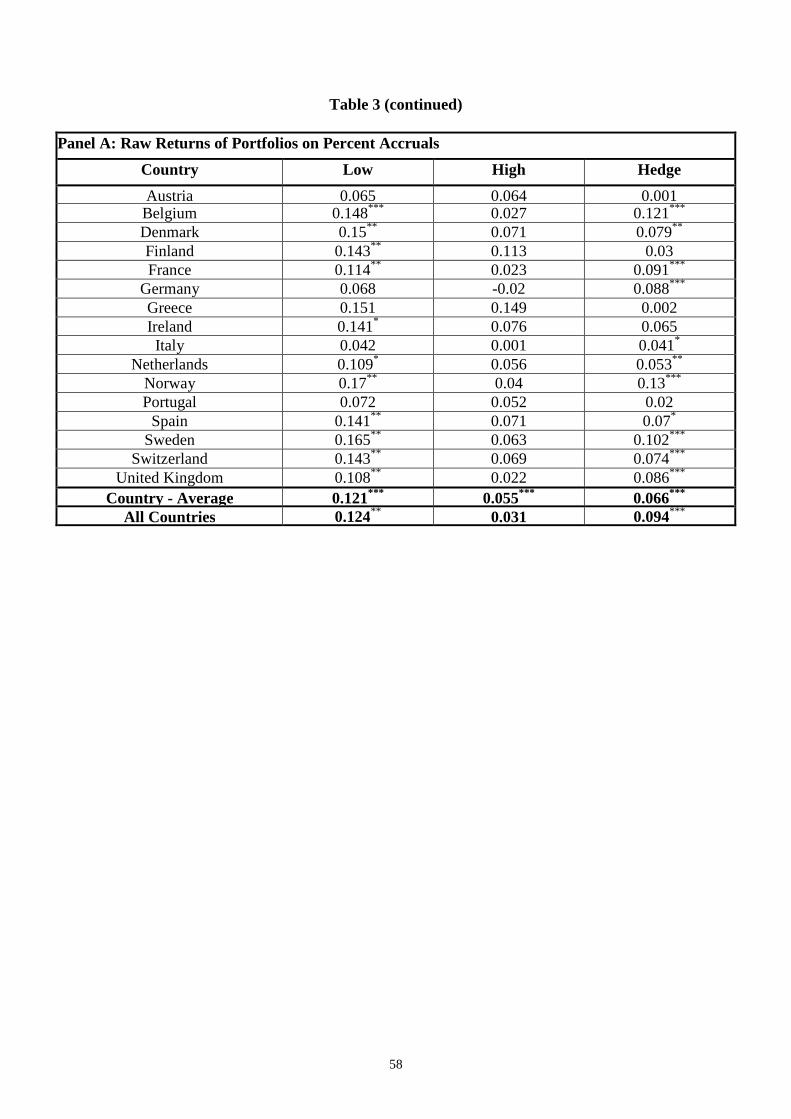
58
Table 3 (continued)
Panel A: Raw Returns of Portfolios on Percent Accruals Country
Low High Hedge
Austria 0.065 0.064 0.001 Belgium 0.148*** 0.027 0.121*** Denmark 0.15** 0.071 0.079** Finland 0.143** 0.113 0.03 France 0.114** 0.023 0.091***
Germany 0.068 -0.02 0.088*** Greece 0.151 0.149 0.002 Ireland 0.141* 0.076 0.065 Italy 0.042 0.001 0.041*
Netherlands 0.109* 0.056 0.053** Norway 0.17** 0.04 0.13*** Portugal 0.072 0.052 0.02 Spain 0.141** 0.071 0.07*
Sweden 0.165** 0.063 0.102*** Switzerland 0.143** 0.069 0.074***
United Kingdom 0.108** 0.022 0.086*** Country - Average 0.121*** 0.055*** 0.066***
All Countries 0.124** 0.031 0.094***

59
Table 4 Abnormal Returns of Portfolios on Accrual Measures
Table 4 presents one-year ahead abnormal returns for country-specific portfolios, country-average portfolios and portfolios when countries are considered all-together. Country-specific portfolios are formed as follows: each year (six months after the financial year-end) firms are sorted on each accrual measure and allocated into five equal-sized portfolios (quintiles) based on these ranks. Then, I report time-series averages of one-year ahead abnormal returns for the lowest portfolio, the highest portfolio and the hedge (i.e., consisting of a long position in the lowest quintile and a short position in the highest quintile) portfolio (resulted t-statistics are based on the time-series variation of abnormal returns). A “country-average” portfolio is formed as a portfolio that puts an equal weight on each country-specific portfolio (resulted t-statistics are based on the variation of country-specific abnormal returns). The “all-countries” portfolios are formed with the same procedure used for country-specific portfolios with firms from all countries (results are reported for lowest, highest and hedge accrual portfolio). Panel A presents results for traditional accruals, while Panel B for percent accruals. The sample consists of 62,019 firm-year observations over the period 1988–2009 (details in Appendix A). Firm-level variables are defined in Appendix B. ***,**, * represents statistical significance at 1%, 5%, and 10% level, respectively, two-tailed.
Panel A: Abnormal Returns of Portfolios on Traditional Accruals Country
Low High Hedge
Austria -0.047 -0.046* -0.001 Belgium 0.014 -0.068*** 0.082** Denmark 0.025 -0.077*** 0.102*** Finland -0.012 -0.043** 0.031 France -0.009 -0.098*** 0.089***
Germany -0.002 -0.094*** 0.092*** Greece 0.024 -0.035 0.059 Ireland -0.011 -0.047** 0.036 Italy -0.006 -0.043** 0.037
Netherlands 0.021 -0.064*** 0.085*** Norway -0.012 -0.087*** 0.075** Portugal -0.035 -0.053** 0.018 Spain 0.025 -0.052*** 0.077***
Sweden -0.007 -0.081*** 0.074** Switzerland 0.013 -0.063*** 0.076**
United Kingdom 0.001 -0.096*** 0.097*** Country - Average -0.001 -0.065*** 0.064***
All Countries 0.001 -0.077*** 0.078***
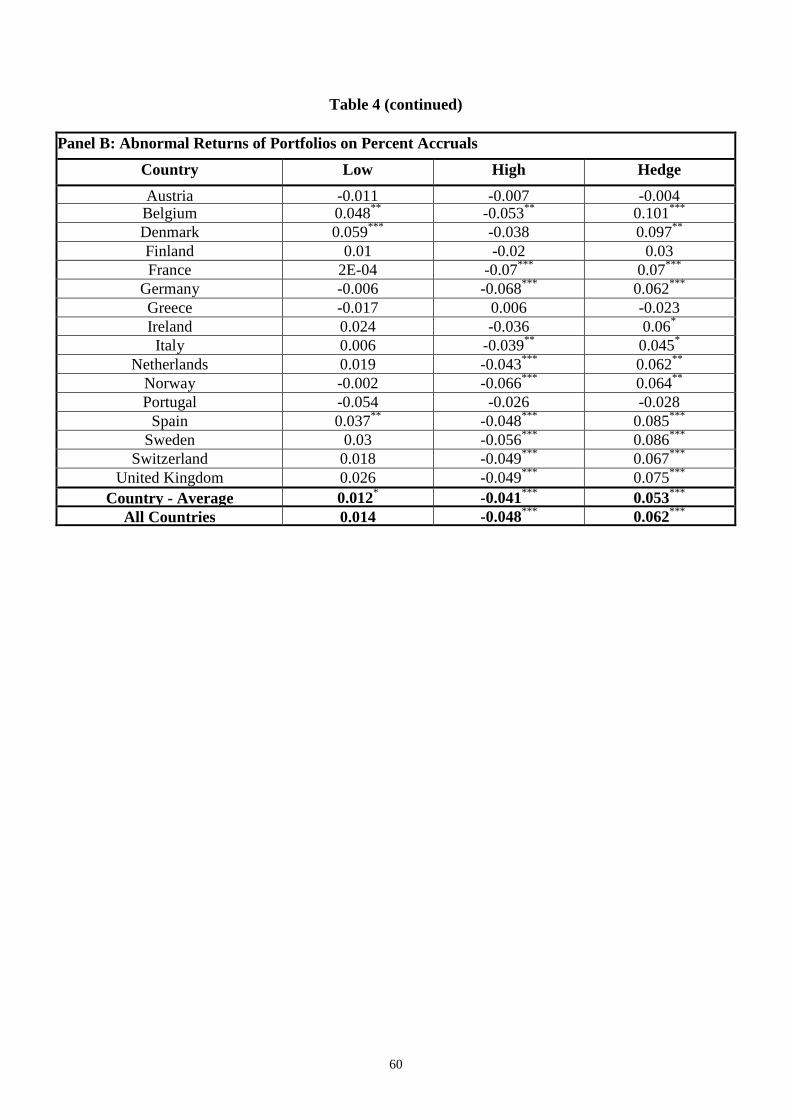
60
Table 4 (continued)
Panel B: Abnormal Returns of Portfolios on Percent Accruals Country
Low High Hedge
Austria -0.011 -0.007 -0.004 Belgium 0.048** -0.053** 0.101*** Denmark 0.059*** -0.038 0.097** Finland 0.01 -0.02 0.03 France 2E-04 -0.07*** 0.07***
Germany -0.006 -0.068*** 0.062*** Greece -0.017 0.006 -0.023 Ireland 0.024 -0.036 0.06* Italy 0.006 -0.039** 0.045*
Netherlands 0.019 -0.043*** 0.062** Norway -0.002 -0.066*** 0.064** Portugal -0.054 -0.026 -0.028 Spain 0.037** -0.048*** 0.085***
Sweden 0.03 -0.056*** 0.086*** Switzerland 0.018 -0.049*** 0.067***
United Kingdom 0.026 -0.049*** 0.075*** Country - Average 0.012* -0.041*** 0.053***
All Countries 0.014 -0.048*** 0.062***
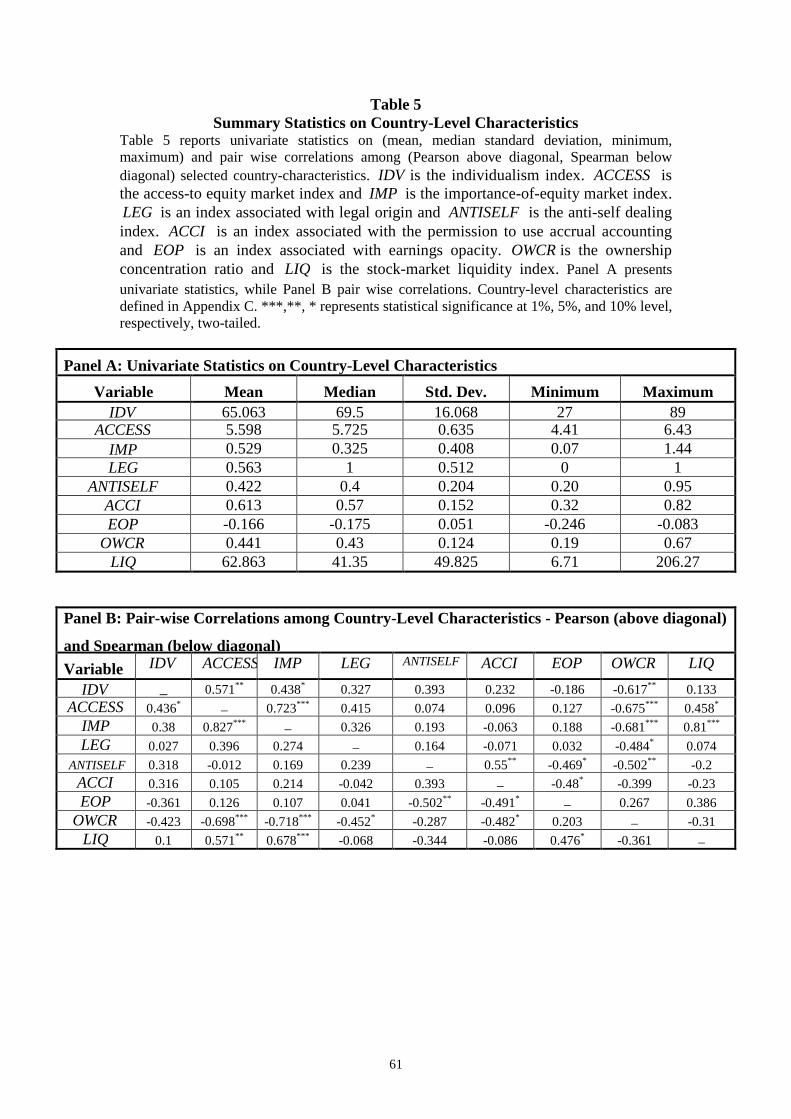
61
Table 5 Summary Statistics on Country-Level Characteristics
Table 5 reports univariate statistics on (mean, median standard deviation, minimum, maximum) and pair wise correlations among (Pearson above diagonal, Spearman below diagonal) selected country-characteristics. IDV is the individualism index. ACCESS is the access-to equity market index and IMP is the importance-of-equity market index. LEG is an index associated with legal origin and ANTISELF is the anti-self dealing index. ACCI is an index associated with the permission to use accrual accounting and EOP is an index associated with earnings opacity. OWCR is the ownership concentration ratio and LIQ is the stock-market liquidity index. Panel A presents univariate statistics, while Panel B pair wise correlations. Country-level characteristics are defined in Appendix C. ***,**, * represents statistical significance at 1%, 5%, and 10% level, respectively, two-tailed.
Panel A: Univariate Statistics on Country-Level Characteristics
Variable Mean Median Std. Dev. Minimum Maximum IDV 65.063 69.5 16.068 27 89
ACCESS 5.598 5.725 0.635 4.41 6.43 IMP 0.529 0.325 0.408 0.07 1.44 LEG 0.563 1 0.512 0 1
ANTISELF 0.422 0.4 0.204 0.20 0.95 ACCI 0.613 0.57 0.152 0.32 0.82 EOP -0.166 -0.175 0.051 -0.246 -0.083
OWCR 0.441 0.43 0.124 0.19 0.67 LIQ 62.863 41.35 49.825 6.71 206.27
Panel B: Pair-wise Correlations among Country-Level Characteristics - Pearson (above diagonal)
and Spearman (below diagonal)
Variable IDV
ACCESS
IMP
LEG
ANTISELF
ACCI
EOP
OWCR
LIQ IDV _ 0.571** 0.438* 0.327 0.393 0.232 -0.186 -0.617** 0.133
ACCESS 0.436* _ 0.723*** 0.415 0.074 0.096 0.127 -0.675*** 0.458* IMP
0.38 0.827*** _ 0.326 0.193 -0.063 0.188 -0.681*** 0.81***
LEG 0.027 0.396 0.274 _ 0.164 -0.071 0.032 -0.484* 0.074
ANTISELF 0.318 -0.012 0.169 0.239 _ 0.55** -0.469* -0.502** -0.2 ACCI 0.316 0.105 0.214 -0.042 0.393 _ -0.48* -0.399 -0.23
EOP -0.361 0.126 0.107 0.041 -0.502** -0.491* _ 0.267 0.386 OWCR -0.423 -0.698*** -0.718*** -0.452* -0.287 -0.482* 0.203 _ -0.31
LIQ 0.1 0.571** 0.678*** -0.068 -0.344 -0.086 0.476* -0.361 _
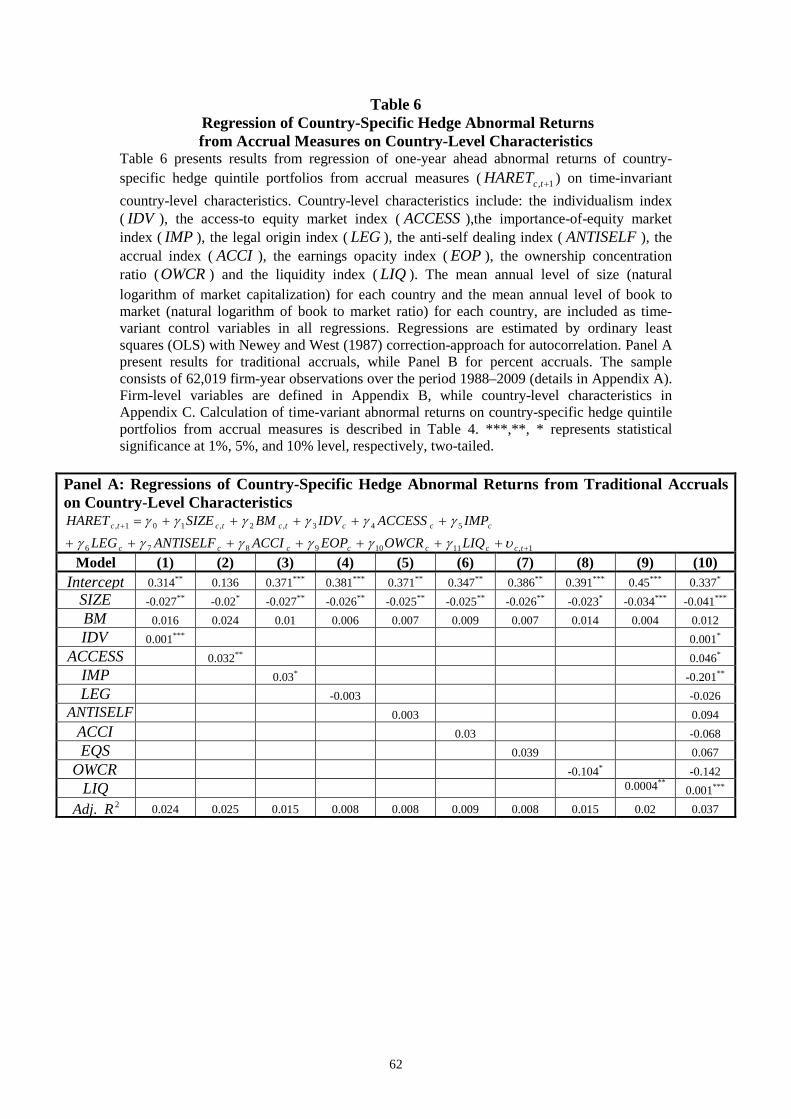
62
Table 6 Regression of Country-Specific Hedge Abnormal Returns from Accrual Measures on Country-Level Characteristics
Table 6 presents results from regression of one-year ahead abnormal returns of country-specific hedge quintile portfolios from accrual measures ( 1, +tcHARET ) on time-invariant
country-level characteristics. Country-level characteristics include: the individualism index ( IDV ), the access-to equity market index (ACCESS ),the importance-of-equity market index (IMP ), the legal origin index (LEG ), the anti-self dealing index (ANTISELF ), the accrual index (ACCI ), the earnings opacity index (EOP ), the ownership concentration ratio (OWCR ) and the liquidity index (LIQ ). The mean annual level of size (natural logarithm of market capitalization) for each country and the mean annual level of book to market (natural logarithm of book to market ratio) for each country, are included as time-variant control variables in all regressions. Regressions are estimated by ordinary least squares (OLS) with Newey and West (1987) correction-approach for autocorrelation. Panel A present results for traditional accruals, while Panel B for percent accruals. The sample consists of 62,019 firm-year observations over the period 1988–2009 (details in Appendix A). Firm-level variables are defined in Appendix B, while country-level characteristics in Appendix C. Calculation of time-variant abnormal returns on country-specific hedge quintile portfolios from accrual measures is described in Table 4. ***,**, * represents statistical significance at 1%, 5%, and 10% level, respectively, two-tailed.
Panel A: Regressions of Country-Specific Hedge Abnormal Returns from Traditional Accruals on Country-Level Characteristics
1,11109876
543,2,101,
+
+
+++++++
+++++=
tccccccc
ccctctctc
LIQOWCREOPACCIANTISELFLEG
IMPACCESSIDVBMSIZEHARET
υγγγγγγ
γγγγγγ
Model (1) (2) (3) (4) (5) (6) (7) (8) (9) (10) Intercept 0.314** 0.136 0.371*** 0.381*** 0.371** 0.347** 0.386** 0.391*** 0.45*** 0.337*
SIZE -0.027** -0.02* -0.027** -0.026** -0.025** -0.025** -0.026** -0.023* -0.034*** -0.041***
BM
0.016 0.024 0.01 0.006 0.007 0.009 0.007 0.014 0.004 0.012
IDV 0.001*** 0.001*
ACCESS 0.032** 0.046*
IMP
0.03* -0.201**
LEG -0.003 -0.026
ANTISELF
0.003 0.094
ACCI 0.03 -0.068
EQS 0.039 0.067
OWCR -0.104* -0.142
LIQ 0.0004**
0.001*** 2. RAdj 0.024 0.025 0.015 0.008 0.008 0.009 0.008 0.015 0.02 0.037

63
Table 6 (continued)
Panel B: Regressions of Country-Specific Hedge Abnormal Returns from Percent Accruals on Country-Level Characteristics
1,11109876
543,2,101,
+
+
+++++++
+++++=
tccccccc
ccctctctc
LIQOWCREOPACCIANTISELFLEG
IMPACCESSIDVBMSIZEHARET
υγγγγγγ
γγγγγγ
Model (1) (2) (3) (4) (5) (6) (7) (8) (9) (10) Intercept 0.003 -0.178 0.103 0.071 0.044 0.033 0.054 0.136 0.156 -0.055
SIZE -0.006 0.003 -0.005 -0.001 -0.0002 -0.001 -0.001 0.001 -0.009 -0.014
BM
0.034** 0.04** 0.022 0.023 0.022 0.025 0.018 0.031* 0.017 0.032*
IDV 0.002*** 0.002***
ACCESS 0.039*** 0.039*
IMP
0.034** -0.18***
LEG 0.017 -0.007
ANTISELF
0.058* 0.087
ACCI 0.081* -0.035
EQS -0.165 -0.044
OWCR -0.182*** -0.103
LIQ 0.0002 0.001*** 2. RAdj 0.057 0.026 0.005 0.001 0.003 0.003 0.001 0.022 0.001 0.061
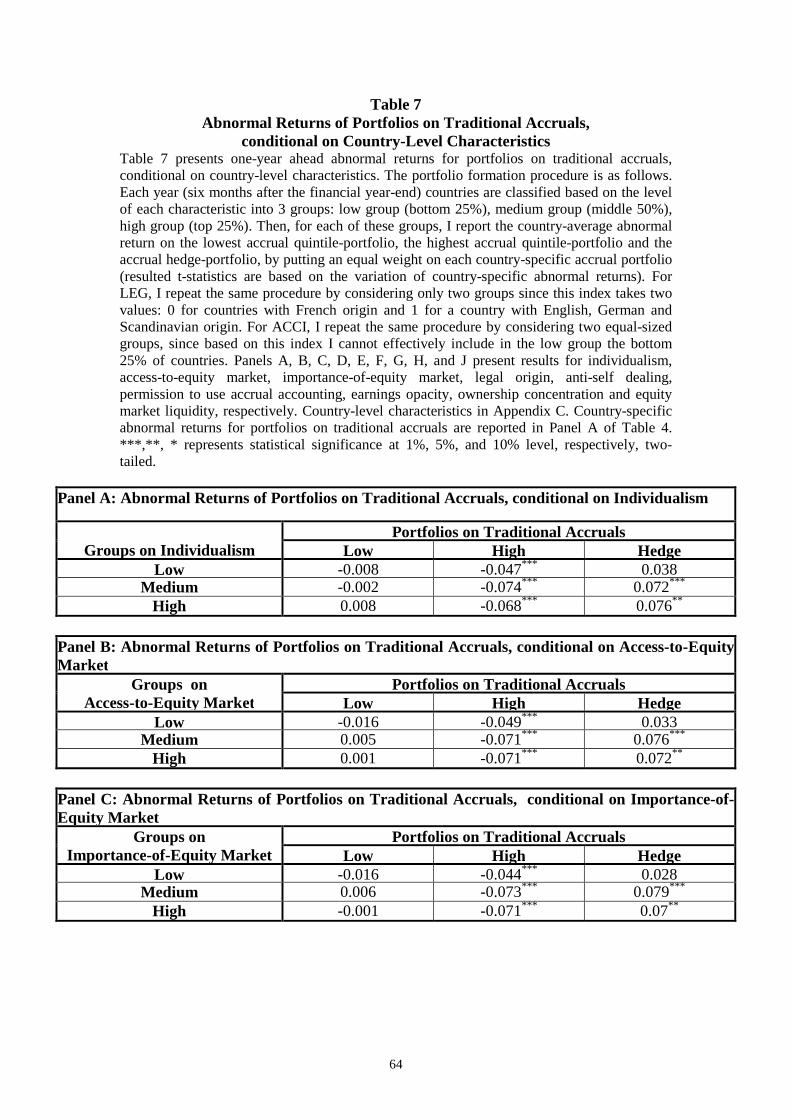
64
Table 7 Abnormal Returns of Portfolios on Traditional Accruals,
conditional on Country-Level Characteristics Table 7 presents one-year ahead abnormal returns for portfolios on traditional accruals, conditional on country-level characteristics. The portfolio formation procedure is as follows. Each year (six months after the financial year-end) countries are classified based on the level of each characteristic into 3 groups: low group (bottom 25%), medium group (middle 50%), high group (top 25%). Then, for each of these groups, I report the country-average abnormal return on the lowest accrual quintile-portfolio, the highest accrual quintile-portfolio and the accrual hedge-portfolio, by putting an equal weight on each country-specific accrual portfolio (resulted t-statistics are based on the variation of country-specific abnormal returns). For LEG, I repeat the same procedure by considering only two groups since this index takes two values: 0 for countries with French origin and 1 for a country with English, German and Scandinavian origin. For ACCI, I repeat the same procedure by considering two equal-sized groups, since based on this index I cannot effectively include in the low group the bottom 25% of countries. Panels A, B, C, D, E, F, G, H, and J present results for individualism, access-to-equity market, importance-of-equity market, legal origin, anti-self dealing, permission to use accrual accounting, earnings opacity, ownership concentration and equity market liquidity, respectively. Country-level characteristics in Appendix C. Country-specific abnormal returns for portfolios on traditional accruals are reported in Panel A of Table 4. ***,**, * represents statistical significance at 1%, 5%, and 10% level, respectively, two-tailed.
Panel A: Abnormal Returns of Portfolios on Traditional Accruals, conditional on Individualism
Portfolios on Traditional Accruals Groups on Individualism Low High Hedge
Low -0.008 -0.047*** 0.038 Medium -0.002 -0.074*** 0.072***
High 0.008 -0.068*** 0.076**
Panel B: Abnormal Returns of Portfolios on Traditional Accruals, conditional on Access-to-Equity Market
Portfolios on Traditional Accruals Groups on Access-to-Equity Market Low High Hedge
Low -0.016 -0.049*** 0.033 Medium 0.005 -0.071*** 0.076***
High 0.001 -0.071*** 0.072**
Panel C: Abnormal Returns of Portfolios on Traditional Accruals, conditional on Importance-of- Equity Market
Portfolios on Traditional Accruals Groups on Importance-of-Equity Market Low High Hedge
Low -0.016 -0.044*** 0.028 Medium 0.006 -0.073*** 0.079***
High -0.001 -0.071*** 0.07**
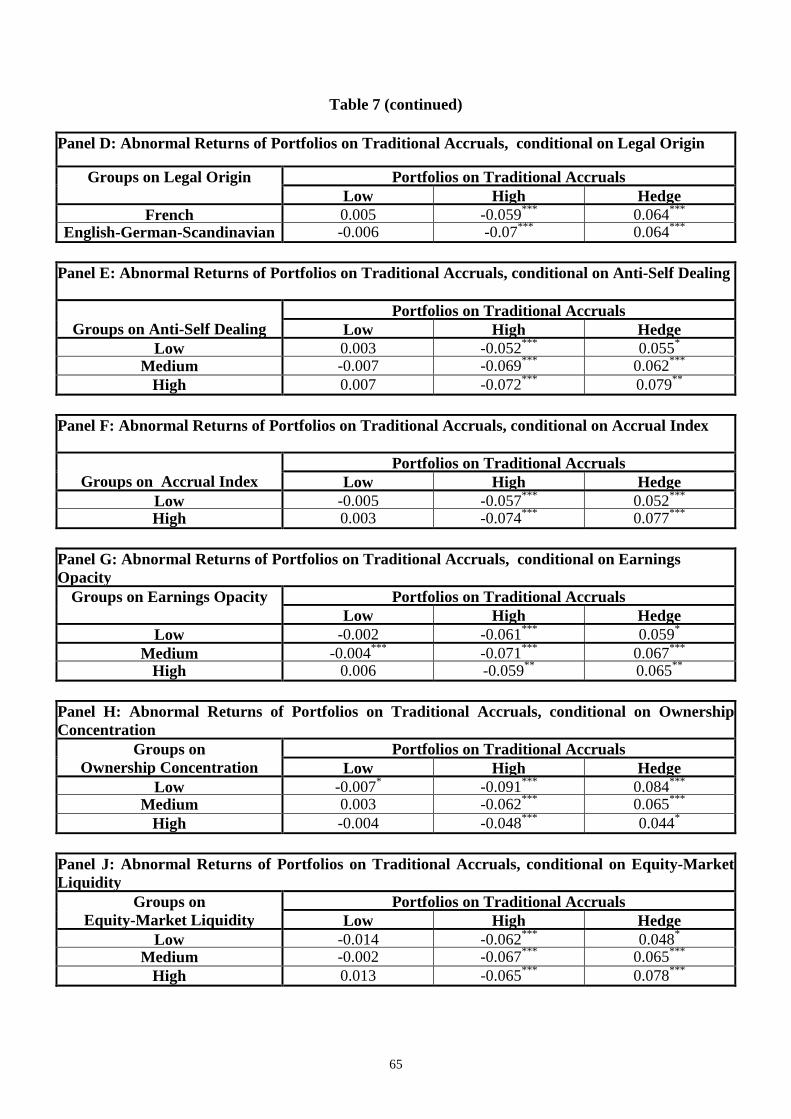
65
Table 7 (continued)
Panel D: Abnormal Returns of Portfolios on Traditional Accruals, conditional on Legal Origin Portfolios on Traditional Accruals Groups on Legal Origin
Low High Hedge French 0.005 -0.059*** 0.064***
English-German-Scandinavian -0.006 -0.07*** 0.064***
Panel E: Abnormal Returns of Portfolios on Traditional Accruals, conditional on Anti-Self Dealing
Portfolios on Traditional Accruals Groups on Anti -Self Dealing Low High Hedge
Low 0.003 -0.052*** 0.055* Medium -0.007 -0.069*** 0.062***
High 0.007 -0.072*** 0.079**
Panel F: Abnormal Returns of Portfolios on Traditional Accruals, conditional on Accrual Index
Portfolios on Traditional Accruals Groups on Accrual Index Low High Hedge
Low -0.005 -0.057*** 0.052*** High 0.003 -0.074*** 0.077***
Panel G: Abnormal Returns of Portfolios on Traditional Accruals, conditional on Earnings Opacity
Portfolios on Traditional Accruals Groups on Earnings Opacity Low High Hedge
Low -0.002 -0.061*** 0.059* Medium -0.004*** -0.071*** 0.067***
High 0.006 -0.059** 0.065**
Panel H: Abnormal Returns of Portfolios on Traditional Accruals, conditional on Ownership Concentration
Portfolios on Traditional Accruals Groups on Ownership Concentration Low High Hedge
Low -0.007* -0.091*** 0.084*** Medium 0.003 -0.062*** 0.065***
High -0.004 -0.048*** 0.044*
Panel J: Abnormal Returns of Portfolios on Traditional Accruals, conditional on Equity-Market L iquidity
Portfolios on Traditional Accruals Groups on Equity-Market L iquidity Low High Hedge
Low -0.014 -0.062*** 0.048* Medium -0.002 -0.067*** 0.065***
High 0.013 -0.065*** 0.078***

66
Table 8 Abnormal Returns of Portfolios on Percent Accruals,
conditional on Country-Level Characteristics Table 8 presents one-year ahead abnormal returns for portfolios on percent accruals, conditional on country-level characteristics. The portfolio formation procedure is as follows. Each year (six months after the financial year-end) countries are classified based on the level of each characteristic into 3 groups: low group (bottom 25%), medium group (middle 50%), high group (top 25%). Then, for each of these groups, I report the country-average abnormal return on the lowest accrual quintile-portfolio, the highest accrual quintile-portfolio and the accrual hedge-portfolio, by putting an equal weight on each country-specific accrual portfolio (resulted t-statistics are based on the variation of country-specific abnormal returns). For LEG, I repeat the same procedure by considering only two groups since this index takes two values: 0 for countries with French origin and 1 for a country with English, German and Scandinavian origin. For ACCI, I repeat the same procedure by considering two equal-sized groups, since based on this index I cannot effectively include in the low group the bottom 25% of countries. Panels A, B, C, D, E, F, G, H, and J present results for individualism, access-to-equity market, importance-of-equity market, legal origin, anti-self dealing, permission to use accrual accounting, earnings opacity, ownership concentration and equity market liquidity, respectively. Country-level characteristics in Appendix C. Country-specific abnormal returns for portfolios on percent accruals are reported in Panel B of Table 4. ***,**, * represents statistical significance at 1%, 5%, and 10% level, respectively, two-tailed.
Panel A: Abnormal Returns of Portfolios on Percent Accruals, conditional on Individualism
Portfolios on Percent Accruals Groups on Individualism Low High Hedge
Low -0.011 -0.019 0.008 Medium 0.017 -0.05*** 0.067***
High 0.025* -0.046*** 0.071***
Panel B: Abnormal Returns of Portfolios on Percent Accruals, conditional on Access-to-Equity Market
Portfolios on Percent Accruals Groups on Access-to-Equity Market Low High Hedge
Low -0.006 -0.03** 0.024 Medium 0.015 -0.047*** 0.062***
High 0.021** -0.042** 0.063**
Panel C: Abnormal Returns of Portfolios on Percent Accruals, conditional on Importance-of- Equity Market
Portfolios on Percent Accruals Groups on Importance-of Equity-Market Low High Hedge
Low -0.019 -0.017 -0.002 Medium 0.022** -0.053*** 0.075***
High 0.021** -0.044** 0.065**

67
Table 8 (continued)
Panel D: Abnormal Returns of Portfolios on Percent Accruals, conditional on Legal Origin
Portfolios on Percent Accruals Groups on Legal Origin Low High Hedge
French 0.006 -0.039*** 0.045** English-German-Scandinavian 0.016** -0.043*** 0.059***
Panel E: Abnormal Returns of Portfolios on Percent Accruals, conditional on Anti-Self Dealing
Portfolios on Percent Accruals Groups on Anti -Self Dealing Low High Hedge
Low 0.002 -0.023 0.025 Medium 0.003 -0.049*** 0.052***
High 0.039** -0.044*** 0.083***
Panel F: Abnormal Returns of Portfolios on Percent Accruals, conditional on Accrual Index
Portfolios on Percent Accruals Groups on Accrual Index Low High Hedge
Low 0.001 -0.03*** 0.031* High 0.023*** -0.053*** 0.076***
Panel G: Abnormal Returns of Portfolios on Percent Accruals, conditional on Earnings Opacity
Portfolios on Percent Accruals Groups on Earnings Opacity
Low High Hedge Low 0.019 -0.038*** 0.058
Medium 0.013* -0.047*** 0.06*** High 0.001 -0.033 0.034
Panel H: Abnormal Returns of Portfolios on Percent Accruals, conditional on Ownership Concentration
Portfolios on Percent Accruals Groups on Ownership Concentration Low High Hedge
Low 0.014 -0.06*** 0.074*** Medium 0.013 -0.041*** 0.054***
High 0.007 -0.023 0.03
Panel J: Abnormal Returns of Portfolios on Percent Accruals, conditional on Equity-Market L iquidity
Portfolios on Percent Accruals Groups on Equity-Market L iquidity Low High Hedge
Low 0.015 -0.041** 0.055* Medium 0.003 -0.038*** 0.041**
High 0.021* -0.055*** 0.076***