accounting consistency and earnings quality · earnings quality is a frequently studied, albeit...
TRANSCRIPT

Accounting consistency and earnings quality†
Kyle Peterson
University of Oregon
Roy Schmardebeck
University of Arkansas
T. Jeffrey Wilks
Brigham Young University
August 2013
Abstract:
We specify measures of accounting consistency based on the textual similarity of accounting
policy footnotes both across time and within industry and we examine how these measures relate
to earnings quality. Consistency over time is positively associated with earnings quality, as
proxied by earnings persistence, predictability, smoothness, accrual quality, and absolute
discretionary accruals. We also find a positive association between accounting consistency
within industry and accrual quality and absolute discretionary accruals proxies, but this positive
association stems from measurement error in the earnings quality proxies. Our results suggest
that accounting consistency is an important factor in the measurement of earnings quality.
JEL classification: M41
Keywords: accounting policies, comparability, consistency, earnings quality, accrual estimation,
accrual quality
† We appreciate the helpful comments of Bob Bowen, Cory Cassell, Michael Drake, Adam Esplin, Dave Folsom,
Steve Matsunaga, Rick Mergenthaler, Ken Merkley, James Myers, Linda Myers, Gary Taylor, Jenny Tucker,
Rodrigo Verdi, Peter Wilson, and workshop and conference participants at the Brigham Young University
Accounting Symposium, the 2010 UBCOW Conference, the 2011 AAA Annual Meeting, and the University of
Arkansas.
1. Introduction
Earnings quality is a frequently studied, albeit elusive, construct in accounting research.
The large surge of research on earnings quality has prompted some recent reflection about what
earnings quality is and the importance of measurement in this research. Dechow et al. (2010)
note that various proxies are used for earnings quality and that each of these proxies capture
different aspects of quality. Despite the large existing literature, they suggest additional research
is needed to better understand the underlying mechanisms inherent in earnings quality proxies.
In contrast, comparability has received little attention in the literature despite the fact that
regulators and standard setters have preached the importance of comparability for decades
(FASB, 1980; FASB, 2010; SEC, 2000). Comparability is an enhancing characteristic of
financial reporting that enables investors, creditors, and regulators to identify similarities and
differences across firms and within the same firm over time (FASB, 2010). Regulators identify
financial reporting consistency over time and across firms as an important and measurable aspect
of comparability (FASB, 1980, 2010). With the development of a measure of comparability in
DeFranco et al. (2011), researchers are beginning to examine the effects of comparability.
However, no studies in extant literature have measured consistency nor examined the relation
between consistent accounting policy choices and accounting outputs.
Our objective is to examine the relationship between consistency and earnings quality.
There are a few reasons why consistency and earnings quality should be related. Consistency in
the time series reflects the use of the same accounting policies over time. Dechow et al. (2010)
argue that many of the earnings quality proxies are based on earnings and therefore comingle the
firm’s fundamental performance and the measurement of that performance. Ceteris paribus, with
more consistent accounting policies across time the reported earnings become a better measure

2
of fundamental performance because measurement of earnings is more constrained. In essence,
consistency in accounting policies makes the measurement of earnings quality less of a moving
target, thereby improving earnings quality estimates. A recent survey of Chief Financial Officers
(CFOs) supports this claim. In this survey, Dichev et al. (2013) find that 94 percent of CFOs
believe that high quality earnings reflect consistent accounting policies choices over time. Given
this virtually unanimous belief among CFOs, an empirical analysis understanding the effect of
consistency on earnings quality proxies is warranted.
The relation between cross-sectional consistency and earnings quality is more nuanced.
We do not recognize a theoretical relationship between cross-sectional consistency and earnings
quality, but highlight there may be an empirical relationship between consistency and some
proxies for earnings quality because of the way that these proxies are estimated by researchers.
For example, cross-sectional proxies of earnings quality such as accrual quality and discretionary
accruals may be related to consistency. Researchers typically claim that firms with extreme
estimates from these accrual models (e.g., Jones, 1991; Dechow and Dichev 2002; Kothari et al.
2005; Hribar and Nichols 2007; Dechow et al. 2010) represent lower earnings quality with the
implicit assumption that the accounting is similar across these firms since they are estimated
within industry. However, the accounting policies within an industry may not be homogenous
and differences in accruals quality may be capturing differences in the consistency of accounting
policy choices among companies within an industry. Prior research does not examine how
accounting consistency within an industry impact the estimation of accruals quality proxies.
In this paper, we develop measures of consistency that allow us to test the relation
between consistency and earnings quality. The DeFranco et al. (2011) comparability measure is
not a viable alternative because the measure is based on an earnings response coefficient (ERC)

3
framework, which is itself a measure of earnings quality. This feature would make it difficult to
disentangle a true consistency effect from the earnings quality inherent in their measure. In
addition, the DeFranco et al. (2011) measure only captures cross-sectional comparability and
therefore cannot address the consistency aspect of comparability over time that we argue is an
underlying component of earnings quality.
Our measures of accounting consistency do not rely on earnings itself and thus allow us
to measure the relation between consistent accounting policy choice and earnings quality. We
measure consistency based on textual similarities of accounting policies found in the footnotes of
financial statements in 10-K filings. Relying on textual similarities provides a more exogenous
consistency estimate from the earnings quality proxies themselves. Across time, we measure
consistency as the average similarity of a firm’s policy footnote from year to year. In the cross
section, we measure consistency across firms as the pairwise similarity of a firm’s policy
footnote to all other firms’ policy footnotes in the same two-digit SIC. Both measures of
consistency rely on a vector space model (Salton et al., 1975) that captures the similarity of
words used in two documents. This approach was used by Brown and Tucker (2011) to examine
time series changes in MD&A disclosures.
We validate our time series consistency measure by estimating a model of factors we
expect to influence accounting policy choices for a firm over time. Our results suggest that larger
firms have more consistent accounting policies over time, while auditor changes, CFO changes,
special items, debt and equity issuances, and mergers reduce time series consistency. We also
find that firms with low time series consistency have an increase in abnormal audit fees. We
validate the cross-sectional consistency measure by examining the consistency of firms both
within and across a subsample of industries. Although we are interested in the within industry

4
variation in consistency, the validation of our measure across and within industries confirms that
our cross-sectional proxy captures differences in accounting policies across firms. For a sample
of six diverse industries, we find that accounting policy consistency scores are significantly
higher when we compare firms within an industry than when we compare firms across industries.
In our main tests, we examine the relation between consistency and different measures of
earnings quality. As suggested by Dechow et al. (2010), we do not expect consistency will be
associated with all the proxies for earnings quality and therefore focus our efforts on a subset of
proxies where we expect a relationship. In the time-series, we examine the relation between
consistency and earnings persistence, predictability, and smoothness as well as accrual quality
and discretionary accrual estimates. In additional analysis, we also test the relation between
consistency and ERCs. We find that the consistent use of accounting policies is associated with
higher persistence, predictability, and smoothness of earnings as well as better accrual quality
and discretionary accrual estimates. The marginal effects of consistency on earnings quality
proxies can be quite significant. For example, a one standard deviation change in our measure of
consistency increases the persistence of earnings by 3.6 percent and predictability by 8.2 percent.
These time-series results control for the effects of firm size, growth, operating cycle, volatility,
and significant events likely to affect accruals such as mergers, auditor changes, and special
items. We also find a positive relation between consistency and ERCs, but that effect is
subsumed once we control for the relation between ERCs and earnings persistence.
In the cross-section, we examine the effect of consistency on cross-sectional proxies of
earnings quality like accrual quality and the magnitude of discretionary accruals. Our cross-
sectional tests reveal that firms with high cross-sectional consistency have significantly lower
absolute residual estimates from accrual quality and discretionary accruals models. These tests

5
control for the effects of size, growth, operating cycle, volatility, complexity of operations, the
nature of assets in operation, and significant events likely to affect accruals such as mergers,
auditor changes, and special items. The results suggest that firms with more consistent
accounting policies relative to other firms in the industry will be interpreted as having higher
earnings quality. However, since accounting differences across firms do not necessarily reflect
actual quality differences this results in measurement error for these earnings quality proxies.
Our paper makes a few important contributions to the literature. First, relative to other
qualitative characteristics of financial reporting like relevance, timeliness, and faithful
representation, there has been very little research on the role of comparability in financial
reporting until recently (DeFranco et al., 2011; Bradshaw et al., 2009; Campbell and Yeung,
2012; Fang et al., 2012; Kim et al., 2013; Barth et al., 2013). We contribute to this new research
stream by providing evidence that consistency, an important aspect of comparability, affects
earnings quality as measured by persistence, predictability, smoothness, and accrual estimates.1
Our study also suggests that disclosures about significant accounting policies contain important
comparative information for a particular firm over time and for firms within the same industry.
To the extent that standard setters and regulators want to help financial statement users identify
earnings quality, they may want to draw attention to differences in accounting policies across
firms and over time.
Another contribution of our research is to provide a better understanding of a particular
facet of earnings quality that has previously been unexamined. We provide evidence that some
1 Although DeFranco et al. (2011) conduct univariate benchmark tests of the association between their
measure of comparability and earnings quality measures such as accrual quality, predictability, and smoothness,
their tests do not provide sufficient evidence on the role of consistency or comparability in affecting earnings
quality. This is in part because they did not intend to study this relationship, and so they did not make use of a
multivariate analysis to control for economic differences across firms. Also, their measure of comparability is based
on an ERC framework, making it difficult to isolate a comparability effect from an earnings quality effect using their
measure.

6
earnings quality proxies are significantly influenced by accounting consistency. To the extent
that a researcher or decision user wants to include or exclude consistency in their measurement
of earnings quality (based on the decision context), our paper provides the justification and the
proxies of consistency to do so. We also highlight that using cross-sectional estimates of accrual
quality and discretionary accruals as proxies for earnings quality also captures consistency
differences that could affect inferences. Therefore, in situations where researchers want to
control for differences in accounting policies, we provide a measure whereby researchers can
control for cross-sectional consistency of accounting policies particularly when using cross-
sectional estimates of accrual quality and discretionary accruals as proxies for earnings quality.
The paper proceeds with a discussion of prior literature and our hypotheses in Section 2.
Section 3 defines our empirical measurement and describes our sample. Sections 4 and 5
describe our time series and cross-section tests, respectively. We provide some additional
analysis in Section 6 and conclude in Section 7.
2. Prior Literature and Hypotheses
Dechow et al. (2010) define higher quality earnings as providing “more information
about the features of a firm’s financial performance that are relevant to a specific decision made
by a specific decision maker” (pg. 344). Since this definition is intentionally broad, the practical
application of earnings quality will depend on the specific decision context. As such, a number
of proxies have been put forth in the literature to capture different aspects of earnings quality.
While studies have examined each of these proxies, Dechow et al. (2010) assert that a lot
remains unexplained. We attempt to shed some additional light on earnings quality by examining
the relationship between consistency and earnings quality.
The FASB’s concept statement defines comparability as “the qualitative characteristic

7
that enables users to identify and understand similarities in, and differences among, items,” and
claim this is a desirable property of accounting (FASB 2010). They also state that consistency is
“the use of the same methods for the same items, either from period to period within a reporting
entity or in a single period across entities” and helps to achieve the goal of comparability. As
such, regulators identify accounting policy consistency as an important aspect of comparability.
Until DeFranco et al. (2011) developed a measure of comparability across firms, research
on comparability was virtually nonexistent.2 Their accounting comparability measure uses an
earnings returns framework to estimate the similarity between firms’ accounting functions. They
find accounting comparability is associated with better information processing by analysts,
including increased analyst coverage and forecast accuracy, and decreased dispersion in earnings
forecasts. DeFranco et al. (2011) also conduct preliminary benchmark tests of the association
between their measure of comparability and earnings attributes like accrual quality,
predictability, and smoothness. However, there is some concern about using this univariate
analysis as evidence that comparability is associated with earnings quality, which suggests
further analysis is warranted. First, their measure of comparability is based on an ERC
framework, and ERCs are frequently used as a measure of earnings quality. Therefore, it is not
possible to conclude these results are driven by comparability per se.3 Second, DeFranco et al.
2 The notion of comparability was not entirely lost on the empirical literature, only that research explicitly
examining the topic had not been conducted. At a very basic level, many studies use industries controls or examine
attributes within industries to identify comparable firms. Other studies have examined accounting and disclosure
diversity in international settings (e.g., Hope, 2003; Joos and Lang, 1994). 3 This is especially a concern in their earnings attribute tests from Table 2 (page 11). In Panel C, they show a
significant association between their comparability measure and reporting a profit or loss, suggesting their measure
is still correlated with performance. However, this result may not be surprising because prior research suggests there
is an association between loss and profit firms and earnings response coefficients (Hayn, 1995), which is the basis of
the DeFranco et al. (2011) measure. Other research also suggests a similar association between predictability and
earnings response coefficients (Easton and Zmijewski, 1989; Kormendi and Lipe, 1987) and accrual quality and
earnings response coefficients (DeFond and Park, 2001; Liu and Thomas, 2000). Given these prior studies do not
use comparability as a motivation to examine the relationship between these attributes and earnings response
coefficients, it is difficult to determine whether the earnings attribute results in DeFranco et al. (2011) are due to

8
(2011) provide no evidence about the effect of time-series consistency on earnings quality. The
identification of a measure of comparability has sparked additional studies examining
comparability and attention to peer firms’ restatements (Campbell and Yeung, 2013), the role of
reporting standards on comparability (Barth et al., 2013), and the association between
comparability and debt contracting and pricing (Fang et al., 2012; Kim et al., 2013). However,
none of these studies specifically examine the influence of comparability or consistency on
earnings quality.
Consistency in the time series reflects the use of the same accounting policies over time.
By its nature consistency does not reflect firm performance per se, but the consistent application
of the measurement of performance. This is an important issue raised by Dechow et al. (2010) in
that many of the earnings quality proxies are based on earnings and therefore comingle the firm’s
fundamental performance and the measurement of that performance. With more consistent
measurement of earnings across time, the reported earnings become a better measure of
fundamental performance because measurement is more constrained. Chief Financial Officers
(CFOs) support this claim. When asked what features reflect high quality earnings, 94 percent of
CFOs agreed that consistent reporting choices over time reflect higher quality. Consistency also
ranked the highest in terms of agreement by CFOs, even higher than the ability to predict future
earnings or future cash flows. For these reasons, we predict accounting consistency in the time
series to be positively associated with earnings quality.
We recognize that consistency should not necessarily be associated with all proxies for
earnings quality, and therefore focus our analysis on the proxies we think are most likely to be
affected by consistency. For our time series consistency tests, we focus on persistence and
comparability or these prior alternative explanations.

9
predictability of earnings, smoothness, and accrual model proxies estimated in the time series.
Ceteris paribus, more consistent application of accounting over time should result in less
variation of earnings and accruals, which should directly influence these proxies because they
attempt to measure variation or abnormal performance. These particular proxies are also
summary measures incorporating all the activities of the firm, which is important when
examining the whole system of accounting choices. Furthermore, earnings, accruals, and the
relation between cash flows and accruals are explicitly defined by the accounting policies used to
generate earnings and accruals. We predict a positive relation between consistency in the time
series and earnings persistence, predictability and smoothness. We also predict a negative
relation between consistency in the time series and absolute residuals from accrual quality and
discretionary accruals models.
We acknowledge the possibility that the actual reporting choices themselves, and not the
consistency of those choices, can have a large effect on earnings quality. For example, certain
accounting choices could lead to more or less predictable earnings even in the absence of
accounting changes. Our measure of consistency incorporates all changes to policies, whether
those changes make earnings more or less persistent and predictable. This is our intent since we
are interested how accounting changes themselves, irrespective of the nature of those changes,
affect earnings quality. We assume the effect of particular accounting choices (e.g., LIFO, FIFO,
or Weighted-average) average out across firms for those with different levels of consistency.4
In contrast to the hypothesis related to time series consistency, we do not expect a
4 Even if this assumption is incorrect, it is hard to make a case that it would bias our results. For that to occur, it
would have to be true that when managers change accounting policies, they generally move from policies that make
earnings of higher quality to policies that make lower quality earnings. We think this is unlikely based on evidence
from Graham et al. (2005) that an overwhelming number (almost 97 percent) of CFOs surveyed prefer smooth,
predictable earnings. As such, 78 percent of executives suggested that they would be willing to give up economic
value in exchange for predictable earnings. These findings suggest that executives would be unlikely to consistently
change to accounting policies that create more volatile earnings.

10
theoretical relation between cross-sectional accounting consistency, or the consistency across
firms, and earnings quality. Since different firms in the same industry may have different
business models or operating strategies (and therefore different accounting policies), one cannot
conclude that the differences or similarities in accounting consistency are evidence of higher or
lower earnings quality. In the software industry (SIC 7372), some firms offer subscription-based
software services (Symantec Inc.) while others sell prepackaged software (Electronic Arts Inc.).
Likewise, some service the whole computing market (Adobe Systems Inc.), while others target a
specific industry (CareFusion Corporation). Even firms with the same business model can make
different accounting choices (FIFO versus LIFO) that would not necessarily be evidence of
earnings quality. However, we recognize there may be an empirical relationship between cross-
sectional consistency and some proxies for earnings quality.
Earnings quality proxies that are estimated in the cross section like accrual quality and
discretionary accruals may be particularly susceptible to differences in consistency. Researchers
typically claim that firms with extreme estimates from these accrual models represent lower
earnings quality with the implicit assumption that the economics and accounting is similar across
these firms since they are estimated within industry. To the extent that firms do face similar
economics, their latitude in accounting policy choices to represent those events could lead to
similarities or differences in accrual estimation that should not be attributed to earnings quality.
For these reasons we expect a positive relation between cross-sectional consistency and accrual
model estimates of earnings quality since these are proxies where consistency may affect
measurement.5
5 In the cross section, we do not hypothesize about or test the effect of consistency on earnings persistence,
predictability and smoothness because our cross-sectional measure does not capture whether firms who are different
from others in the industry follow policies that would produce more or less variable earnings. For example, a firm

11
We focus our tests on particular earnings quality proxies that we think are directly
affected by consistency. Dechow et al. (2010) list other proxies for earnings quality such as
timely loss recognition, beating earnings benchmarks, ERCs, and other external indicators such
as restatements and internal control deficiencies. For these other proxies we expect either no
relation or an indirect relation with consistency. Although none of these proxies are examined in
the main analysis, we do examine the effect of consistency on ERCs in additional analysis. In the
next section, we discuss our measurement of earnings quality and consistency proxies and
describe the sample.
3. Measurement and Sample
3.1 Measuring accounting consistency
We measure accounting consistency by employing a vector space model widely used in
computer science that allows for the comparison of strings of text or documents (Salton et al.,
1975). This model was also recently used in Brown and Tucker (2011), where they estimate the
similarity of management discussion and analysis (MD&A) over time. We apply the model to
the annual accounting policy disclosures found in the notes to the financial statements, which we
obtained from 10-K filings on the Edgar database. The model converts text into a vector based
on the unique words found in the text after removing stop words and stemming the remaining
words.6 The value for a particular word in the vector is one if the stemmed word occurs in the
that is different from others in its industry simply because it elects a fair value option more often than its competitors
might have more variable earnings as a result. At the same time, a firm that is different from others in its industry
simply because it does not elect the fair value option as often as its competitors might have less variable earnings as
a result. Because our proxy only measures policy differences and not the nature of those differences, we do not
hypothesize or test the effects of comparability on earnings persistence, predictability, and smoothness in the cross
section. 6 Stop words include common words that do not add content (e.g., ‘and’, ‘will’, ‘because’, ‘that’). Stemming is
the process of removing suffixes from words to obtain root words. Typical suffixes include ‘s’, ‘ed’, ‘ing’, ‘ion’.

12
text and zero if missing.
Two different texts can then be compared by measuring the cosine of the angle between
the vectors. The cosine measure calculates the similarity between two documents represented by
V1 and V2 is as follows:
21
21
VV
VVθcos
(1)
where 21 VV represents the dot product and iV represents the vector norm ii VV . The
cosine’s range is [0,1], where zero means the two texts have no similarity and one means the
texts use identical words. We use this cosine measure to calculate accounting consistency. For
the time series tests, we calculate the cosine measure using the firm’s current and prior year
disclosure (TSConsistency). We then take the mean cosine measure for the firm over the sample
period as the measure of consistency in our time series tests (AveTSConsistency). We collapse
the time series consistency scores into one proxy because most of our dependent variables for the
time series tests, accrual quality, persistence, predictability, and smoothness, must be estimated
over a sample period. For the cross-section tests, we calculate the cosine measure for a firm and
every other firm in the industry using 2-digit SIC.7 The mean cosine measure for the firm relative
to all other firms in the industry is our measure of accounting consistency in the cross section
(AveCSConsistency).
Brown and Tucker (2011) argue that using the raw cosine score is problematic because
the cosine measure is increasing in disclosure length. They argue that longer disclosures lead to
higher similarity scores because the probability the word will appear in both disclosures
7 Our inferences from the cross-sectional tests are similar if we use 3-digit SIC instead of 2-digit SIC.

13
increases. To address this concern, Brown and Tucker (2011) adjust their similarity score by
regressing out the effect of length using a Taylor Expansion of disclosure length. In untabulated
results, we address this concern about disclosure length in our study using two alternative
approaches.8 First, we adjust our TSConsistency and AveCSConsistency scores using the
approach that regresses out the effect of disclosure length outlined in Appendix B of Brown and
Tucker (2011). Second, we also calculate measures of AveTSConsistency and AveCSConsistency
after first filtering out all words in the disclosure that do not appear in an accounting dictionary.
We created this dictionary using all the words from a comprehensive set of United States
accounting regulations.9 This filtering removes the effect of firms’ accounting policies appearing
more similar by including more words. 10
Untabulated results using either the Brown and Tucker
(2011) approach or the dictionary filtered approach show similar results numerically and
statistically to those presented in the paper.
As with any model, the vector space model has certain advantages and limitations that
could impact our measurement of accounting consistency. One important advantage is it
provides an objective and intuitive measure of consistency of the accounting policies with
realistic computational requirements. However, there are some limitations. The most apparent
limitation is that the model is insensitive to semantics, meaning the use of different words with
similar meanings will result in non-matches. Furthermore, the model only identifies words, not
8 While some may believe that accounting policy disclosures are boilerplate disclosures and do not vary
significantly across firms in the same industry, we note in untabulated results there is considerable variation in the
disclosure length within industry. The mean industry accounting policy disclosure length is 2,688 words, while the
mean standard deviation of disclosure length within industry is 1,577 words. 9 The regulations include FASB Statements, EITFs, APB Opinions, Accounting Research Bulletins (ARB),
FASB Technical Bulletins, FASB Staff Positions, FASB Interpretations, AICPA Practice Bulletins, and AICPA
Statements of Position. 10
As expected, the filtered mean AveTSConsistency and AveCSConsistency scores are higher than the unfiltered
scores presented in Table 2 and Table 5. However, the correlations between the filtered and unfiltered measures are
greater than 0.96, suggesting that the dictionary filtering process mostly removes words specific to that firm (e.g.,
name of the company, business lines, or products).

14
phrases, although phrases may reflect similarity better than words in some cases. This is clear
when deconstructing the phrases “deferred revenue”, “deferred financing”, and “deferred taxes”
into their separate words, which removes the meaning inherent in these phrases.
The model also does not evaluate the position of the word in the text, so two identical
words being used to discuss different accounting policies will be identified as similar. For
example, the use of the word “amortization” could refer to intangibles or bond
premium/discount. The measure also treats every word (except the stop words) as equally
important; however, it could be that certain words/phrases are more important at identifying
similarity than others. All of these limitations increase the noise of our measure, biasing against
finding a relation between accounting consistency and earnings attributes. However, similar to
the development of the literature on discretionary accruals, we hope future research can refine or
improve upon the measure of consistency introduced here.
While this measure of consistency allows us to more clearly test the relation between
consistency and earnings quality, we also suggest it as an alternative measure of comparability in
future research. We outline a few main differences between our measures and the DeFranco et al.
(2011) measure to help researchers be more informed about their design choices. First, our
measure is an input measure of accounting comparability because we measure comparability as
the similarity in accounting policies, which should not capture variation in actual performance.
The DeFranco et al. (2011) proxy, on the other hand, is an output measure because it measures
comparability through firms’ earnings-returns relation. We recognize there are limitations to
measures of comparability using either an output or input based approach.11
However, we think
11
DeFranco et al. (2011 p.4) discuss the difficulties with using an input measure of comparability based on
accounting policies. They specifically mention that researchers must make difficult design choices with such a
measure and that data can be difficult to obtain for such measures. Our measure alleviates some of these concerns,

15
that a non-earnings output based measure of comparability can be helpful in understanding how a
first-order measure of accounting comparability affects earnings quality, and such a measure
could be useful in future research. Indeed, at this early stage of research into the effects of
comparability, it is important to develop multiple proxies for comparability, particularly when
those proxies have the potential to shed light on different aspects of comparability.
Second, their measure incorporates the full application of accounting policies and the
ultimate effect on earnings, while our measure relies upon the policy description and not
necessarily its application. For example, two firms may describe identical policies for accounting
for goodwill impairments. However, the details in the application of that policy, such as the fair
value measurements, play a role in determining if two firms have similar accounting
treatments.12
In a sense, our measure has much less potential for showing an effect because it is
based solely on the accounting policies as management describes them. As a result, if our
measure of comparability affects earnings quality, we can argue that even the most basic
elements of comparability—without any consideration of implementation differences or market
reactions to those choices—have a significant effect.
Finally, while an output comparability measure may be more meaningful economically,
the measure imposes a functional form on earnings that may not be accurate and may capture
additional effects besides accounting such as investors’ expectation of earnings at the beginning
of the return period, growth prospects (Collins and Kothari, 1989), and market inefficiency (e.g.,
Bernard and Thomas, 1990). Our measure avoids these concerns by using the similarity of the
but does rely on simplifying assumptions about the nature of textual similarities as discussed above.
12 In cases where judgment is necessary, it is generally difficult to determine whether different accounting
treatments are due to differences in implementing the accounting rules or true economic differences across firms.
This can create a problem with an output measure of comparability because where two firms may appear less
comparable, this lower comparability may be due to economic differences, not different applications of accounting
policies.

16
textual description of accounting policies in financial reports.
Given the linguistic limitations mentioned previously and because our measure of
comparability is a summary statistic of relatively long disclosures, we provide some granularity
into our cross-sectional consistency measure in Appendix B. We do this by presenting example
disclosures of specific sections of the accounting policies for firms in similar industries that
result in both high and low AveCSConsistency scores. In the first example, we present the
revenue recognition policies for Alaska Air Group, American Airlines, and Allegiant Travel
Company.
Allegiant Travel discloses that they participate in fixed fee contracts for providing charter
services and ancillary revenues from sale of hotel rooms and rental cars. However, Alaska Air
Group and American Airlines do not disclose revenue recognition policies related to fixed fee
contracts or ancillary revenues. However, Alaska Air Group and American Airlines do appear to
disclose similar revenue recognition policies related to passenger revenue. When we calculate
AveCSConsistency scores for the three firms, we find that Allegiant Travel’s consistency score
with Alaska Air Group is 0.3357 and with American Airlines is 0.2733. In contrast, the
consistency score between Alaska Air Group and American Airline is 0.5065. This example and
the others in Appendix B provide assurance that our consistency measure captures similarities
and differences in accounting policies across firms within an industry.
3.2. Measuring earnings quality
For our time series and cross-section tests, we utilize similar variables of accrual quality
and discretionary accruals that are estimated slightly differently. However, in each case the intent
is to measure how well the accrual model fits for a particular firm by taking the absolute value of
the residuals estimated from the model. Prior research uses discretionary accruals and accrual

17
quality estimates to proxy for earnings quality or earnings management.
Our expectation is that if a firm has less consistent accounting policies over time, this
should be reflected in poorer fitting accrual models because changes in accounting choices
should lead to increased variation in reported accruals. For our time series analysis, we estimate
both accrual models for each firm using the available observations over the sample period. The
standard deviation of the residuals over the sample period is our variable of interest for the time
series tests. This measurement is appropriate in the time-series because the absolute value of the
residuals measures how well the accrual model fits for individual firms over time.
In our cross-sectional tests we estimate the accrual quality and discretionary accruals
models by 2-digit SIC for each year. We take the absolute value of the firm-specific residual to
measure the particular firm’s accrual deviation relative to the other firms in the industry.13
We
think this measurement is appropriate in the cross-section because the absolute value of the
residuals measures how well the accrual model fits for individual firms in the industry.
We follow Dechow and Dichev (2002) to estimate accrual quality (AQ):
t
t
t
t
t
t
t
t
t
A
CFO
A
CFO
A
CFO
A
WCA 1
43
1
21 (2)
where WCAt is working capital accruals defined as (Δ current assets – Δ cash – Δ current
liabilities + Δcurrent debt), At is total assets, and CFO is cash flow from operations.
Our discretionary accruals model controls for accounting performance (ROAt) as
suggested by Kothari et al. (2005):14
13
When we do this for the accrual quality model this is one step short of the actual accrual quality measure
pioneered by Dechow and Dichev (2002) and implemented in other studies (e.g., Doyle et al., 2007). The last step
we omit is we do not take the standard deviation of the residuals over time but just take the firm’s absolute deviation
from the industry estimation for a particular year. For the discretionary accrual model, our measure is identical to
absolute discretionary accruals used in other studies. 14
Chen et al. (2008) and Francis and Yu (2009) use a similar approach to estimate discretionary accruals.

18
(3)
TA is total accruals, defined as (Δ current assets – Δ cash – Δ current liabilities + Δ current debt –
depreciation)/lag(total assets). ΔSALES is the percentage change in sales from the previous year
and PPE is the net property plant and equipment divided by total assets. ROA is net income
before extraordinary items divided by total assets.
In addition to the accrual measures, for our time series tests we also test the relation
between time series accounting consistency and earnings persistence, predictability and
smoothness. We measure these properties consistent with Francis et al. (2004) and DeFranco et
al. (2011). Persistence is the coefficient estimate of the firm-specific regression of earnings per
share on lagged earnings per share. Predictability is the R2 from this same regression of earnings
on lagged earnings. Smoothness is the ratio of the standard deviation of earnings to the standard
deviation of cash flows multiplied by negative one to be increasing in smoothness. Since these
measures are the dependent variables in our time series tests, we estimate these proxies by firm
over the entire sample period.
3.3. Sample Selection
We identify two different samples for our time series and cross-section tests. Table 1
presents the determination of both samples. For both samples we begin by selecting all firms
from Compustat Xpressfeed with non-missing gvkey, cik, assets (at), and net income (ni) and
non-missing permno on CRSP between 1994 and 2008 totaling 76,270 firm years (11,220
firms).15
From this sample we perform a search to obtain the accounting policies section of the
notes to the financial statements. Specifically, we collect all available 10-K and 10-K405 filings
15
The 1994 cutoff and the requirement to have cik are necessary to obtain financial statements from the Edgar
database.
itititititit ROAPPESALESASSETSTA 432110 )/1(

19
for firms in the sample. We then perform a search of these 10-Ks using the Python programming
language to obtain the accounting policies section of the notes to the financial statements.16
Using this process, we are unable to obtain financial statements and/or accounting policy
disclosures for 32,272 observations.
For our time series analysis, we restrict the sample to firms with at least 7 observations in
the sample period and for our cross-section analysis we restrict the sample to industries with at
least 10 firms in the fiscal year. The final samples are 3,641 firms for the time series sample and
32,869 firm-year observations for the cross-section sample.
4. Time Series Earnings Quality Tests
4.1. Descriptive statistics and validation test
Table 2 presents descriptive statistics for the time series sample. In this table we collapse
the time series for each firm. The mean AveTSConsistency across the sample is 0.857, much
higher than the mean AveCSConsistency of 0.510 that we document in Table 5. This is expected
since firms are likely more similar to themselves just one year removed than other firms in the
industry. However, with a standard deviation of 0.04, there appears to be little variation in the
measure. In untabulated tests, we also estimate AveTSConsistency by year and note the lowest
average comparability occurs in years 2001 and 2002, likely due to a number of new standards
becoming effective in these years.17
The average firm had two mergers during the sample period,
16
Since this process has some error, we performed a number of checks and tests on our accounting policy
disclosures to reduce measurement error of our proxy. We manually checked, and fixed where necessary, the longest
and shortest 300 disclosures to correct any programming errors. We excluded observations where the accounting
policy length was less than 200 words or greater than 80 percent of the 10-K length. In addition, we selected a
random sample of 100 disclosures and manually verified their accuracy. The length of the disclosures from the
verified random sample has a correlation of 0.94 with the length of the Python-extracted disclosures, suggesting that
our measurement of these disclosures is relatively accurate. 17
Statements of Financial Accounting Standards 141, 142, 143, 144, 145, 146, 147, and 148 all became effective

20
0.96 auditor changes, 0.518 CEO changes, but only 0.328 CFO changes.
Given our proxy for time series consistency is new, we first validate the measure by
estimating a model of factors we expect to influence time series consistency. We estimate the
following model:
0 1 2 3 4 5
6 7 8 1 9 1
TSConsistency Assets BTM Segments Merger SpItems
Issue ChAuditor ChEO ChCFO
it it it it it it
it it it it it
(4)
We predict positive coefficients for β1 and β2 because we expect larger firms (Assets) and
firms with lower growth (BTM) to have more consistent and stable operations from year to year.
Since accounting policies may change as a firm’s operations change, we expect this to occur
more for smaller firms and growth firm. For example, although a very large firm like Microsoft
may engage in acquisitions and divestitures during a year, these operational changes are likely to
be insignificant to Microsoft based on the size of their current operations. We predict a negative
coefficient for β3 as we expect firms with more operating segments (Segments) to have lower
consistency over time because additional segments subject the firm to more accounting policies
that can change relative to a focused firm. We also expect firms with special items (SpItems),
debt or equity issuances (Issue), and mergers (Merger) in the current year to have less accounting
policy comparability relative to the prior year because the firm should disclose additional
information in the accounting policies regarding those particular transactions/issues. DeFond and
Subramanyam (1998) find that discretionary accruals change when a firm changes auditor,
suggesting that auditor changes could result in different applications of GAAP. CEO and CFO
turnover is also associated with changes in the operations and other financial reporting choices,
which could reduce time-series consistency. Therefore, we expect a change in auditor in the
either in 2001 or 2002.

21
current year (ChAuditor) or a change in Chief Executive Officer (CEO) or Chief Financial
Officer (CFO) in the prior year (ChCEO and ChCFO) to reduce accounting policy
comparability.18
This validation test is estimated by firm-year, while in the time series attribute
tests that follow we collapse the time series for each firm. Appendix A describes the variables
used in the collapsed attribute tests, while the variables used in this test are their equivalent but
measured either in the current or prior year.
Table 3 Panel A presents the results from estimating equation (4). As expected, we find
that larger firms (Assets) and lower growth firms (BTM) have more consistent accounting
policies from year to year. We also find that firms with more operating segments have lower
time series consistency, suggesting that diversified firms have less consistent accounting across
time. Firms with a merger, special items, or that raise financing in a particular year have lower
time series consistency of accounting policies. We note that CFO changes have a much larger
effect on consistency than CEO changes, which is likely the result of CFOs having a direct
responsibility for the details of accounting and financial reporting. The results in Table 3 Panel A
suggest our proxy for accounting consistency captures consistency in accounting policies from
year to year.
For additional validation, we test whether our measure of accounting consistency from
year to year influences the change in audit fees. If TSConsistency adequately captures time series
consistency we would expect audit fees to be higher in years where consistency is low. We test
this by measuring the change in abnormal audit fees from the prior year to the current year (∆
18
We use auditor change in the current year because auditor changes may occur over disputed accounting
treatments, which may affect the current year’s accounting policies. We use prior year CEO and CFO changes
because we think a new executive may take some time understanding the business before changing accounting
policies. Using lagged auditor or current executive changes provides slightly weaker results for those coefficients,
supporting our conjecture.

22
Abnormal Audit Fees) and estimating the following model:19
0 1Abnormal Audit Fees TSConsistency Controlsit it it it (5)
The results from estimating (5) are found in Table 3 Panel B. As expected, the coefficient
on TSConsistency is negative (-0.267) and statistically significant (p-value < 0.05). Firms with
lower accounting consistency in a particular year have significantly higher audit fees. This result
provides additional validation that our measure of consistency is indeed capturing an influential
aspect of consistency. We note that other control variables in the model are generally consistent
with our predictions and the results in prior literature. The negative coefficient on ChAuditor
suggests that when firms switch auditors one motivation is to reduce their payment for audit fees.
4.2. Earnings quality tests
To test our time series hypotheses we estimate equation (6) below, where DepVar is each
of the following five earnings attribute measures: Persistence, Predictability, Smoothness, AQ,
and Var(DA). Var(DA) is the standard deviation of the performance-controlled discretionary
accruals estimates over the sample period.
0 1 2 3 4 5
6 7 8 9 10
11 12 13 14
DepVar TSConsistency Assets BTM OpCycle StdCFO
StdSales Segments ForeignSales Merger SpItems
Issue ChAuditor ChEO ChCFO
i i i i i i
i i i i i
i i i i i
(6)
The coefficient on TSConsistency is the test of our hypothesis. We expect firms with more
consistent accounting policies over time should have more persistent and predictable earnings,
19
To calculate abnormal audit fees, we follow Simunic (1984), Larcker and Richardson (2004), and Keune and
Johnstone (2012) and capture residual audit fees after taking out the effects of auditor characteristics (e.g., auditor
type, busy season audits) and company characteristics (e.g., size, operating complexity, profitability, leverage, asset
composition).

23
higher earnings smoothness, and better fitting accruals models (i.e., lower variation of residuals).
We use the models from Ashbaugh-Skaife et al. (2008) and Francis et al. (2004) as the basis for
our control variables. We control for firm characteristics that should explain differences in
accruals and earnings characteristics. These include controls for size of the firm using total assets
(Assets), growth (BTM), operating cycle (OpCycle), and the volatility of operations (StdCFO and
StdSales). We also control for the complexity of operations, including the number of operating
segments (Segments) and whether the firm has foreign sales (ForeignSales). We also control for
significant events that might influence the dependent variables. These include the magnitude of
special items (SpItems), and indicators for whether the firm undergoes a merger (Merger), issues
debt or equity (Issue) or changes an auditor (ChAuditor), CEO (ChCEO), or CFO (ChCFO)
during the year. Because our dependent variables are a single measure per firm, all of our control
variables are similarly collapsed per firm over the sample period. Assets, BTM, OpCycle,
StdCFO, StdSales, Segments, and ForeignSales are all the mean values over the sample period.
Merger, SpItems, Issue, ChAuditor, ChCEO, and ChCFO are the sum of those indicators over
the sample period. The measurement of each variable is explained in detail in Appendix A.
The time series results are presented in Table 4. Robust t-statistics are presented below
coefficient estimates. We present two specifications for each model with the first model
excluding the control variables that likely have a more direct effect on accruals or earnings (e.g.,
SpItems, Merger, and Issue). Panel A contains the accrual tests to examine whether
AveTSConsistency is associated with the estimation of accrual models. For all of the accrual
tests, the coefficients on AveTSConsistency are negative and significant with p-values less than 1
percent. These results are consistent with our hypothesis that firms with greater accounting
consistency over time have better fitting accrual quality and discretionary accruals models. Panel

24
B contains the tests for other earnings attributes measures. For the Persistence, Predictability,
and Smoothness regressions in Panel B, the coefficients on AveTSConsistency are all positive and
at least significant at 10 percent. These results suggest that greater time series accounting policy
consistency results in more persistent, predictable, and smooth earnings. The coefficients on
many of our control variables are also consistent with expectations. Larger firms and low growth
firms have higher accrual quality. Longer operating cycles, more volatile operations, and more
special items are associated with lower accrual quality and more variation in discretionary
accruals estimates.
We also examine the economic magnitude of the results in Table 4. We calculate
marginal effects for continuous variables as the change in dependent variable resulting from a
one standard deviation change in the variable of interest. For the count or ordinal variables
(Segments, ForeignSales, Merger, Issue, ChAuditor, ChCEO, and ChCFO), marginal effects are
the change in the dependent variable resulting from an increase of one in the variable of interest.
For the accrual attribute tests in Panel A, the marginal effects of AveTSConsistency are more than
the marginal effects of Assets, OpCycle, StdCFO, and StdSale, and the other control variables.
These results suggest that time series consistency in accounting policies explains a significant
portion of the variation in accruals estimates over time. In the tests in Panel B, the marginal
effects of AveTSConsistency are even greater. A one standard deviation change in
AveTSConsistency increases the persistence of earnings by 0.013 (3.6 percent) and predictability
by 0.012 (8.2 percent), suggesting accounting consistency is an important factor determining the
predictability and persistence of a firm’s earnings. These marginal effects are greater than the
marginal effects for Assets, BTM, OpCycle, StdSales, an additional equity or debt issuance
during the sample (Issue), an additional merger during the sample (Merger), a change in auditor

25
(ChAuditor), and a change in CEO (ChCEO) or CFO (ChCFO). They are similar to the marginal
effects of StdCFO, adding an additional segment (Segments) and are less than the marginal
effects of ForeignSales and SpItems.20
These results suggest that changes in accounting policies
across time significantly affect earnings attributes.
5. Cross-Sectional Earnings Quality Tests
5.1. Descriptive statistics and validation test
Table 5 presents descriptive statistics for key variables used in the cross-section tests.
AveCSConsistency ranges from zero to one, where an AveCSConsistency score equal to zero
(one) would indicate the firm’s significant accounting policies have no (all) words in common
with the significant accounting policies of other firms in the industry. We find that
AveCSConsistency varies from 0.512 at the 25th percentile to 0.572 at the 75th percentile,
suggesting that there is some variation in significant accounting policy disclosures in the cross
section. The descriptive statistics suggest that the distributions of AQ and Abs DA are similar to
those in prior literature (Ashbaugh-Skaife et al., 2008; Doyle et al., 2007).
Given that AveCSConsistency is a new proxy, we provide some tests to validate that the
measure captures similarities and differences where we would expect them. We do this by
selecting six industries based on 2-digit SIC that have substantial accounting differences. These
include Metal Mining (SIC 10), Building Construction (SIC 15), Paper and Allied Products (SIC
26), Transportation by Air (SIC 45), Eating and Drinking Places (SIC 58) and Insurance Carriers
(SIC 62). The purpose of our tests is to examine whether firms in the same industry have more
similar accounting policies than comparing firms across industries. For these six industries, we
20
The large marginal effects associated with SpItems are expected given the evidence of prior literature on the
non-persistent nature of special items (Burgstahler et al., 2002; Dechow and Ge, 2006).

26
take each firm in the industry and calculate the average consistency score for the firm with other
firms in the same industry and then with the firms in the other five industries. We then aggregate
these scores for each industry pairing. By comparing our cross-sectional consistency measure
across industries, we validate that AveCSConsistency indeed measures similarities of firms when
we expect them to be similar.21
Table 6 presents the results of these tests. The average consistency scores across the
diagonal represent the consistency of firms in the same industry while the off-diagonal values
represent the consistency of firms across different industries. In every case, AveCSConsistency
scores within industry are substantially higher than AveCSConsistency measured across
industries. These differences are statistically significant at less than 0.001 percent using 2-tailed
tests. Although the differences appear small, they are significant in magnitude. For example,
within industry AveCSConsistency for firms in the Metal Mining industry is 0.5415, while the
average AveCSConsistency across industries is 0.4818, a difference of 0.0597. From Table 5
Panel A, recall that the standard deviation of AveCSConsistency, which is only measured within
industry, is 0.05, so that an average difference of 0.0597 is quite large. Furthermore, an average
consistency score of 0.4818 would fall in the bottom 10 percent of AveCSConsistency as
described in Table 5. The findings from these tests lend support to the idea that our measure
captures differences in accounting consistency across firms when we expect those differences.
Having validated our cross-sectional consistency measure, we proceed with hypothesis testing.
21
The fact that our measure of cross-sectional consistency captures across industry accounting differences does
not necessarily suggest our measure will capture cross-sectional comparability within each industry. However,
within industry validation is more difficult for this measure relative to the time series measure because we have
fewer expectations for what factors influence cross-sectional comparability except for accounting choices that are
captured in the measure itself.

27
5.2. Accruals tests
Next, we conduct tests of whether firms with higher cross-section accounting consistency
have better fitting estimates from industry-estimated accrual models. We perform these tests
using the regression model in (7), where the dependent variable is either accrual quality (AQ) or
discretionary accruals (AbsDA) estimated within industry.
0 1DepVar AveCSConsistency Controlsit it it it (7)
The coefficients on AveCSConsistency are the tests of our hypothesis, with an expected negative
sign (in that accounting consistency should cause lower absolute accrual quality residuals and
lower absolute discretionary accruals). We rely on the models in Ashbaugh-Skaife et al. (2008)
and Francis et al. (2004) as the basis for our control variables. Because we seek to measure the
absolute discretionary accruals and the absolute difference of accruals quality, all of our control
variables with Abs prefixes are measured as the absolute difference of the variable for the firm
and its industry-year mean value. We control for firm characteristics that should explain
differences in accruals. These include controls for differences in size of the firm using total
assets (AbsAssets), length of operating cycle (AbsOpCycle), the proportion of negative earnings
(AbsNegEarn), the volatility of operations (AbsStdCFO and AbsStdSales), the nature of assets in
operation (AbsCapInt and AbsIntInt), and financial distress (AbsZscore). To control for complex
operations, we include the number of operating segments (Segments) and an indicator whether
the firm has foreign sales (ForeignSales). We also control for significant events during the year
that might influence accruals. These include whether the firm had special items (SpItems) or a
merger (Merger) during the year. The measurement of each variable is explained in detail in
Appendix A.

28
Table 7 presents the results of estimating equation (7) for our two dependent variables. T-
statistics are presented in parentheses below coefficient estimates and are calculated using 2-way
clustered standard errors by firm and fiscal year (Petersen, 2009). All regressions include
industry fixed effects based on 2-digit SIC. The first two specifications are for the dependent
variable of accrual quality (AQ) measured as the firm’s absolute residual from estimating the
accrual quality regression by industry. In both specifications, the coefficient on
AveCSConsistency is negative and significant, with p-values all less than 0.01. These results are
consistent with our hypothesis. Firms with accounting policies that are more consistent with
other firms in the industry have less extreme accrual quality estimates. It follows then that firms
that are less consistent to others in the industry will appear to have lower accruals and earnings
quality due to more extreme accrual quality estimates. The coefficients on control variables are
also generally consistent with our expectations.22
The marginal effects are also consistent with
accounting policy consistency having a strong influence on accrual quality estimates. Using the
full model, a one standard deviation change in AveCSConsistency decreases AQ by 0.0045. This
effect is smaller than the marginal effect of Merger (-0.0050) and AbsOpcycle (0.0083), but
larger than the effect of AbsStdCFO (0.0025), AbsStdSales (0.0016) and AbsNegEarn (-0.0030).
When we test performance controlled absolute discretionary accruals, we obtain similar
results. The coefficients on AveCSConsistency are negative and significant in all specifications,
with p-values all less than 0.01. These results suggest that firms with accounting policies that are
more consistent to other firms in the industry also have lower absolute discretionary accruals
22
In untabulated analyses, we add the DeFranco et al. (2011) cross-sectional comparability measure to the
accruals quality (AQ) regression model to test whether our consistency measure captures an aspect of comparability
incremental to the DeFranco et al. (2011) measure. In this test, we continue to find AveCSConsistency negative and
significant (p-value < 0.001), which suggests that our specific measure of consistency captures an aspect of
comparability distinct from their measure.

29
when estimating the discretionary accruals by industry.23
Marginal effects for AveCSConsistency
are similar to the accrual quality marginal effects, with a one standard deviation increase in
AveCSConsistency decreasing Abs DA by 0.0043. This effect is roughly in the middle of all
marginal effects for independent variables in the model. We note that controlling for disclosure
length in the tests in Table 7 by using Adj AveCSConsistency provides similar inferences to using
the unadjusted measure.
6. Additional analysis
6.1. ERC Tests
To this point we have focused on earnings quality proxies that are exclusively based on
reported numbers from the financial system. Another common earnings quality proxy is based on
investor responsiveness to earnings, or earnings response coefficients (ERCs) (see Dechow et al.
2010 for a review). ERC proxies incorporate the return generating process as an additional
dimension, which should be a function of earnings quality but also many other factors not
associated with quality. Given our prior results that increased time series consistency increases
earnings persistence and earnings persistence has been shown to affect ERCs, the positive
relation between consistency and ERCs appears intuitive. However, it is not entirely clear that
accounting consistency will affect the ERC. This is because the expected dividend models used
to motivate the correlation between earnings persistence and ERCs rests on the assumption that
earnings predict future dividends. However, accounting method choices with no fundamental
cash flow (and ultimately dividends) implications may not influence earnings response
23
In untabulated analyses, we add the DeFranco et al. (2011) cross-sectional comparability measure to the
absolute discretionary accruals regression model (AbsDA)to test whether our consistency measure captures an aspect
of comparability incremental to the DeFranco et al. (2011) measure. In this test, we continue to find
AveCSConsistency negative and significant (p-value < 0.001), which suggests that our specific measure of
consistency captures an aspect of comparability distinct from their measure.

30
coefficients. Therefore, this remains an empirical question, although our expectation is that firms
with higher time series consistency will exhibit higher ERCs, ceteris paribus.
We conduct this test by first estimating an ERC regression for each firm in the time series
sample to obtain an ERC estimate for each firm. We estimate the ERC regression for each firm
over the sample period using the available firm quarters. Estimating quarterly provides a larger
sample to ensure more precise estimates. The dependent variable is value-weighted market
adjusted abnormal returns during the quarter regressed on price-scaled earnings per share and
price-scaled seasonally adjusted change in earnings per share as suggested in Kothari (1992).
The dependent variable in our ERC tests is the coefficient estimate on earnings changes from this
firm-specific regression. We test whether the firm-level ERC estimate is associated with the time
series comparability (AveTSConsistency), while controlling for known determinants of ERCs
from Kormendi and Lipe (1987), Collins and Kothari (1989), and Hayn (1995). These controls
are for growth (BTM), risk (Beta), size (Assets), earnings persistence (Persistence), and losses
(Loss Percentage). Variable definitions can be found in Appendix A.
The results of our ERC tests are found in Table 8. We first test whether time series
consistency is associated with ERCs without controlling for the properties of earnings directly.
The results in this first specification suggest that firms that have greater accounting consistency
have higher earnings response coefficients (p-value <0.01). This is consistent with consistency
increasing earnings quality as measured by ERCs. However, when we include determinants of
ERCs that are explicitly found in earnings (Persistence and Loss Percentage), the coefficient on
AveTSConsistency becomes insignificant. These results suggest that although consistent
accounting choices may have an effect on earnings response coefficients that influence can be
captured though the properties of earnings themselves. Therefore, accounting consistency does

31
not appear to be a significant factor in ERC earnings quality proxies beyond what is captured in
earnings itself.
7. Conclusions
We examine how accounting consistency is associated with proxies for earnings quality.
We examine these effects both over time for the same firm and relative to other firms in the same
industry. We find results consistent with our hypotheses. Specifically, we find consistency in
accounting policies over time is a significant contributing factor of earnings quality proxies.
Similarly, firms with higher accounting consistency to other firms in the industry also have
smaller residuals resulting from accrual models. The results in this paper enhance our
understanding of the role accounting policies play in determining attributes of earnings and
accruals that are used as proxies for earnings quality. These results highlight the potential insight
financial statement users can obtain by comparing firms’ accounting policies as disclosed in the
policy footnote.
Our time series results highlight that firms with greater time series consistency have more
persistent and smooth earnings series, which is consistent with the contention that the majority of
CFOs believe that high quality earnings reflect consistent accounting policy choices over time
(Dichev et al., 2013). Prior research is conflicting about whether persistent and smooth earnings
reflect better quality earnings (Dichev and Tang, 2008) or poorer quality earnings (Leuz et al.,
2003). Dechow et al. (2010) note that the evidence on this is lacking because it is difficult to
differentiate discretionary smoothness from inherent smoothness. If accounting consistency over
time can be considered inherent smoothness, then our results imply at least a portion of these
measures reflect better quality earnings.
Our analysis utilizes a textual analysis tool that quantifies the consistency of accounting

32
policies over time and within an industry. Our approach to measuring consistency may provide
incremental power in research designs that require matched-firm analysis. Future research could
examine the extent to which matching on accounting consistency provides incremental benefit to
matching based on frequently used characteristics like industry, size, and growth. Other research
could examine the effect of consistency on investors, regulators (e.g., SEC), or other information
intermediaries such as credit ratings agencies.

33
References
Altman, E. I., 1968. Financial ratios, discriminant analysis and the prediction of corporate bankruptcy.
Journal of Finance 23, 589-609.
Ashbaugh-Skaife, H., Collins, D., Kinney, W., LaFond, R., 2008. The effect of SOX internal control
deficiencies and their remediation on accrual quality. The Accounting Review 83, 217-250.
Barth, M. E., Landsman, W. R., Lang, M. H., Williams, C.D., 2013. Effects on comparability and capital
market benefits of voluntary adoption of IFRS by US firms: Insights from voluntary adoption of IFRS
by non-US firms. Working paper, Stanford University, University of North Carolina at Chapel Hill, and
University of Michigan.
Bernard, V. and Thomas J., 1990. Evidence that stock prices do not fully reflect the implications of current
earnings for future earnings. Journal of Accounting and Economics 13, 305-340.
Bradshaw, M., Miller, G., Serafeim, G., 2009. Accounting method heterogeneity and analysts’ forecasts.
Working Paper, University of Chicago, University of Michigan, and Harvard University.
Brown, S., Tucker, J., 2011. Large-sample evidence on firms' year-over-year MD&A modifications. Journal
of Accounting Research 49, 303-346.
Burgstahler, D., Jiambalvo, J., Shevlin, T., 2002. Do stock prices fully reflect the implications of special
items for future earnings? Journal of Accounting Research 40, 585-612.
Campbell, J. L., Yeung, E., 2012. Accounting comparability, investor sophistication, and contagion effects.
Working paper, University of Georgia and Cornell University.
Chen, C., Lin C., Lin, Y., 2008. Audit partner tenure, audit firm tenure, and discretionary accruals: Does
long auditor tenure impair earnings quality? Contemporary Accounting Research 25, 415-445.
Collins, D., Kothari, S.P., 1989. An analysis of intertemporal and cross-sectional determinants of earnings
response coefficients. Journal of Accounting and Economics 11, 143-181.
Dechow, P., Dichev, I., 2002. The quality of accruals and earnings: The role of accrual estimation errors.
The Accounting Review 77, 35–59.
Dechow, P., Ge, W., 2006. The persistence of earnings and cash flows and the role of special items:
Implications for the accrual anomaly. Review of Accounting Studies 11, 253-296.
Dechow, P., Ge, W., Schrand, C., 2010. Understanding earnings quality: A review of the proxies, their
determinants and their consequences. Journal of Accounting and Economics 50, 344-401.
DeFond, M., Park, C., 2001. The reversal of abnormal accruals and the market valuation of earnings
surprises. The Accounting Review 76, 375-404.
DeFond, M., Subramanyam, K., 1998. Auditor changes and discretionary accruals. Journal of Accounting
and Economics 25, 35-67.
DeFranco, G., Kothari, S.P., Verdi, R., 2011. The benefits of firm comparability. Journal of Accounting
Research 49, 895-931.

34
Dichev, I., Tang, V., 2008. Matching and the Changing Properties of Accounting Earnings over the Last 40
Years. The Accounting Review 86, 1425-1460.
Dichev, I., Graham, J., Harvey, C., Rajgopal, S., 2013. Earnings Quality: Evidence from the Field. Working
paper, Emory University and National Bureau of Economic Research.
Doyle, J., Ge, W., McVay, S., 2007. Accruals quality and internal control over financial reporting. The
Accounting Review 82, 1141-1170.
Easton, P. D., Zmijewski, M. E., 1989. Cross-sectional variation in the stock market response to accounting
earnings announcements. Journal of Accounting and Economics 11, 117-141.
Fang, X., Li, Y., Xin, B., Zhang, W. J., 2012. Accounting comparability and bank loan contracting.
Working Paper, Georgia State University, University of Lethbridge, University of Toronto, and
Dalhousie University.
Financial Accounting Standards Board (FASB), 1980. Statement of Financial Accounting Concepts No. 2:
Qualitative Characteristics of Accounting Information. http://www.fasb.org/pdf/con2.pdf.
Financial Accounting Standards Board (FASB), 2010. Statement of Financial Accounting Concepts No. 8,
Conceptual Framework for Financial Reporting, Chapter 1, The Objective of General Purpose Financial
Reporting and Chapter 3, Qualitative Characteristics of Useful Financial Information.
Francis, J., LaFond, R., Olsson, P., Schipper, K., 2004. Costs of equity and earnings attributes. The
Accounting Review 79, 967-1010.
Francis, J., Yu, M. D., 2009. Big 4 office size and audit quality. The Accounting Review 84, 1521-1552.
Graham, J. R., Harvey, C. R., Rajgopal, S., 2005. The economic implications of corporate financial
reporting. Journal of Accounting and Economics 40, 3-73.
Hayn, C., 1995. The information content of losses. Journal of Accounting and Economics 20, 125-153.
Hope, O., 2003. Accounting policy disclosures and analysts’ forecasts. Contemporary Accounting Research
20, 295-321.
Hribar, P., Nichols, C., 2007. The use of unsigned earnings quality measures in tests of earnings
management. Journal of Accounting Research 45, 1017–1053.
Jones, J., 1991. Earnings management during import relief investigations. Journal of Accounting Research
29, 193–228.
Joos, P., Lang, M., 1994. The effects of accounting diversity: evidence from the European Union. Journal of
Accounting Research 32, 141-168.
Keune, M., Johnstone, K., 2012. Materiality judgments and the resolution of detected misstatements: The
role of managers, auditors, and audit committees. The Accounting Review 87, 1641-1677.
Kim, S., Kraft, P., Ryan, S., 2013. Financial statement comparability and credit risk. Review of Accounting
Studies, forthcoming.

35
Kormendi, R., Lipe, R., 1987. Earnings innovations, earnings persistence, and stock returns. The Journal of
Business 60, 323-345.
Kothari, S.P., Leone, A., Wasley, C., 2005. Performance matched discretionary accrual measures. Journal
of Accounting and Economics 39, 163–197.
Larcker, D., Richardson, S., 2004. Fees paid to audit firms, accrual choices and corporate governance.
Journal of Accounting Research 42, 625-658.
Leuz, C., Nanda, D., Wysocki, P., 2003. Investor protection and earnings management: an international
comparison. Journal of Financial Economics 63, 507–527.
Liu, J., Thomas, J., 2000. Stock Returns and Accounting Earnings. Journal of Accounting Research 38, 71-
101.
Petersen, M.A., 2009. Estimating standard errors in finance panel data sets: comparing approaches. The
Review of Financial Studies 22, 435-480.
Salton, G., Wong, A., Yang, C.S., 1975. A vector space model for automatic indexing. Communications of
the ACM 18, 613–620.
Securities and Exchange Commission (SEC). “SEC Concept Release: International Accounting Standards,”
2000. Available at http://sec.gov/rules/concept/34-42430.htm.
Simunic, D.A., 1984. Auditing, consulting, and auditor independence. Journal of Accounting Research 22,
679-702.

36
Appendix A
Variable definitions
Variable Name Description
Abs DA The absolute value of performance adjusted (Kothari et al., 2005) discretionary
accruals estimated in the cross section.
AQ Accruals quality as measured by Dechow Dichev (2002) modified by using the
firm's deviation from the industry estimation rather than the standard deviation
of residuals.
Assets The log of total assets (Compustat at)
AveCSConsistency The cross-sectional consistency measure calculated as the mean cosine
similarity score from the vector space model of a firm’s accounting policies
compared to the accounting policies of every other firm in the same industry.
AveTSConsistency The mean time series consistency measure (TSConsistency) for a particular
firm over the sample period.
Beta The firm-specific coefficient estimate of firm returns on value-weighted
market returns using monthly returns over the sample period.
BTM The book-to-market ratio as book value of equity (Compustat ceq) divided by
market value of equity (prcc_fxcsho)
CapInt Capital Intensity measured as net property, plant and equipment divided by
total assets (Compustat ppent / at)
∆ Abnormal Audit
Fees
The change abnormal audit fees from the prior year to the current year.
Abnormal audit fees are calculated as the residual from a regression of audit
fees on auditor characteristics (e.g., auditor type, busy season audits) and
company characteristics (e.g., size, operating complexity, profitability,
leverage, and asset composition).
ChAssets The percentage change in Assets from the prior fiscal year.
ChAuditor Equal to one if the firm had a change in auditor in the year, and zero otherwise
(Compustat au).
ChBTM The percentage change in BTM from the prior fiscal year.
ChCEO Equal to one if the firm’s CEO changed during the year and zero otherwise
(Execucomp ceoann)
ChCFO Equal to one if the firm’s CFO changed during the year and zero otherwise
(Execucomp cfoann)
ForeignSales Equal to one if the firm reports foreign sales, and zero otherwise (Compustat
Segments file)
IntInt Intangible Intensity measured as R&D plus advertising divided by total assets
(Compustat xrd+xad / at)
Issue Indicator variable equal to one if the firm issues debt or equity securities
during the year and zero otherwise.
Loss Percentage The percentage of net income that is negative over the time series sample
period.
Merger Equal to one if the firm is involved in a merger or acquisition in the year, and
zero otherwise (Compustat sale_fn)

37
NegEarn The percentage of the prior five years the firm had negative earnings
(Compustat ib)
OpCycle The sum of days sales in A/R (360/[sales/ave AR], Compustat sale, rect) and
days sales in Inventory (360/[COGS/ave Inv], Compustat cogs, invt)
Persistence The coefficient estimate of a firm-specific regression of earnings per share on
lagged earnings per share.
Predictability The R2 of a regression of annual earnings on prior-year annual earnings for the
same firm.
Segments Number of reported business segments (Compustat Segments file)
Smoothness The ratio of the standard deviation of earnings to the standard deviation of cash
flows multiplied by negative one.
SpItems The absolute value of special items divided by total assets (Compustat spi).
StdCFO The standard deviation of cash flow from operations divided by total assets
(Compustat oancf / at) for the prior five years
StdSales The standard deviation of sales divided by total assets (Compustat sale / at) for
the prior five years
TSConsistency The firm-year time series comparability measure calculated as the cosine
similarity score from the vector space model comparing the firm’s current and
prior year’s accounting policy disclosures
Var DA The variance of performance adjusted discretionary accruals estimated
according to Kothari (2005).
ZScore Altman’s (1968) Z-score equal to: 1.2×(working capital/assets) + 1.4×(retained
earnings/assets) + 3.3×(oper. income/assets) + 0.6×(market value equity/total
liabilities) + (sales/assets)
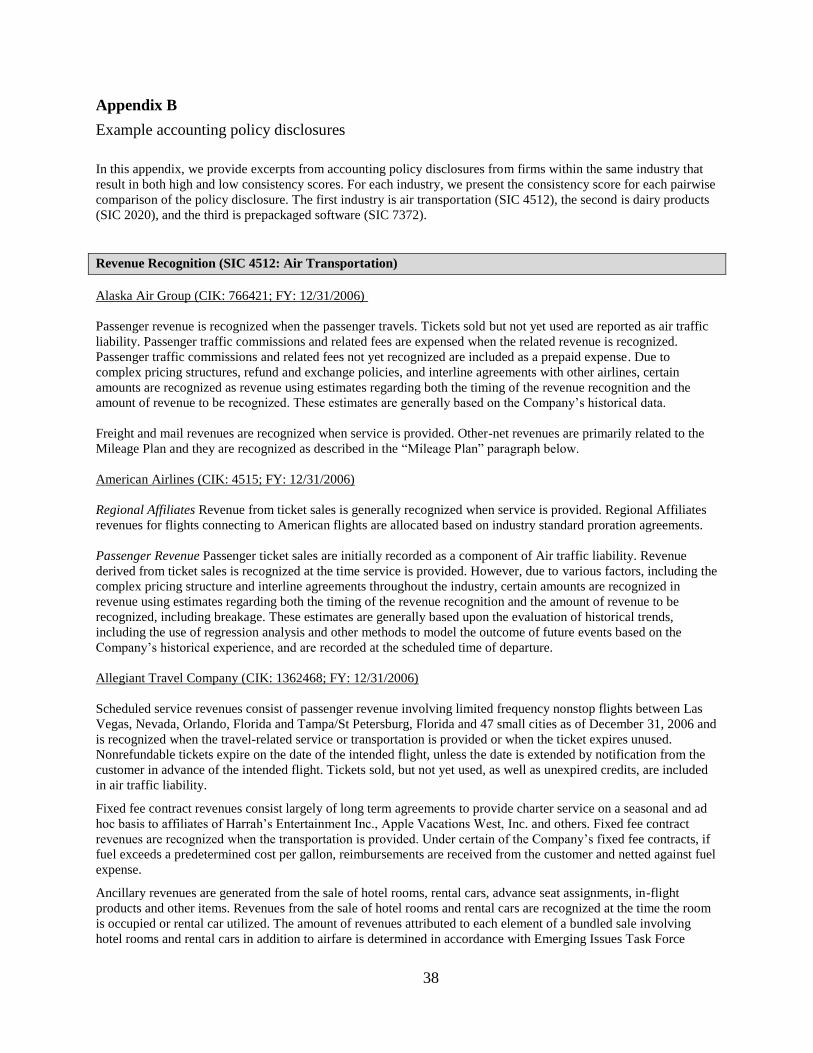
38
Appendix B
Example accounting policy disclosures
In this appendix, we provide excerpts from accounting policy disclosures from firms within the same industry that
result in both high and low consistency scores. For each industry, we present the consistency score for each pairwise
comparison of the policy disclosure. The first industry is air transportation (SIC 4512), the second is dairy products
(SIC 2020), and the third is prepackaged software (SIC 7372).
Revenue Recognition (SIC 4512: Air Transportation)
Alaska Air Group (CIK: 766421; FY: 12/31/2006)
Passenger revenue is recognized when the passenger travels. Tickets sold but not yet used are reported as air traffic
liability. Passenger traffic commissions and related fees are expensed when the related revenue is recognized.
Passenger traffic commissions and related fees not yet recognized are included as a prepaid expense. Due to
complex pricing structures, refund and exchange policies, and interline agreements with other airlines, certain
amounts are recognized as revenue using estimates regarding both the timing of the revenue recognition and the
amount of revenue to be recognized. These estimates are generally based on the Company’s historical data.
Freight and mail revenues are recognized when service is provided. Other-net revenues are primarily related to the
Mileage Plan and they are recognized as described in the “Mileage Plan” paragraph below.
American Airlines (CIK: 4515; FY: 12/31/2006)
Regional Affiliates Revenue from ticket sales is generally recognized when service is provided. Regional Affiliates
revenues for flights connecting to American flights are allocated based on industry standard proration agreements.
Passenger Revenue Passenger ticket sales are initially recorded as a component of Air traffic liability. Revenue
derived from ticket sales is recognized at the time service is provided. However, due to various factors, including the
complex pricing structure and interline agreements throughout the industry, certain amounts are recognized in
revenue using estimates regarding both the timing of the revenue recognition and the amount of revenue to be
recognized, including breakage. These estimates are generally based upon the evaluation of historical trends,
including the use of regression analysis and other methods to model the outcome of future events based on the
Company’s historical experience, and are recorded at the scheduled time of departure.
Allegiant Travel Company (CIK: 1362468; FY: 12/31/2006)
Scheduled service revenues consist of passenger revenue involving limited frequency nonstop flights between Las
Vegas, Nevada, Orlando, Florida and Tampa/St Petersburg, Florida and 47 small cities as of December 31, 2006 and
is recognized when the travel-related service or transportation is provided or when the ticket expires unused.
Nonrefundable tickets expire on the date of the intended flight, unless the date is extended by notification from the
customer in advance of the intended flight. Tickets sold, but not yet used, as well as unexpired credits, are included
in air traffic liability.
Fixed fee contract revenues consist largely of long term agreements to provide charter service on a seasonal and ad
hoc basis to affiliates of Harrah’s Entertainment Inc., Apple Vacations West, Inc. and others. Fixed fee contract
revenues are recognized when the transportation is provided. Under certain of the Company’s fixed fee contracts, if
fuel exceeds a predetermined cost per gallon, reimbursements are received from the customer and netted against fuel
expense.
Ancillary revenues are generated from the sale of hotel rooms, rental cars, advance seat assignments, in-flight
products and other items. Revenues from the sale of hotel rooms and rental cars are recognized at the time the room
is occupied or rental car utilized. The amount of revenues attributed to each element of a bundled sale involving
hotel rooms and rental cars in addition to airfare is determined in accordance with Emerging Issues Task Force

39
(“EITF”) No. 00-21, Revenue Arrangements with Multiple Deliverables. The sale of hotel rooms, rental cars and
other ancillary products are recorded net of amounts paid to wholesale providers, travel agent commissions and
credit card processing fees in accordance with EITF No. 99-19, Reporting Revenue Gross As A Principal Versus Net
As An Agent.
The following table presents the consistency scores for each pairwise comparison of the disclosures above.
(Alaska, American) (Alaska, Allegiant) (American, Allegiant)
Consistency 0.5065 0.3357 0.2733
Financial Instrument Disclosure Comparability (SIC 2020: Dairy Products)
Nuvim Inc. (CIK: 1170652; FY: 12/31/2008)
Value of Financial Instruments
The Company's financial instruments consist mainly of cash and cash equivalents, accounts receivable, accounts
payable and debt. The carrying amounts of these financial instruments approximate fair value due to their short-
term nature. The carrying amount due to related party, notes payable and stockholder loans are estimated to
approximate their fair values as their stated interest rates approximate current interest rates.
Synutra International Inc. (CIK: 1293593; FY: 3/31/2008)
Fair value of financial instruments
The carrying value of financial instruments including cash, receivables, accounts payable, accrued expenses and
debt, approximates their fair value at March 31, 2008 and 2007 due to the relatively short-term nature of these
instruments. The carrying value of long-term debt approximates its fair value as it bears variable interest rate. The
carrying value of long term receivable approximates its fair value as it represents the present value of future
payments to be received.
Land O’ Lakes Inc. (CIK: 1032562; FY: 12/31/2008)
Derivative Commodity Instruments
In the normal course of operations, the Company purchases commodities such as milk, butter and soybean oil in
Dairy Foods, soybean meal and corn in Feed, soybeans in Seed and corn and soybean meal in Layers. Derivative
commodity instruments, consisting primarily of futures contracts offered through regulated commodity exchanges,
are used to reduce exposure to changes in commodity prices. These contracts are not designated as hedges under
SFAS No. 133, “Accounting for Derivative Instruments and Hedging Activities.” The futures contracts are marked-
to-market each month and gains and losses (“unrealized hedging gains and losses”) are recognized in cost of sales.
The Company has established formal limits to monitor its positions and generally does not use derivative
commodity instruments for speculative purposes.
The following table presents the consistency scores for each pairwise comparison of the disclosures above.
(Nuvim, Synutra) (Nuvim, LO’L) (Synutra, LO’L)
Consistency 0.5333 0.0775 0.0774

40
Inventory Disclosure Comparability (SIC 7372: Prepackaged Software)
Activision Inc. (CIK: 718877; FY: 3/31/2005)
Inventories
Inventories are valued at the lower of cost (first-in, first-out) or market.
Electronic Arts, Inc. (CIK: 712515; FY: 3/31/2005)
Inventories
Inventories consist of materials and labor and include manufacturing royalties paid to console manufacturers.
Inventories are stated at the lower of cost (first-in, first-out method) or market.
Take Two Interactive Inc. (CIK: 946581; FY: 10/31/2004)
Inventories, net
Inventories are stated at the lower of average cost or market. The Company periodically evaluates the carrying value
of its inventories and makes adjustments as necessary. Estimated product returns are included in the inventory
balance at their cost.
The following table presents the consistency scores for each pairwise comparison of the disclosures above.
(Activision, EA) (Activision, TTWO) (EA, TTWO)
Consistency 0.5500 0.4336 0.3338
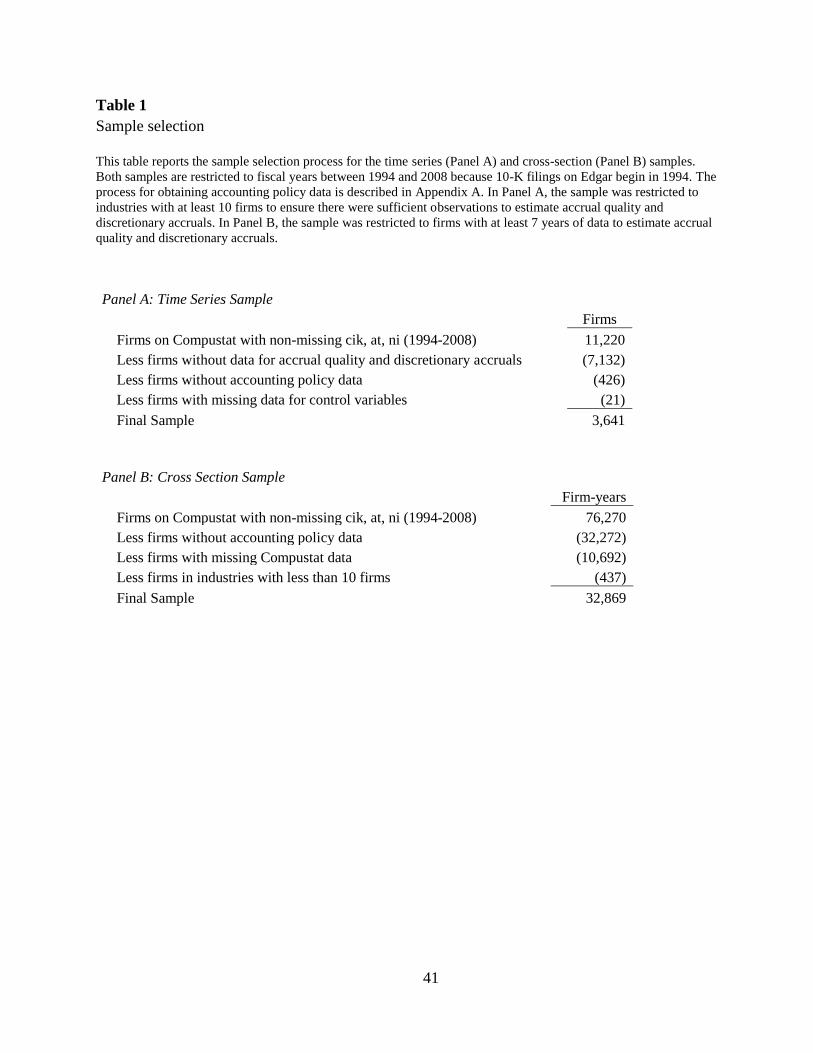
41
Table 1 Sample selection
This table reports the sample selection process for the time series (Panel A) and cross-section (Panel B) samples.
Both samples are restricted to fiscal years between 1994 and 2008 because 10-K filings on Edgar begin in 1994. The
process for obtaining accounting policy data is described in Appendix A. In Panel A, the sample was restricted to
industries with at least 10 firms to ensure there were sufficient observations to estimate accrual quality and
discretionary accruals. In Panel B, the sample was restricted to firms with at least 7 years of data to estimate accrual
quality and discretionary accruals.
Panel A: Time Series Sample
Firms
Firms on Compustat with non-missing cik, at, ni (1994-2008)
11,220
Less firms without data for accrual quality and discretionary accruals (7,132)
Less firms without accounting policy data
(426)
Less firms with missing data for control variables
(21)
Final Sample
3,641
Panel B: Cross Section Sample
Firm-years
Firms on Compustat with non-missing cik, at, ni (1994-2008)
76,270
Less firms without accounting policy data
(32,272)
Less firms with missing Compustat data
(10,692)
Less firms in industries with less than 10 firms
(437)
Final Sample
32,869

42
Table 2 Time series descriptive statistics
This table reports descriptive statistics for the sample of firms as described in Table 1 Panel B. All variables are
winsorized at 1 and 99 percentiles except ForeignSales, Merger, Issue, ChAuditor, ChCEO, and ChCFO. The
variable descriptions are listed in Appendix A.
Variable N Mean Std Dev p25 p50 p75
AveTSConsistency 3641 0.857 0.040 0.835 0.860 0.883
Persistence 3641 0.360 0.392 0.097 0.369 0.611
Predictability 3641 0.146 0.249 -0.060 0.065 0.296
Smoothness 3641 -1.611 1.995 -1.698 -1.110 -0.741
AQ 3641 0.060 0.055 0.025 0.043 0.073
Var DA 3641 0.065 0.041 0.035 0.055 0.085
Var DA 3641 0.057 0.037 0.030 0.048 0.074
Assets 3641 5.400 2.051 3.862 5.281 6.743
BTM 3641 0.432 4.263 0.275 0.457 0.684
OpCycle 3641 4.632 0.868 4.204 4.667 5.102
StdCFO 3641 0.124 0.215 0.045 0.073 0.128
StdSales 3641 0.304 0.350 0.133 0.226 0.367
Segments 3641 2.179 1.582 1.000 1.000 3.000
ForeignSales 3641 0.429 0.493 0.000 0.000 1.000
Merger 3641 2.135 2.205 0.000 2.000 3.000
SpItems 3641 0.448 0.948 0.074 0.214 0.522
Issue 3641 11.680 3.109 9.000 12.000 15.000
ChAuditor 3641 0.959 1.070 0.000 1.000 1.000
ChCEO 3641 0.518 0.953 0.000 0.000 1.000
ChCFO 3641 0.328 0.697 0.000 0.000 0.000

43
Table 3 Time series consistency validation tests
This table reports OLS regression estimates of tests to validate the use of time series consistency (TSConsistency) in
our main analysis. Panel A reports estimates of a regression of time-series accounting consistency on explanatory
variables. Panel B reports estimates of the change in abnormal audit fees on TSConsistency and control variables.
All variables are defined in Appendix A. T-statistics are listed in parentheses below coefficient estimates and are
calculated using standard errors clustered by firm and fiscal year.
Panel A: Time series consistency determinants test
TSConsistency
Prediction (1)
Assets + 0.002***
(5.03)
BTM + 0.006***
(6.15)
Segments - -0.002***
(-5.38)
Merger - -0.017***
(-10.29)
SpItems - -0.072***
(-7.41)
Issue - -0.009***
(-5.63)
ChAuditor - -0.020***
(-4.44)
ChCEO - -0.005
(-1.43)
ChCFO - -0.011**
(-2.52)
Intercept 0.840***
(250.95)
N 34693
Adjusted R2
0.078

44
Table 3 (continued)
Panel B: Time series consistency audit fee test
∆ Abnormal Audit Fees
Prediction (1)
TSConsistency - -0.267**
(-2.45)
ChAssets ? -0.215***
(-8.84)
ChBTM ? 0.004
(-0.43)
NegEarn - -0.036*
(-1.65)
NegSI + 0.155***
(4.14)
Merger + 0.034***
(3.09)
SpItems + 0.041**
(2.08)
Issue + 0.071***
(2.75)
ChAuditor ? -0.579***
(-12.71)
Intercept 0.204***
(2.74)
N 14655
Adjusted R2
0.078

45
Table 4
Time series earnings quality regression estimates
This table reports OLS regression estimates of the relation between earnings quality estimates on accounting policy
consistency. All variables are described in detail in Appendix A. Robust t-statistics are listed in parentheses below
coefficient estimates.
Panel A: Accrual-based earnings quality time series tests
(1) (2) (3) (4)
AveTSConsistency -0.115*** -0.101*** -0.064*** -0.058***
(-5.59) (-4.93) (-4.46) (-4.01)
Assets -0.006*** -0.006*** -0.004*** -0.004***
(-10.17) (-8.37) (-11.14) (-9.83)
BTM 0.000** 0.000** 0.000** 0.000*
(2.45) (2.42) (1.98) (1.67)
OpCycle 0.012*** 0.012*** 0.009*** 0.009***
(8.53) (8.52) (9.85) (9.84)
StdCFO 0.071*** 0.064*** 0.035*** 0.034***
(5.95) (5.19) (4.60) (4.30)
StdSales 0.029*** 0.027*** 0.020*** 0.020***
(4.70) (4.51) (5.50) (5.46)
Segments 0.000 0.000 -0.000 -0.000
(0.89) (0.73) (-0.62) (-0.91)
ForeignSales -0.005*** -0.006*** -0.006*** -0.006***
(-3.14) (-3.41) (-5.41) (-5.72)
Merger -0.000 -0.000
(-0.95) (-0.81)
SpItems 0.004 0.001
(1.47) (0.95)
Issue 0.000 0.001***
(0.68) (4.82)
ChAuditor 0.003*** 0.002***
(3.97) (2.90)
ChCEO 0.001 -0.001
(1.15) (-1.38)
ChCFO 0.000 0.001
(0.27) (0.98)
Intercept 0.118*** 0.100*** 0.084*** 0.067***
(5.75) (4.76) (5.87) (4.62)
N 3641 3641 3641 3641
R2
0.290 0.298 0.275 0.284
Var DAAQ

46
Table 4 (continued)
Panel B: Other earnings quality time series tests
(1) (2) (3) (4) (5) (6)
AveTSConsistency 0.402** 0.325** 0.369*** 0.304*** 2.529*** 1.251*
(2.45) (1.99) (3.67) (3.06) (3.09) (1.65)
Assets 0.012*** 0.003 0.006** -0.001 0.088*** 0.028
(3.17) (0.65) (2.44) (-0.22) (5.06) (1.30)
BTM 0.001** 0.000 0.001*** 0.001*** 0.013*** 0.007**
(2.33) (1.10) (4.40) (2.87) (2.90) (1.97)
OpCycle 0.011 0.011 0.005 0.006 0.176*** 0.157***
(1.36) (1.44) (1.03) (1.12) (3.88) (3.60)
StdCFO -0.005 0.069* 0.032 0.094*** -0.353* 0.585*
(-0.15) (1.65) (1.44) (2.84) (-1.71) (1.83)
StdSales -0.013 -0.001 -0.026** -0.017 0.172* 0.352***
(-0.75) (-0.06) (-2.03) (-1.24) (1.87) (2.82)
Segments -0.017*** -0.018*** -0.009*** -0.010*** 0.069*** 0.060***
(-3.69) (-4.10) (-3.33) (-3.82) (3.14) (2.92)
ForeignSales -0.041*** -0.045*** -0.022** -0.023** -0.209*** -0.136**
(-3.03) (-3.23) (-2.51) (-2.57) (-3.09) (-2.02)
Merger 0.007** 0.004** -0.076***
(2.04) (2.00) (-4.51)
SpItems -0.045** -0.038*** -0.635***
(-2.02) (-2.85) (-3.61)
Issue 0.010*** 0.007*** 0.091***
(4.21) (4.23) (8.50)
ChAuditor -0.011* -0.008** 0.003
(-1.76) (-1.98) (0.09)
ChCEO 0.008 0.000 0.074***
(0.89) (0.08) (2.90)
ChCFO -0.010 0.002 0.054*
(-0.84) (0.28) (1.65)
Intercept -0.041 -0.036 -0.194** -0.176* -5.146*** -4.488***
(-0.28) (-0.24) (-2.13) (-1.91) (-6.87) (-6.29)
N 3641 3641 3641 3641 3641 3641
Adjusted R2
0.007 0.023 0.009 0.032 0.024 0.123
Predictability SmoothnessPersistence

47
Table 5 Cross-section descriptive statistics
This table reports descriptive statistics for the variables used to conduct the cross-section tests. Variable descriptions
can be found in Appendix A.
Variable N Mean Std Dev p25 p50 p75
AveCSConsistency 32869 0.510 0.058 0.477 0.515 0.551
AQ
32869 0.055 0.066 0.014 0.033 0.069
Abs DA 32869 0.061 0.067 0.018 0.040 0.080
Assets 32869 5.381 2.038 3.891 5.229 6.712
OpCycle 32869 4.746 1.028 4.211 4.727 5.208
NegEarn 32869 0.338 0.352 0.000 0.200 0.600
StdCFO 32869 0.104 0.141 0.032 0.061 0.114
Zscore 32869 2.839 1.808 1.693 2.718 3.789
SpItems 32869 0.031 0.101 0.000 0.001 0.018
Table 6 Within and across industry comparability validation tests
This table presents average consistency scores for firms within and across a selection of six diverse industries. For a
particular row, we measure the consistency score for firms in a particular two digit SIC with other firms also in same
two digit SIC and with the firms in the other five industries. Mean consistency scores are then presented for each
industry pairing. Consistency scores in bold represent the within industry comparisons and those means are
statistically higher than the across industry consistency scores (all with p-values less than 0.001 using 2-tailed tests
assuming two samples with unequal variances).
SIC SIC Description SIC 10 SIC 15 SIC 26 SIC 45 SIC 58 SIC 62
10 Metal Mining 0.5415*** 0.4867 0.4903 0.4761 0.4855 0.4703
15 Building Construction 0.4910 0.5479*** 0.4936 0.4931 0.5082 0.4935
26 Paper and Allied Products 0.4905 0.4892 0.5167 *** 0.4852 0.4991 0.4793
45 Transportation by Air 0.4800 0.4913 0.4883 0.5418*** 0.5023 0.4856
58 Eating and Drinking Places 0.4874 0.5057 0.5008 0.5019 0.5459*** 0.4946
62 Insurance Carriers 0.4768 0.4954 0.4844 0.4889 0.4990 0.5181***

48
Table 7 Cross-section accrual regression estimates
This table presents OLS regression estimates of accrual quality and absolute discretionary accruals for sample firms.
All variables are described in Appendix A. However, all of our control variables with Abs prefixes are measured as
the absolute difference of the variable for the firm and its industry-year mean value. Industry indicators are included
in the model but not presented. T-statistics are listed below coefficient estimates and calculated using standard errors
clustered by firm and fiscal year.
(1) (2) (3) (4)
AveCSConsistency -0.102*** -0.077*** -0.104*** -0.080***
(-5.01) (-5.86) (-6.64) (-8.41)
AbsAssets 0.001 -0.002***
(1.58) (-3.19)
AbsOpcycle 0.008*** 0.008***
(5.88) (5.65)
AbsNegEarn -0.006** -0.010***
(-2.13) (-5.08)
AbsStdCFO 0.014* 0.036***
(1.73) (4.22)
AbsStdSales 0.015*** 0.014***
(4.91) (3.18)
AbsCapInt -0.002 -0.001
(-0.45) (-0.18)
AbsIntInt -0.001* -0.002***
(-1.93) (-4.79)
AbsZscore 0.008*** 0.006***
(10.26) (10.43)
Segments -0.002*** -0.001***
(-5.27) (-5.19)
ForeignSales -0.010*** -0.010***
(-8.98) (-8.58)
SpItems 0.095*** 0.022*
(4.03) (1.66)
Merger -0.005*** 0.009***
(-3.07) (4.99)
Intercept 0.071*** 0.061*** 0.066*** 0.060***
(12.82) (16.48) (15.62) (22.68)
N 32869 32869 32869 32869
Adjusted R2
0.082 0.145 0.080 0.114
Dep. Var. = Abs DADep. Var. = AQ

49
Table 8 ERC tests regression estimates
This table presents OLS regression estimates of the relation between earnings response coefficients and time series
consistency and other control variables. All variables are described in Appendix A. T-statistics are listed below
coefficient estimates and calculated using standard errors clustered by firm and fiscal year.
Earnings Response Coefficient
(1) (2)
BTM -0.685 *** -0.780 ***
(-5.09)
(-5.82)
Beta 0.017
-0.244 ***
(0.62)
(-7.33)
Assets -0.278 *** 0.347 ***
(-3.54)
(3.71)
AveTSConsistency 4.820 *** -0.170
(2.58)
(-0.10)
Persistence
0.849 ***
(3.97)
Loss Percentage
-3.767 ***
(-12.96)
Intercept -2.285
3.786 **
(-1.43)
(2.46)
N 2245 2245
Adjusted R2 0.013 0.119