accounting f u.s. colleges u s and t , 1993–2004 · pdf fileaccounting faculty in u.s....
TRANSCRIPT

ACCOUNTING FACULTY INU.S. COLLEGES AND UNIVERSITIES:STATUS AND TRENDS, 1993–2004
A REPORT OF THE AMERICAN ACCOUNTING ASSOCIATIONFEBRUARY 19, 2008

ACCOUNTING FACULTY INU.S. COLLEGES AND UNIVERSITIES:STATUS AND TRENDS, 1993–2004
A REPORT OF THE AMERICAN ACCOUNTING ASSOCIATION
REPORT PREPARED BY:David W. Leslie, Chancellor Professor of Education,
The College of William and Mary
RESEARCH PROJECT COORDINATOR:Bruce K. Behn, University of Tennessee
2007–2008 EXECUTIVE COMMITTEE MEMBERSOF THE AMERICAN ACCOUNTING ASSOCIATION:Gary Previts, Case Western Reserve University
Shyam Sunder, Yale University,Sue Haka, Michigan State University
David Burgstahler, University of WashingtonJoe Carcello, University of Tennessee
Robert J. (Bob) Daugherty, PricewaterhouseCoopers LLPSid Gray, The University of Sidney
Mark Higgins, University of Rhode IslandPhil Reckers, Arizona State University
Jane Saly, University of St. ThomasArnie Wright, Northeastern University
Chris Wolfe, Texas A&M University
With thanks for the co-sponsorship of theAmerican Institute of Certified Public Accountants
FEBRUARY 19, 2008

Accounting Faculty in U.S. Colleges and Universities: Status and Trends, 1993–2004 Leslie
American Accounting Association 3
FOREWORD
The result of a joint project between the American Accounting Association (AAA) and Account-ing Program Leaders Groups (APLG), the report entitled Supply and Demand for Accounting Ph.D.s(December,2005) galvanized the accounting community’s desire for more information about thestate of our accounting environment.
With no central warehouse for information about the accounting supply chain to rely on, vari-ous entities have attempted to fill this void by producing studies, papers, and reports address-ing various aspects and issues. For example, Jim Hasselback’s famous chart outlining age de-mographics of the accounting professoriate, the American Institute of Certified Public Accountants(AICPA’s) renewed efforts to gather information on the supply and demand of accounting stu-dents, Deloitte’s survey of current doctoral students, AACSB International’s report on doctoralshortages in business, the APLG/AICPA/FSA/AAA survey of doctoral program coordinators,and others. All stakeholders and supporters of accounting education working to gather relevant,reliable information that can be useful to decision makers attempting in a number of ways toaddress problems in the accounting supply chain, including the shortage of accounting doctoralstudents.
Like the projects conducted before it, this project arose from within the accounting community.To add pertinent information to understanding the state of the accounting academy, the AAAand AICPA looked outside the accounting domain for an analysis placing information aboutaccounting specifically into the context of the larger higher education environment in the U.S.today.
With those purposes in mind, we asked David W. Leslie, Chancellor Professor of Education,The College of William and Mary, to lead our study. David has a distinguished career analyzingdemographic data at all levels of education. His recent report, The Reshaping of America’s Aca-demic Workforce, for TIAA-CREF where he is an Institute Fellow, has been frequently quoted inthe mainstream press. A significant portion of Leslie’s analysis for that report was performedusing the National Study of Postsecondary Faculty (NSOPF) database, which is also the basis ofdata for this report examining the environment in the accounting academy.
Collaborating on this project, the AICPA and AAA hope to add value to the accounting commu-nity by taking a view from outside the accounting environment, providing a context in which tobetter understand our current situation, allowing us to better forecast challenges and opportuni-ties for the future. Information from this research project became part of the Advisory Commit-tee on the Audit Profession’s testimony to the U.S. Treasury Department in Washington, D.C. inthe fall of 2007. The Advisory Committee, chaired by former Securities and Exchange Commis-sion Chairman Arthur Levitt and former SEC Chief Accountant Donald Nicolaisen, was char-tered by the U.S. Treasury to consider and develop recommendations relating to the sustainabilityof the auditing profession.
The AAA and AICPA would like to thank David Leslie for the energy and inspiration he broughtto this joint effort. David would like to thank Bruce Behn, and AAA Executive Committee mem-bers Shyam Sunder, Dave Burgstahler, and Arnie Wright for their review and comments duringcompletion of this report.

Accounting Faculty in U.S. Colleges and Universities: Status and Trends, 1993–2004 Leslie
American Accounting Association 5
TABLE OF CONTENTS
Executive Summary ................................................................................................................... 7
I. Demographics ............................................................................................................................. 9
II. Implications for the Future ....................................................................................................... 22
III. Conclusions ................................................................................................................................. 32
IV. Appendix: Sources of Data ........................................................................................................ 34
References .................................................................................................................................... 36

Accounting Faculty in U.S. Colleges and Universities: Status and Trends, 1993–2004 Leslie
American Accounting Association 7
EXECUTIVE SUMMARYThe number of accounting faculty declined 13.3 percent over the period 1988–2004. According toNational Study of Postsecondary Faculty (NSOPF) data, accounting faculty (full- and part-time,in all types of postsecondary institutions) had fallen from 20,321 in 1993 to 17,610 in 2004. How-ever, as the number of faculty has declined, student (undergraduate) enrollment has increased(12.3 percent) over the same period. The most serious loss of full-time faculty has occurred atfour-year, non-doctoral-granting institutions—amounting to 31 percent of the 1993 total. Thenumber of full-time accounting faculty at research/doctoral universities and at community col-leges between 1993 and 2004 changed little, same for the total number of accounting facultyholding Ph.D.s.
Accounting is roughly average (among all disciplines) in the proportion of women in ten-ured or tenure-track positions, as well as roughly average in the rate at which women haveentered the field. However, the total number of women accounting faculty remained almostperfectly stable between 1993 and 2004, while the number of male faculty declined substantially.
The number of accounting faculty over the age of 55 increased while the number of accountingfaculty under the age of 40 declined by half during the 1993–2004 period. Both this study and thePlumlee (2004) study estimate that the number of retirements is likely to exceed the number ofqualified replacements in the immediate future. Given the stability of Ph.D. production at about140 per year on average, and with retirements estimated at about 500 per year, the production ofnew Ph.D.s appears far from sufficient to fill the demand. Further, about one-half of the Ph.D.degrees are being granted to non-U.S. citizens, many of whom may not stay to teach in U.S.schools.
A sign of the demand for new accounting faculty may be seen in the apparent salary inversionobserved in the 2004 data: faculty under age 41 averaged higher pay than faculty over age 41.
Meanwhile, workload for accounting faculty has increased markedly, especially at researchand doctoral universities, where the bulk of enrollment increases have also occurred.
While the data show a rapid escalation of salary for new faculty in accounting and stablelevels of job satisfaction, the field faces an immediate future of pressure on faculty to workharder and longer as its workforce turns over through retirement.

Accounting Faculty in U.S. Colleges and Universities: Status and Trends, 1993–2004 Leslie
American Accounting Association 9
I. DEMOGRAPHICS1
FacultyThe number of accounting faculty at institutions offering baccalaureate and higher degrees—
tenured, tenure-eligible, and not tenure-eligible—is estimated to have declined over the period1993–2004. According to National Study of Postsecondary Faculty (NSOPF) data, full-time ten-ure-eligible faculty at these institutions declined more than 19 percent between 1993 and 2004.Table 1 (and Figure 1) shows the estimated (NSOPF) numbers of full-time, tenured, and tenure-track (“tenure-eligible”) faculty in accounting and all business fields other than accounting in1993, 1999, and 2004. (The estimated number of tenure-eligible faculty in business fields otherthan accounting rose over 20 percent during the same period.) Table 2 presents the counts forfull-time non-tenure-eligible faculty.
1 See the Appendix for data sources. Results derived from federal government data (NSOPF) were generated usingthe Data Analysis System of the National Center for Education Statistics, and should be considered estimates fromsampled data. Totals vary among tables as different items on the NSOPF survey were necessarily used to generatetables and graphs (each with a different response rate). Minor differences in wording and aggregation of itemresponses from year to year of the survey may also affect comparability.
TABLE 1NSOPF Extimate Number of Full-Time, Tenure-Eligible Faculty
Accounting and All Other Business Fields1993–2004
(institutions offering baccalaureate degrees and higher)1993 1999 2004 % Change
Accounting 6,331 4,555 5,121 –19.11%All other business fields 16,933 16,027 20,352 +20.20%
TABLE 2NSOPF Estimated Number of Full-Time Non-Tenure-Eligible Faculty
Accounting and All Other Business Fields1993–2004
(institutions offering baccalaureate degrees and higher)1993 1999 2004 % Change
Accounting 1,169 1,976 1,079 – 7.7%All other business fields 3,649 5,573 6,148 +68.0%

Accounting Faculty in U.S. Colleges and Universities: Status and Trends, 1993–2004 Leslie
10 American Accounting Association
Table 3 presents the overall estimated number of accounting faculty at all types of institu-tions, including two-year, by tenure status. The number of tenure-track (but not yet tenured)faculty declined for the period, but rose over 36 percent between 1999 and 2004. (The number ofall other business faculty is estimated to have increased by 22.6 percent for the same period.)
FIGURE 1NSOPF Estimated Number (in 1000s) of Full-Time Tenured or On-Track Faculty
in Accounting and Other Business Fields at InstitutionsGranting Baccalaureate or Higher Degrees
1993, 1999, and 2004
0
5
10
15
20
25
Accounting Other business
Num
ber i
n 10
00's
199319992004
As the number of faculty has declined, undergraduate student enrollment has increased.2
Table 4 shows American Institute of Certified Public Accountants’ (AICPA) estimates.3
2 Varying estimates of enrollment may be found in NPSAS data, some suggesting that the trends differ among typesof institution. NPSAS, however, does not permit disaggregation to the level of the accounting discipline beyondthe year 2000.
3 Full-time undergraduate accounting enrollment estimated for 2000 by the National Center for Education Statistics(NPSAS) is 134,925.
TABLE 3Number of All Accounting Faculty at All Types of Institutuions
by Tenure Status and Percent Change from 1993–2004(including two-year institutions)
1993 1999 2004 % ChangeTenured 5,825 4,900 4,779 –18.0%On-Track 2,384 1,400 1,909 –19.9%Not Eligible 12,112 11,100 10,922 – 9.8%
Total 20,321 17,400 17,610 –13.3%

Accounting Faculty in U.S. Colleges and Universities: Status and Trends, 1993–2004 Leslie
American Accounting Association 11
With the increase in student enrollments and decline in full-time tenured (or on-track) fac-ulty, the ratio of students per full-time faculty member (baccalaureate or above institutions) hasincreased sharply from 20.54:1 in 1993 to 28.0:1 in 2004. The trends in numbers of full-time fac-ulty differ by type of institution. Table 5 reports the numbers of full- and part-time faculty bytype of institution for 1993 and 2004. Figure 2 shows that numbers of full-time accounting fac-ulty have increased slightly at research and doctoral4 universities, declined substantially (31percent, or nearly one-third) at other four-year institutions, and remained essentially static attwo-year institutions.
4 The Carnegie Foundation’s classification identifies universities by the level of expenditures on research andnumber of doctoral degrees awarded.
TABLE 4Estimated (Total) Undergraduage Enrollment in Accounting (AICPA)
and Net Change1999–2000 to 2003–2004
1999–2000 2000–2001 2001–2002 2002–2003 2003–2004 % ChangeEstimated (total) 127,960 134,775 133,435 141,175 143,735 12.33%UndergraduateEnrollment
It appears that research and doctoral universities have attempted to recapture full-time posi-tions by using fewer part-time faculty, while four-year (typically master’s-granting) collegesand universities have turned more of the teaching load over to part-timers. Figure 3 shows howthe part-time trend is almost a mirror image of the full-time trend: numbers of part-timers havefallen almost two-thirds at research/doctoral institutions, but risen by almost one-third at four-year institutions. Two-year institutions rely far more heavily on part-time faculty. Figure 4 showsthat accounting, on the whole, is more likely than other disciplines to rely on part-time facultythan on full-time faculty.
TABLE 5Number of Full- and Part-Time Accounting Faculty by Type of Institution
1993–20041993 2004 1993 2004
Full-Time Full-Time Part-Time Part-TimeResearch/Doctoral 2,853 3,072 2,163 8514-Year Non-Doctoral 4,572 3,169 2,714 3,5552-Year 2,274 2,287 4,601 3.911
Total 9,699 8,528 9,478 8,317

Accounting Faculty in U.S. Colleges and Universities: Status and Trends, 1993–2004 Leslie
12 American Accounting Association
0
500
1000
1500
2000
2500
3000
3500
4000
4500
5000
Doctoral 4-year non-doctoral 2-year
Num
ber o
f ful
l-tim
e fa
culty
Number FT '93Number FT '04
FIGURE 2Number of Full-Time Accounting Faculty by Type of Institution, 1993–2004
FIGURE 3Number of Part-Time Accounting Faculty by Type of Institution, 1993–2004
0
500
1000
1500
2000
2500
3000
3500
4000
4500
5000
Doctoral 4-year non-doctoral 2-year
Num
ber o
f par
t-tim
e fa
culty
Number PT '93Number PT '04

Accounting Faculty in U.S. Colleges and Universities: Status and Trends, 1993–2004 Leslie
American Accounting Association 13
GenderAccounting, typical of most fields, remains predominantly male. Figure 5 shows that ac-
counting is roughly average in the proportion of females in tenure-eligible positions. In general,accounting falls in the mid-range of disciplines; about one-third of its tenure-eligible faculty arefemale and a little more than one-third of its non-tenure-eligible faculty are female. The differ-ence between the 1993 and 2004 lines in Figure 5 roughly corresponds to the expanded opportu-nity for women. Accounting (red triangles) again was roughly average in expanding opportunity.The number of (all) female accounting faculty remained almost perfectly stable between 1993and 2004, while the number of (total) male faculty declined substantially, resulting in an in-crease in percentage of women faculty from 29.5 percent to 35.1 percent (see Table 65).
30
35
40
45
50
55
60
Full-time 1993 Full-time 2004 Part-time 1993 Part-time 2004
Accounting All other
FIGURE 4Percentage of Faculty Who Are Full- and Part-Time,
Accounting and All Other Fields, 1993–2004
5 As women have earned more terminal degrees, their presence has increased both proportionally and absolutely atresearch and doctoral institutions.
TABLE 6Numbers (and % Change) of Male and Female Accounting Faculty by Tenure Status
1993–2004Male 1993 Male 2004 % Change Female 1993 Female 2004 % Change
Tenured or on-track 6,068 4,361 –0.28% 2,000 2,253 0.13%Not eligible 7,838 6,600 –0.16 3,815 3,628 –0.05
Overall 13,906 10,961 –0.21 5,815 5,881 0.01

Accounting Faculty in U.S. Colleges and Universities: Status and Trends, 1993–2004 Leslie
14 American Accounting Association
FIGURE 5Percentage of Females by Teaching Field, Tenure-Eligibility Only, 1993–2003
0
20
40
60
80
100
120
Enginee
ring
Phys
ical s
cience
s
Philo
sophy a
nd relig
ion
Occ
upation pro
grams
Poli
tical
scien
ces
Eco
nomics
1st-
profes
ional hea
lth sc
ience
s
Computer
scien
ces
Math
emati
cs an
d stati
stics
Agric
ulture/
home eco
nomics
Hist
ory
Socio
logy
Biologica
l scie
nces
Accountin
g
Busin
ess
Law
Fine a
rts
Other
socia
l scie
nces
Communica
tions
All o
ther pro
grams
Psy
chology
Other
health
scien
ces
Other
educa
tion
Englis
h and lit
erature
Forei
gn languag
es
Tea
cher
educa
tion
Nursi
ng
Percentage female, '93Percentage female, '04
0
1000
2000
3000
4000
5000
6000
7000
8000
9000
Male93 Male04
NSO
PF e
stim
ated
num
ber.
Tenured or on-trackNot eligible
FIGURE 6Male Accounting Faculty (all) by Tenure Status, 1993–2004

Accounting Faculty in U.S. Colleges and Universities: Status and Trends, 1993–2004 Leslie
American Accounting Association 15
FIGURE 7Female Accounting Faculty (all) by Tenure Status, 1993–2004
0
500
1000
1500
2000
2500
3000
3500
4000
4500
Female93 Female04
NSO
PF e
stim
ated
num
ber
Tenured or on trackNot eligible
EthnicityThe academic profession has been, and remains, predominantly white. Over three-fourths
(77 percent) of all tenure-eligible accounting faculty in 2004 were white. But the racial balance israpidly changing in accounting. The number of tenure-eligible Asian accounting faculty increasedfive-fold between 1993 and 2004, or from 221 to 1,173. Asians now constitute about 17 percent ofall tenure-eligible accounting faculty. Accounting is exceeded only by engineering (21 percent)and computer sciences (19 percent) in its proportion of Asians in tenure-eligible positions. Infact, the increase in percentage of Asians in accounting (large red triangles) is by a wide marginthe most dramatic shift in ethnic composition among all of the fields represented in Figure 8.The proportion of white faculty has generally fallen as virtually all fields have become moreethnically diverse, but the shift in accounting is well beyond any of the others. (Note, however,that this graph aggregates broad fields; accounting is relatively small by comparison to theseaggregations, perhaps leading to an exaggerated comparison.)
Age and RetirementAccounting faculty are aging. The mean age of full-time accounting faculty increased from
48.5 to 51.6 between 1993 and 2004. The mean age of part-time accounting faculty also increased(from 45.4 to 50.5). Figures 9 and 10 show that women and faculty who are not tenure-eligible areyounger on average than males and tenured faculty, which raises concerns for retirement re-placements in the future.
Although accounting faculty are aging at roughly the average for all fields, this trend shouldbe a particular concern for a field that has experienced a 20 percent decline in the number of

Accounting Faculty in U.S. Colleges and Universities: Status and Trends, 1993–2004 Leslie
16 American Accounting Association
-15
-10
-5
0
5
10
15
20
Acc
ounting
Computer
scien
ces
Busin
ess
Other
socia
l scie
nces
Other
educa
tion
1st-
profes
ional hea
lth sc
ience
s
Hist
ory
All o
ther pr
ogram
s
Forei
gn languag
es
Biol
ogical s
cienc
es
Politi
cal s
cience
s
Eng
ineerin
g
Math
emati
cs an
d stati
stics
Socio
logy
Agric
ulture/
home eco
nomics
Tea
cher
educa
tion
Englis
h and lit
eratur
e
Occ
upation pro
grams
Other
health
scien
ces
Law
Phil
osophy a
nd relig
ion
Phy
sical
scien
ces
Eco
nomics
Psy
cholo
gy
Fine a
rts
Communica
tions
Nursi
ng
Perc
enta
ge c
hang
e
Change in %WhiteChange in %BlackChange in %AsianChange in %Hisp.Change in %Other
FIGURE 8Change in Ethnic Composition of Tenure-Eligible Faculty by Teaching Field, 1993–2004
FIGURE 9NSOPF Estimted Mean Age of Male Accounting Faculty (all) by Tenure Status, 1993–2004
35
40
45
50
55
60
Males93 Males04
Tenured On tenure track, not tenured Not eligible

Accounting Faculty in U.S. Colleges and Universities: Status and Trends, 1993–2004 Leslie
American Accounting Association 17
faculty eligible for tenure, and who remain in probationary status. Figures 11 and 12 show theestimated numbers of (all) male and female accounting faculty (in 1000s) who were under age 40and over the age of 55 in 1993 and 2004. The trend for both genders reveals fewer accounting
35
37
39
41
43
45
47
49
51
53
Females93 Females04
Tenured On track, not tenured Not eligible
FIGURE 10NSOPF Estimated Mean Age of Female Accounting Faculty (all) by Tenure Status, 1993–2004
0
0.5
1
1.5
2
2.5
3
3.5
4
4.5
5
Males93 Males04
Under age 40Over age 55Linear (Under age 40)Linear (Over age 55)
FIGURE 11NSOPF Estimated Number (1000’s) of Male Accounting Faculty
Under Age 40 and Over Age 55, 1993–2004

Accounting Faculty in U.S. Colleges and Universities: Status and Trends, 1993–2004 Leslie
18 American Accounting Association
faculty under the age of 40 in 2004, and more accounting faculty over the age of 55. These trendsmay indicate that too few are entering and completing Ph.D. programs, the principal entry pointto faculty positions that would replace those who are nearing retirement.
Consistent with the age trend, accounting faculty project shorter times to retirement. Figure13 shows that, with the exception of community college faculty, full-time faculty at research and
0
0.5
1
1.5
2
2.5
Females93 Females04
Under age 40Over age 55Linear (Under age 40)Linear (Over age 55)
FIGURE 12NSOPF Estimated Number (1000s) of Female Accounting Faculty
Under Age 40 and Over Age 55, 1993–2004
12
13
14
15
16
17
18
19
1993YrstoRetire 2004YrstoRetire
Mea
n ye
ars
to re
tirem
ent
Res/Doct 4-Year 2-Year
FIGURE 13Mean Years to Retirement, Full-Time Accounting Faculty by Type of Institution, 1993–2004

Accounting Faculty in U.S. Colleges and Universities: Status and Trends, 1993–2004 Leslie
American Accounting Association 19
doctoral institutions projected fewer years to retirement in 2004 than they did in 1993. The changewas more marked at four-year, non-doctoral institutions (a decline of nearly five years on aver-age) than at research and doctoral institutions, where the decline was about three years. Giventhe substantial decline in numbers of accounting faculty at four-year non-doctoral institutions,the need for replacements in this sector may be acute in the very near future.
Replacements by New Ph.D.sOver the past 25 years, accounting has produced between 135 and 140 Ph.D.s, on average,
per year according to data from the Survey of Earned Doctorates (Figure 14). But the number hasfluctuated, with 129 graduates in the most recent year, 2005. AICPA’s 2005 (Sanders 2005, Table3B6) survey of supply and demand shows roughly the same numbers of Ph.D. graduates, anaverage of about 140 a year, but with a similar pattern of fluctuation.
0
20
40
60
80
100
120
140
160
180
200
1980–84 1985–89 1990–94 1995–99 2000-04 2005
Ave
rage
ann
ual n
umbe
r of P
h.D
.s
6
FIGURE 14Average Annual Production of Ph.D.s in Accounting, 1980–2005
TABLE 3BAccounting Ph.D’s Awarded
1999–2000 Through 2003–04
Number of Graduates Rate of Growth
1999–00 195 + 5%2000–01 115 – 41%2001–02 110 – 4%2002–03 145 + 32%2003–04 150 – 3%

Accounting Faculty in U.S. Colleges and Universities: Status and Trends, 1993–2004 Leslie
20 American Accounting Association
The age profile of accounting faculty indicates as many as 500–700 retirements per year in theforeseeable future, which suggests that there will not be nearly enough new Ph.D.s forreplacement. Plumlee’s (2005) survey of supply and demand for Ph.D. accounting faculty esti-mates demand at 350–590 per year between 2005 and 2007, further estimating supply to fill abut50 percent of that demand, with supply unevenly matched to subspecialties.
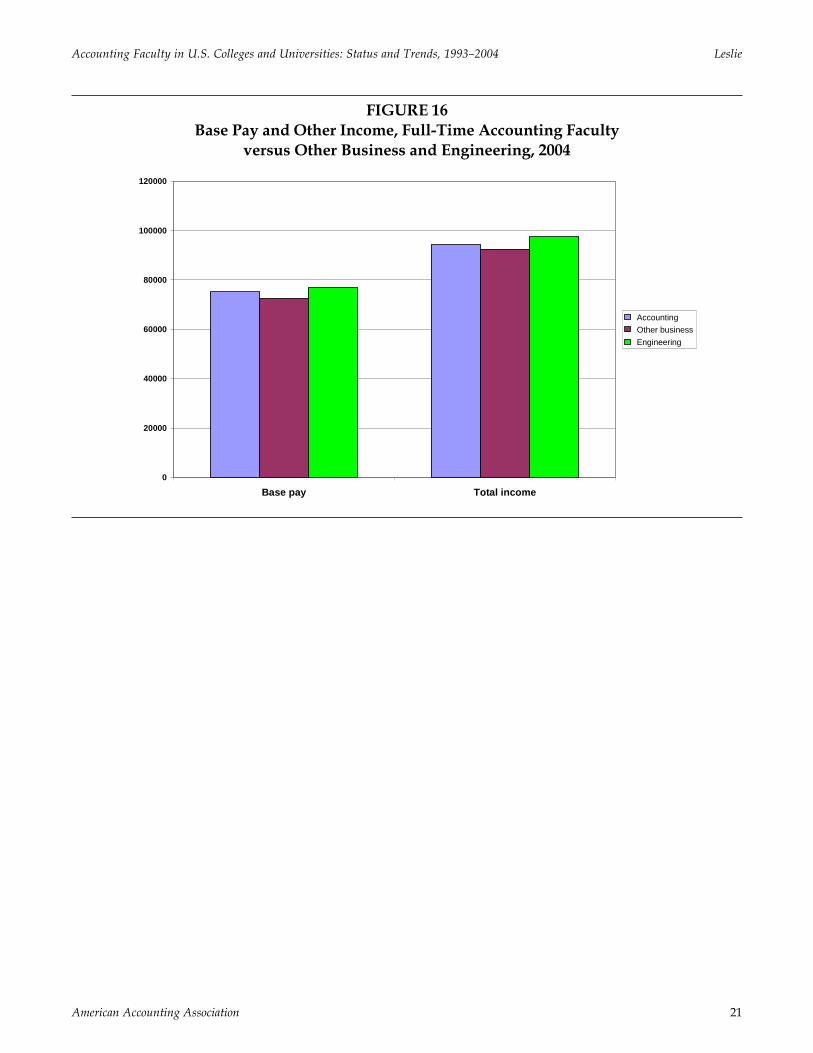
PayAccounting faculty earn more, on the average, than “all other” faculty. Figure 15 shows that
their average base pay also increased faster than that of “all other” faculty between 1993 and2004. The trend for “all individual income” shows an essentially identical trend, indicating thatfaculty positions in accounting may be increasingly attractive. The same data displayed (Figure16) for fields that might be expected to compete for prospective full-time faculty (other businessfields and engineering) show that income for accounting faculty is fully competitive.
55000
60000
65000
70000
75000
80000
1993 2004
Mea
n ba
se s
alar
y in
$
AllFacultyAcctgFaculty
FIGURE 15Trend (1993–2004) in Base Salary for (Full-Time) Accounting and “All” Faculty
Accounting Faculty in U.S. Colleges and Universities: Status and Trends, 1993–2004 Leslie
American Accounting Association 21
0
20000
40000
60000
80000
100000
120000
Base pay Total income
Accounting Other business Engineering
FIGURE 16Base Pay and Other Income, Full-Time Accounting Faculty
versus Other Business and Engineering, 2004

Accounting Faculty in U.S. Colleges and Universities: Status and Trends, 1993–2004 Leslie
22 American Accounting Association
II. IMPLICATIONS FOR THE FUTUREThe major conclusions of Section I of this report indicate that accounting faculty are likely to
retire at a faster rate than they can be replaced. Furthermore, while the number of accountingfaculty has been declining, the number of accounting students has been rising. As a result, ac-counting faculty are working harder and longer, judging by the production of student credithours and the production of scholarship.
How will the field sustain itself by attracting new faculty? If the projections in Section I areaccurate (or even approximately “right”), then the pipeline of prospective faculty is not flowingwith enough volume. Producing 140 new Ph.D.s per year would replace only about 28 percentof the anticipated 500 retirees per year. How might that flow be increased?
The opportunity costs of undertaking a Ph.D. program are considerable, but the Ph.D. pipe-line has held remarkably steady at American universities over the past two decades. However,the pipeline (across all fields) has not produced Ph.D.s at a level that demand for faculty mayrequire.7 Additionally, in many fields, accounting included, foreign nationals have occupied anincreasing share of the available places. About half of all Ph.D. students in accounting are nownon-native. Therefore, accounting’s problems are not unique, although they are serious, indeed.
In simplistic terms, thinking about a faculty career requires a young (or not-so-young) per-son to endure the opportunity cost of several years’ study on marginal funding. Furthermore,the investment in earning a Ph.D. would have to pay off in both extrinsic (salary, benefits, etc.)and intrinsic (satisfaction, etc.) ways. What do the recent faculty surveys reveal about these con-ditions and the appeal of teaching accounting?
In this section of the report, I will try to raise issues that warrant both further study anddiscussion within the profession.
IncomeGiven that accountants have competing employment opportunities, assessing the competi-
tive value of their compensation means understanding the broader market. The Bureau of LaborStatistics (BLS 2006) reported, “Median annual earnings of wage and salary for accountants andauditors were $54,630 in May 2006. The middle half of the occupation earned between $42,520and $71,960. The top 10 percent earned more than $94,050.” Assuming that Ph.D.s should be paidcloser to the top of the scale, the 2004 mean salary of full-time accounting faculty of about $82,273(inflated to 2006) would put them roughly at the 82nd percentile in the broader marketplace.Table 7 shows mean base salary for full-time accounting faculty in 1993 (inflated) and 2004.
7 This concern is magnified by the lengthening of time-to-degree observable across all Ph.D. programs, and theconcomitant increase in the age at which Ph.D.s enter the job market.
TABLE 7Mean Base Pay for Full-Time Accounting Faculty
1993 Inflated 2004Age 41 and under $45,287.00 $82,666.80Age 42 and over $65,295.00 $73,900.80Mean base pay, all $60,190.00 $75,147.00full-time accountingfaculty

Accounting Faculty in U.S. Colleges and Universities: Status and Trends, 1993–2004 Leslie
American Accounting Association 23
Table 7 (illustrated in Figure 17) also shows that base pay for faculty aged 418 and youngerhas increased much faster than base pay for faculty aged 42 and older. In fact, faculty in theyounger cohort were paid substantially (almost $9,000) more than faculty in the older cohort. Atthe same time, the number of all full-time accounting faculty aged 41 and under dropped by more than half,from about 2,600 to about 1,200 during this period (while the number of faculty aged 42 and overremained unchanged at about 7,300).
8 Although the selection of age 41 appears arbitrary, it was an artifact of the U.S. Department of Education “DataAnalysis System” (DAS) limits on retrieval where cell sizes in tables fell below a level required for the protection ofindividual respondents’ identities. At age 40, the DAS would not construct tables, but at age 41, tables in thissection were permitted.
30,000.00
40,000.00
50,000.00
60,000.00
70,000.00
80,000.00
90,000.00
1993 Inflated 2004
Age 41 and underAge 42 and overLinear (Age 41 and under)Linear (Age 42 and over)
FIGURE 17Average Base Pay, Full-Time Accounting Faculty
Over and Under Age 41, 1993 (inflated) to 2004
Table 7a (illustrated in Figure 17a) restricts the analysis to accounting faculty who hold ei-ther the Ph.D. or first professional degree (including J.D., but not M.B.A.); it shows mean basesalary, mean total income from the respondents’ institution, and mean individual income fromall sources. Table 7a splits older and younger faculty at age 45 because NSOPF requires a mini-mum cell size to conduct analyses. The trends (including the salary inversion and decliningnumbers of younger faculty) are the same as those noted in Table 7. Note that base pay and totalincome from the institution at least doubled for younger faculty in inflated means from 1993 to 2004.
These data are a classic illustration of demand exceeding supply. The market appears verysensitive to the impending shortage of prospective faculty—to the extent that salary inversion (amore extreme form of salary compression) appears to have occurred. Senior faculty who experi-ence this inversion (finding themselves paid less than newer, younger faculty) may be tempted

Accounting Faculty in U.S. Colleges and Universities: Status and Trends, 1993–2004 Leslie
24 American Accounting Association
to leave for opportunities to increase their own pay outside academe. If senior faculty were toleave, then shortages would be exacerbated, of course. With the prediction of fewer young fac-ulty, pay levels may rise very quickly as competition intensifies.
0
20000
40000
60000
80000
100000
120000
140000
Age in 1993 45 and under 46 and over Age in 2004 45 and under 46 and over
Basic salary from institutionTotal income from the institutionTotal income of respondent from all sources
TABLE 7aIncome of All Accounting Faculty with Ph.D. or First Professional Degree
Under/Over Age 451993 (inflated) to 2004a
Total IncomeBasic Salary Total Income of Respondents
from Institution from Institution from All Sources nAge in 199345 and under $ 44,744.25 $ 48,584.44 $ 71,418.58 250046 and over $ 65,751.48 $ 73,323.75 $ 99,172.39 4200Age in 200445 and under $ 92,731.80 $101,061.90 $125,370.90 150046 and over $ 73,982.60 $ 81,149.60 $ 98,144.60 4400
The age intervals were established to provide adequate cell sizes, given the NSOPF minimums.
FIGURE 17aAge/Income, Accounting Faculty with Terminal Degree 1993 (inflated) to 2004

Accounting Faculty in U.S. Colleges and Universities: Status and Trends, 1993–2004 Leslie
American Accounting Association 25
Productivity 9
Accounting faculty generated more student credit hours, publications, and grants between1993 and 2004, but at the apparent expense of spending about 7 percent more time on the job.Figure 18 shows that full-time accounting faculty at four-year institutions reported spending alittle over 48 hours per week on the job in 1993, but over 52 hours per week on the job in 2004.(Other business faculty spent an essentially unchanged number of hours on the job over thisperiod.)
Teaching loads, as indicated earlier, grew heavier for accounting faculty. Figure 19 showsthat accounting faculty produced about 9 percent more student credit-hours in 2004 than in1993; the inverse was true for other business faculty.
Notwithstanding the reportedly longer work week and increased teaching obligations, ac-counting faculty also showed consistent increases in research productivity over the 1993– 004period. Figures 20–23 show increases in proportion of time reportedly spent on research (anincrease of 52 percent), recent publications (an increase of 14 percent), career-total publications(an increase of 2 percent), and percentage of accounting faculty with grant funding (an increaseof 67 percent).
These and related measures raise concerns about the sustainability of a workload that ap-pears to be increasing relentlessly. Even as research productivity has increased among account-ing faculty, so has the teaching load. As both functions demand more time, the work week ofaccounting faculty may be approaching a practical limit as it rises beyond 50 hours on average.
9 All tables/graphs in this section compare data for full-time faculty in four-year institutions.
47
48
49
50
51
52
53
Hours worked '93 Hours worked 04
FIGURE 18Average Total Hours Worked Per Week Reported by Full-Time Accounting Faculty
at 4-Year Insitutitions, 1993–2004

Accounting Faculty in U.S. Colleges and Universities: Status and Trends, 1993–2004 Leslie
26 American Accounting Association
200
220
240
260
280
300
320
340
360
Average SCH '93 AverageSCH '04
Res/Doct4-Yr. NonDoctoral
FIGURE 19Average Student Credit Hours Taught by Full-Time Accounting Faculty at Research/
Doctoral Universities and 4-Year Non-Doctoral Universities, 1993–2004
FIGURE 20Percentage of Time Reported on Research, Full-Time Accounting
Faculty at 4-Year Institutions, 1993–2004
10
12
14
16
18
20
22
Time on research 93 Time on research 04
Ave
rage
per
cent
age
of ti
me
on re
sear
ch.

Accounting Faculty in U.S. Colleges and Universities: Status and Trends, 1993–2004 Leslie
American Accounting Association 27
FIGURE 21Total Recent (2 years) Publications Reported by Full-Time Accounting Faculty
at 4-Year Institutions, 1993–2004
FIGURE 22Total Career Publications, Full-Time Accounting Faculty
at 4-Year Institutions, 1993–2004
2.7
2.8
2.9
3
3.1
3.2
3.3
3.4
Recent Publications 93 Recent Publications 04
Ave
rage
pub
licat
ions
(mos
t rec
ent 2
yea
rs)
15.6
15.7
15.8
15.9
16
16.1
16.2
Career Publications 93 Career Publications 04
Ave
rage
tota
l car
eer p
ublic
atio
ns

Accounting Faculty in U.S. Colleges and Universities: Status and Trends, 1993–2004 Leslie
28 American Accounting Association
FIGURE 23Proportion of Full-Time Accounting Faculty at 4-Year Institutions
Who Have Grants, 1993–2004
By working longer and harder, accounting faculty appear to have met demands for production.But when they can no longer work harder, they will not be able to achieve beyond their presentlevels, especially if the pace of replacing retiring faculty continues to lag.
Total production of student credit hours (SCH) in accounting declined nearly 21 percent(from just over 4,000,000 to 3,226,000) between 1993 and 2004, notwithstanding an increase infull-time student enrollment. Although the measure used is imprecise (calculated by multiply-ing average student credit hours taught times the number of faculty), it reflects a troubling trend.
At research and doctoral universities, the total number of accounting SCH produced rosesubstantially (12.4 percent) over this period, while the total number of faculty in this sectordeclined by about 300 (7 percent). This statistic means the average instructional workload ofaccounting faculty at research and doctoral universities rose by about 20 percent. (Full-timefaculty at research and doctoral universities also produced a greater percentage of all account-ing SCH in 2004 than in 1993.) These data confirm that full-time accounting faculty in research anddoctoral universities are carrying an increasing proportion of the entire instructional load in the field.
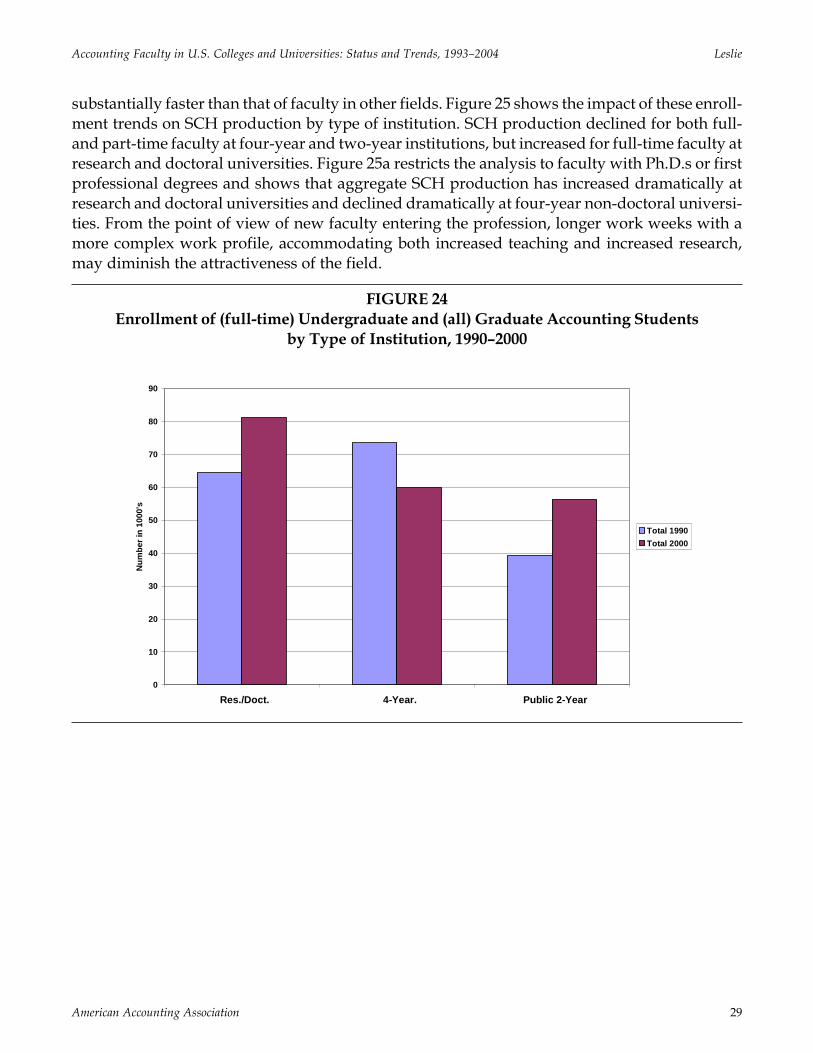
Accounting enrollments appear to be increasing principally among upper division and gradu-ate students, while accounting courses at purely undergraduate institutions may be experienc-ing declines. Figure 24 shows that enrollment in undergraduate and graduate accounting pro-grams (1990–2000) drifted toward research and doctoral universities (or community colleges)and away from four-year non-doctoral institutions. The most substantial change for that periodwas a 40 percent increase in graduate students (14,100 to 19,800). As a result, accounting facultyat research and doctoral universities are handling an instructional load that has been increasing
0.1
0.12
0.14
0.16
0.18
0.2
0.22
0.24
0.26
Proportion with grants 93 Proportion with grants 04
Prop
ortio
n of
full-
time
acco
untin
g fa
culty
Accounting Faculty in U.S. Colleges and Universities: Status and Trends, 1993–2004 Leslie
American Accounting Association 29
substantially faster than that of faculty in other fields. Figure 25 shows the impact of these enroll-ment trends on SCH production by type of institution. SCH production declined for both full-and part-time faculty at four-year and two-year institutions, but increased for full-time faculty atresearch and doctoral universities. Figure 25a restricts the analysis to faculty with Ph.D.s or firstprofessional degrees and shows that aggregate SCH production has increased dramatically atresearch and doctoral universities and declined dramatically at four-year non-doctoral universi-ties. From the point of view of new faculty entering the profession, longer work weeks with amore complex work profile, accommodating both increased teaching and increased research,may diminish the attractiveness of the field.
FIGURE 24Enrollment of (full-time) Undergraduate and (all) Graduate Accounting Students
by Type of Institution, 1990–2000
0
10
20
30
40
50
60
70
80
90
Res./Doct. 4-Year. Public 2-Year
Num
ber i
n 10
00's
Total 1990Total 2000

Accounting Faculty in U.S. Colleges and Universities: Status and Trends, 1993–2004 Leslie
30 American Accounting Association
FIGURE 25Trend in Student Credit Hour Productivity by Type of Institution and Full- versus Part-
Time Accounting Faculty, 1993–2004
FIGURE 25aAggregate SCH Production at Research/Doctoral Universities and 4-Year Non-Doctoral
Universities: Accounting Faculty with Ph.D. or First Professional Degree, 1993–2004
0
200
400
600
800
1000
1200
1400
1600
Res/Doct. 4-Yr.NonDoct 2-Yr.
Inde
x of
SC
H p
rodu
ctio
n pe
r fac
ulty
mem
ber.
FTSCH93FTSCH04PTSCH93PTSCH04
450000
500000
550000
600000
650000
700000
750000
800000
850000
900000
1993 2004
Tota
l no.
SC
H p
rodu
ced
SCH@Res/Doct.SCH@4-Yr.

Accounting Faculty in U.S. Colleges and Universities: Status and Trends, 1993–2004 Leslie
American Accounting Association 31
Job SatisfactionFigure 26 shows three measures of satisfaction: job overall, pay, and workload. All three
measures were virtually unchanged between 1993 and 2004. Accounting faculty appear “satis-fied” with their job overall and with their workload (notwithstanding the apparent increase intime on the job). They appear to be only slightly more satisfied with pay, which should be acause for some concern in such a competitive marketplace.
FIGURE 26Satisfaction with Job Overall, Workload, and Pay
Full-Time Accounting Faculty, 1993–2004(4 = Very Satisfied; 1 = Very Dissatisfied)
1
1.5
2
2.5
3
3.5
4
1993 2004
4.0
= Ve
ry S
atis
fied;
2.0
= S
omew
hat D
issa
tisfie
d
Job OverallWorkloadSatisfied with Pay

Accounting Faculty in U.S. Colleges and Universities: Status and Trends, 1993–2004 Leslie
32 American Accounting Association
III. CONCLUSIONSRelying on data from the National Study of Postsecondary Faculty (NSOPF), I have con-
cluded that there were fewer accounting faculty in 2004 than in 1993 and they worked harderand longer hours than did the faculty in 1993. Accounting faculty are aging and retiring substan-tially faster than they are being replaced. In addition to the low numbers of new Ph.D.s in ac-counting (roughly 140 per year) compared to the projected annual retirement rate of currentfaculty (roughly 500 per year), half of the new Ph.D.s are foreign nationals who may not remainand teach in the U.S. The dramatic decline (54 percent) in the number of accounting facultyunder the age of 41 is particularly troubling. Some specific findings include:
• The estimated number of accounting faculty (all institutions, all ranks) declined 13.3percent between 1993 and 2004, while estimated undergraduate enrollment grew morethan 12 percent. Business fields other than accounting have added substantial numbersof faculty during the same period.
• The aggregate number of students per faculty member in accounting has increased from20.5:1 to over 28:1.
• The decline in numbers of faculty has been principally among males; the number ofwomen accounting faculty has not increased in any significant way, although they are anincreasing proportion of all accounting faculty (as the number of males has declined).
• The mean age of accounting faculty is increasing.• The number of individuals within ten years of “normal” retirement (age 55 and over)
increased between 1999 and 2004, while the number of accounting faculty under the ageof 40 declined during the same period.
• Ph.D. production has remained relatively steady at roughly 140 per year (with annualfluctuations) over the past 10 years.
• Demand for replacement faculty in accounting is estimated at roughly 500 per year forthe next 5–10 years, while available supply of new Ph.D.s is estimated to be about 140per year (half of whom are foreign nationals).
• On the whole, accounting faculty appear satisfied with their jobs and their workload.They are probably less fully satisfied with their pay. (Note, however, that satisfactionlevels remained essentially constant from 1993 to 2004, notwithstanding substantialincreases in both pay and workload.)
• Workload and productivity have both increased more substantially for faculty atresearch and doctoral institutions than among other institutions.
The profession appears to be suffering from competition for new talent, whether becausepay is insufficiently competitive to attract new Ph.D.s or because the workload for current fac-ulty has increased to a functional limit (or perhaps a combination of both). On measures of jobsatisfaction, respondents to the NSOPF survey appear to be generally satisfied (indicating “in-trinsic” satisfaction), but are neither satisfied nor dissatisfied with pay.
It appears that universities have dramatically increased salaries for new accounting faculty,to the point of “salary inversion.” Accounting faculty under 41 now typically earn more thanaccounting faculty over 41. This inversion appears to have resulted in a small increase in satis-faction with pay on the part of faculty under age 41. Whether it is enough to attract more junior

Accounting Faculty in U.S. Colleges and Universities: Status and Trends, 1993–2004 Leslie
American Accounting Association 33
faculty in the face of increasing expectations for productivity is a question central to theprofession’s future.
Briefly summarized, the most pressing concerns for the future are based on these factors:
• Increasing enrollments at the graduate and undergraduate levels, especially at researchand doctoral universities, coupled with a steep decline in numbers of accounting facultyunder the age of 41, and an overall decline in numbers of faculty, as well.
• Longer work weeks and increasing “productivity” expectations for accounting faculty.• Increases in salary beyond those of other faculty, but marked by salary inversion, as
younger faculty (under 41) now average higher pay than faculty over 41.• Neutral feelings about current levels of salary.

Accounting Faculty in U.S. Colleges and Universities: Status and Trends, 1993–2004 Leslie
34 American Accounting Association
IV. APPENDIX:SOURCES OF DATA
National Study of Postsecondary Faculty (NSOPF)http://nces.ed.gov/surveys/nsopf/design.asp
The first cycle of NSOPF was conducted in 1987–1988 with a sample of 480 institutions (in-cluding two-year, four-year, doctorate-granting, and other colleges and universities), over 3,000department chairpersons, and over 11,000 instructional faculty. The response rates for the threesurveys were 88, 80, and 76 percent, respectively.
The 1992–93 study (NSOPF: 93) was limited to surveys of institutions and faculty, but with asubstantially expanded sample of 974 public and private not-for-profit degree-grantingpostsecondary institutions and 31,354 faculty and instructional staff. The response rates for thetwo surveys were 94 and 84 percent, respectively.
The 1998–99 National Study of Postsecondary Faculty (NSOPF: 99) included 960 degree-granting postsecondary institutions and an initial sample of faculty and instructional staff fromthose institutions. Approximately 28,600 faculty and instructional staff were sent a question-naire. Subsequently, a subsample of 19,813 faculty and instructional staff was drawn for addi-tional survey follow-up. Approximately 18,000 faculty and instructional staff questionnaireswere completed for a weighted response rate of 83 percent. The response rate for the institutionsurvey was 93 percent.
The 2003–04 National Study of Postsecondary Faculty (NSOPF: 04) included a sample of1,080 public and private not-for-profit degree-granting postsecondary institutions and a sampleof 35,000 faculty and instructional staff. The weighted response rates for the two surveys were 86and 76 percent, respectively.
All four cycles of NSOPF gathered information regarding the backgrounds, responsibilities,workloads, salaries, benefits, attitudes, and future plans of both full- and part-time faculty. Inaddition, information was gathered from institutional and department-level respondents (de-partment-level data collected in 1988 only) on such issues as faculty composition, turnover,recruitment, retention, and tenure policies.
The institution universe for NSOPF has been defined by the following criteria: Title IV par-ticipating, degree-granting institutions; public and private not-for-profit institutions; institu-tions that confer associate’s, bachelor’s, or advanced degrees; and institutions that are located inthe United States.
A two-stage stratified, clustered probability design was used to select the various NSOPFsamples. For instance, the first-stage sampling frame for NSOPF: 04 consisted of the 3,381postsecondary institutions in IPEDS that were public or private not-for-profit Title IV participat-ing institutions and provided formal degree programs of at least two years’ duration. While theIPEDS universe includes private institutions that are both for-profit and not-for-profit, the insti-tutional universe for NSOPF excludes the private for-profit institutions.
The 3,381 institutions in the NSOPF: 04 universe were stratified based on the highest degreesthey offered and the amount of federal research dollars they received. These strata distinguishedpublic and private institutions, as well as several types of institutions based on the CarnegieFoundation’s classification system.

Accounting Faculty in U.S. Colleges and Universities: Status and Trends, 1993–2004 Leslie
American Accounting Association 35
Unlike NSOPF: 88, which was limited to faculty whose assignment included instruction, thefaculty universes for NSOPF: 93, NSOPF: 99, and NSOPF: 04 were expanded to include all thosewho were designated as faculty, regardless of whether their responsibilities included instruc-tion, and other (non-faculty) personnel with instructional responsibilities. Under this definition,researchers and administrators and other institutional staff who held faculty positions, but whodid not teach, were included in the samples. Instructional staff without faculty status also wereincluded. Teaching assistants were not included in any cycle of NSOPF.
NORC Survey of Earned Doctorateshttp://www.norc.org/projects/Survey+of+Earned+Doctorates.htm
The Survey of Earned Doctorates (SED) is a federal agency survey conducted by NORC forthe National Science Foundation and five other federal agencies (National Institutes of Health,U.S. Department of Education, National Endowment for the Humanities, U.S. Department ofAgriculture, and the National Aeronautics and Space Administration). The SED gathers infor-mation annually from 45,000 new U.S. research doctorate graduates about their educational his-tories, funding sources, and post-doctoral plans. Each year the SED data are added to a largerhistorical record of doctorate-degree graduates, the Doctorate Records File (DRF). Begun in 1920,the DRF contains annual information used to track the number of graduates in various fields; theeducational paths of scientists, engineers, and humanists; movement of graduates into the labormarket; and similar information.
National Postsecondary Student Aid Study (NPSAS)http://nces.ed.gov/surveys/npsas/design.asp
The design for the NPSAS sample involves selecting a nationally representative sample ofpostsecondary education institutions and students within those institutions.
To be eligible for inclusion in the institutional sample, an institution must have satisfied thefollowing conditions: (1) offered an education program designed for persons who have com-pleted secondary education, (2) offered an academic, occupational, or vocational program ofstudy lasting 3 months or longer, (3) offered access to the general public, (4) offered more thanjust correspondence courses, and (5) was located in the 50 states, the District of Columbia, orPuerto Rico. Also, beginning with NPSAS: 2000, eligible institutions must have a signed Title IVparticipation agreement with the U.S. Department of Education.
Part-time and full-time students enrolled in academic or vocational courses or programs atthese institutions, and not concurrently enrolled in a high school completion program, are eli-gible for inclusion in NPSAS. The 1987 NPSAS sampled students enrolled in the fall of 1986.Beginning with the 1990 NPSAS, students enrolled at any time during the year were eligible forthe study. This design change provided the data necessary to estimate full-year financial aidawards.
With a large, nationally representative sample of institutions and students, NPSAS providesa highly efficient and cost-effective way of identifying a nationally representative sample ofother student subpopulations of particular interest to policymakers, and providing baselinedata for a longitudinal study of these subpopulations. Specifically, beginning with the NPSAS:90 survey, alternate NPSAS data collections provide the base year sample for either the Begin-ning Postsecondary Students (BPS) longitudinal study or the Baccalaureate and Beyond (B&B)

Accounting Faculty in U.S. Colleges and Universities: Status and Trends, 1993–2004 Leslie
36 American Accounting Association
longitudinal study. For NPSAS: 90, NPSAS: 96, and NPSAS: 04, the longitudinal cohort com-prised students who began their postsecondary education during the NPSAS year; the BPS sur-veys followed these students over time to examine such issues as persistence and the effects offinancial aid on subsequent enrollment. NPSAS: 93 and NPSAS: 2000 have provided the base-year cohort for a sample of students who completed a baccalaureate degree during the NPSASyear; the B&B surveys followed these students over time to examine issues such as the transitionfrom college to work and access to graduate school.
NPSAS data come from multiple sources, including institutional records, government data-bases, and student telephone interviews. Detailed data concerning participation in student fi-nancial aid programs are extracted from institutional records. Data pertaining to family circum-stances, background demographic data, educational and work experiences, and expectationswere collected from students using a computer-assisted telephone interview.
REFERENCESBureau of Labor Statistics. 2006. Occupational Outlook Handbook, Accountants and Auditors. Avail-
able at: http://www.bls.gov/oco/ocos001.htm#earnings.Plumlee, D. H. et al. 2005. Report of the AAA/AAPLG Ad Hoc Committee to Assess the Supply and
Demand for Accounting Ph.D.s. Sarasota, FL: American Accounting Association. Availableat: http://aaahq.org/about/reports/FINAL_PhD_Report.pdf.
Sanders, B. 2005. The Supply of Accounting Graduates and the Demand for Public Accounting Re-cruits—2005: For Academic Year 2003–2004. New York, NY: American Institute of CertifiedPublic Accountants. Available at: http://ceae.aicpa.org/NR/rdonlyres/11715FC6-F0A7-4AD6-8D28-6285CBE77315/0/Supply_DemandReport_2005.pdf.