accounting for infrastructure regulation
TRANSCRIPT

Accounting for Infrastructure RegulationAn Introduction
Martin Rodriguez Pardina
Richard Schlirf Rapti
Eric Groom
43972
Pub
lic D
iscl
osur
e A
utho
rized
Pub
lic D
iscl
osur
e A
utho
rized
Pub
lic D
iscl
osur
e A
utho
rized
Pub
lic D
iscl
osur
e A
utho
rized
Pub
lic D
iscl
osur
e A
utho
rized
Pub
lic D
iscl
osur
e A
utho
rized
Pub
lic D
iscl
osur
e A
utho
rized
Pub
lic D
iscl
osur
e A
utho
rized

Accounting for Infrastructure Regulation
AFIR_00i-xiv_fm.indd iAFIR_00i-xiv_fm.indd i 4/3/08 8:31:37 AM4/3/08 8:31:37 AM

AFIR_00i-xiv_fm.indd iiAFIR_00i-xiv_fm.indd ii 4/3/08 8:31:37 AM4/3/08 8:31:37 AM

Accounting for Infrastructure Regulation
An Introduction
Martin Rodriguez Pardina
Richard Schlirf Rapti
Eric Groom
THE WORLD BANK
Washington, DC
AFIR_00i-xiv_fm.indd iiiAFIR_00i-xiv_fm.indd iii 4/3/08 8:31:38 AM4/3/08 8:31:38 AM

© 2008 The International Bank for Reconstruction and Development / The World Bank1818 H Street, NWWashington, DC 20433Telephone 202-473-1000Internet www.worldbank.orgE-mail [email protected]
All rights reserved.
1 2 3 4 :: 11 10 09 08
This volume is a product of the staff of the International Bank for Reconstruction and Development / The World Bank. The fi ndings, interpretations, and conclusions expressed in this volume do not necessarily refl ect the views of the Executive Directors of The World Bank or the governments they represent.
The World Bank does not guarantee the accuracy of the data included in this work. The boundaries, col-ors, denominations, and other information shown on any map in this work do not imply any judgment on the part of The World Bank concerning the legal status of any territory or the endorsement or acceptance of such boundaries.
Rights and PermissionsThe material in this publication is copyrighted. Copying and/or transmitting portions or all of this work without permission may be a violation of applicable law. The International Bank for Reconstruction and Development / The World Bank encourages dissemination of its work and will normally grant permission to reproduce portions of the work promptly.
For permission to photocopy or reprint any part of this work, please send a request with complete information to the Copyright Clearance Center Inc., 222 Rosewood Drive, Danvers, MA 01923, USA; tele-phone: 978-750-8400; fax: 978-750-4470; Internet: www.copyright.com.
All other queries on rights and licenses, including subsidiary rights, should be addressed to the Offi ce of the Publisher, The World Bank, 1818 H Street NW, Washington, DC 20433, USA; fax: 202-522-2422; e-mail: [email protected].
ISBN: 978-0-8213-7179-4eISBN: 978-0-8213-7180-0DOI: 10.1596/ 978-0-8213-7179-4
Library of Congress Cataloging-in-Publication Data
Rodríguez Pardina, Martin, 1961– Accounting for infrastructure regulation : an introduction / Martin Rodríguez Pardina, Richard Schlirf Rapti, Eric Groom. p. cm. Includes bibliographical references and index. ISBN-13: 978-0-8213-7179-4 ISBN-10: 0-8213-7179-7 ISBN-10: 0-8213-7180-0 (electronic) 1. Infrastructure (Economics)—Government policy. 2. Infrastructure (Economics)—Government policy. 3. Public utilities—Accounting—Government policy. 4. Corporations—Accounting—Government policy. 5. Disclosure in accounting—Government policy. I. Rapti, Richard Schlirf, 1960– II. Groom, Eric, 1954– III. Title.HC79.c3r63 2007657'.838—dc22 2007017934
AFIR_00i-xiv_fm.indd ivAFIR_00i-xiv_fm.indd iv 4/3/08 8:31:38 AM4/3/08 8:31:38 AM

v
Foreword . . . . . . . . . . . . . . . . . . . . . . . . . . . . . . . . . . . . . . . . . . . . . . . . . . . ix
Acknowledgments . . . . . . . . . . . . . . . . . . . . . . . . . . . . . . . . . . . . . . . . . . xi
Abbreviations . . . . . . . . . . . . . . . . . . . . . . . . . . . . . . . . . . . . . . . . . . . . . . xiii
1. Why Accounting Information Matters . . . . . . . . . . . . . . . . . . . . . . . . . 1
1.1. Objectives of public service regulation . . . . . . . . . . . . . . . . . . . . . 3
1.2. External and internal regulatory information . . . . . . . . . . . . . . . . . 5
1.3. Limitations of traditional accounting information for regulatory purposes . . . . . . . . . . . . . . . . . . . . . . . . . . . . . . . . . . . 8
1.4. Information exchange and participation: The need for processes and mechanisms . . . . . . . . . . . . . . . . . . . . . . . . . . . . 12
2. Case Studies . . . . . . . . . . . . . . . . . . . . . . . . . . . . . . . . . . . . . . . . . . . . . . . . 15
2.1. Case study 1: Privatization of an electricity and water operator in Africa—Initial contract not suffi ciently specifi c . . . . 15
2.2. Case study 2: Regulating operators in Latin America—Manual defi ciencies led to inconsistent cost accounting by different utilities . . . . . . . . . . . . . . . . . . . . . . . . . . . . . . . . . . . 18
2.3. Case study 3: Effi cient model company regulation in a Latin American country—Defi ciencies of benchmarking information and the need for regulatory accounting information . . . . . . . . . . 21
3. Corporate Information and Financial Accounting . . . . . . . . . . . . . . 27
3.1. Corporate information systems . . . . . . . . . . . . . . . . . . . . . . . . . . 27
3.2. Statutory fi nancial statements . . . . . . . . . . . . . . . . . . . . . . . . . . 29
Additional reading and resources . . . . . . . . . . . . . . . . . . . . . . . . . . . . . 41
4. Management and Cost Accounting . . . . . . . . . . . . . . . . . . . . . . . . . . . 43
4.1. Objectives of management and cost accounting . . . . . . . . . . . . 43
4.2. Cost classifi cations . . . . . . . . . . . . . . . . . . . . . . . . . . . . . . . . . . . 45
Contents
AFIR_00i-xiv_fm.indd vAFIR_00i-xiv_fm.indd v 4/3/08 8:31:38 AM4/3/08 8:31:38 AM

vi
4.3. Cost allocation . . . . . . . . . . . . . . . . . . . . . . . . . . . . . . . . . . . . . . . 53
Additional reading and resources . . . . . . . . . . . . . . . . . . . . . . . . . . . . . 61
5. Why Do Regulatory Accounting? . . . . . . . . . . . . . . . . . . . . . . . . . . . . . 63
5.1. Regulatory accounting and its objectives . . . . . . . . . . . . . . . . . . 64
5.2. General presentation of information needs. . . . . . . . . . . . . . . . . 65
5.3. Limitations of traditional and management accounting of the regulated company . . . . . . . . . . . . . . . . . . . . . . . . . . . . . . . . 68
5.4. Consistency between statutory accounts and regulatory accounts . . . . . . . . . . . . . . . . . . . . . . . . . . . . . . . . . . . 69
5.5. Regulators’ behavior and principles to follow . . . . . . . . . . . . . . . 70
5.6. Using accounting costs in tariff determination . . . . . . . . . . . . . 71
5.7. Regulatory accounting and auditing of regulated companies . . . 77
Additional reading and resources . . . . . . . . . . . . . . . . . . . . . . . . . . . . . 80
6. Core Issues in Regulatory Accounting . . . . . . . . . . . . . . . . . . . . . . . . 83
6.1. Separation of activities . . . . . . . . . . . . . . . . . . . . . . . . . . . . . . . . 84
6.2. Regulatory asset base determination . . . . . . . . . . . . . . . . . . . . . 92
6.3. Depreciation policies of the regulatory asset base . . . . . . . . . . . 98
6.4. Related-party transactions and transfer pricing . . . . . . . . . . . . 102
Additional reading and resources . . . . . . . . . . . . . . . . . . . . . . . . . . . . 108
7. Scope of a Regulatory Accounting System . . . . . . . . . . . . . . . . . . 111
7.1. Contents of regulatory accounting guidelines . . . . . . . . . . . . . . 111
7.2. Information exchange processes . . . . . . . . . . . . . . . . . . . . . . . 121
7.3. Need for competencies, tools, and time and methodology . . . 128
7.4. Legitimizing the regulatory methodology . . . . . . . . . . . . . . . . . 131
Additional reading and resources . . . . . . . . . . . . . . . . . . . . . . . . . . . . 132
Annex 1
Understanding Financial Statements: Ratio Analysis . . . . . . . . . . . . . 135
Liquidity ratio analysis . . . . . . . . . . . . . . . . . . . . . . . . . . . . . . . . . . . . 136
Activity ratios . . . . . . . . . . . . . . . . . . . . . . . . . . . . . . . . . . . . . . . . . . 137
Capital structure (leverage ratios) . . . . . . . . . . . . . . . . . . . . . . . . . . . 138
Profi ts and profi tability . . . . . . . . . . . . . . . . . . . . . . . . . . . . . . . . . . . . 139
Annex 2
Regulatory Model . . . . . . . . . . . . . . . . . . . . . . . . . . . . . . . . . . . . . . . . . . . . . . 141
What are regulatory models? . . . . . . . . . . . . . . . . . . . . . . . . . . . . . . . 142
Matching regulatory objectives and instruments. . . . . . . . . . . . . . . . 146
Contents
AFIR_00i-xiv_fm.indd viAFIR_00i-xiv_fm.indd vi 4/3/08 8:31:38 AM4/3/08 8:31:38 AM

vii
What regulators need to know about the operator’s fi nances . . . . . 150
Conclusion . . . . . . . . . . . . . . . . . . . . . . . . . . . . . . . . . . . . . . . . . . . . . 151
Annex 3
Examples of Guidelines and Templates . . . . . . . . . . . . . . . . . . . . . . . . . . 155
Australia: Electricity Industry Guideline . . . . . . . . . . . . . . . . . . . . . . . 155
Australia: Regulatory Accounting Statements—Templates . . . . . . . . 156
United Kingdom: Ofwat Regulatory Accounting Guideline . . . . . . . . 167
United Kingdom: Ofwat Regulatory Accounting Statements—Templates . . . . . . . . . . . . . . . . . . . . . . . . . . . . . . . . . . . . . . . . . . . . . . 167
Annex 4
Impacts of Alternative Depreciation Profi les . . . . . . . . . . . . . . . . . . . . . 175
Perspectives on depreciation . . . . . . . . . . . . . . . . . . . . . . . . . . . . . . . 175
Regulatory approaches to depreciation . . . . . . . . . . . . . . . . . . . . . . . 176
Alternative approaches to depreciation . . . . . . . . . . . . . . . . . . . . . . . 177
Estimation of asset lives . . . . . . . . . . . . . . . . . . . . . . . . . . . . . . . . . . 178
Impact of different approaches to calculating depreciation . . . . . . . . 179
Data requirements . . . . . . . . . . . . . . . . . . . . . . . . . . . . . . . . . . . . . . . 184
Principles for depreciation . . . . . . . . . . . . . . . . . . . . . . . . . . . . . . . . . 184
Annex 5
List of Sample Performance Indicators . . . . . . . . . . . . . . . . . . . . . . . . . . 187
Annex 6
Cost Allocation: Illustration of a Step-by-Step Approach . . . . . . . . . 189
Step 1: Identify cost objectives . . . . . . . . . . . . . . . . . . . . . . . . . . . . . 189
Step 2: Identify direct costs . . . . . . . . . . . . . . . . . . . . . . . . . . . . . . . . 189
Step 3: Classify indirect costs and allocate cost pools to cost objectives . . . . . . . . . . . . . . . . . . . . . . . . . . . . . . . . . . . . . . . . . . 189
Annex 7
Regulatory Asset Base Valuation . . . . . . . . . . . . . . . . . . . . . . . . . . . . . . . . 193
Valuation approach . . . . . . . . . . . . . . . . . . . . . . . . . . . . . . . . . . . . . . . 196
Regulatory asset base and accounting . . . . . . . . . . . . . . . . . . . . . . . 198
Bibliography . . . . . . . . . . . . . . . . . . . . . . . . . . . . . . . . . . . . . . . . . . . . . . . . . . .205
Index . . . . . . . . . . . . . . . . . . . . . . . . . . . . . . . . . . . . . . . . . . . . . . . . . . . . . . . . . . 211
Contents
AFIR_00i-xiv_fm.indd viiAFIR_00i-xiv_fm.indd vii 4/3/08 8:31:38 AM4/3/08 8:31:38 AM

AFIR_00i-xiv_fm.indd viiiAFIR_00i-xiv_fm.indd viii 4/3/08 8:31:38 AM4/3/08 8:31:38 AM

ix
Foreword
The Enron crisis offered a dramatic reminder to regulators around the world that
reliable accounting standards are essential for markets to work effi ciently and fairly.
Harvey Pitt, chairman of the regulatory agency responsible for the monitoring of
accountants in the United States (the Securities and Exchange Commission) from
2001 to 2003, argued that the crisis revealed two problems with accounting that
needed to be addressed by the regulators. The fi rst problem is that the accountants
may have gotten some of the accounting wrong. The second, and more important,
problem is that they may have gotten a lot of the accounting right (see http://www.
pbs.org/wgbh/pages/frontline/shows/regulation/lessons/).
This general point should ring true to anyone working on utilities regulation.
For utilities, as for any other sector, poor accounting practice or creative accounting
generates winners and losers. Whoever controls the accounting information is likely
to be the winner; the others—including the users, who will pay excessive tariffs, or
the taxpayers, who will be asked to justify unjustifi ed subsidies—will be the losers.
Failure to recognize this reality fi gures prominently in many of the high-profi le
confl icts from Latin America to Africa over distribution of the rents created by
reform processes.
In the future, utilities regulators will need to be much more serious about ensur-
ing that accounting rules are spelled out. Clear rules are essential to the implemen-
tation of the regulatory designs intended to achieve a fair distribution of opera-
tional gains and losses among all actors. In many countries in crisis, such a
distribution is likely to help investors and operators as much as taxpayers and users,
because it will tend to generate the information needed for accurate estimation of
returns to businesses.
To ensure that this information is generated without penalizing anyone, regula-
tory accounting rules must be explicit. This volume describes a set of rules with
AFIR_00i-xiv_fm.indd ixAFIR_00i-xiv_fm.indd ix 4/3/08 8:31:38 AM4/3/08 8:31:38 AM

x
which utilities monopolies should be able to comply without threat to a fair return
on their business, while at the same time ensuring the accountability of all players.
Regulators in many member countries of the Organisation for Economic Co-oper-
ation and Development and in the electricity sector in many developing countries
use these rules. There is no reason why they should not be of value to regulators of
all public service providers that enjoy strong residual monopoly rights. Ultimately,
this book is about rules for maintaining the minimum level of accountability
needed to achieve fair treatment of investors, operators, users, and taxpayers alike
and to prevent preferential treatment of the stakeholder with the highest political
leverage at any point in time.
Antonio Estache
Senior Economic Adviser
Sustainable Development Network
The World Bank
Foreword
AFIR_00i-xiv_fm.indd xAFIR_00i-xiv_fm.indd x 4/3/08 8:31:38 AM4/3/08 8:31:38 AM

xi
Acknowledgments
This volume draws on the knowledge of many regulators and utilities analysts
around the world. Some of these experts are colleagues; others have provided work
that we have used without benefi t of collaboration. Regulatory accounting is a bur-
geoning fi eld of endeavor, and regulators are increasingly establishing and publish-
ing regulatory accounting requirements and standards. Awareness of and reference
to all these efforts is impossible. Our apologies go to those we have neither cited nor
sourced.
We owe a special thanks to Commissioner Rauf Tan (Energy Regulatory Com-
mission of the Philippines) and Fiona Towers (Independent Pricing and Regulatory
Tribunal of New South Wales, Australia) for their careful review of and insightful
comments on the draft of this volume. We would also thank Anwar Ravat, Sergio
Perelman, Lourdes Trujillo, Charles Kenny, Tony Gomez-Ibanez, Daniel Benitez
and Tina Soreide for useful and perceptive comments and discussions, and the
many World Bank staff members who participated in workshops related to the vol-
ume and who provided valuable guidance.
Special thanks also go to Tomas Serebrisky, who, with support from Antonio
Estache and Clive Harris, managed the project from which this volume emerged.
Finally, we wish to acknowledge the World Bank Infrastructure Economics and
Finance Department and the World Bank Institute for support and funding.
AFIR_00i-xiv_fm.indd xiAFIR_00i-xiv_fm.indd xi 4/3/08 8:31:38 AM4/3/08 8:31:38 AM

AFIR_00i-xiv_fm.indd xiiAFIR_00i-xiv_fm.indd xii 4/3/08 8:31:39 AM4/3/08 8:31:39 AM

xiii
Abbreviations
ABC activity-based costing [cost-allocation method]
AFUDC allowance for funds used during construction
AGL Australian Gas Light Company
FDC fully distributed cost [accounting approach to cost allocation]
FRS fi nancial reporting standard
GAAP generally accepted accounting principles
IASB International Accounting Standards Board
ICC Interstate Commerce Commission [U.S.]
IFRS International Financial Reporting Standards
IPART Independent Pricing and Regulatory Tribunal (New South Wales)
IV indicative value
MAR market-to-asset ratio
MMC Monopolies and Mergers Commission (United Kingdom)
NER National Electricity Regulator (South Africa)
PCG Plan Comptable Général
RAGs regulatory accounting guidelines
RPI-X retail price index minus expected future productivity gains
Syscoa Système Comptable Ouest-Africain
AFIR_00i-xiv_fm.indd xiiiAFIR_00i-xiv_fm.indd xiii 4/3/08 8:31:39 AM4/3/08 8:31:39 AM

AFIR_00i-xiv_fm.indd xivAFIR_00i-xiv_fm.indd xiv 4/3/08 8:31:39 AM4/3/08 8:31:39 AM

1
In the last 20 or so years, infrastructure sectors all over the world have undergone a
deep transformation. Starting with deregulation in the United States and deregula-
tion and privatization in the United Kingdom, the movement quickly spread to other
countries, notably countries in Latin America but also those in Africa and Asia.
In many cases the restructuring involved the introduction of competition in the
market in at least some service segments. Among these segments were long-dis-
tance calls in the telecommunications sector, and production and supply in energy
markets (electricity and gas).
But competition was not a possibility in sectors characterized by large sunk
investments, a large share of fi xed costs, and economies of scale and scope. In these
sectors the effi cient economic decision is to have just one service provider, which
means that regulation was necessarily an integral part of the transformation.
A key element in the transformation of activities in which competition was not
a solution was the division of policy-making, regulator, and service-provider func-
tions into distinct institutions. In the past, many state-owned enterprises had been
performing—legally or de facto—all three functions, but the reform wave of the
1990s stressed the need to move regulation into an independent body. In many
cases the transformation also involved the participation of the private sector in
provision of the service.
Economic theory suggests that a monopolist will have strong incentives to reduce
quantities and raise prices, reducing total welfare in society.1 The solution to this
market failure is to impose certain restrictions on the behavior of the fi rm through
direct or indirect regulation of profi ts, prices, and service conditions.
Although natural monopolies have been regulated for well over a century, not
until the late 1970s and early 1980s did economic theory consider information to
be a key element of the regulatory game. Laffont (1999) points out two important
Why Accounting Information Matters
Chapter 1
AFIR_001-014_ch01.indd 1AFIR_001-014_ch01.indd 1 4/3/08 8:33:45 AM4/3/08 8:33:45 AM

2
Accounting for Infrastructure Regulation: An Introduction
1
theoretical milestones. First, Loeb and Magat (1979) propose viewing regulation as
a contractual relationship in which a regulator, the principal, attempts to control a
fi rm, the agent. They emphasize that the main diffi culty is the regulator’s lack of
information about the regulated fi rm. Second, Baron and Myerson (1982) show
that there is a trade-off between effi ciency and the unavoidable informational rents
that must be given up to a regulated fi rm when the regulator wants a project to be
realized but does not know the cost of the regulated fi rm.
Since these seminal studies appeared, economists have understood regulation as
a game of two players—the regulator and the fi rm—that do not share the same
information. Laffont and Tirole’s (1994) model with cost or profi t observability
and with asymmetry of information about the fi rm’s technology and (unobserv-
able) cost-reducing efforts became the basic paradigm of the theoretical analysis of
regulation.
While economic theory moved toward highlighting the role of information in
regulation, regulatory practice in many countries appeared to move in the opposite
direction. The introduction of price-cap regulation in the United Kingdom with
the RPI-X (retail price index minus expected future productivity gains) system was
interpreted—erroneously—by many practitioners as a mechanism that freed them
from the need to rely on detailed information on regulated companies. With the
regulatory function limited to estimating the effi ciency factor once every four or
fi ve years, there appeared to be little need to generate a detailed system of informa-
tion on the regulated fi rm or fi rms.2
After 10 years of regulatory practice in the wake of many countries’ restructuring
of infrastructure sectors in the 1990s, this false perception is rapidly vanishing, and
the unavoidable need for a reliable information system that enables regulators to
fulfi ll their complex objectives has become even clearer. As Estache and Burns
(1999a, 1) point out,
[t]he initial ineffectiveness of regulation resulting from information gaps creates
allocative ineffi ciencies but just as important carries political and social ramifi -
cations which can endanger the stability of the regulatory regime. In developing
countries, this infl uences the incentives to operate effi ciently and the cost of
investment and often ends up threatening the sustainability of the increased role
of the private sector in the delivery of infrastructure services and ultimately, the
foundations of the overall reform process itself.
This context is one in which a regulatory accounting system is an important
source of reliable information for regulators to use to adequately fulfi ll their duties.
AFIR_001-014_ch01.indd 2AFIR_001-014_ch01.indd 2 4/3/08 8:33:45 AM4/3/08 8:33:45 AM

3
Why Accounting Information Matters
1
Good, accurate, and consistent information provides the basis of effective regula-
tion. Regulatory accounting can help to establish a reasonably defi ned and stable
reporting regime. As Byatt (1991, 124) points out,
stability in the reporting cycle and avoidance of ad hoc requests should assist
those planning and managing the industry. It should also facilitate the integra-
tion of information systems for both internal and external reporting.
Chapter 1 of this volume sets up the conceptual framework of regulation. It dis-
cusses the main regulatory objectives and the information needs derived from
them. Chapter 2 presents three case studies illustrating some of the typical informa-
tional problems faced by regulators all over the world.
Chapters 3 and 4 cover the main elements of standard management information
systems and statutory and cost accounting. The objective is to introduce the main
accounting principles and concepts for those who are not familiar with them. Those
who have a working understanding of these topics can skip these chapters without
losing the thread of the discussion.
Chapter 5 presents the main elements of regulatory accounting, stressing simi-
larities to and differences with statutory and cost accounting principles. Chapter 6
covers in some detail four of the main elements of regulatory accounting: separa-
tion of activities, the regulatory asset base, depreciation policies of the regulatory
asset base, and transactions with related parties. Chapter 7 presents an outline of
regulatory accounting guidelines.
1.1. Objectives of public service regulation
From an economic perspective, public service regulation seeks to secure four basic
objectives: sustainability, allocative effi ciency, productive effi ciency, and equity.3
Economic and fi nancial sustainability implies that tariffs should generate enough
revenue to allow an effi cient fi rm to cover the economic costs of service provision.
When referring to economic costs (as opposed to accounting costs), a just and fair rate
of return on the capital invested in the provision of the service is explicitly included.
Allocative effi ciency requires that—in an environment of scarce resources and
alternative uses for them—tariffs equal service production costs. Strictly speaking,
allocative effi ciency requires that tariffs refl ect their marginal costs. Under natural
monopoly conditions, however, a fi rm would not cover its average production
costs, so there is a need to reconcile these objectives.
AFIR_001-014_ch01.indd 3AFIR_001-014_ch01.indd 3 4/3/08 8:33:45 AM4/3/08 8:33:45 AM

4
Accounting for Infrastructure Regulation: An Introduction
1
Productive effi ciency relates to the minimization of costs at a certain production
level or the maximization of output given the amount of inputs. A fi rm’s incentives
to minimize costs will depend on the rules used to adjust tariffs in the future. There
is a trade-off here between allocative effi ciency and productive effi ciency, because
incentives can only be created by breaking a link—if only temporarily—between a
fi rm’s costs and tariffs.
Equity or distributive effi ciency relate to access and affordability. Many regulatory
regimes have universal service access as a medium- or long-term goal. For many
essential infrastructure services, the need to relate tariffs to the poorest users’ capac-
ity to pay is well accepted.
Simplicity, certainty, consistency, and price stability are also important elements
of many regulatory regimes. Given that, to a large extent, regulation involves deal-
ing with confl icting interests of the parties involved (actual, potential, and future
users; fi rms; government; lenders), the formal and procedural aspects of any regu-
latory decision are as important as the substantive aspects. For example, the formal
principles considered relevant to the derivation of regulatory decisions of the Inde-
pendent Pricing and Regulatory Tribunal (IPART) of New South Wales, Australia,
are the following:
• Simplicity. Deriving the optimal approach for regulatory decisions may be a
complex task. All things remaining constant, a simple approach that approxi-
mates a more complex calculation should be preferred.
• Certainty and consistency. The effi ciency of investment in regulated activities is
enhanced by consistency in decisions across time and, absent strong grounds to
do otherwise, adherence to previous commitments. The ease with which an
approach can be replicated from one regulatory period to the next may be an
important contributor to certainty and consistency.
• Price stability. All else remaining constant, a lower variance in prices over time
and more equal intertemporal allocation of common costs across customers
may be preferred.4
Achieving these objectives and the trade-offs they require makes regulation an
information-intensive activity. Moreover, regulation features a strong informa-
tion asymmetry between the fi rm and the regulator in relation to the regulated
fi rm’s underlying costs, market prospects, and (to the regulator) unobservable
actions.
AFIR_001-014_ch01.indd 4AFIR_001-014_ch01.indd 4 4/3/08 8:33:45 AM4/3/08 8:33:45 AM

5
Why Accounting Information Matters
1
1.2. External and internal regulatory information
One classifi cation of the information needed for regulation is based on the source
from which the information is obtained. This classifi cation differentiates between
information originating in the fi rm and information from other sources.5
Information originating in the fi rm
The main source of information on unregulated activities is the accounting infor-
mation generated by the fi rm. The fi rm generates fi nancial accounting aimed at
external parties (information to be used by shareholders, the fi nancial community,
fi scal administrations, the public) and management accounting or cost accounting
aimed at internal parties (management; see chapter 3).
Accounting in general is defi ned as a system for classifying the economic events
occurring in a business. It deals with recording, classifying, and summarizing the
economic operations of a business to establish a fi rm’s fi nancial capacity; and with
interpreting the results. Therefore, accounting provides a means for investors, man-
agers, and directors to follow the course of their businesses (see box 1.1). Ideally, it
provides an accurate picture of a fi rm’s stability and creditworthiness, the fl ow of
collections and payments, the trends in sales, overall costs and expenses, and so on.
Importantly, accounting information constitutes an integrated body of consistent
information.
Accounting information is governed by general rules aimed at determining the
basic elements that must be included to meet its objectives.
Economic theory states that the use of the fi rm’s own economic and fi nancial
data create incentive problems.6 Some regulatory regimes therefore seek to mini-
mize the use of the fi rm’s own information. Such is the case, for example, of effi -
cient-fi rm regulation (which originated in the electricity sector in Chile and then
spread to Peru, Bolivia, and other countries in Latin America).7 A similar approach
was adopted in the U.S. telecommunications sector through the use of cost models
such as the model developed by the Federal Communications Commission to
determine interconnection charges. Although this approach might appear to solve
the incentives problem, it does not properly take into account economic sustain-
ability objectives. Its use may be most relevant to the telecommunications sector in
which competition in the market is the norm and sustainability concerns are not
central for the regulator.
AFIR_001-014_ch01.indd 5AFIR_001-014_ch01.indd 5 4/3/08 8:33:46 AM4/3/08 8:33:46 AM

6
Accounting for Infrastructure Regulation: An Introduction
1
However, as long as economic and fi nancial sustainability is an objective, regula-
tion has to use the fi rm’s own data on costs, revenues, assets, and liabilities.8 The
main source of information, though clearly not the only one, is the fi rm’s account-
ing information. The requirement to use this information is reinforced by the posi-
tion adopted by the courts in a range of countries that have regarded the actual
costs and fi nancial condition of the utility as key elements to be taken into account
by the regulator.
Box 1.1. General objectives of external fi nancial reporting by business companies
Financial reporting should provide information that helps current and potential investors, creditors, and other users do the following:
• Make rational investment, credit, and similar decisions. The information should be comprehensible to those who have a rea-sonable understanding of business and economic activities and who are willing to study the information with reasonable diligence.
• Assess the amounts, timing, and uncertainty of prospective cash receipts from dividends or interest and the proceeds from the sale, redemption, or maturity of securities or loans. Because investors’ and creditors’ cash fl ows are related to enterprise cash fl ows, fi nancial reporting should provide information to help investors, creditors, and others assess the amounts, tim-ing, and uncertainty of prospective net cash infl ows to the related enterprise.
• Assess the economic resources of an enterprise; the claims to those resources (obligations of the enterprise to transfer resources to other entities and owners’ equity); and the effects of transactions, events, and circumstances that change the enterprise’s resources and claims to those resources.
Source: U.S. Financial Standards Accounting Board, Concepts Statement No. 1, Objectives of Financial Reporting by Business Enterprises (fi rst issued in 1978).
AFIR_001-014_ch01.indd 6AFIR_001-014_ch01.indd 6 4/3/08 8:33:46 AM4/3/08 8:33:46 AM

7
Why Accounting Information Matters
1
The nature of “traditional” fi nancial accounting information and some basic
underlying principles of accounting in general make these data useful from a regu-
latory standpoint but far from suffi cient. This chapter discusses some of the ele-
ments differentiating the regulator’s needs from needs met by traditional account-
ing information.
Information originating outside the fi rm
Public service regulation cannot be based exclusively on information from the fi rm
itself. To meet different regulatory objectives, the regulator must have information
on the demand for and supply of the regulated service from outside the fi rm as
well.
With respect to supply, the regulator needs to be able to determine whether the
fi rm’s costs are consistent with an appropriate level of effi ciency. Therefore, the reg-
ulator needs information on available technologies and reasonable service costs to
assess the fi rm’s relative effi ciency. The regulator can rely on either technological
information or effi ciency benchmark studies.
The regulator needs to thoroughly understand the functioning of the regulated
sector, its technologies, and their application. The object is not to micromanage the
fi rm, but to assess the fi rm’s proposals from a technical and an economic perspective.
Information on standard costs of products and typical processes are examples of
important elements to be considered in the determination of effi cient cost levels.
In recent years regulators have emphasized the use of effi ciency frontiers (apply-
ing data envelope analysis or total factor productivity methods) as a useful tool for
reducing information asymmetry.9 Clearly, these studies are possible only when
there is homogeneous information about a relatively large number of fi rms in the
same sector or activity (to determine the relative effi ciency of each fi rm) and over a
relatively long period of time (to get measures of technological change over time).
This need calls for unifi cation of the criteria used to collect both accounting and
extra-accounting information, to ensure its homogeneity and comparability and to
achieve a high degree of consistency of information over time.
The regulator also requires detailed information about the demand for goods
and services faced by the regulated fi rm. Achieving allocative effi ciency and equity,
in particular, calls for detailed information about users’ behavior.
Regulators need reliable information about expected demand in the medium
term. Revenue may vary directly with demand but, because of the fi xed nature of
many infrastructure costs, current costs may not vary greatly with variations in
AFIR_001-014_ch01.indd 7AFIR_001-014_ch01.indd 7 4/3/08 8:33:46 AM4/3/08 8:33:46 AM

8
Accounting for Infrastructure Regulation: An Introduction
1
demand. Thus changes in demand can have a signifi cant impact on the economic
performance of infrastructure companies.
The greatest impact of demand variations on company expenses is on the
amount and timing of investments. The indivisibility and long construction times
of many infrastructure facilities make it necessary to decide on their construction
long (typically several years) before they are to commence operations. Therefore,
an optimal expansion plan requires the ability to estimate demand quite accurately
for a good number of years into the future.
Quantities demanded by users depend directly on price through a parameter
known as price elasticity.10 Consequently, the quantities consumed are to some
extent endogenous to the tariffs set by the regulator. This fi nding has an important
impact on the sustainability of the service.
Equity objectives seek to ensure access and affordable tariffs for infrastructure
services for the poorest segments of society. Although public service tariffs are not
the best instrument of social policy, and output-based aid is a more effi cient and
transparent means of achieving equity objectives, in many cases fi scal and budget-
ary constraints limit the alternatives of direct subsidies and tariffs. Access prices
that explicitly account for the conditions of poor users may be appropriate.
Whether cross-subsidies, promotion funds, or some other forms of access sub-
sidy are used, effi cient implementation requires detailed information about the
consumption patterns of the users to whom these policies are targeted. Capacity
and willingness-to-pay studies represent essential elements of an effi cient tariff
policy seeking to meet the access and service needs of poor users.
That this information is often necessary for regulatory purposes does not mean
that it must be generated directly by the regulator. Indeed, much of this informa-
tion, or the data needed to estimate it, is routinely produced by statistical agencies
or other government organizations or research centers. Regulators can use their
limited resources effi ciently by identifying information sources and adjusting avail-
able data to meet their own needs.
1.3. Limitations of traditional accounting information for regulatory purposes
Traditional accounting information and some of the basic underlying principles of
accounting make this information useful for regulatory purposes. Nevertheless,
AFIR_001-014_ch01.indd 8AFIR_001-014_ch01.indd 8 4/3/08 8:33:46 AM4/3/08 8:33:46 AM

9
Why Accounting Information Matters
1
regulatory purposes differentiate the regulator’s needs from needs met by tradi-
tional accounting information in several areas:
• Financial accounting information focuses on the fi rm, whereas the regulator
focuses mainly on the regulated activities of the fi rm. From a regulatory perspec-
tive, the coexistence of regulated and unregulated activities within the fi rm calls
for the separation of the costs and revenue of the two types of activities. More-
over, some fi rms may engage in activities subject to regulation by different regu-
lators. Separation of information related to each of the activities, but particularly
to the regulated and unregulated activities, places an important limitation on
traditional accounting when used by the regulator.
• The focus of accounting within a fi rm may not be suffi cient when a regulator
regulates more than one fi rm in the same activity. Applying certain regulatory
tools, such as yardstick competition, calls for a degree of homogeneity in the
identifi cation of accounts that is not always achieved by generally accepted
accounting principles. See box 1.2 for a typical example of this problem.
• Accounting is usually based on a temporal cost imputation rule that may not
always refl ect regulatory needs. The regulator can determine tariffs that allow
the recovery of costs when these costs are incurred or when the costs would be
recognized in the fi nancial accounts of the fi rm. Most regulatory agencies do not
allow an asset to be included in the asset base until the asset is in service. To cover
the fi nancial costs associated with long-maturity projects, regulatory practice
allows capitalization of the fi nancial costs incurred during construction
(AFUDC—allowance for funds used during construction). This strategy also
departs from the accounting practices of unregulated fi rms and from generally
accepted accounting principles.
• General accounting principles are inadequate for dealing with common costs
that need to be allocated not only among different regulated services, but also
between the regulated and unregulated activities of the fi rm because different
allocation criteria will substantially affect the achievement of regulatory objec-
tives.11 A regulated fi rm would have strong incentives to allocate common costs
to its regulated activity rather than to any of its competitive activities.
These examples are only illustrative examples of the limitations of traditional
accounting data for regulatory purposes. These limitations make it necessary to
complement generally accepted accounting principles with specifi c rules and norms
that make accounting information useful for regulation purposes.
AFIR_001-014_ch01.indd 9AFIR_001-014_ch01.indd 9 4/3/08 8:33:46 AM4/3/08 8:33:46 AM

10
Accounting for Infrastructure Regulation: An Introduction
1
Box 1.2. Cost structures of gas companies in Argentina: The importance of homogeneity across fi rms in the identifi cation of accounts
Gas Natural Ban (Gasban) and Metrogas are two of nine natural gas distribution companies in Argentina. Both provide services in Buenos Aires and are similar in number of customers and market share. The table below shows their cost struc-tures as they appear in their balance sheets.
GASBAN
1996 1998 2000
Amount share (M$)
Amount share (%)
Amount share (M$)
Amount share (%)
Amount share (M$)
Amount share (%)
Administrative expenses 15,406 31.0 9,311 20.4 9,893 18.6
Sales expenses 34,317 69.0 36,253 79.6 43,260 81.4
Total 49,723 45,564 53,153
METROGAS
Administrative expenses 52,649 76.8 48,572 74.1 31,271 44.8
Sales expenses 15,905 23.2 16,940 25.9 38,539 55.2
Total 68,554 65,512 69,810
The difference in the accounting cost structure of the two companies is great: proportions of administrative expenses and sales expenses are nearly reversed. Some of this difference may be due to differences in the markets served by the two companies. Another cause might be different classifi cation criteria—although both sets of criteria are consistent with generally accepted accounting principles. From a regulatory standpoint, comparison of the accounting cost structure of the companies is extremely diffi cult. The regulator loses the use of a fundamental tool such as yardstick competition.
Source: Author.
AFIR_001-014_ch01.indd 10AFIR_001-014_ch01.indd 10 4/3/08 8:33:46 AM4/3/08 8:33:46 AM

11
Why Accounting Information Matters
1
In some cases, a system of management or cost accounting more elaborate
than that the fi rm is using may be needed to properly identify the revenues and
costs associated with regulated activities and unregulated activities. In other
cases, management may already collect similar information for its own purposes,
and regulatory compliance may entail reallocations or modifi cations of existing
cost allocation rules for the purpose of harmonization with regulatory
requirements.
Specifi c cost-recording and allocation rules will clearly depend on the regulated
sector, its sectoral and institutional organization (number of companies within the
regulator’s scope, extent of competition among the different segments, extent of
vertical integration, and the like), and particular features of the regulatory regime
(price caps, cost of service, hybrid systems). Development of these specifi c rules—
in a manner as consistent as possible with generally accepted accounting princi-
ples—is the aim of regulatory accounting.
The need for information for regulation goes beyond accounting data. Regula-
tion also requires information related to physical aspects of the service (employees,
productive units) and various dimensions of the quality of the service (number and
duration of outages, water pressure, variations in voltage, rugosity of roads, punc-
tuality of services).
This information is not costless. The regulator must defi ne precisely the
acceptable bases for cost allocations and the formats and content of information
presented, as well as detailed processes for sharing and validating that informa-
tion. Validation is itself a demanding process. Most private operators think that
because their accounting data have been validated by their auditors and their
board, the regulator is not entitled to reassess the data. This belief is a major point
of possible misunderstanding of the regulator’s role. Accounting data that are
valid from a legal and fi scal point of view are not necessarily valid from an eco-
nomic point of view. One of the duties of a regulator is to validate the operator’s
data economically (proper allocation of revenues and costs, effi cient level of
costs). But the requirement should be cost effective and no more stringent than
necessary.
In summary, regulatory accounting should be considered an important ele-
ment within a system of regulatory information. This system would include the
fi rm’s own information—both accounting and extra-accounting—and external
information that is also necessary for regulation. Moreover, the design of the
requirements should have regard for existing accounting systems and the cost of
compliance.
AFIR_001-014_ch01.indd 11AFIR_001-014_ch01.indd 11 4/3/08 8:33:46 AM4/3/08 8:33:46 AM

12
Accounting for Infrastructure Regulation: An Introduction
1
1.4. Information exchange and participation: The need for processes and mechanisms
In addition to the quantitative information described above, the regulator requires
information about the preferences and opinions of the regulatory system’s players
(users, fi rms, investors, government, unions).
Because regulation must deal with competing objectives and multiple trade-offs,
the process used to collect the information and to make decisions is as important as
the technical know-how for tariff setting. In this respect, the various mechanisms
for public consultation and dispute resolution play a leading role.
Consultation documents and public hearings are two instruments that regula-
tors can use to learn about the opinions and preferences of stakeholders in the regu-
latory process. These instruments contribute not only to information collection,
but also to public perceptions of the regulator’s performance. An open, transparent,
and participatory process is essential for public legitimization of regulation.
The long-term nature of the regulatory relationship between the fi rm and the
regulator implies that information problems will recur. From the outset of the reg-
ulatory process—ideally before private participation takes place—considerable
effort should go into determining the rules that will govern the management and
interchange of information. To maintain value, that initial investment in informa-
tion gathering must be regularly updated, improved, and optimized throughout
the life of the regulatory contract.
Notes
1. See Berg and Tschirhart (1988) for a theoretical explanation and an account of the history
of regulation in the United States.
2. Eliminating information from the regulatory process was not at all the view of some of the
key players in the UK regulatory system. Beesley and Littlechild (1989) argue that to conduct the
“twin tasks of controlling prices and promoting competition, the regulator thus needs to acquire
adequate information concerning the scope for cost reductions and the extent and effects of new
entry” (p. 29). “The generation and dissemination of information are therefore at the heart of
regulatory effectiveness” (p. 58).
3. Estache and others (2002) contains a detailed discussion of regulatory objectives and
instruments.
4. See www.ipart.nsw.gov.au.
5. For further discussion on this topic, see Estache and Burns (1999a and 1999b).
AFIR_001-014_ch01.indd 12AFIR_001-014_ch01.indd 12 4/3/08 8:33:46 AM4/3/08 8:33:46 AM

13
Why Accounting Information Matters
1
6. See Laffont and Tirole (1994) for a model with a detailed theoretical discussion of incen-
tives problems in regulation.
7. Effi cient-fi rm regulation focuses on incentives to achieve productive effi ciency and alloca-
tive effi ciency (dynamic or long term). Financial sustainability is not properly accounted for in
this approach, although in the electricity sector in Chile there is an overall test of the revenue
generated to the fi rms in the sector by tariffs determined on the basis of the effi cient fi rm. How-
ever, this test has such a large margin (internal rate of return between 4 percent and 12 percent)
that it does not properly meet the sustainability objective. See Galetovic and Bustos (2004) for a
theoretical discussion of effi cient-fi rm regulation in the Chilean context.
8. See Grifell-Tatjé and Lovell (2003) for the standard practice of benchmarking actual mana-
gerial performance against best practice standards established by engineers. They fi nd the consul-
tancy’s ideal distribution network to be much less costly to operate. When they decompose the
cost differential into three sources, they fi nd that the superior network design combined with
lower input prices accounts for more than all of the predicted cost savings. They also fi nd that
incumbent managers are more cost effi cient than the consultancy, and they speculate that the
superior cost effi ciency of the incumbent managers is due in part to the engineering diffi culty of
creating an “ideal” distribution network.
9. See Coelli and others (2003) for an introduction to effi ciency measurement in public utili-
ties, and Rossi and Ruzzier (2001) for an analysis of the use of effi ciency measures in regulation.
10. Formally, price elasticity is the percentage variation in the quantity demanded after a
1 percent change in the price of the good.
11. The mere existence of both regulated activities and unregulated activities within a fi rm
assumes some degree of complementarity or economies of scope between them; otherwise, the
fi rm would not need to develop the activities jointly. This leads to the existence of common
costs.
AFIR_001-014_ch01.indd 13AFIR_001-014_ch01.indd 13 4/3/08 8:33:46 AM4/3/08 8:33:46 AM

AFIR_001-014_ch01.indd 14AFIR_001-014_ch01.indd 14 4/3/08 8:33:47 AM4/3/08 8:33:47 AM

15
Case Studies
Chapter 2
This chapter illustrates some of the main issues relating to regulatory information and regulatory accounting through three case studies. The fi rst case describes the recent privatization of an African country’s only water and electricity operator through the sale of a majority stake and the granting of a 20-year concession. One year after the privatization, a controversy over the indexation formula revealed many problems, including misunderstandings of and weaknesses in the contract. The second case focuses on a Latin American country’s electricity distribution sector and on information related to the separation of activities into regulated and unregulated activities. The third case presents the infor-mation problem in the water and sanitation sector in another Latin American country, where regulation is enforced on the basis of a theoreti-cally effi cient model (“ideal operator”).
2.1. Case study 1: Privatization of an electricity and water operator in Africa—Initial contract not suffi ciently specifi c
This case, involving a generally well-designed legal regulatory framework for a
concession contract, illustrates two common problems: the lack of visibility of
tariffs, and parties’ poor understanding of regulatory requirements and informa-
tion needs.
An African country decided to privatize its water and electricity operator. Fol-
lowing a bidding process, the state sold the majority of its shares to a foreign opera-
tor and granted the company a 20-year concession in two separate contracts, one
for water services and one for electricity services.
AFIR_015-026_ch02.indd 15AFIR_015-026_ch02.indd 15 4/3/08 8:35:35 AM4/3/08 8:35:35 AM

16
Accounting for Infrastructure Regulation: An Introduction
2
Before the contracts were signed, a legal framework was established. The con-
trast between the general philosophy for the development of the sector and the
main regulatory rules was clear. In addition, a law created an independent regula-
tory authority and stated its general rights and duties.
Tariffs were determined at the start of the concession and were to be indexed
each year using a contractual indexation formula.
Information requirements
The laws and the concession contract state general obligations for the delivery of
information. They also require implementation of a cost accounting system that
separates water and electricity activities and subactivities (production, transport,
and distribution). The law creating the regulatory authority states its powers in
terms of information collection.
Powers of the regulatory authorityAn article on the powers of the regulatory authority mentions that
To fulfi ll its missions of control and monitoring of the agreements and tariffs
[missions stated in the same law], the authority has the largest powers of investi-
gation in the framework of the laws in force. The authority can request—from
any public administration, user or operator—all the necessary information to
ensure the fulfi llment of the obligations imposed to them, without any limitation
being imposed to it.
Obligations stated in the contract and in the lawAmong the obligations stated in the contract and in the law are those covering stan-
dard accounting and cost accounting, operating and fi nancial reports, and assets.
Standard accounting and cost accounting. The law on organization of the electric-
ity sector states explicitly that
every operator carrying on vertically or horizontally integrated activities will
hold in its internal accounting separate accounts for each activity of production,
transport and distribution and, if appropriate, for all activities not related to the
electricity sector, in the same way as if these activities were carried on by separate
legal entities.
No similar accounting obligations are specifi ed for the water sector.
AFIR_015-026_ch02.indd 16AFIR_015-026_ch02.indd 16 4/3/08 8:35:35 AM4/3/08 8:35:35 AM

17
Case Studies
2
The concession contract contains one general article related to standard account-
ing and cost accounting. It states that the operator should implement a general
accounting system in conformity with legal obligations, while also following the
accounting principles specifi cally applicable to the concession regime.
Regarding cost accounting and auditing, the article states as follows:
In regards to the law, the Operator has to put in place—within a period of two
years—a cost accounting system [“comptabilité analytique” in French] enabling
the monitoring of the conceded service operations with a strict separation between
the activities of production, transport, and distribution of electricity as well as of
other activities. [This obligation of separate accounts is formally stated in the
law as well.] This separation is to be realized following the accounting rules
imposed by the regulatory authority after consultation with the concessionaire.
These accounting rules determine the conditions following which the costs and
charges of each of the activities (production, transport and distribution) are
refl ected in the corresponding accounting statements, in order to prevent any
cross-subsidy between these activities.
Implementation of a cost accounting system is essential to regulation. This
implementation is explained in chapter 5, after the basics of cost accounting are
explained in chapter 4. The need for accounting rules defi ned by the regulatory
authority after consultation with the concessionaire is covered in chapters 5 and 6.
Operating and fi nancial reports. Another article of the contract describes the con-
tents of an operating and fi nancial report to be delivered to the regulatory authority
and to the government. It mentions a detailed list of indicators to be included. The
article adds to the list “any indicator commonly defi ned that helps to assess the
technical and fi nancial performances of the Company.”
Assets. One article tackles the accounting treatment of categories of assets depend-
ing on the classifi cation of assets, as shown in table 2.1.1
This defi nition of assets is related to the valuation of the regulatory asset base
and the regulatory depreciation policies, covered in chapter 6.
Confl ict and solutions
A confl ict arose a few years after the concession started.2 The world price of fuel
rose drastically, but the parties did not agree on the tariff increases to be applied on
AFIR_015-026_ch02.indd 17AFIR_015-026_ch02.indd 17 4/3/08 8:35:35 AM4/3/08 8:35:35 AM

18
Accounting for Infrastructure Regulation: An Introduction
2the basis of the indexation formula. Problems with other ratios and weights used in
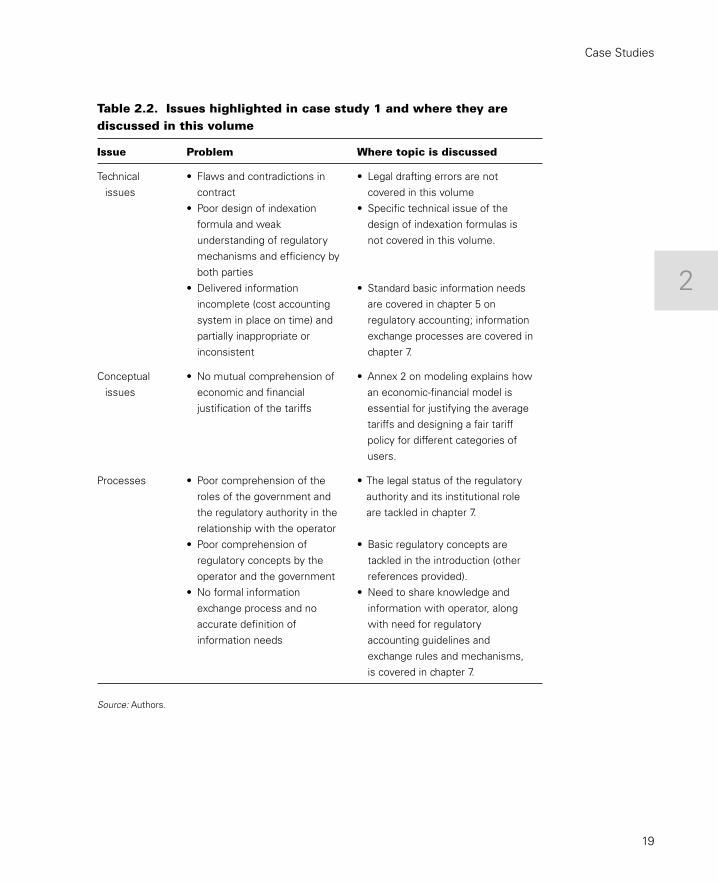
the formula also arose. The confl ict revealed multiple misunderstandings. Table 2.2
categorizes the main issues highlighted in this case study and notes if and where
they are discussed in this volume.
The parties fi nally decided that one way to resolve the confl ict and the misun-
derstandings about the profi tability of the operator was to construct an economic-
fi nancial model. All the parties (regulator, operator, and ministry of energy and
water) were to be involved in developing the model. (For more details on develop-
ing such a model, see annex 2 on regulatory modeling.)
Approval by all parties of the structure and mechanisms of the model was rela-
tively confl ict free, but tensions arose during data collection from the operator,
which believed that the requirements were too detailed. The process revealed the
incompleteness of the cost accounting system. The most diffi cult stage was fi nal
validation of the data by the regulator and the government. This process requires
considerable work, analysis, and judgment. The operator appeared unable to under-
stand that some costs that the regulator considered ineffi cient might be excluded in
the determination of future tariffs. This topic is considered in chapter 5.
2.2. Case study 2: Regulating operators in Latin America—Manual defi ciencies led to inconsistent cost accounting by different utilities
The electricity sector in this Latin American country is composed of several inde-
pendent electricity distribution companies regulated by a single agency. This case
focuses on information related to the separation in the distribution business of
Table 2.1. Classifi cation of assets in concession contract
Conceded assets Private assets
Essential assets Renewable Nonrenewable Renewable Nonrenewable Nonessential assets Renewable Nonrenewable Renewable Nonrenewable
Source: Authors. Note: Conceded assets belong to the state but are conceded to the operator. Private assets belong to the operator. Essential assets are essential to the activity and must be returned or sold to the state at the end of the concession. Nonessential assets are not essential to the activity and might be handed over to or sold to the state at the end of the concession. Renewable assets are to be renewed during the concession (the asset’s life ends before the concession ends). Nonrenewable assets cannot be renewed during the concession (the asset’s life ends after the concession ends).
AFIR_015-026_ch02.indd 18AFIR_015-026_ch02.indd 18 4/3/08 8:35:35 AM4/3/08 8:35:35 AM
19
Case Studies
2
Table 2.2. Issues highlighted in case study 1 and where they are discussed in this volume
Issue Problem Where topic is discussed
Technical issues
• Flaws and contradictions in contract
• Poor design of indexation formula and weak understanding of regulatory mechanisms and effi ciency by both parties
• Delivered information incomplete (cost accounting system in place on time) and partially inappropriate or inconsistent
• Legal drafting errors are not covered in this volume
• Specifi c technical issue of the design of indexation formulas is not covered in this volume.
• Standard basic information needs are covered in chapter 5 on regulatory accounting; information exchange processes are covered in chapter 7.
Conceptual issues
• No mutual comprehension of economic and fi nancial justifi cation of the tariffs
• Annex 2 on modeling explains how an economic-fi nancial model is essential for justifying the average tariffs and designing a fair tariff policy for different categories of users.
Processes • Poor comprehension of the roles of the government and the regulatory authority in the relationship with the operator
• Poor comprehension of regulatory concepts by the operator and the government
• No formal information exchange process and no accurate defi nition of information needs
• The legal status of the regulatory authority and its institutional role are tackled in chapter 7.
• Basic regulatory concepts are tackled in the introduction (other references provided).
• Need to share knowledge and information with operator, along with need for regulatory accounting guidelines and exchange rules and mechanisms, is covered in chapter 7.
Source: Authors.
AFIR_015-026_ch02.indd 19AFIR_015-026_ch02.indd 19 4/3/08 8:35:35 AM4/3/08 8:35:35 AM

20
Accounting for Infrastructure Regulation: An Introduction
2
regulated activities and unregulated activities. It illustrates how, in a large and com-
plex sector, fundamental information is missing on unregulated activities.
The chart of accounts (see chapter 3) included in the “Accounting Manual for
Electricity Public Services” foresees the need for an accounting separation of regu-
lated activities from unregulated activities:
Concessionaires and licensees performing activities not related to the concession
of Electricity Public Services must keep separate registers and controls of all oper-
ations related to such activities. Moreover, joint undertakings [business associa-
tions] for any purpose or condition as well as investments in other companies
should also be considered within this concept.
It is considered that activities not related to a concession of Electricity Public
Services are said to be all the operations carried out by the Concessionaire and
licensee not directly related to the object of the Concession, that is, business activi-
ties different from electricity Generation, Transmission, Distribution and
Trading.
It is the Concessionaire or licensee’s job to defi ne the criteria for identifi cation
and separation of goods, rights and obligations, as well as refi nement of the
respective revenue resulting from these activities not related to the concession of
Electricity Public Services. These criteria, however, need to be subjected to the
approval of the Regulatory Entity before being applied. Moreover, it is important
that these criteria consider the issue of allowing disclosure of the information
available in the guidelines for preparation and publication of accounting, eco-
nomic and fi nancial and social reports.
The rules mentioned before shall operate without detriment to the specifi c
provisions contained in the respective regulations which establish the need of
procuring the Regulator’s approval for the performance of activities not related to
the object of the concession or licensee.
Table 2.3 identifi es the relevant variables from the Accounting Manual.
Only 21 electricity distribution companies had data for the separate accounts.
These companies represent 58 percent of users and 54 percent of electricity con-
sumption. Table 2.4 shows details for the companies for which at least some infor-
mation is available.
Most of these accounts show incomplete data. Although many of the 21 compa-
nies provide information on expenses for activities unrelated to the concession,
AFIR_015-026_ch02.indd 20AFIR_015-026_ch02.indd 20 4/3/08 8:35:35 AM4/3/08 8:35:35 AM

21
Case Studies
2
only nine of the companies register revenue from unregulated operating or nonop-
erating activities. That companies would have costs associated with unregulated
activities but no revenue related to them appears improbable.
Table 2.5 categorizes the main issues highlighted in this case study and notes
where they are discussed in this volume.
2.3. Case study 3: Effi cient model company regulation in a Latin American country—Defi ciencies of benchmarking information and the need for regulatory accounting information
Regulation of the water and sanitation sector in this Latin American country is
governed by a regulatory framework set out in a law that created an independent
regulatory authority as part of the restructuring of the country’s sanitation services
in the late 1980s. The regulator is a decentralized public agency with ruling, con-
trolling, and sanctioning powers. It is responsible for supervision of service provid-
ers, enforcement of sanitation rules and regulations, control of liquid industrial
wastes, and tariff setting for regulated services.
Table 2.3. Accounting information required for unregulated activities
BEFORE TAXES (SOCIAL CONTRIBUTION AND INCOME TAX)
Operating
1. Operating income from activities not related to the concession2. Operating expenses from activities not related to the concession
Nonoperating
3. Nonoperating income from activities not related to the concession4. Nonoperating expenses from activities not related to the concession
AFTER TAXES (SOCIAL CONTRIBUTIONS AND INCOME TAX)
5. Profi ts and losses of the year, from activities not related to the concession
Source: Authors.
AFIR_015-026_ch02.indd 21AFIR_015-026_ch02.indd 21 4/3/08 8:35:35 AM4/3/08 8:35:35 AM

22 Accounting for Infrastructure R
egulation: An Introduction
2
Table 2.4. Accounting information on unregulated activities, 2001
Company ControlUsers 2001
Energy 2001
Operating income of activities
not related to
concession (thousands)
Expenses of activities not related
to concession (thousands)
Non-operating income of activities
not related to
concession (thousands)
Non-operating
expenses of activities
not related to
concession (thousands)
Operating income
(thousands)
Operating expenses (thousands)
Non-operating income
(thousands)
Non-operating expenses (thousands)
EMP-1 STATE 1,228,554 3,470,470 237.0 (665.9) 215.8 (211.1) 536,084 (542,883) 5,721.3 (9,924.6)
EMP-2 STATE 5,412,068 11,715,540 7,319.8 (5,192.5) 0.2 (566.0) 1,910,598 (1,468,129) 498.0 (12,559.4)
EMP-3 STATE 116,306 288,086 3.5 (0.2) — — 42,343 (42,213) 9.1 (632.8)
EMP-4 STATE 145,155 242,241 — (21.6) — — 65,602 (92,901) 106.4 (78.2)
EMP-5 PRIVATE 5,437 15,529 — — — (1.9) 1,238 (920) 1.3 (2.5)
EMP-6 PRIVATE 37,878 97,090 — — 2.2 (2.2) 10,977 (8,399) 2.9 (17.9)
EMP-7 PRIVATE 90,324 254,453 — — 2.2 (627.7) 26,388 (31,830) 5.1 (673.1)
EMP-8 PRIVATE 132,174 361,985 — — — (433.1) 31,158 (37,818) 70.1 (815.9)
EMP-9 PRIVATE 145,935 403,680 — — — (2.3) 43,713 (37,087) 48.0 (370.9)
EMP-10 PRIVATE 172,411 467,748 — — 14.4 (1,081.2) 48,114 (51,161) 23.7 (2,129.9)
EMP-11 PRIVATE 281,059 586,284 — — — (29.4) 70,146 (56,125) 423.2 (184.1)
EMP-12 PRIVATE 403,232 632,400 — (6,113.4) — — 90,031 (74,776) 77.9 (105.4)
EMP-13 PRIVATE 572,320 1,620,244 — (29.4) — — 171,946 (152,810) 231.9 (1,914.8)
EMP-14 PRIVATE 728,855 1,295,538 — (3,926.4) — 386.4 174,782 (146,017) 102.0 62.2
EMP-15 PRIVATE 1,044,379 2,288,533 — (30.9) — — 257,936 (229,621) 2,649.0 (339.9)
EMP-16 PRIVATE 1,691,224 3,990,374 — (0.3) — — 637,423 (477,379) 437.8 (268.4)
EMP-17 PRIVATE 1,716,558 4,426,719 546.0 (17,463.2) — — 631,567 (557,924) 852.1 (3,700.8)
EMP-18 PRIVATE 1,916,760 2,898,281 — (15,774.6) — — 364,038 (278,289) 879.5 (1,350.6)
EMP-19 PRIVATE 2,918,419 4,858,335 — (4,926.2) — — 575,169 (500,747) 1,574.7 (536.1)
EMP-20 PRIVATE 3,233,040 10,135,359 — — 7,024.3 — 1,881,153 (1,534,926) 7,049.7 (4,835.0)
EMP-21 PRIVATE 4,748,947 16,862,369 — (2,002.7) 8,352.9 (8,341.4) 2,334,596 (2,078,059) 10,033.2 (16,887.2)
Share 58% 54%
Source: Compiled by authors.
AF
IR_015-026_ch02.indd 22
AF
IR_015-026_ch02.indd 22
4/3/08 8:35:36 AM
4/3/08 8:35:36 AM

23
Case Studies
2
The regulatory framework
The regulatory framework relies on two basic economic principles: economic and
dynamic effi ciency and fi nancial feasibility, which requires that sanitation utilities
be self-fi nancing. To encourage economic effi ciency, tariffs are determined in accor-
dance with the effi cient model company approach. Tariffs are set on the basis of
independent costs, which may differ from the actual costs of utilities.
Under the sector regulatory framework, tariffs must refl ect the cost of capturing,
carrying, treating, and distributing drinkable water and the costs arising from the
collection, treatment, and disposal of wastewater. As for other public services in the
country, social goals are met by a nationwide scheme of direct subsidies.
During each tariff review, the effi cient model company approach imagines that
a company is starting from scratch. Only the essential costs of service provision are
taken into account. Investment costs are separated from operation and mainte-
nance costs. Investments are calculated on the basis of an engineering model that
ensures technical feasibility and assumes the most effi cient technology available in
Table 2.5. Issues discussed in case study 2 and where they are discussed in this volume
Issue Problem Where topic is discussed
Discretion • The criteria to identify and classify unregulated activities should be defi ned by the regulator and not by the operators, as stated in the accounting manual.
• Separation of activities is discussed in chapter 6.
Quality of information • Information received from the operators is not used by the regulator.
• There is no audit of information.
• The role of regulator is discussed in chapter 5.
• Information exchange processes are discussed in chapter 7.
Comparability • Need for homogeneous criteria allowing for yardstick competition.
• Regulatory accounting guidelines are covered in chapter 7.
Materiality • Values reported are not signifi cant.
• Materiality is tackled in chapter 3 and again in chapter 7.
Source: Authors.
AFIR_015-026_ch02.indd 23AFIR_015-026_ch02.indd 23 4/3/08 8:35:36 AM4/3/08 8:35:36 AM

24
Accounting for Infrastructure Regulation: An Introduction
2
the market. Operation and maintenance costs are estimated on the basis of the
actual companies and in consideration of industry best practices. The need to have
information about real companies arises in the context of cost estimation. In the
last few years, companies have become more diversifi ed, and the absence of key ele-
ments in the framework for the design of dynamic mechanisms of information
disclosure has become more evident.
Regulators found themselves even more limited by the fi rms’ traditional fi nan-
cial accounting. Because companies conduct their accounting according to their
management needs, accounting systems can vary year to year. Moreover, the regu-
lated companies are heterogeneous and, therefore, so are their accounting systems.
The costs of regulated activities are not separated from the costs of unregulated
activities. As a result, fi nancial accounting does not provide the necessary indicators
to support a tariff study.
A new regulatory accounting model
To get around these limitations, the regulator issued a form for submitting infor-
mation related to water costs and revenues and a formal protocol for exchanging
information. The regulatory accounting model set out by these regulations follows
an activity-based costing allocation method, adjusted to meet regulatory needs.
The cost of each product or service is determined on the basis of the activities
needed for its development and the resources used by each activity. The analysis is
carried out at standard facility (operation and maintenance), location (commer-
cial), and company (administrative) levels.
These information requirements are limited to the fi rms’ operation and mainte-
nance costs and do not include asset accounts. The fi rms’ investments are not con-
sidered for tariff setting. An engineering model of an effi cient company is used for
that purpose.
The regulated companies had several complaints about these information require-
ments. Some complaints were based on technical aspects, such as inconsistency
between the instructions given by the regulator and the fi rm’s chart of accounts.
Regulated companies also raised economic objections. They argued that the spirit of
the regulatory framework was changed and that the effi cient model company
approach did not include the cost of generating information in the determination of
tariffs. Furthermore, some companies argued that the regulator lacked the authority
to impose a specifi c regulatory accounting system or to ask for information about
unregulated products. These objections and some lawsuits fi led in court were even-
tually rejected, and the plan proposed by the regulator became effective in 2004.
AFIR_015-026_ch02.indd 24AFIR_015-026_ch02.indd 24 4/3/08 8:35:36 AM4/3/08 8:35:36 AM

25
Case Studies
2
Two points about this case are especially relevant here. One is the impossibility
of developing effi cient regulation without taking into account the information gen-
erated by the company and the need to rule on the information that can be used for
regulatory purposes. The other is the particularity of this case: the information
required was limited to operation and maintenance costs and excluded the fi rms’
accounts of capital. This limitation on the information could lead to an inconsis-
tency across all cost elements considered for tariff setting. This differentiated regu-
latory treatment between investments on the one hand and operation and mainte-
nance costs on the other hand could result in strategic behavior by fi rms—that is,
give them an incentive to consider investments as costs.
Table 2.6 categorizes the main issues highlighted in this case study and notes
where they are discussed in this volume.
Table 2.6. Issues discussed in case study 3 and where they are discussed in this volume
Issue Problem Where topic is discussed
Powers of the regulator to acquire information
• Regulators need specifi c powers to fulfi ll their duties, including the power to collect information from service providers
• Regulatory accounting guidelines are covered in chapter 7.
Relationship between regulatory regime and information needed by the regulator
• Data requirements by the regulator depend on the characteristics of each regulatory regime
• Covered in chapter 2.
Need for an integrated approach for treating economic and fi nancial data
• Limiting the regulatory accounting requirements to operation and maintenance costs and excluding capital expenditure limits the usefulness of the information
• Regulatory asset base and depreciation are covered in chapter 6.
Use of activity-based costing as a basis for the regulatory accounting model
• Values reported are not signifi cant
• Allocation methods accounting approaches, including activity-based costing, are covered in chapter 4.
Source: Authors.
AFIR_015-026_ch02.indd 25AFIR_015-026_ch02.indd 25 4/3/08 8:35:36 AM4/3/08 8:35:36 AM

26
Accounting for Infrastructure Regulation: An Introduction
2
Notes
1. This classifi cation of assets is stated in the law as well. This kind of classifi cation is common
in the countries belonging to the Economic Community of West African States.
2. For more details on confl icts arising early in concession contracts, see Guasch (2004).
AFIR_015-026_ch02.indd 26AFIR_015-026_ch02.indd 26 4/3/08 8:35:36 AM4/3/08 8:35:36 AM

27
Chapter 3
This chapter is for individuals unfamiliar with basic accounting prin-ciples and concepts. Those who already understand these topics can skip it without loss of continuity. The chapter briefl y describes the main elements of a corporate information system and the basic principles of fi nancial accounting. References at the end of the chapter direct readers to more detailed discussions of these topics.
3.1. Corporate information systems
Information is an essential business tool. Companies require information to con-
trol their activities, make decisions, create new services and products, and evaluate
expansion possibilities. Information is developed through models and methods
that allow movement from a set of unconnected data to adequate and timely infor-
mation at each administrative level.
To make information consistent with the objectives for which it is required,
information systems are used to organize information according to a set of attri-
butes related to time, content, and form. An information system can be defi ned as
“a group of interrelated components working together to collect, process, store, and
disseminate information to support decision making and control it in an organiza-
tion” (Loudon and Loudon 1998, 8).
An effi cient and properly managed company operating at a substantial level
should implement corporate information systems for management (planning, eval-
uation, control) and nonmanagement groups (tax authorities, various regulatory
agencies, or other governmental entities requiring customized reporting of data).
Corporate Information and Financial Accounting
AFIR_027-042_ch03.indd 27AFIR_027-042_ch03.indd 27 4/3/08 8:37:04 AM4/3/08 8:37:04 AM

28
Accounting for Infrastructure Regulation: An Introduction
3
An information system receives data as input from the company’s internal and
external sources, processes the data to produce information, and produces infor-
mation for future use by managers, administrators, shareholders, creditors, govern-
ments, and others (fi gure 3.1).
In general, the objectives of corporate information systems are to
• support business operations and managerial decision making,
• contribute to the automation of the company’s activities and processes,
• provide information to units in the company in the form and at the time it is
needed,
• provide a diagnosis of the company at a certain time, and
• aid in business forecasting.
Information systems can be formal (based on standardized procedures) or infor-
mal (based on unstated or loosely stated rules and agreements). Formal systems are
usually supported by electronic means and include four subsystems: production,
marketing, human resources management, and fi nancial and accounting. Each
subsystem can be defi ned as a unit working through interfaces to exchange infor-
mation with other subsystems to meet a specifi c goal.
This chapter focuses on fi nancial and accounting information; chapter 4 exam-
ines management and cost accounting. The fi nancial and accounting system is the
major source of quantitative information for every company. It provides informa-
tion for internal and external reporting.
Internal reporting
Internal reporting focuses on management planning and control and is usually
referred to as management accounting. As defi ned by the American National Asso-
ciation of Accountants (quoted in Shim and Siegel [2000, 3]),
management accounting is the process of identifi cation, measurement, accumu-
lation, analysis, preparation, interpretation, and communication of fi nancial
information, which is used by management to plan, evaluate and control within
an organization.
Management accounting can use a variety of data (fi nancial and nonmonetary).
Cost accounting focuses specifi cally on cost information: cost recording and report-
ing, cost measurement, cost management, and cost analysis.
AFIR_027-042_ch03.indd 28AFIR_027-042_ch03.indd 28 4/3/08 8:37:04 AM4/3/08 8:37:04 AM

29
Corporate Information and Financial Accounting
3
External reporting
External reporting focuses principally on historical data. Such reporting is usually
referred to as fi nancial accounting. The main outcome of fi nancial reporting is stat-
utory fi nancial statements.
3.2. Statutory fi nancial statements
Financial statements report a company’s historic fi nancial performance and cur-
rent fi nancial position. When a company has subsidiaries, fi nancial statements are
constructed for each subsidiary, and a consolidated fi nancial statement is compiled.
This statement combines all the activities of the core controlling company.
Financial statements are based on fi nancial accounting, which is concerned with
classifying, measuring, and recording the transactions of a business. The fi nancial
statements of an economic entity are prepared on the basis of accounting policies,
norms, and principles.
The following sections briefl y present the most common generally accepted
accounting principles, describe the key elements of a standard fi nancial statement
and the basic concept of the accounting plan, and survey the recent evolution of
international accounting norms.
Generally accepted accounting principles
Generally accepted accounting principles (GAAP) encompass broad principles and
conventions of general application, as well as rules and procedures that determine
accepted accounting practices. They are used all over the world with some local vari-
ations. Each country has developed more detailed norms and accounting policies
Figure 3.1. Corporate information systems
Source: Authors.
Input
Datacollection
Process
Processing
Storage
Output
DisseminationReportingWorking papers
AFIR_027-042_ch03.indd 29AFIR_027-042_ch03.indd 29 4/3/08 8:37:04 AM4/3/08 8:37:04 AM

30
Accounting for Infrastructure Regulation: An Introduction
3
(Statement of Financial Accounting Standards in the United States and Financial
Reporting Standards in the United Kingdom, for example). See box 3.1 for a brief
discussion of the differences between the French and Anglo-Saxon approaches.
GAAP provide guidance for preparation of fi nancial statements along several
dimensions. Some of the principles mentioned below, such as materiality and sub-
stance over form, are strongly related to basic regulatory accounting principles. The
recording of transactions at historical costs has fueled many debates about the valu-
ation of the regulatory asset base. Chapter 6 covers all these points in detail.
Basic postulate of fairnessThe accounting system should present fairly and disclose fully the fi nancial posi-
tion and results of the entity’s operation.
Box 3.1. Some differences between the French and the Anglo-Saxon accounting approaches
One notable distinction is between the Anglo-Saxon and the French approaches to accounting.a General accounting infl uenced by the French approach privileges a contractual and patrimonial view of the company. It is also strictly regulated. The Anglo-Saxon philosophy of accounting relies principally on an economic view of the company. This type of accounting is less regulated, allowing the fi rm and its representatives greater free-dom in organizing the details of reporting.
In some cases, these differences can infl uence presentation of the fi nancial statements and valuation of accounting items such as assets. Under the French approach, assets are valued at their historical “patrimo-nial” value (a value recognizing the ownership of the asset but not its real economic value at the time of reporting). The Anglo-Saxon approach allows assets to be valued at an estimate of their economic value follow-ing a current cost accounting approach, as authorized in the United King-dom (but used mainly by regulated utilities), or at historical cost.
Source: Authors.a. The French approach is used in many European countries and in some Latin American and African countries.
AFIR_027-042_ch03.indd 30AFIR_027-042_ch03.indd 30 4/3/08 8:37:04 AM4/3/08 8:37:04 AM
31
Corporate Information and Financial Accounting
3
Concepts related to the socioeconomic environmentTwo concepts are related to the socioeconomic environment of the entity. Accord-
ing to the entity concept, the organizational component being accounted for has to
be defi ned—in other words, boundaries must be defi ned. According to the going
concern concept, the entity is assumed to continue in operation long enough to use
existing assets for their intended purpose (otherwise, termination or bankruptcy
values may be lower than ongoing values).
Principles directly related to the recording of informationFour principles are related to the recording of information:
• Conservatism. When in doubt, accountants should choose the option least likely
to result in an overstatement of income and results. For example, an accountant
should value a land asset at historical cost (even if it was acquired long ago) or
record it at an anticipated loss but not an anticipated gain.
• Materiality.1 A transaction must be accounted for when the amounts involved
are judged to be material. The materiality of the transaction must be determined
by its effect on the fi nancial statements and by whether its omission or misstate-
ment could infl uence the economic decision of users.
• Periodicity. For the purpose of measuring profi t or loss, accountants assume that
the entity’s life is divided into periods of time. They use fi scal periods.
• Substance over form. The economic substance of a transaction should be reported
without regard to its form. For example, use of a capital lease to acquire an asset
will not prevent the transaction from being recorded as an asset and a liability,
just as would have been the case if the asset had been acquired through a long-
term loan.
Principles related to valuationTwo principles are used in valuing assets and liabilities and in recording transac-
tions. In accordance with the fi rst principle, historical cost and unit of measure, assets
and liabilities are recorded at historical cost in nominal currency.2 In accordance
with the second principle, accrual accounting, revenue is recorded in the period
when sales are completed (“revenue recognition”), and expenses are recorded when
resources are used to generate revenues (“the matching principle”). Thus, revenues
are to be matched with related expenses. The two valuation-related principles are
usually enforced by legislation or defi ned by professional and regulatory organiza-
tions, and they may change over time.
AFIR_027-042_ch03.indd 31AFIR_027-042_ch03.indd 31 4/3/08 8:37:05 AM4/3/08 8:37:05 AM

32
Accounting for Infrastructure Regulation: An Introduction
3
Key elements of statutory fi nancial statements
Financial statements normally include three reports:
• The balance sheet summarizes a company’s fi nancial position at a point in time.
• The income statement measures a company’s earnings over time, generally
between balance sheets.
• The cash fl ow statement complements the income statement and balance sheet
and reports the amounts of cash entering and leaving a company.
These reports are usually compiled quarterly and annually.
Balance sheetA balance sheet summarizes a company’s fi nancial position at a point in time. Fol-
lowing accepted accounting practices, all companies must have a classifi ed balance
sheet. Under the fundamental accounting equation, the resources owned by a com-
pany should equal the sources of these resources, or, in accounting terms,
Assets = liabilities + shareholders’ equity.
Assets are the economic resources controlled by the company. Liabilities repre-
sent the fi nancial obligations or debt of the company or, from another point of
view, the creditors’ claims on the company’s assets. Shareholders’ equity refers to
funding from shareholders provided as capital (initial capital plus later increases in
capital) plus accumulated or retained earnings to shareholders (undistributed prof-
its that are reinvested in the company).
On balance sheets, assets are classifi ed by their liquidity—the time it takes to
convert them into cash. Current assets are expected to be converted into cash or
used in operations within one year or one operating cycle of the date on the balance
sheet, whichever is longer. Long-term assets are of longer duration (more than one
year or operating cycle).
Current assets. There are four common classes of current assets:
• Cash is the most basic current asset. In addition to currency, bank accounts
without restrictions, checks, and drafts are also considered cash because of the
ease with which they can be turned into currency.
• Cash equivalents are not cash but can be converted into cash so easily that they are
considered equivalent to cash. Cash equivalents are generally highly liquid, short-
term investments such as U.S. government securities and money market funds.
AFIR_027-042_ch03.indd 32AFIR_027-042_ch03.indd 32 4/3/08 8:37:05 AM4/3/08 8:37:05 AM

33
Corporate Information and Financial Accounting
3
• Accounts receivable represent money that clients owe to the company.
• A company’s inventory is the stock of products before they are sold and the stock
of materials used to manufacture the products.
Long-term assets. There are two common classes of long-term assets. Fixed assets
are tangible assets with a useful life greater than one year. Generally, fi xed assets
refer to items such as equipment, buildings, production plants, and property.
Depreciation is the process of allocating the original purchase price of a fi xed asset
over the course of its useful life. It appears in the balance sheet as a deduction from
the original value of the fi xed assets. Intangible assets are nonphysical assets such as
copyrights, franchises, and patents.
Liabilities. Liabilities are ordered according to their settlement. Current liabilities
are obligations that the company must pay (from current assets) within one year of
the date on the balance sheet. Long-term liabilities are those that are not expected to
be paid for at least one year from the same date.
There are three common classes of liabilities:
• Bank loans are short-term debt (current liabilities) and long-term debt (noncurrent).
• Debts to suppliers are accounts payable to suppliers for miscellaneous supplies of
goods and services (current liabilities).
• Fiscal and social security debts are balance of value-added taxes or sales tax due to
the state for the year, income taxes, balance of company charges due on employ-
ees’ remunerations, and the like (current liabilities with the exception of some
deferred tax liabilities that could be listed as noncurrent).
Shareholders’ equity. Shareholders’ equity appears on the liabilities side of the bal-
ance sheet. It represents mainly initial funds provided by shareholders to fund the
company’s development and retained earnings or profi ts (or losses) not distributed
to shareholders (when the shareholders decided to reinvest them in the company)
but that belong to them. Therefore, shareholders’ equity represents amounts due to
the shareholders by the company or a liability. Shareholders’ equity is sometimes
also presented within net assets, meaning assets net of liabilities. Indeed, the amount
of shareholders’ equity can be calculated by subtracting the liabilities (of the differ-
ent creditors) from the total assets of the company:
Shareholders’ equity = assets – liabilities.
AFIR_027-042_ch03.indd 33AFIR_027-042_ch03.indd 33 4/3/08 8:37:05 AM4/3/08 8:37:05 AM

34
Accounting for Infrastructure Regulation: An Introduction
3
Therefore, shareholders’ equity represents the net accounting value of the com-
pany, but it usually differs from the market value of the company. Assets can be
recorded at historical cost (see previous section on GAAP), and the market value of
some assets might be very different, positively or negatively, from the accounting
value. Some assets, such as intangible assets, might not even be included in the bal-
ance sheet. In addition, the market prefers to value an operating company on the
basis of its capacity to generate future profi ts rather than on the basis of its net
accounting value. Therefore, prices paid by the market during privatization or pub-
lic fl otation might differ signifi cantly from the accounting value (net assets).
Table 3.1 shows a simplifi ed balance sheet. As it shows, liabilities plus sharehold-
ers’ equity equal assets. The order of presentation of liabilities and shareholders’
equity differ depending on accounting practices. For example, in U.S. accounting
the items will usually be presented in the general order of preference in case of liq-
uidation. Thus, in table 3.1, the liabilities of creditors are shown before sharehold-
ers’ equity, because creditors would be paid before shareholders (owners) if the
company were liquidated. In French accounting, the order is reversed.
Income statementAn income statement measures a company’s earnings during a period of time, gen-
erally between balance sheets dates. It lists revenues, operating, fi nancial and fi scal
expenses, asset depreciation, and gains and losses. The income statement can be
used to analyze profi tability by applying fi nancial ratios, or to compare profi t mar-
gins with those of competitors, among others. An income statement generally con-
tains the following components:
• Sales are the total amount received or to be received from the sales of products
and services to customers during the period.
• Cost of goods sold is the total cost of products sold during the period. This cost
includes the cost of raw materials, manufacturing, and labor (but not salaries).
Costs of goods sold are subtracted from sales to calculate gross profi t.
• Operating expenses are every expense other than cost of goods sold, interest, and
other income tax. These expenses include research and development, marketing,
salaries, and rent. Any normal expense incurred in the day-to-day operations of
the company falls under this category.
• Depreciation is the annual amount deducted from tangible assets (such as heavy
machinery used in the production of goods), representing the lifespan of the
asset. It is the charge for using these assets during the period. None of this
AFIR_027-042_ch03.indd 34AFIR_027-042_ch03.indd 34 4/3/08 8:37:05 AM4/3/08 8:37:05 AM

35
Corporate Information and Financial Accounting
3
expense amount is a cash outlay in the period recorded, which makes it a unique
expense compared with other operating expenses.
• Other income is revenue that does not stem from the core operations of the busi-
ness. This income includes items such as capital gains (or losses) from invest-
ments, foreign currency exchange, or income from the rental of property.
Table 3.1. Simplifi ed balance sheet based on the U.S. model
2006 2005
ASSETS
Current assets
Cash and cash equivalents 5,000 1,000
Accounts receivable 20,000 13,000
Inventory 30,000 25,000Total current assets 55,000 39,000
Fixed assets
Plant and machinery 17,000 16,000
Less depreciation –11,000 –9,000
Land 4,000 4,000
Intangible assets 3,000 1,000Total fi xed assets 13,000 12,000TOTAL ASSETS 68,000 51,000
LIABILITIES AND SHAREHOLDERS’ EQUITY
LIABILITIES
Accounts payable 16,000 13,000
Taxes payable 2,000 1,000
Long-term bonds issued 15,000 4,000
TOTAL LIABILITIES 33,000 18,000
SHAREHOLDERS’ EQUITY
Common stock 30,000 30,000
Retained earnings 5,000 3,000TOTAL SHAREHOLDERS’ EQUITY 35,000 33,000
LIABILITIES AND SHAREHOLDERS’ EQUITY 68,000 51,000
Source: Authors.Note: Companies in countries with different accounting practices could present items on the balance sheet in a different order.
AFIR_027-042_ch03.indd 35AFIR_027-042_ch03.indd 35 4/3/08 8:37:05 AM4/3/08 8:37:05 AM

36
Accounting for Infrastructure Regulation: An Introduction
3
• Interest expense is the amount of interest on debt (interest-bearing liability) for
the period.
• Income tax is the total amount that must be paid to the government. This amount
is normally calculated as a percentage (tax rate) over the taxable income of the
business. Other nonincome taxes are included under operating expenses.
Table 3.2 shows a simplifi ed income statement. The bottom line, net profi t, shows
the increase or decrease in net worth of a company before any distributions to
shareholders.
Normally, sales are determined using the accrual basis of accounting. Under this
method, revenues are recognized when a company sells goods or provides services,
independent of cash receipt. Expenses are recognized when revenue is recorded,
independent of cash payments. Although this method shows the fl ow of business
income and debts accurately, it may not indicate the availability of cash reserves,
possibly resulting in a serious cash fl ow problem. For instance, a company’s income
statement may show thousands of dollars in sales, while its bank account is empty
because customers have not paid.
Cash fl ow statementComplementing the balance sheet and income statement, the cash fl ow statement
reports the amounts of cash and equivalents entering and leaving a company. The
Table 3.2. Simplifi ed income statement
2006 2005
Sales 1,000,000 800,000
Cost of goods sold –500,000 –400,000Gross profi t 500,000 400,000
Operating expenses –100,000 –80,000
Depreciation –20,000 –16,000Operating income 380,000 304,000
Other income 10,000 —Earnings before interest and tax 390,000 304,000
Interest expense –39,000 –30,400Net profi t before taxes 351,000 273,600
Taxes (30%) –105,300 –82,080Net profi t 245,700 191,520
Source: Authors.
AFIR_027-042_ch03.indd 36AFIR_027-042_ch03.indd 36 4/3/08 8:37:05 AM4/3/08 8:37:05 AM

37
Corporate Information and Financial Accounting
3
cash fl ow statement allows investors to understand how a company’s operations are
running, where its money is coming from, and how money is being spent.
The cash fl ow statement is designed to convert the accrual basis of accounting
used to prepare the income statement and balance sheet back to a cash basis for ana-
lyzing the actual cash fl owing into and out of the business. Under accrual account-
ing, net income does not typically equal net cash fl ow, except over the lifespan of a
company. Thus periodic reporting of cash infl ows and outfl ows is important.
Cash fl ow is based on three components: operating activities, investing activities,
and fi nancing activities.
• Operating activities are the daily internal activities of a business that either
require cash or generate it. Generally, changes made in cash, accounts receivable,
depreciation, inventory, and accounts payable are refl ected in cash from
operations.
• Investing activities are investments made by management that consist primarily
of the purchase or sale of equipment. A company’s purchase of new assets is
considered a cash-out transaction. When a company divests an asset, the trans-
action is considered cash-in for calculating cash from investing.
• Financing activities are external sources and uses of cash that affect cash fl ow.
These activities include sales of common stock, changes in short- or long-term
loans, and dividends paid. For example, changes in cash from fi nancing are cash-
in when capital is raised and cash-out when dividends are paid.
Table 3.3 shows a simple cash fl ow statement.
Chart of accounts
A chart of accounts is a listing of all accounts in the general ledger, each account
accompanied by a reference number. It allows the recording of all necessary data.
Box 3.2 notes two important points about charts of accounts for regulators.
The French accounting practice, with its Plan Comptable Général (PCG), takes
a regulated approach to the development of a chart of accounts. Enforced legally,
the PCG has a detailed fi xed codifi cation. The French approach has been adopted
by many other European countries but not always as a legal obligation. Countries
of the West African Economic and Monetary Union have applied versions of the
PCG, such as the Système Comptable Ouest-Africain (Syscoa), since 1998.
The Anglo-Saxon accounting tradition takes a different approach to the charting
of accounts. Instead of specifi c legal rules to be applied to a plan or codifi cation of
AFIR_027-042_ch03.indd 37AFIR_027-042_ch03.indd 37 4/3/08 8:37:05 AM4/3/08 8:37:05 AM

38
Accounting for Infrastructure Regulation: An Introduction
3
Table 3.3. Simple cash fl ow statement
December 2004
Net earnings 800,000
Additions to cash
Depreciation 10,000
Decrease in accounts receivable 20,000
Increase in accounts payable 15,000
Subtractions from cash
Decrease in taxes payable –3,000
Increase in inventory –30,000Net cash from operations 812,000Cash fl ow from investing
Equipment –30,000Cash fl ow from fi nancing
Paid dividends –15,000Net cash fl ow 767,000
Source: Authors.
Box 3.2. Two important points about charts of accounts for regulators
For regulators, two points about charts of accounts are important. First, the charts provide more detailed information than general fi nancial statements, especially on the cost of goods and services sold and expense accounts. The charts are the basic source for most accounting statements and provide detailed original information. They enable comparison of the level of specifi c cost items over time. In the absence of a cost accounting information sys-tem, the chart of accounts is the minimum information from which the regu-lator can gain some knowledge about the cost structure. However, the codifi -cation used by the company or imposed by the law might not suit the regulator’s needs, and a chart of accounts at the company level (without seg-mentation of activities, for example) will not enable the regulator to verify compliance with its regulatory objectives.
Second, charts of accounts are not included in statutory fi nancial state-ments. They have to be requested from the company as part of a more gen-eral information request. Chapter 6 covers this issue in more detail.
Source: Authors.
AFIR_027-042_ch03.indd 38AFIR_027-042_ch03.indd 38 4/3/08 8:37:05 AM4/3/08 8:37:05 AM

39
Corporate Information and Financial Accounting
3
accounting transactions, more general obligations concerning the information to be
provided give countries a margin of freedom. Auditors or professional organizations
provide charts of account rules and principles, creating some homogeneity.
Some general principles apply to the organization of charts of accounts:
• The fl ow of items is from the general (starting with collective accounts) to the
particular.
• Account names refl ect clear terminology.
• Accounts are not overgeneralized.
Reference numbers are assigned to items logically, referring to items in terms of
their recording in the appropriate fi nancial statements: balance sheet, profi t and
loss account, or other statement. Usually, assets are listed fi rst (from most to least
liquid), followed by liabilities, revenues (operating income fi rst, then nonoperating
income), charges, and so on. Table 3.4 provides an example of accounts numbering
in the United States.
The number of digits depends on the level of detail needed to describe the trans-
actions. The French PCG and the West African Syscoa—where the codifi cation is
strictly defi ned—can use up to six digits. Table 3.5 shows the main classes used by
the Syscoa chart plan.
The new International Financial Reporting Standards norms
Since 2005 all consolidated accounts of companies quoted on European stock
exchanges have followed the International Financial Reporting Standards (IFRS)
developed by the International Accounting Standards Board (IASB).3
Table 3.4. Example of accounts numbering in the United States
Class 1 1000–1999 Asset accounts
Class 2 2000–2999 Liability accounts
Class 3 3000–3999 Equity accounts
Class 4 4000–4999 Revenue accounts
Class 5 5000–5999 Cost of goods sold
Class 6 6000–6999 Expense accounts
Source: Authors.
AFIR_027-042_ch03.indd 39AFIR_027-042_ch03.indd 39 4/3/08 8:37:06 AM4/3/08 8:37:06 AM

40
Accounting for Infrastructure Regulation: An Introduction
3The conceptual framework of the IFRS norms closely resembles the Anglo-
Saxon framework with respect to
• economic vision of the company,
• explicit integration of principles such as “substance over form” and “fair value,”
• information oriented mainly toward investors, and
• information aimed at measuring the economic performance of the company
and used as a decision-making tool.
Following these norms, the concept of “fair value” is progressively applied to the
valuation of all assets. Fair value is the market value of the asset at the end of each
period (based on the concept of a revaluation of the asset from period to period) or,
if the market value is unavailable, the exchange value or actualized value of future
cash fl ows generated by the asset under consideration.
The West African accounting system Syscoa was infl uenced by the French
accounting system and the PCG, but it was also infl uenced by the IFRS. It adopts a
partial economic presentation of the assets and liabilities of the company rather
than the strictly patrimonial and legal approach of the French accounting system
(applying, for example, the principle of “substance over form” for some categories
of assets or costs4). Nonetheless, Syscoa applies the historical cost concept and not
the fair value concept. Applying the fair value concept involves a much higher infor-
mation requirement, and information is not an easily accessible resource in Africa.
Table 3.5. Example of the main classes of accounts numbering used in the West African Syscoa Chart Plan
Class 1 Resources (long-term liabilities)
Class 2 Fixed assets
Class 3 Stocks
Class 4 Accounts receivable
Class 5 Cash accounts
Class 6 Cost of goods and expenses (“ordinary activities”)
Class 7 Revenues (from “ordinary activities”)
Class 8 Other costs and revenues
(Class 9) (Dedicated to cost accounting)
Source: Authors.
AFIR_027-042_ch03.indd 40AFIR_027-042_ch03.indd 40 4/3/08 8:37:06 AM4/3/08 8:37:06 AM

41
Corporate Information and Financial Accounting
3
Additional reading and resources
Dufi ls, P., C. Lopater, and E. Guyomard. 2002. Comptable 2003. Mémento pratique Francis
Lefebvre. Paris: Editions Francis Lefebvre.
Friedlob, G. T., and F. J. Plewa, Jr. 2000. “Financial and Business Statements.” 2nd ed.
Hauppauge, NY: Barron’s Educational Series.
Laudon, K., and J. Laudon. 1998. Management Information Systems: New Approaches to Orga-
nization and Technology. 5th ed. Upper Saddle River, NJ: Prentice Hall.
Pintaux, P. 2002. “Le système comptable ouest-africain (Syscoa): L’intégration économique
par la comptabilité.” Tertiaire 104. Paris.
UEMOA (Union economique et monétaire ouest africaine). 1997. Système comptable ouest
africain: guide d’application. Paris: Foucher.
Walton, P. 2001. La comptabilité anglo-saxonne. Paris: La Découverte.
See also International Accounting Standards Board, www.iasb.org, on IFRS norms.
Notes
1. In some countries, such as France, accounting regulation does not explicitly defi ne
materiality.
2. In the United Kingdom, companies may record fi xed assets at a value higher than historical
cost to compensate for the impact of infl ation on long-term assets. This strategy is called modifi ed
historical cost. Revalued assets are then depreciated on the basis of their new value. This practice
is in line with the British approach to regulatory asset base valuation (see chapter 6). However,
this current cost accounting is not an obligation. Companies may continue to show their state-
ments in historical cost. In practice, the main users of current cost accounting are regulated utility
companies.
3. These norms are not accepted in the United States, where European companies still have to
apply U.S. GAAP rules in meeting their reporting requirements.
4. The principle of “substance over form” is not formally included in the basic principles of
Syscoa, because it was perceived as too far from the cultural and legal tradition of these African
countries, but the principle is applied to some specifi c types of assets and charges. For more
information, see Pintaux (2002).
AFIR_027-042_ch03.indd 41AFIR_027-042_ch03.indd 41 4/3/08 8:37:06 AM4/3/08 8:37:06 AM

AFIR_027-042_ch03.indd 42AFIR_027-042_ch03.indd 42 4/3/08 8:37:06 AM4/3/08 8:37:06 AM

43
Chapter 4
Management accounting is the process of identifying, measuring, accumulating, analyzing, preparing, interpreting, and communicating fi nancial information to enable managers to plan, evaluate, and control an organization. For this purpose, management accounting can use a variety of fi nancial and nonmonetary data (Shim and Siegel 2000).
Cost accounting focuses specifi cally on cost information: cost record-ing and reporting, cost measurement, cost management, and cost analy-sis. Cost management is obtaining product- or service-costing data and using that information to help managers make decisions related to the products and services in question (pricing, technology, and so on). Cost analysis involves critically examining cost data and translating them into useful information for managerial planning, control, and decision making (see table 4.1).
4.1. Objectives of management and cost accounting
What motivates management and cost accounting? The information provided in
the companywide fi nancial accounts used to issue the statutory accounts reviewed
in chapter 3 is not suffi cient for managers to conduct operations effectively, tacti-
cally, and strategically. They also need external market information—about com-
petitors and the economic, political, and social environments. In addition, they
need detailed internal information.
To guide decisions such as pricing, managers will want to know various costs,
such as the cost of a specifi c product or service, a unit within the company, or a
Management and Cost Accounting
AFIR_043-062_ch04.indd 43AFIR_043-062_ch04.indd 43 4/3/08 8:49:58 AM4/3/08 8:49:58 AM

44
Accounting for Infrastructure Regulation: An Introduction
4 project; or the cost of supplying a customer or a specifi c group or category of
customers. In short, managers will want to know the cost of whatever they decide
to analyze.
To conduct any reporting or profi tability analysis or any cost control, managers
have to rely on a cost accounting system. More specifi cally, they need to undertake
cost analysis and to allocate costs to specifi c objectives that they defi ne. Cost objec-
tives can be
• geographically oriented—that is, oriented to a specifi c country or region, or to a
specifi c sales location;
• customer oriented—that is, oriented to specifi c categories of customers classi-
fi ed by wealth, way of life, consumption behavior, age, ethnic group, or other
characteristics;
• product or service oriented—that is, oriented to a specifi c product (service) or
line of products (services);
• plant oriented; or
• business unit oriented.
Profi tability analysis and price determination are obvious goals of cost account-
ing systems and cost allocation processes, but they are not the only goals. Managers
can also use them for motivation (see box 4.1); as a basis for cost reimbursement (a
condition of some contracts or controls in sectors such as defense contracting,
health care, and public utilities); or for income and asset measurement for external
Table 4.1. Differences between fi nancial accounting and cost analysis
Financial accounting Cost analysis
Provides data for external users. Provides data for internal users.
Subject to generally accepted accounting principles. Not subject to generally accepted accounting principles.
Emphasizes accurate and timely data. Emphasizes relevance and fl exibility of data.
Focuses on the business as a whole. Focuses on parts as well as on the whole of a business.
Primarily stands by itself. Draws heavily from other disciplines such as fi nance, economics, and quantitative methods.
Is an end in itself. Is a means to an end.
Source: Shim and Siegel 2000.
AFIR_043-062_ch04.indd 44AFIR_043-062_ch04.indd 44 4/3/08 8:49:59 AM4/3/08 8:49:59 AM

45
Management and Cost Accounting
4
parties (stockholders or tax administrations). This chapter discusses the principles
that management can apply when using the cost accounting and cost allocation
systems.
4.2. Cost classifi cations
Cost classifi cations are essential to any cost analysis. Many types of cost classifi ca-
tions can be used, depending on managers’ analytical needs of management. The
four main types of cost classifi cations used by managers are
• management function (manufacturing and nonmanufacturing costs);
• degree of averaging (total and average cost);
• timing of charges against sales (period and product costs); and
• relevance to planning, control, and decision making.
Box 4.1. Use of cost accounting and cost allocation systems for motivation
Cost allocation can be used to serve management goals by encouraging or discouraging departments to use specifi c services. Management is con-cerned that the marketing department is not using the services of the legal department. This practice has caused legal problems with corporate com-munication. In addition to some specifi c collaboration procedures, manage-ment could use cost allocation as an incentive for the marketing depart-ment to use those legal services. It could allocate a portion of the costs of the legal department to the marketing department. Because the marketing department will have to pay for these services anyway, the manager will be more willing to use these services. Now assume that the company’s design department uses the services of the legal department too intensively, because the costs are not properly allocated to that department. The com-pany’s general management can then decide to implement a higher alloca-tion of costs or an allocation based on research and consultation hours, to remind the design department to use the services more effectively.
Source: Authors.
AFIR_043-062_ch04.indd 45AFIR_043-062_ch04.indd 45 4/3/08 8:49:59 AM4/3/08 8:49:59 AM

46
Accounting for Infrastructure Regulation: An Introduction
4
The last type can be divided into costs by behavior (variable and fi xed costs, direct
and indirect costs) and “other.”
Management function
Management function costs are divided according to the associated functional
activities: manufacturing costs and nonmanufacturing costs.
Manufacturing costsManufacturing costs are related to the production process of the company and
include direct materials, direct labor, and manufacturing overheads.
• Direct materials (or raw materials) are materials that become an integral part of
the company’s fi nished product. The term direct implies easy tracing. Other
materials (normally referred to as indirect materials) are not easily traced and so
are considered part of manufacturing overheads (for example, lubricants and
cleaning supplies).
• Direct labor is related to the physical labor force used directly in making prod-
ucts in a “hands-on” sense. In furniture making, for example, a carpenter’s wage
can be considered a direct labor cost.
• Manufacturing overheads are all manufacturing costs except direct materials and
direct labor: indirect materials costs; indirect labor costs such as wages of factory
supervisory personnel; and all other costs relating to the manufacturing divi-
sion, such as depreciation of factory buildings and equipment, factory utilities,
and insurances related to the manufacturing activity.
Nonmanufacturing costsNonmanufacturing costs or operating expenses are related to marketing or selling
and administrative expenses that cannot be traced during the manufacturing process.
Legal expenses or executive compensation are examples of nonmanufacturing costs.
Degree of averaging
Knowing the average cost per unit of a product or service is useful for internal
reporting and pricing purposes or for comparing costs among fi rms. Average unit
cost is simply the total cost divided by an appropriate denominator, which is selected
on the basis of specifi c needs, such as unit price per product or unit cost per client.
Average cost can be easily related to pricing issues. In competitive markets, a fi rm
AFIR_043-062_ch04.indd 46AFIR_043-062_ch04.indd 46 4/3/08 8:49:59 AM4/3/08 8:49:59 AM

47
Management and Cost Accounting
4
will maximize its profi t when price equals marginal costs. In the case of natural
monopolies (such as public utilities), however, setting prices at marginal cost would
lead to problems of sustainability, because the fi rm would not cover its fi xed costs
(average cost is greater than marginal cost).
Timing of charges against revenue
The timing of charges against revenue concerns the relation of costs to the manu-
facturing of a product. On this basis, costs can be classifi ed as product costs (or
inventoriable costs) or period costs.
Product costs are treated as inventory until the product is sold, which may not be
in the production period that the cost was incurred. When the product is sold, the
costs become expenses—costs of goods sold. This means that these costs are ini-
tially in the balance sheet as assets (unsold merchandise) and that they move into
the income statement when they become expenses (when the unit is sold). Typi-
cally, raw material costs are product costs.
Period costs are always incurred in a single period and so do not go through an
inventory stage. Items such as sales commission, offi ce rent, and other nonmanu-
facturing costs are examples of period costs. More generally, all sales and adminis-
trative expenses are period costs.
Relevance to planning, control, and decision making
Costs relevant to planning, control, and decision making can be classifi ed by cost
behavior and other characteristics.
Cost classifi cation by behaviorClassifying costs by behavior—by how costs respond to changes in the level of the
business activity—is essential for understanding cost allocation. The most com-
mon cost behaviors under scrutiny are variable and fi xed costs and direct and indi-
rect costs.
Variable and fi xed costs. The typology of variable and fi xed costs classifi es costs
according to their behavior when changes occur in the business activity. If activity
rises or falls, some costs move along with the level of activity, while others remain
constant.
Variable costs vary with the level of business activity, but not all variable costs
have the same behavior pattern. Some behave in a proportionately variable pattern,
AFIR_043-062_ch04.indd 47AFIR_043-062_ch04.indd 47 4/3/08 8:49:59 AM4/3/08 8:49:59 AM

48
Accounting for Infrastructure Regulation: An Introduction
4
whereas others behave in a step-variable pattern and might not change with small
increases in the level of production. An example of true variable costs is direct mate-
rials. Whatever the increase in production, materials will need to increase propor-
tionately, so more costs are associated with production. An example of step-variable
costs is the labor costs of maintenance workers. Their workload might not change
with nonsubstantial increases or decreases in production.
Fixed costs remain constant in total, regardless of the level of activity within the
relevant range. As a result, fi xed costs are not affected by changes in activity during
a period. Examples of fi xed costs are rents, research costs, advertising costs, depre-
ciation of buildings and equipment, and salaries of operating personnel. Fixed costs
are sometimes referred to as capacity costs, because they are related to expenses
incurred for plant facilities, equipment, and other items needed to provide the basic
capacity to satisfy customers’ demands.
Because fi xed costs are constant over a range of activities, unit cost declines as
volume increases, while variable costs remain the same (because raising production
also raises variable costs so that the unit variable cost is unchanged). Hence the
concept of “variable and fi xed” refers to the cost rather than the units (table 4.2).
Considering total costs divided by total volume without distinguishing fi xed and
variable costs can lead to misleading interpretations.
Direct and indirect costs. Direct costs are costs that can be directly traceable to a
specifi c activity (a cost objective). Direct costs do not cause problems of allocation,
because they are easily allocated to a specifi c activity. Materials and labor directly
used when producing a specifi c good or delivering a specifi c service are direct costs.
Table 4.2. Cost behavior—Fixed and variable costs
Cost behavior
Cost type In total Per unit
Variable cost Increases and decreases in proportion to changes in the level of activity
Remains constant per unit
Fixed cost Unaffected by changes in the level of activity
Decreases per unit as the level of activity rises and increases per unit as the level of activity falls
Source: Authors.
AFIR_043-062_ch04.indd 48AFIR_043-062_ch04.indd 48 4/3/08 8:49:59 AM4/3/08 8:49:59 AM

49
Management and Cost Accounting
4
The cost of the fuel used by a generator and the salaries of the technicians in charge
of that generator are direct costs of energy generation, for example.
Indirect costs are costs that cannot be assigned directly to a specifi c product or
service. As will be seen in the discussion of cost allocation issues, indirect costs can
give rise to problems, because they need to be assigned to the different products and
services provided by the company. Examples of indirect costs are marketing and
advertising costs, top management costs, indirect factory-labor costs, and deprecia-
tion of buildings. Indirect costs are also called common costs or joint costs, between
which a subtle difference exists.
Joint costs arise when a single and indivisible process gives rise to several prod-
ucts or services. An example of a joint cost is the cost of cattle for producing hides
and beef (one cow less or more means a reduction or increase in the same propor-
tion of hides and beef). Another example is the cost of a cotton fi eld to produce
cottonseed and cotton fi ber.
Common costs arise when a single process gives rise to several products or ser-
vices, even though they can be produced separately. For example, the cost of equip-
ment that can be used to produce two products is a common cost. Unlike joint
costs, common costs can vary to some degree with the quantity of production of
each product, even though they are not directly attributable to a single product.
With joint costs, variation in production of one product necessitates simultaneous
variation in production of the other product. When allocating costs, tracing com-
mon costs back to units of a specifi c output (product or service) is usually easier
than tracing joint costs because of this relative variability characteristic.
Cost typologies unrelated to behaviorOther cost typologies not related to cost behavior but also relevant to planning,
control, and decision making are
• controllable and uncontrollable costs,
• opportunity costs,
• sunk costs,
• incremental (or differential) costs and marginal costs, and
• stand-alone costs.
Controllable and uncontrollable costs. A cost is considered controllable at a spe-
cifi c level of an organization if it is signifi cantly under the infl uence of the managers
at that level. Controllability can be linked to the organization of the entity (does the
manager have the authority to authorize the cost in question?). It can also be related
AFIR_043-062_ch04.indd 49AFIR_043-062_ch04.indd 49 4/3/08 8:49:59 AM4/3/08 8:49:59 AM

50
Accounting for Infrastructure Regulation: An Introduction
4
to the price of the good or service. For example, if fuel is necessary to produce the
good or service, it can be considered an uncontrollable cost, because its price is
fi xed on the international market.1 Controllability also includes a time dimension.
Costs that are controllable over the long term may not be controllable over the
short term.
Opportunity costs. An opportunity cost is the net benefi t forgone by choosing one
alternative over others. Opportunity costs are not entered on the accounting books
of a company.
Sunk costs. A sunk cost is a cost that has already been incurred and cannot be
changed by any decision made now or in the future. Sunk costs should be consid-
ered irrelevant to future decisions.
Incremental (or differential) costs and marginal costs. Accountants understand
incremental or differential cost as the cost difference between two alternatives.
More accurately, differential costs are either incremental (increase in cost from one
alternative to another) or decremental (decrease in cost from one alternative to
another). Differential costs can be variable or fi xed.
The accountant’s concept of differential cost can be compared with the econo-
mist’s concept of marginal cost, as can their views of incremental cost. Marginal
costs are relative to the costs of producing one additional unit of output. For econo-
mists, setting prices at marginal costs leads to optimal use of resources and send
true signals of costs to customers.
The activities for which companies can plan additional single units of output are
few. Rather, companies prefer to plan in blocks or increments of output. In practice,
incremental costs are used more than marginal costs. An increment of output could
be generated solely by a new activity that a company would like to undertake. The
incremental cost would then refer to the specifi c costs of that new activity. Incre-
mental costing methods are used in pricing decisions and control, but further dis-
cussion is beyond the scope of this volume (for more detail, see Munasinghe 1990a
and 1990b).
Stand-alone costs. When a company has several activities, the stand-alone cost of a
specifi c activity is the cost that would be incurred if the company undertook solely
that activity.
AFIR_043-062_ch04.indd 50AFIR_043-062_ch04.indd 50 4/3/08 8:49:59 AM4/3/08 8:49:59 AM

51
Management and Cost Accounting
4
Comparison of cost classifi cations
Figure 4.1 illustrates the main approaches to cost classifi cations for a company that
manufactures and markets its own products. Product costs are manufacturing
costs, and period costs are nonmanufacturing costs. Direct labor and direct materi-
als costs are variable costs. Other manufacturing costs can be variable (materials
not directly traceable to a product) or fi xed (rent or depreciation of factory build-
ing). Most nonmanufacturing costs are fi xed costs, but some can be variable (such
as sales commission). Variable costs such as direct labor or direct materials are
direct costs, but all other manufacturing costs not directly traceable to a product are
indirect by nature. All nonmanufacturing costs are indirect.
Adding incremental and stand-alone costs to fi gure 4.1 would require splitting
the indirect costs into common costs and joint costs. About a company that has two
activities, A and B, it could be observed that the
Incremental cost of A = all direct costs of A + % common costs of A and B.2
Stand-alone costs of A = all direct costs of A + all joint costs of A and B + % common costs of A and B.
Figure 4.1. Comparison of cost classifi cations
Source: Authors.
Product costsManufacturing costs
Directmaterials costs
Other manufacturing costs
Variable costs
Fixedcosts
Fixedcosts
Variablecosts
Nonmanufacturing costs
Direct labor costs
Variable costs
Period costsNonmanufacturing costs
Indirect costsIndirect costsDirect costs
AFIR_043-062_ch04.indd 51AFIR_043-062_ch04.indd 51 4/3/08 8:49:59 AM4/3/08 8:49:59 AM

52
Accounting for Infrastructure Regulation: An Introduction
4
When estimating the stand-alone cost of activity A (if the company were
hypothetically considering to undertake only that activity), all the joint costs
incurred by the company in real life when activities A and B are performed
would be included. The logic is that these joint costs (because of their nature)
will have to be borne, even if the company decides to perform only activity A. In
the example of the cotton fi eld used to produce cottonseed and cotton fi ber, the
cost of the cotton fi eld will have to be borne, even if the farmer decides to pro-
duce only cottonseed and not cotton fi ber. However, some of the common costs,
such as the administration costs, could probably be cut back if the farmer decides
to drop cotton fi ber production. Thus only a percentage of the common costs
are considered.
Box 4.2 provides an example of stand-alone and incremental pricing.
Box 4.2. Stand-alone and incremental pricing: The case of the Australian Gas Light Company
In its submission to the Independent Pricing and Regulatory Tribunal’s (IPART) 1999 access review, the Australian Gas Light Company (AGL) argued that it had rebuilt the gas network mainly on the basis of large users’ demand for high-pressure gas. Residential customers were served by low-pressure local systems connected to the high-pressure network.
AGL argued that a low-pressure network would not have been eco-nomical if it had to bear the fully distributed cost of the high-pressure system. AGL proposed that high-pressure customers be charged on the stand-alone costs of the network serving those customers, meaning that the high-pressure customers would bear almost all the capital and main-tenance costs of the high-pressure network and a larger share of the administrative and general overhead costs. The incremental costs for the residential customers were the full asset and maintenance costs of the low-pressure system, marketing costs, and the additional administrative and general overhead costs resulting from the incremental asset, main-tenance, and marketing costs. The box table below shows the effect of the different allocation rules and asset base assumption on the revenues from the contract (high-pressure) customers.
(continues)
AFIR_043-062_ch04.indd 52AFIR_043-062_ch04.indd 52 4/3/08 8:50:00 AM4/3/08 8:50:00 AM

53
Management and Cost Accounting
4
IPART rejected the proposal to use the stand-alone/incremental cost allocation. It considered that, given the market’s development since the initial investment, a fully distributed cost allocation represented a reason-able balance of the various consumers’ interests.
Source: Authors.
Revenue scenarios for contract customers under different asset base and cost allocation methodologies (millions of Australian dollars)
Asset valuation methodology
ORC DORC ICB DAC
Scenario 1
Stand-alone allocation of capital and operating costs $69m $61m $52m $47mScenario 2
Stand-alone allocation of capital cost and fully distributed allocation of operating costs
$58m $50m $41m $36m
Scenario 3
Fully distributed allocation of capital and operating costs $53m $46m $38m $34mAGL’s proposal $70m
Note:1. Capital costs include return on capital base and depreciation.2. Return on assets is based on a pre-tax rate of return of 7.75 percent for the scenarios of ORC, DORC, and
ICB. A nominal return of 10.44 percent is assumed for the scenario of DAC.3. Depreciation is assumed to be 2 percent per annum.
Box 4.2. (continued)
4.3. Cost allocation
Cost allocation is based on the classifi cation of costs into direct costs and indirect
costs, as noted above. The principle of causality intrinsic to that classifi cation is a
guiding principle of cost allocation.
Cost analysis requires defi ning the objective of that analysis in relation to a man-
ager’s goals: the cost objective as introduced in this chapter’s fi rst section. Costs
have to be assigned to that cost objective. In most cases that means total costs, both
direct and indirect. Direct costs cause no allocation problem, because they can be
readily traced to a specifi c cost objective. The diffi culty arises with indirect costs.
Thus the defi nition of cost allocation is the assignment and reassignment of indi-
rect costs or groups of indirect costs to one or more cost objectives.
AFIR_043-062_ch04.indd 53AFIR_043-062_ch04.indd 53 4/3/08 8:50:00 AM4/3/08 8:50:00 AM

54
Accounting for Infrastructure Regulation: An Introduction
4
The classifi cation of costs and the complexity of the cost allocation process are
infl uenced by the defi nition of the cost objective. For example, if cost objectives are
defi ned in terms of organizational levels (company, departments, subdepartments,
and so on) and if the whole company is the cost objective, all costs would be direct
costs. The more objectives are disaggregated or defi ned fi nely, the more likely it is
that costs will be common to more than one objective.
Goals of cost allocation
The goals of cost allocation are price determination, evaluation of performance and
profi tability, cost reimbursement, and incentives to use specifi c services within a
company more or less intensively.
General criteria for cost allocation
Depending on their goals, managers can apply different criteria to defi ne their gen-
eral approach to cost allocation. Four basic criteria can guide their cost allocation
decisions:
• Cause-effect relationship (causality principle). Costs may be allocated on the basis
of services provided (costs are allocated to the source that caused the costs to be
incurred).
• Benefi ts received. Costs may be allocated on the basis of benefi ts received (for
example, advertising costs might be allocated to products or services of a com-
pany on the basis of respective sales).
• Ability to bear. Costs may be allocated on the basis of the cost objective’s capacity
to bear them (for example, higher shares of corporate executives’ salaries may be
allocated to the most profi table departments or products).
• Arbitrary allocation. Costs may be allocated arbitrarily on a lump-sum basis.
The cost allocation choice has to be guided by the dominant goal to be served.
For example, causality should be the guiding principle when the decision maker
wants to ensure that the price of a good or a service refl ects its costs (a main con-
cern to competition or regulatory authorities). But decision makers might choose
other principles in some situations. Even regulators sometimes apply a concept
similar to ability to bear (“single till” concept). Arbitrary allocation might make
sense when managers want to encourage or discourage the use of some services, as
noted above. Whatever principle is followed, cost allocation should be straightfor-
ward, transparent, and consistent over some time.
AFIR_043-062_ch04.indd 54AFIR_043-062_ch04.indd 54 4/3/08 8:50:00 AM4/3/08 8:50:00 AM

55
Management and Cost Accounting
4
A step-by-step process
Cost allocation is basically a step-by-step process that requires identifying and clas-
sifying costs as direct or indirect, tracing direct costs to the cost objectives, grouping
indirect costs in cost pools, and allocating the cost pools to the cost objectives. Fig-
ure 4.2 summarizes a general cost allocation process.
Cost allocation entails fi ve steps:
1. Choosing a cost objective
2. Identifying direct costs and tracing them to cost objectives
3. Pooling (choosing and accumulating in pools) the remaining indirect costs
that relate to the cost objective defi ned in step 1
4. Choosing a method of relating the indirect costs in step 3 to the cost objec-
tive in step 1—choosing a cost allocation base
5. Assigning direct and indirect costs to cost objectives
Following this process, all costs will be allocated or distributed.
Choosing a cost objectiveThe fi rst step in a cost allocation process is identifying what to study. Cost objectives
can be a product or a service; a department or division of the company; a production
Figure 4.2. General cost allocation process
Source: Authors.
Cost accounting information
Direct costs Indirect costs
Cost pools
Cost objectives
AFIR_043-062_ch04.indd 55AFIR_043-062_ch04.indd 55 4/3/08 8:50:00 AM4/3/08 8:50:00 AM

56
Accounting for Infrastructure Regulation: An Introduction
4
process, a specifi c job, contract, or customer; a sales region; or an organizational
segment.
Identifying direct costs and tracing them to cost objectivesIdentifying costs that are directly traceable to a specifi c cost objective causes no
allocation problems.3 Relevant here is another type of basic cost classifi cation—that
involving fi xed costs and variable costs. Recall that all direct costs are variable costs
(direct costs will vary in total in proportion to fl uctuations in the level of service
consumed), but all variable costs are not direct costs (see table 4.2).
Pooling indirect costs that relate to cost objectivesCosts that cannot be directly traceable to a specifi c cost objective are the remain-
ing indirect costs (common costs or joint costs). Cost allocation thus refers to the
allocation of these indirect costs. The individual indirect cost items that relate to
the cost objective have to be identifi ed and then regrouped into homogeneous
cost pools. A cost pool is homogeneous when the activity for which costs are
included have a cause-effect relationship to the cost objective defi ned, as have
other activities for which costs are included in that cost pool. Such homogeneity
facilitates application of a single cost driver in allocating the cost pool to fi nal cost
objectives.
The number of cost pools depends on the number of cost groups that are identi-
fi ed and on the relative importance of the different cost items. In simple allocation
methods, cost pools can simply be departments of the company (personnel, pur-
chasing, production, and so on). Activity-based costing methods are more complex.
They identify the activities (actions, work sequences, events, or transactions) that
cause an indirect cost to be incurred in production of the product or provision of
the service (when the cost objective is a product or a service). The groups of indirect
costs allocated to these different activities will thus be the cost pools. Then the main
issue is how to allocate these cost pools.
Choosing a cost allocation baseOnce the indirect costs have been allocated to multiple cost pools, the cost pools
must be assigned to the cost objectives through the allocation bases or cost drivers
that cause the costs to be incurred. Cost drivers are activity measures that cause
costs to be incurred. They may include variables such as number of employees,
labor hours, area of space occupied, or any other measure of activity in a depart-
ment. Ideally, the base has some cause-and-effect relationship with the cost.
AFIR_043-062_ch04.indd 56AFIR_043-062_ch04.indd 56 4/3/08 8:50:00 AM4/3/08 8:50:00 AM

57
Management and Cost Accounting
4
Basically, cost drivers can be divided into three types:
• Input based. Allocation is based on the share of the other attributable inputs
(direct labor, direct materials, and so on).
• Output based. Allocation is based on output indicators such as the production or
sales volume share of the given product in total output of the company.
• Revenue based. Allocation is based on revenues generated by the product in
question.
Cost allocation infl uences the choice of cost driver. Revenue-based cost drivers,
for example, are inconsistent with the principle of causality. They do not take into
account the specifi c technology or processes used in production of a good or deliv-
ery of a service. They simply assume that the more (or less) revenues a product or
service generates the more (or less) costs are incurred.
In all cases, the choice of cost drivers has to be motivated by cost of measurement
and degree of correlation. With respect to the former, information for the chosen
cost driver must be available at reasonable cost. If machine-hours appears to be an
appropriate cost driver, information has to be available for the machine. If not, the
manager must fi gure out the cost of generating the information. With respect to
degree of correlation, a consistent relationship between the cost driver and the con-
sumption of the item in question must be known.
Assigning direct and indirect costs to cost objectsEventually, all identifi ed direct costs and allocated indirect costs will be assigned to
cost objectives.
Cost allocation approaches and methods
Costs can be allocated following an accounting approach or an economic
approach.
Accounting approachesTwo basic accounting approaches to cost allocation are fully distributed costs and
activity-based costs.
Fully distributed costs. The fully distributed cost (FDC) approach is the general
accounting approach to cost allocation. It follows the general step-by-step approach
described in the third main section of this chapter.
AFIR_043-062_ch04.indd 57AFIR_043-062_ch04.indd 57 4/3/08 8:50:00 AM4/3/08 8:50:00 AM

58
Accounting for Infrastructure Regulation: An Introduction
4
The FDC approach allocates all costs among cost objectives on the basis of the
principle of causality but uses imprecise cost drivers, such as a broad volume-based
driver (number of units sold) or value-based drivers (sales).
The main criticisms of FDC are related to the arbitrary cost allocation (based on
a simple ratio) and lack of economic effi ciency. Economists have also criticized use
of the FDC approach to test for cross-subsidies between services.
The lower limit and upper limit of subsidy-free prices are the incremental cost
and the stand-alone cost, respectively. To understand these limits, assume two cost
objectives, A and B. Segment the indirect costs of A and B into common costs and
joint costs. The FDC approach simply allocates a share of the common costs and
joint costs to cost objectives A and B. Incremental costing views one objective, A for
example, as the primary objective and the other, B, as the incremental objective.
Therefore, one part of the common costs are allocated to the incremental part B,
but none of the joint costs (as these expenses are incurred anyway by the primary
objective). In stand-alone costing of B, the process is the same, but all joint costs are
allocated to B (as explained in 4.2, this chapter).
Incremental cost of B = all direct costs of B + % common costs of A and B.
Stand-alone costs of B = all direct costs of B + all joint costs of A and B + % common costs of A and B.
Therefore, stand-alone costs and incremental costs can be used as upper and lower
limits of the FDC approach to test the relevance of the approach’s estimations.
These costing approaches are common in pricing issues and occasion consider-
able discussion in competition and regulatory debates. In a common example, com-
pany X accuses competitor Y of predatory pricing when launching a new product or
service. In making its argument, company Y uses the incremental costing approach
to validate its price for the new product or service, and company X challenges the
estimation on the basis of fully distributed cost, which results in a higher cost.
The FDC method allocates all costs, both direct and indirect, to the cost objec-
tives. The time horizon and the nature of decisions might lead managers to choose
a different method. For example, when considering short-term decisions to maxi-
mize the use of various organizational segments’ existing capacity, managers are
not interested in FDCs to the segments, because they will not be able to infl uence
the common fi xed costs in the short term. Managers will only be interested in the
AFIR_043-062_ch04.indd 58AFIR_043-062_ch04.indd 58 4/3/08 8:50:00 AM4/3/08 8:50:00 AM

59
Management and Cost Accounting
4
direct variable costs of each organizational segment. They will compare these costs
with the revenues that each segment can generate. When confronted with the choice
of using existing capacity in plant A or installing new capacity in plant B, managers
will be better off using plant A as long as the plant’s incremental costs are lower than
the cost of installing and running new capacity in plant B. The FDCs of plant B may
be lower than those of plant A, but this information is not relevant to the decision
as long as suffi cient spare capacity exists in plant A.
Activity-based costing. The activity-based costing method (sometimes called trans-
action costing) is considered more accurate than the FDC method in allocating indi-
rect costs such as manufacturing overheads. Activity-based costing focuses on pro-
cesses or activities rather than fi nal goods or services outputs. It links costs to these
processes and then links these processes back to fi nal goods or services outputs.
Garrison and Noreen (1994) note that activity-based costing improves costing
systems in three ways:
• It increases the number of cost pools used to accumulate indirect costs such as
overhead costs. Rather than accumulate all the costs simply—for example, in
company department pools—costs are accumulated by activity.
• It changes the bases used to assign indirect costs to products. Rather than assign-
ing costs on the basis of a simple measure such as volume, costs are assigned on
the basis of the activities that generate the costs.
• It changes the nature of many indirect costs, reclassifying them into direct costs
so that they can be traced to specifi c activities.
Activity-based costing attempts to capture the intrinsic “technology” of produc-
tion or service delivered through managers’ understanding of the different pro-
cesses and activities involved. It requires a deep knowledge of the company’s activi-
ties. The drawback of this approach is that if technology changes—if the relationship
between inputs and fi nal products and services through processes and activities
changes—the allocation method has to change too.
Economic approach to allocation: Ramsey pricingEconomic approaches to cost allocation such as the Ramsey approach are based on
demand factors rather than cause-effect relationships. The Ramsey approach con-
sists of allocating common costs on the basis of the price elasticity of demand for
each service. Cost allocation is inversely proportional to elasticity, and thus a bigger
AFIR_043-062_ch04.indd 59AFIR_043-062_ch04.indd 59 4/3/08 8:50:00 AM4/3/08 8:50:00 AM

60
Accounting for Infrastructure Regulation: An Introduction
4
share of cost is allocated to activities or products that are less sensitive to price vari-
ations. From an economic point of view, this allocation rule is optimal, because the
deviation of prices from their marginal costs will have a smaller effect on real
resource fl ows. Put another way, the actual resource fl ows would be closer to those
that would occur if all prices were set at their marginal costs. However, this approach
is diffi cult to put into practice, because demand elasticities are not always easy to
estimate.4
Cost distortion or cross-subsidization
When costs are not appropriately assigned to cost objectives, cross-subsidies and
distortions occur. The activity to which some of its own costs were not assigned will
be subsidized by the activities to which these costs were improperly assigned. The
subsidization will lead managers to make the wrong decisions for the given activi-
ties on the basis of profi tability analyses and price determination studies. This con-
cept is important for regulators.
Cross-subsidization may occur when companies
• fail to trace costs directly to the segments when the situation requires it,
• use inappropriate bases to allocate costs, or
• arbitrarily allocate common costs to segments.
Chapters 5 and 6 show that cross-subsidization is a central concern in regula-
tion. One of the main roles of regulators is to avoid unfair cross-subsidization
between or among different classes of customers or cross-subsidization of a com-
petitive service by a noncompetitive service that creates “undue” discrimination.
Cross-subsidies, when allowed by regulators, should be quantifi ed and transparent,
and the reason for them should be clearly stated. An example is a decision to subsi-
dize tariffs for low-income customers through low tariffs on low consumption lev-
els. The regulator should consider whether other policy instruments (for example,
direct transfers) would be a better means of achieving stated objectives.
Allocate budgeted costs or actual costs?
Whether indirect costs are allocated to cost objectives on an actual basis or on a
budgeted basis has implications for effi ciency.
Consider a company that wants to allocate the costs of a service department
(say, marketing) to operating units. The choice of method has consequence for the
AFIR_043-062_ch04.indd 60AFIR_043-062_ch04.indd 60 4/3/08 8:50:01 AM4/3/08 8:50:01 AM
61
Management and Cost Accounting
4
manager’s cost and profi tability analysis. If actual costs are allocated without proper
cost control, any management effi ciency of the service department will be hidden
in the routine allocation of the cost of that department to the operating units. If
allocation is made on the basis of budgeted costs, which are calculated on an effi -
ciency basis, any possible ineffi ciency will be retained in the service department and
not passed on to operating units.5
Additional reading and resources
Horngren, C. T., and G. Foster. 1987. Cost Accounting: A Managerial Emphasis. 6th ed. Upper
Saddle River, NJ: Prentice Hall.
Garrison, R. H., and E. W. Noreen. 1994. Managerial Accounting. Burr Ridge, IL: Irwin
Oxera. 2003. “Assessing Profi tability in Competition Policy Analysis.” Economic Discussion
Paper 6. Prepared for the UK Offi ce of Fair Trading, London. (See part I, section 6, on cost and
revenue allocation.)
Shim, J. K., and J. G. Siegel. 2000. Modern Cost Management and Analysis. 2nd ed. New York:
Barron’s Business Library.
Notes
1. Nonetheless, the manager is responsible for rationalizing its use in the production process.
This specifi c cost typology is examined again in chapter 6.
2. In the extreme, a company can decide to put to “0” the percentage of common costs, mean-
ing that all common costs are allocated to activity B.
3. Revenues should not pose a problem, because they, too, can be easily traced to a specifi c
activity. Problems might arise with revenues streaming from joint products (a “sales package”
with one price for two combined products).
4. Under a regulatory perspective, fairness is always stated as an argument against the Ramsey
rule.
5. Managers will have to compare budgeted costs with actual costs to identify the variance,
which they will have to explain and remedy.
AFIR_043-062_ch04.indd 61AFIR_043-062_ch04.indd 61 4/3/08 8:50:01 AM4/3/08 8:50:01 AM

AFIR_043-062_ch04.indd 62AFIR_043-062_ch04.indd 62 4/3/08 8:50:01 AM4/3/08 8:50:01 AM

63
Chapter 5
In the same way that managers of a company rely on cost accounting in making their planning and control decisions, regulators rely on cost accounting in making decisions related to their regulatory responsibili-ties. When a company supplies more than one product or service, man-agers and regulators need to relate the price of each product and service to its costs. They need to estimate the cash fl ow generated by each prod-uct or service and the value of the assets required by each activity. They use this information to calculate the internal rate of return of the activity and to compare it to its cost of capital.1 Then managers can determine whether developing that activity is worthwhile, and regulators and competition agencies can detect excessive or insuffi cient profi ts.
Managers and regulators rely on the same basic fi nancial indicators to measure the profi tability of an activity, but regulators have different and wider objectives than managers, so they need management accounting formatted to those objectives. Regulators need to defi ne their specifi c cost objectives and their own allocation rules and methodologies. Like managers, regulators use the company’s information to guide the setting of prices (tariffs) of the products and services sold by the company.2
Regulators also have to deal with monopolies or signifi cant market power situations, usually associated with utilities or other network industries such as transport. These specifi c needs require specifi c account-ing arrangements: regulatory accounting. Because of these specifi c market situations, regulators have to ensure that prices are fair and reasonable and that they refl ect effi cient costs. Therefore, regulators are particularly concerned with issues such as cross-subsidization and economic and effi cient management.
Why Do Regulatory Accounting?
AFIR_063-082_ch05.indd 63AFIR_063-082_ch05.indd 63 4/3/08 8:57:20 AM4/3/08 8:57:20 AM

64
Accounting for Infrastructure Regulation: An Introduction
5
Chapter 3 introduced cross-subsidization (or cost distortion). This chapter and chapter 6 examine the specifi c impact of this concern on the organization of accounting.
5.1. Regulatory accounting and its objectives
Regulatory accounting is a set of principles and rules of presentation of informa-
tion for regulated companies. These rules enable an allocation of companies’ costs,
revenues, assets, and liabilities in a way that facilitates control of the regulatory
objectives.
The practical objective of regulatory accounting arrangements is to provide infor-
mation to assist regulators in dealing with the particular market situation of utilities
and transport. This information should allow regulators to verify compliance with
the basic regulatory objectives that were defi ned in chapter 1: sustainability, allocative
effi ciency, productive effi ciency, and equity (or distributive effi ciency).
The principles underlying implementation of regulatory accounting are strongly
related to these four basic objectives. Most legal texts or guidelines related to the
regulatory framework state the rationale for regulation in the following terms:
• Monitor performance against the assumptions underlying price controls.
• Detect anticompetitive behavior (for example, unfair cross-subsidization and
undue discrimination).
• Assist in monitoring the fi nancial health of the operator.
• Set prices.
Regulators have to make trade-offs among these objectives. In prioritizing
objectives, regulators need to consider the intrinsic characteristics of the industry
network they regulate (the degree of competition, the amount and type of invest-
ments needed); the economic, social, and political environment of the country;
and so on. In network industries such as electricity and water, the main focus is
often on monitoring performance, setting fair and reasonable prices, and ensuring
that prices refl ect effi ciency costs.3 In telecommunications, the major preoccupa-
tion is often detecting anticompetitive behavior, such as cross-subsidization and
undue discrimination.4
In addition, regulatory accounting arrangements serve three practical objectives:
• They assist in benchmarking and in comparative competition (by promoting
the submission of comparable information by the different companies regulated
by the same authority).
AFIR_063-082_ch05.indd 64AFIR_063-082_ch05.indd 64 4/3/08 8:57:20 AM4/3/08 8:57:20 AM
65
Why Do Regulatory Accounting?
5
• They improve transparency (and help all parties understand the regulatory
authority’s information requirements and regulatory functions) and reduce
regulatory risk.
• They ensure that regulated companies report to the regulatory authority on a
timely, consistent, structured, and accurate basis.
A different presentation of data is not the only way cost accounting used by com-
panies differs from regulatory accounting, however. While facing some important
restrictions in assuming this exercise, regulators should also have the right to reject
some costs judged to be “imprudent” or “ineffi cient.” Costs should not be excluded
lightly, but the right to exclude them in some circumstances is a common element in
regulation. Therefore, in the defi nition of regulatory accounting, allocation of cost is
understood to mean the allocation of prudent and effi cient costs.
5.2. General presentation of information needs
This section introduces information needs in a general way by presenting the main
elements for defi ning that information. Chapter 6 details some key issues, such as
segmentation of activities, determination of the regulatory asset base and its depre-
ciation, and disclosure of information linked to related-party transactions.
Basically, regulators have to defi ne their information needs in terms of the
• perimeter of the information, such as the overall coverage of the regulated activi-
ties to be reported, separation of information on subactivities, and disclosure of
information on unregulated activities;
• content of the information, both fi nancial and nonfi nancial;
• format of the information, such as the classifi cation of accounts and appropriate
level of disaggregation; and
• periodicity of reporting, depending on the nature of the information and of the
operator’s obligations.
Regulators also have to defi ne their own allocation and valuation rules.
Perimeter of information
Regulators have to defi ne the perimeter of information they will need to verify
compliance with regulatory objectives. The perimeter of information includes most
data of the regulated companies, which are required to separate regulated activities
from unregulated activities. In addition, companies are usually required to segment
AFIR_063-082_ch05.indd 65AFIR_063-082_ch05.indd 65 4/3/08 8:57:20 AM4/3/08 8:57:20 AM

66
Accounting for Infrastructure Regulation: An Introduction
5
the regulated activities into subactivities, such as production, transport, and
distribution.
The allocation and segmentation of costs enables the regulator to check for
unfair cross-subsidization and undue discrimination (see chapter 6, on separation
of activities). The fi nancial data on unregulated activities need to be delivered to the
regulator to enable reconciliation with standard statutory accounts and to facilitate
the check for unfair cross-subsidization.
The regulator might not use only the fi nancial (accounting) information received
from the operator to determine tariffs. The regulator’s role is also to ensure that the
costs used to set up future tariffs are “effi cient” costs (see the discussion below).
The regulator requires nonfi nancial data related to the company’s regulated oper-
ations to monitor the operator’s effi ciency. Although treatment of the information
needs related to nonfi nancial data is beyond the scope of this chapter, several points
are worth mentioning here. First, the regulator needs to be able to match fi nancial
and nonfi nancial data on a common basis. Therefore, the cost and revenue separa-
tion imposed on the regulatory accounting has to be compatible with the disaggre-
gation of the nonfi nancial data (for example, number of employees and time devoted
to each activity). Second, in many cases nonfi nancial data will be useful in defi ning
and checking the criteria for allocations among activities. A common and consistent
framework for treating fi nancial data and nonfi nancial data is thus crucial.
Content of information
Regulators, to meet their objectives, have to specify the information to be provided
to them: fi nancial information (balance sheets, profi t and loss accounts, cash fl ow
statements, and so on) and nonfi nancial information (economic, environmental,
users’ consumption, technical indicators related to effi ciency and quality, and so
on). Specifying the content is a key requirement. Information reported by compa-
nies using standard statements does not allow the regulator to verify compliance
with regulatory objectives.
Format of information
Regulators must specify not only the content, but also the format of the fi nancial
and nonfi nancial information. For example, regulators need to defi ne the classifi ca-
AFIR_063-082_ch05.indd 66AFIR_063-082_ch05.indd 66 4/3/08 8:57:20 AM4/3/08 8:57:20 AM

67
Why Do Regulatory Accounting?
5
tion of accounts and the appropriate level of disaggregation of the chart of accounts
for all relevant fi nancial statements.5
Periodicity of reporting
Regulators have to specify the periodicity of information to be provided. The peri-
odicity is based on the nature of the information and of the operator’s obligations
(investments).
For general fi nancial information, annual or biannual periodicity might be
appropriate. But regulators may require shorter periodicity—often quarterly
reporting—for primary technical and effi ciency indicators (such as interrup-
tion of service) and for capital expenditures.6 For some critical variables,
monthly reporting may be required. The key issue is to detect effi ciency prob-
lems or failure of compliance with an investment obligation as early as possible.
For services that show a seasonal pattern (in demand or cost conditions), more
detailed information might be used for properly allocating costs (peak-load
pricing).
Service interruptions or effi ciency problems send negative signals about opera-
tion of the service. Their cause should be analyzed as soon as possible to rectify the
situation and to reduce any further occurrence. Failure to meet investment obliga-
tions or forecast capital expenditure is a more delicate situation. It may refl ect
changes in circumstances (such as slower-than-expected demand growth) or effi -
ciency improvements by the operator. If the company has no justifi cation for its
lack of investment, the regulator may act to “recuperate” the amount of unmet
investment obligation through reduced future tariffs (after interaction with the
operator and process of dispute and arbitrage if necessary).7 In practice, however,
this situation is complex to analyze and becomes even more so if handled a year
later because of the particular periodicity of reporting.
The regulator also needs to consider carefully the impact of such steps on incen-
tives. If the regulator penalizes the operator—deliberate unmotivated noncompli-
ance is rare—it will not encourage the operator to seek future effi ciency and cost
reductions relative to the original contractual investment plan. To avoid problems,
the operator will simply incur the forecast expenses instead.
Detecting and dealing with noncompliance as soon as possible is preferable to
avoid more diffi cult confl icts and legal procedures.
AFIR_063-082_ch05.indd 67AFIR_063-082_ch05.indd 67 4/3/08 8:57:21 AM4/3/08 8:57:21 AM
68
Accounting for Infrastructure Regulation: An Introduction
5
Allocation and valuation rules
Regulators usually defi ne general allocation and valuation principles such as the
following:
• Causality. Costs, revenues, and capital employed should be allocated to the
activities (services offered or user category served by the regulated company)
that incur the costs or revenues.
• Objectivity. Allocation and valuation methodologies should be designed on an
objective basis and not in a way that unfairly benefi ts the regulated company or
any other party.
• Consistency. Allocation criteria should remain the same over time, to the extent
that is feasible and reasonable.
• Transparency. Allocation methodologies should be clear, and the various included
parts of the costs should be clearly differentiated from one another.
The spirit of these principles is similar to that underlying the generally accepted
accounting principles (GAAP) for statutory accounts and the principles used as
cost allocation guidelines in cost accounting, though GAAP do not strictly apply to
cost analysis (see chapter 3) and regulatory accounting requirements can differ
from GAAP.
The principles and rules for valuation methodologies will usually be detailed.
Valuation of assets is central to regulation, because one of the main cost elements
that will determine the revenues allowed to the operator is the authorized return on
these assets. (Valuation methodologies are detailed in chapter 6.)
5.3. Limitations of traditional and management accounting of the regulated company
The information provided by traditional fi nancial accounting does not meet the
needs of regulators for two primary reasons. First, costs cannot be separated by reg-
ulated and unregulated activities. Second, regulators need historical data to forecast
costs and revenues for future tariff setting.8
Moreover, if regulators rely only on statutory fi nancial statements, they will have
only very limited ability to compare operators because of the heterogeneity of
information reporting.
AFIR_063-082_ch05.indd 68AFIR_063-082_ch05.indd 68 4/3/08 8:57:21 AM4/3/08 8:57:21 AM

69
Why Do Regulatory Accounting?
5
Can regulators use the information provided by management accounting and
implemented by the company? The answer is not obvious, because of several
limitations:
• The cost and managerial accounting system was put in place to meet the specifi c
objectives of the company’s managers. Regulators do not have the same objec-
tives. Thus the specifi c needs of the regulator and a cost accounting plan will
have to be defi ned in accordance with these objectives.
• The information in a cost and managerial accounting system is usually considered
internal “confi dential” information. Thus information exchange procedures and
mechanisms will have to be implemented within a legal regulatory framework.
• No standards relating to management accounting exist. For example, in the case of
cost analysis and allocation, methodologies might differ from one company to
another. Thus, for the regulator to monitor several regulated companies in the
same sector and to compare the costs of their services, the companies’ cost account-
ing plans would have to be mutually defi ned in accordance with these objectives.
5.4. Consistency between statutory accounts and regulatory accounts
The specifi c needs of regulators and their various objectives will require elabora-
tion of specifi c regulatory accounting statements, which are defi ned further in
chapters 6 and 7. This section lays out some principles about these statements and
how they relate to statutory accounts. Regulatory accounting statements
• are additional to any statutory fi nancial reporting obligations of the companies
under the general accounting law;
• must be prepared on the basis of GAAP, unless explicitly specifi ed;
• are based on the same source of information as statutory accounts statements
(regulatory accounting statements should always be reconciled with statutory
accounts statements); and
• will follow regulatory accounting guidelines over accounting standards wher-
ever the two confl ict (see chapter 6).9
It must be emphasized that regulators rely on the same sources of information
as managers and use data derived from the same information systems. Regulators
AFIR_063-082_ch05.indd 69AFIR_063-082_ch05.indd 69 4/3/08 8:57:21 AM4/3/08 8:57:21 AM

70
Accounting for Infrastructure Regulation: An Introduction
5
must ensure that their needs are specifi ed well in advance so that the cost account-
ing plan and the data recording processes can be defi ned to follow their informa-
tion requirements.
5.5. Regulators’ behavior and principles to follow
Regulators have to balance the interests of various groups—government, operator,
and users—to meet the goal of the public interest. The tension among these inter-
ests can be overstated. It is not in consumers’ interest, for example, for prices to be
below effi cient costs, including a commercial rate of return. But day-to-day ten-
sions are part of the regulatory process. Companies will be concerned to ensure that
the regulator does not squeeze profi ts too much or interfere in the running of the
business. Customers may have strong expectations that the regulator will squeeze
out any cost padding or unfair prices sooner rather than later.
The two extreme positions that a regulator could adopt when monitoring a reg-
ulated operator are ignorance and interference.
Ignorance
Ignorance can arise from various situations:
• The operator delivers no information, whether because of shortcomings in the
legal framework or the contract, or because the regulator is not suffi ciently active
in enforcing it.
• The regulator does not use the information provided by the operator appropri-
ately (no rigorous and systematic analytical work).
• The regulator relies too much on the incentive properties of the regulations
adopted and is less concerned with price structures or anticompetitive
behavior.
Because of the lack of information, the regulator will be unable to verify that the
regulatory objectives of sustainability, allocative and productive effi ciency, and
equity (distributive effi ciency) are achieved. Whatever the causes, the government
and the regulator should remedy the situation through dialogue with the operator,
new decrees or laws addressing the issue, sanctions, or other means.
AFIR_063-082_ch05.indd 70AFIR_063-082_ch05.indd 70 4/3/08 8:57:21 AM4/3/08 8:57:21 AM

71
Why Do Regulatory Accounting?
5
Interference
Interference or micromanagement refers to regulators’ constant questioning of
managers’ decisions. When regulators behave as though they were part of the com-
pany’s management, accountabilities are confused and incentives are poor. Such
action is detrimental to the interests of all stakeholders. Furthermore, it can under-
cut the government’s policy objectives and intentions for sector reform, because the
decision to turn a public utility over to private sector management (management
contract, concession) or control (privatization) to improve effi ciency and services
is being undermined.
Risks
Both ignorance and interference involve risk. The main risk of ignorance is that
objectives are not met because of the impossibility of verifying compliance with
regulatory objectives. This situation puts the public interest in danger.10 The main
risk of interference is the abuse of regulatory powers and overregulation. By increas-
ing perceived risk in the name of effi ciency, interference results in a higher cost of
capital required by the operators and, probably, in greater ineffi ciency.
The regulator has to adopt a responsible position between these two attitudes.
Although it appears obvious that a regulator should neither ignore information nor
interfere constantly in management of the regulated operator, experience shows
that this balance is diffi cult to achieve. Initially there may be a need to improve
information systems, but the tendency to demand more detailed and complex
information is strong. Regulators also have to be realistic and adapt their regulatory
work to their capacity and competence.
5.6. Using accounting costs in tariff determination
The relationship between an operator’s accounting costs and the operator’s tariffs
depends to a large extent on the regulatory regime and the specifi c rules of each ser-
vice. As long as the regulator has a duty toward the economic and fi nancial sustain-
ability of the regulated fi rm, the operator’s costs will be an important element to take
into account in a tariff determination. Nevertheless, accounting costs do not neces-
sarily go directly into the determination of tariffs. As much as possible, the rules and
AFIR_063-082_ch05.indd 71AFIR_063-082_ch05.indd 71 4/3/08 8:57:21 AM4/3/08 8:57:21 AM

72
Accounting for Infrastructure Regulation: An Introduction
5
criteria to be used by a regulator in reviewing accounting costs should be carefully
spelled out in advance. Some general principles, such as a presumption of prudent
management, realism, and materiality (discussed below), should guide the regulator.
A well-defi ned sanction still entails risks for the operator; these risks should be fac-
tored into the overall regulatory framework and the rewards provided.
Figure 5.1 summarizes a standard process to reach the optimal tariff determination.
Excluding costs
As mentioned in the discussion of the perimeter of information, the original
accounting data provided to the regulator by the operator should not necessarily be
used as they are for tariff determination (even when correctly allocated). Regulators
not only have the right to audit the data (see discussion below), but can exclude
some lines of costs or approve only partially incurred expenses. One of the main
roles of the regulator is to ensure that companies have an incentive to operate as
effi ciently as they would in a competitive environment. Ineffi cient costs should not
be recovered from customers through tariffs. The sanction of some ineffi cient
costs—even excluding them completely—can be part of the incentive regime and
has parallels with outcomes in unregulated markets.
To avoid unnecessary and ineffi cient increases in the risks perceived by investors,
these cost exclusions should adhere to clear and predictable rules.
The regulator might decide to exclude ineffi ciently incurred costs in full or in
part.11 Full lines of costs (specifi c cost items) may be excluded, because they are not
considered useful (within a reasonable planning horizon for delivering the regu-
lated service). Even if the cost is conceptually related to the delivery of the regulated
service, regulators may partially exclude incurred expenses where they are shown to
be clearly ineffi cient. Regulators want to avoid the risk that the regulated companies
incurred expenses at a cost higher than their market value.
If the regulator decides to exclude what are considered ineffi cient costs, regulated
operators want to know the legal grounds for this action. In the United States the
basic authority for a regulatory agency insisting on prudent costs (including invest-
ments) relies on the “just and reasonable” standard. If common regulatory law pro-
tects consumers with the statement that “just and reasonable” tariffs have to be
charged, imprudent expenditures are inconsistent with that law, and no further
notice is then required under applicable law. This statement is quite powerful when
considering the legal status of regulatory methodology. Chapter 7 revisits it in
examining the need to legitimize the regulatory methodology.
AFIR_063-082_ch05.indd 72AFIR_063-082_ch05.indd 72 4/3/08 8:57:21 AM4/3/08 8:57:21 AM

73
Why Do Regulatory Accounting?
5
Figure 5.1. Average tariff determination process
Source: Authors.
1. Input: All capital expenditures and operating
expenditures accounting data
Action: Separate regulated and unregulated activities
Basis: Service characteristics,
competitive environment, regulatory policy
2. Input: Capital expenditures and operating expenditures
accounting data related to regulated activities
Action: Allocate expenditures to regulated subactivities
Basis: Cost allocation principles and methodology predefined
3. Input: Capital expenditures and operating expenditures
data related to regulated subactivities
Action: Exclude inefficient costs
4. Output: Average tariff determination
Basis: Objective assessment; allegation supported
by evidence; dialogue with operator; clear, transparent, and fair rules of decision and arbitrage
AFIR_063-082_ch05.indd 73AFIR_063-082_ch05.indd 73 4/3/08 8:57:21 AM4/3/08 8:57:21 AM

74
Accounting for Infrastructure Regulation: An Introduction
5
Full exclusion of cost itemsThis section examines the possible full exclusion of some costs incurred for regu-
lated activities. All costs related to unregulated activities should already have been
excluded, as detailed in chapter 3.12
From an economic perspective, only expenses useful for delivering the regulated
service should be recovered through tariff charges to the users of the regulated ser-
vice. Typically, regulators might exclude ex ante lines of costs such as sponsorships,
lobbying expenses, donations, or some advertising costs not considered useful for
delivering the regulated service.13 In a 2000 price review of electricity distribution,
the Offi ce of the Regulator-General, Victoria, Australia, excluded all advertising and
marketing costs related to campaigns that do not specifi cally include customers’
information or incentives to use energy more effi ciently.
A more sensitive issue relates to management fees or related-party transactions.
The regulated operator pays these fees to companies belonging to the same group
for specifi c services (legal, fi nancial, technical, marketing). The rationale for the
provision of these services is that operators often belong to large international
groups. They consider it more effi cient to purchase specifi c services (services requir-
ing expertise that cannot be found within the operator’s company) from the mother
company or another company within the group than from an outside company.
Because of the size of these management fees (in some cases as high as 3 percent of
revenue), some regulators argue that they should be assimilated to return on capital
or should be limited in time. Regarding the latter treatment, the argument is that
the operator should organize a proper transfer of knowledge to the local regulated
operator. This means that, in time, the operator should lower its reliance on the
mother company’s expertise, progressively reducing payments to the mother com-
pany. The regulatory position varies from country to country and even from sector
to sector. Chapter 6 presents more detail on this cost item and related issues. As a
general rule, regulators should
• have a clear and public position on management fees,
• review in detail the nature of the services performed under management fee
arrangements, and
• assess the rationale for these arrangements in view of the characteristics of the
local company and its environment.
Marginal and incremental costs are not historical costs. Rather, they are esti-
mates of the future cost of the service. Therefore, estimating them involves esti-
mating future demand for the good or service in question, future capital costs
AFIR_063-082_ch05.indd 74AFIR_063-082_ch05.indd 74 4/3/08 8:57:21 AM4/3/08 8:57:21 AM

75
Why Do Regulatory Accounting?
5
of production facilities, future costs of raw materials and energy, and so on. In that
sense, their estimation can be complex.
Partial exclusion of incurred expensesThe partial exclusion of incurred expenses relates to the delicate issue of “excessive”
expenses. In a competitive environment a company operating under ineffi cient
management would produce or deliver goods or services at a cost that would put it
out of business very quickly because of the presence of competitors operating more
effi ciently. The objective of regulation is to simulate the positive effects of a com-
petitive environment, so that the benefi ts of effi ciency can be passed on to users
through lower tariffs. This objective is enforced through the level of costs that will
be allowed by the regulator for tariff determination. The regulator excludes all
excessive costs such as excessive capital expenditures, excessive salaries, excessive
costs of energy or water purchases, and so on.
Excessive expenses result from poor management. More specifi cally, they arise
from
• “gold-plating” behavior, or investing in the most expensive equipment or pro-
ducing the most expensive service regardless of the need or effi ciency of the
operation to maximize returns without diminishing sales;
• lack of good technical analysis; or
• lack of appropriate organizational procedures.
The issue of excessive costs is complex. Consider the case of excessive costs of
energy or water purchases by a distribution company in the utilities sector. Exces-
sive costs can arise through failure to optimize purchasing contracts or through use
of expensive energy without consideration for cheaper alternatives. These problems
can occur because of bad management or because of poorly designed cost pass-
through mechanisms or indexation formulas that can undercut the incentive for
replacing some costly energy sources with lower-cost alternatives.14
In many countries, however, the price of energy and other inputs bought by a
distribution company could be excessive not because of a nonoptimized contract
or failure to consider alternative sources, but because of the lack of competition
upstream. A regulator who compares prices with those in other regions or coun-
tries and excludes a percentage of incurred expenses on that basis could be making
the wrong decision. The excessive price is exogenous to a cost-minimizing regu-
lated fi rm. In this situation, the regulator might need help from other agencies (for
instance, competition agencies) before deciding whether a cost is imprudent.
AFIR_063-082_ch05.indd 75AFIR_063-082_ch05.indd 75 4/3/08 8:57:22 AM4/3/08 8:57:22 AM

76
Accounting for Infrastructure Regulation: An Introduction
5
The principles, process, and methodology that the regulator uses to decide to
exclude some ineffi cient costs should be clearly established and made public before
the license to operate the regulated company is awarded. The regulator cannot
exclude ineffi cient costs as a discretionary exercise.
A few criteria and guidelines
Regulators should take into account several criteria and guidelines when assessing
an operator’s data to verify compliance with the operator’s obligations and opera-
tion under effi cient management.
Presumption of prudent managementThe regulator’s work should not interfere with day-to-day management of the fi rm.
For example, the regular review of capital expenditures should not lead to constant
second-guessing of management decisions. The regulator should avoid overregula-
tion and micromanagement, which create excessive risks and uncertainty that can
deter investment. It should always express its doubts on the basis of rational and
quantifi ed information. In the United States there is a legal presumption in favor of
utility management.15 The burden of proof lies with the regulator or the party chal-
lenging management decisions. In countries with no explicit legal texts or jurispru-
dence, this issue is a sensitive one, especially given the problem of asymmetric
information and the absence of proper release of information. How can the burden
of proof lie with a party (the regulator) that lacks access to detailed information
regarding the decision it challenges?
RealismThe fi nancial situation of the operator should be taken into account. Even if moti-
vated, disallowance of costs might be limited to maintaining the operator’s solvency
and investment capacity, thereby avoiding the greater damage to ratepayers that
would result from the operator’s insolvency and bankruptcy. The regulator should
ensure that the operator implements appropriate management systems and con-
trols to avoid imprudent costs in the future.
MaterialityRegulators have to restrict their analysis to signifi cant amounts that affect tariffs,
because they have limited capacity for intervention and analysis.
AFIR_063-082_ch05.indd 76AFIR_063-082_ch05.indd 76 4/3/08 8:57:22 AM4/3/08 8:57:22 AM

77
Why Do Regulatory Accounting?
5
Objective assessment: Findings of mismanagementRegulators should base their conclusions on objective and quantitative analysis.
Avoidable costs should be estimated on a rational basis. An allegation of manage-
ment imprudence should be supported by evidence.
Assessment of management decisions should always be performed on the basis
of the specifi c context in which the decisions were taken: under the same circum-
stances, would reasonable managers have incurred the same expenses?
Regulators should use a comparative and benchmarking approach to make their
point. They could look at medians of other local comparative businesses or, if such
data are not available, at comparable businesses in the region. They should compare
cost percentages, tariffs, and similar data, always taking into account local and regional
differences (initial state of assets, specifi c geographical conditions, and the like).
Regulators can use historical information for evidence of abnormal expenses by
comparing cost budgets with real expenses and asking for explanations of differ-
ences (overbudgets).
The detailed organizational fl owchart of the company is a good source of infor-
mation. It can help regulators understand the chain of control for expenses and
check that proper management control and processes are in place (methodologies
in project management, construction, quality assurance, and quality control).
In measuring effi ciency, regulators can compare operators’ performances in
many ways. The main methods are
• price-based index numbers for measuring productivity as a ratio of output and
input price index;
• stochastic frontier analysis, an econometric method that estimates a production
or cost frontier; and
• data envelopment analysis, a linear programming method that constructs a non-
parametric production frontier.16
5.7. Regulatory accounting and auditing of regulated companies
Regulatory accounting often requires assurances that information provided by reg-
ulated companies is accurate. Requests for such assurances should be proportionate
to the problem to be addressed and the resources involved. If the regulator plans to
rely heavily on the reported information, some verifi cation of the data may be
AFIR_063-082_ch05.indd 77AFIR_063-082_ch05.indd 77 4/3/08 8:57:22 AM4/3/08 8:57:22 AM

78
Accounting for Infrastructure Regulation: An Introduction
5
required. The regulator is unlikely to have the resources or the access to the data
systems for this verifi cation.
Specifying auditing requirements involves decisions about
• auditor eligibility,
• the process for appointing the auditor,
• the auditor’s duty of care,
• the audit standard,
• the pro forma of the audit report, and
• the consequences of a qualifi ed audit report.
Eligibility to be the auditor
Because the regulatory audit shares many tasks with the statutory audit, allowing
the statutory auditor to be the regulatory auditor may avoid duplication and reduce
costs. Often, however, this strategy may confl ict with the desire to ensure a higher
level of independence. A typical requirement is that the auditor possess recognized
audit qualifi cations; some regulators have added further requirements, such as that
the audit team be led by a partner or principal of an audit fi rm. Despite scepticism
borne of recent audit experience, regulators should recognize that risks to profes-
sional standards and reputation do discipline auditors.
Process for appointing the auditor
Once the eligibility criteria have been set, the regulator need not be involved in
selection of the auditor. In practice, however, regulators have often established
requirements for the selection of auditors. For example, approval of the regulator
may be required before the auditor is appointed, or the operator may be required to
select the auditor from a panel determined by the regulator.
Duty of care of the auditor
In a normal audit, the auditor’s duty of care is to the board of directors. This duty
refl ects the role of the board as representatives of the shareholders and the role of
the audit in ensuring that the shareholders’ interests are preserved. In contrast, the
regulatory audit serves a different function, and regulatory accounts routinely
specify that the auditor owes a duty of care to both the operator’s board and the
regulator, or that the primary duty of care is to the regulator. A joint accountability
AFIR_063-082_ch05.indd 78AFIR_063-082_ch05.indd 78 4/3/08 8:57:22 AM4/3/08 8:57:22 AM

79
Why Do Regulatory Accounting?
5
may be formalized through a tripartite agreement of the auditor, the operator, and
the regulator.
Audit standard
Various levels of assurance can be provided (see fi gure 5.2). The highest level of
assurance is provided by a normal audit; this level of assurance is the one specifi ed
in most cases. But a lower level of assurance can be specifi ed when it provides a more
appropriate balance between the costs of the process and the needs of the regulator.
In a normal business audit, a matter is material if it is likely to prejudice the
understanding of an entity’s fi nancial position—that is, when the matter is not
consistent with a “true and fair view” of the entity as a whole. The regulator has a
somewhat different concern and requires assurance that the regulatory accounts
present a true and fair view of the regulated component of the entity or of the related
parties. This concern has led to modifi cation of the standard of materiality. Whether
the regulated activity is the major activity of the entity is an immaterial matter,
because the regulated activity may have a material effect on reporting of the unreg-
ulated activities. For this reason, some regulators have established additional
Figure 5.2. International Federation of Accountants framework for auditing and related services
Source: www.pwcglobal.com.
CompilationAgreed-on procedures
ReviewAudit
Auditing Related services
Nature of service
No assurance
No assurance
Moderate assurance
High, but not absolute, assurance
Comparative level of assurance provided by the auditor
Identification of information
compiled
Factual findings of procedures
Negative assurance on assertion(s)
Positive assurance on assertion(s)
Report provided
AFIR_063-082_ch05.indd 79AFIR_063-082_ch05.indd 79 4/3/08 8:57:22 AM4/3/08 8:57:22 AM

80
Accounting for Infrastructure Regulation: An Introduction
5
requirements. The Queensland Competition Authority, for example, specifi es that
a matter is material if it results in an inappropriate allocation of costs between regu-
lated activities and unregulated activities.
Pro forma of the audit report
Regulators have commonly provided pro formas (templates) of the audit report
and directors’ responsibility statement. The pro forma reports have been modeled
on standard corporate pro forma reports and adjusted for any differences in the
level of audit and materiality tests.
Consequence of a qualifi ed audit report
The audit requirements should specify the steps to be followed in the event of a
qualifi ed audit report. No formal response is needed. The regulator may simply
accept the qualifi ed audit. More likely, it will specify some capacity, including (in
ascending order) capacity to
• request further changes,
• direct the nature of the changes to be made, and
• appoint a new auditor or request the utility to engage a new auditor.
Additional reading and resources
Arizu, Beatriz, Luiz Maurer, and Bernard Tenenbaum. 2004. “Pass Through of Power Purchase
Costs: Regulatory Challenges and International Practices.” Energy and Mining Sector Board Dis-
cussion Paper 10, Energy and Mining Sector Board, World Bank, Washington, DC.
Estache, A., and P. Burns. 1998. “Information, Accounting, and Regulation of Concessioned
Infrastructure Monopolies.” Policy Research Working Paper 2034, World Bank, Washington, DC.
Goodman, L.S. 1998. The Process of Ratemaking. Vienna, VA: Public Utilities Reports, Inc.
Green, R. J., and M. Rodriguez Pardina. 1999. Resetting Price Controls for Privatized Utilities: A
Manual for Regulators. Washington, DC: Economic Development Institute of the World Bank.
Ofgem (Offi ce of Gas and Electricity Markets). 2001. “The Role of Regulatory Accounts in
Regulated Industries.” London.
AFIR_063-082_ch05.indd 80AFIR_063-082_ch05.indd 80 4/3/08 8:57:22 AM4/3/08 8:57:22 AM

81
Why Do Regulatory Accounting?
5
Notes
1. For more detail on this fundamental issue, refer to annex 2 on regulatory modeling and to
the World Bank Institute’s CD-ROM “Financial Modeling of Regulatory Policy: Introduction to
Theory and Practice” (World Bank 2002).
2. Regulators also use the information to defi ne quality standards, assess the fi nancial health
of the company, evaluate the relative effi ciency of the company, and so on.
3. Prices must be set at an affordable level. Users’ capacity to pay is an important factor to con-
sider in regulatory policy.
4. This behavior could take the form, for example, of subsidizing international calls by national
calls.
5. For accuracy and clarity, regulators usually provide electronic spreadsheets with preformat-
ted tables to be fi lled in (see chapter 6).
6. For a list of indicators, see annex 5.
7. See chapter 7 for details on information exchange mechanisms.
8. Such data are needed unless the regulator uses either a rate of return on the rate-base
approach, an historic test year, or a high-powered incentive approach that fully unlinks the regu-
lated price path from the actual costs of the utility.
9. Statutory accounts have to comply in full with all accounting standards.
10. See Estache, Wodon, and Foster (2002) for practical guidelines and methods to help policy
makers, reformers, and regulators develop diagnoses and strategies to meet policy objectives.
11. In the United States the concept of honest, economic, and effi cient management is used in
regulatory decisions. The phrase “honest, economic, and effi cient management” made its initial
appearance in a rule of ratemaking of the Emergency Railroad Transportation Act of 1933.
12. If, in some cases, regulators allow costs distortions (cross-subsidies) for specifi c political,
social, and economic reasons, they should precisely quantify and preapprove the distortions as
well as make them fully transparent.
13. Of course, the company can incur these expenses. They simply will not be taken into
account in tariff determination.
14. Arizu, Maurer, and Tenenbaum (2004) discuss the options for passing through energy
purchase costs when wholesale markets are competitive but retail prices remain controlled, high-
lighting the diffi culties.
15. Several court decisions specify this presumption. For more detail, see Goodman 1998, 860.
16. Explaining these methods goes beyond the scope of this volume. Interested readers should
refer to Coelli and others (2003).
AFIR_063-082_ch05.indd 81AFIR_063-082_ch05.indd 81 4/3/08 8:57:22 AM4/3/08 8:57:22 AM

AFIR_063-082_ch05.indd 82AFIR_063-082_ch05.indd 82 4/3/08 8:57:22 AM4/3/08 8:57:22 AM

83
Chapter 6
This chapter further develops the core issues in regulatory accounting:
• separation of activities,• regulatory asset base determination (concept and valuation and
depreciation),• depreciation policies of the regulatory asset base, and• related-party transactions and transfer pricing.
Separation of the activities of regulated operators into regulated activities and unregulated activities is the core motivation of regulatory accounting. Such separation is essential for facilitating control of regulatory objectives. This chapter shows how each regulatory alternative—single till regulation, separation of companies, and accounting separation of activities within a company—has different implications for information requirements. The chapter also shows how the concepts of cost accounting and cost classifi ca-tion introduced in chapter 4 are used in regulatory accounting.
Valuation of the regulatory asset base and specifi cation of depreciation profi les are also critical tasks of the regulator. Defi nition of the regulatory asset base is related to the regulatory perimeter, a concept introduced in chapter 5. This chapter explains how the valuation and depreciation options of the regulatory asset base are at the core of tariff determina-tion, and how regulatory options could diverge from what is implement-ed in standard statutory accounts.
Chapter 5 examined the issue of management fees. This chapter reviews the more general context of related-party transactions and transfer pricing, which regulators need to identify clearly. These topics are central to regulatory objectives, and they present particularities that call for accounting treatments that differ substantially from management and statutory accounting treatments.
Core Issues in Regulatory Accounting
AFIR_083-110_ch06.indd 83AFIR_083-110_ch06.indd 83 4/3/08 8:58:58 AM4/3/08 8:58:58 AM

84
Accounting for Infrastructure Regulation: An Introduction
6
For most topics, regulators can choose from a wide range of alternatives, depending on the characteristics of the sector, the legal framework, and the weight given to various regulatory objectives, among other factors. These alternatives are to a large extent interdependent. Therefore, the need for consistency among the options chosen for each topic is great.
Consistency must be maintained over time as well. Adherence to the same criteria from year to year helps to reduce uncertainty and perceived risk among investors.
6.1. Separation of activities
As a result of technology change in many infrastructure sectors and restructuring
to introduce competition, regulated activities and unregulated activities coexist in
most companies. The regulatory treatment applied in this situation is particularly
important.
Treatment of unregulated activities should be framed to meet general regulatory
objectives, particularly preserving incentives for productive effi ciency, avoiding dis-
tortions in competitive markets, and ensuring that users benefi t from effi ciency gains.
Before analyzing the alternatives for addressing unregulated activities, regulators will
need to identify different types of activities and situations to develop a more complete
framework for their analysis. Different criteria may be used for this analysis:
• Unregulated activities could be separated according to whether or not they use
assets of the regulated service.
• Unregulated activities could be separated according to whether their markets are
competitive or separately regulated monopolistic activities.
• Activities could be separated on the basis of the degree of vertical integration of
the unregulated activity with the regulated activity and the extent to which that
integration is part of the industry’s value chain.
The fi rst distinction, between unregulated activities that use the assets of the
regulated service and those that do not, is crucial to the productive effi ciency objec-
tive. In general, the performance of unregulated activities using assets of the regu-
lated activity assumes the existence of some degree of economies of scope. A typical
example is an electricity distribution company’s use of the electric company’s poles
to lay down television cables. Using the poles as a common asset is more effi cient
than employing two separate sets of poles.
AFIR_083-110_ch06.indd 84AFIR_083-110_ch06.indd 84 4/3/08 8:58:58 AM4/3/08 8:58:58 AM

85
Core Issues in Regulatory Accounting
6
Economies of scope imply that the joint production cost of regulated activities and
unregulated activities is lower than the sum of the costs of both activities performed
separately. When this is the case, development of the unregulated activity by the regu-
lated operator increases effi ciency; hence, a net welfare loss would result if the regulated
operator were banned from carrying out the unregulated activity. The problem is to
clearly determine how greater effi ciency in the use of assets will be shared by the opera-
tor and the users (who pay for it in the long run through regulated service tariffs).
Now consider the second distinction, wherein unregulated activities are sepa-
rated according to whether their markets are competitive. If the unregulated
activity develops in a competitive market, the operator has strong incentives to
distort the allocation of costs, increasing them for the regulated activity and
reducing them for the activity in the competitive market. In this way, the operator
recovers costs through the regulated tariffs and improves its position in the com-
petitive market, obtaining extraordinary gains. An electricity transmission com-
pany using its system to lay down fi ber-optic cables and enter the telecommuni-
cations business is an example of a regulated utility entering a competitive market.
This move not only affects the regulated activity, but may also distort the com-
petitive market, because a bad allocation of common costs might bestow an
unfair competitive advantage on a service provider that can recover part of its
costs in a captive market.1 If the regulated activity is carried out in another regu-
lated market, no such incentive exists.
Finally, consider the third distinction: the degree to which the unregulated activ-
ity is vertically integrated with the regulated activity. If the unregulated activity is
vertically integrated with the regulated activity, the fi rm has greater incentives to
infl uence the unregulated market by manipulating the regulated activity. An air-
port operator’s ownership of substantial interest in an airline is an example of verti-
cal integration of a regulated activity into a competitive sector.
Such integration gives rise to the regulatory access problem: what to do when a reg-
ulated company is to provide a service—access—to its competitors in an unregulated
market. The tariff criteria for the essential facility (the one competitors need as an
input to provide the service) are crucial to avoid distortions in the competitive market
and to achieve the regulatory objectives of sustainability and allocative effi ciency.
When both activities are not part of the same value chain, as in the electricity
and telecommunications example, the problem is less serious, because competitors
are not also customers of the regulated operator. However, the incentives of the
regulated operator to allocate more costs to the regulated activity in order to
improve its competitiveness in the unregulated market remain.
AFIR_083-110_ch06.indd 85AFIR_083-110_ch06.indd 85 4/3/08 8:58:59 AM4/3/08 8:58:59 AM

86
Accounting for Infrastructure Regulation: An Introduction
6
Regulatory alternatives
This section deals with the alternatives that can be used with regulated operators in
treating unregulated activities. It covers the alternatives’ advantages and disadvan-
tages in terms of the regulatory objectives mentioned above.
Single till regulationSingle till regulation assumes that all revenue from unregulated activities is consid-
ered on the revenue account of the regulated activity. In many cases, because of
inadequate information, the costs of the unregulated activity are assumed to equal
its revenue, and that consequently separating unregulated activities for regulatory
purposes is unnecessary.
This approach was proposed for regulating airports in the United Kingdom. All
revenue arising from unregulated activities within the airport, such as shops and
restaurants, would be taken into account in estimating the revenue requirements of
the regulated activity.
The main advantage of this approach is its simplicity. Only information on the
total revenue and costs of all activities is required. Separation of regulated activities
and unregulated activities is unnecessary.
The drawbacks of this approach, though, clearly exceed the advantage of sim-
plicity. First, the approach clearly goes against the objective of productive effi ciency,
because it takes away any incentive for the operator to develop unregulated activi-
ties under the concession. As long as all of the additional revenue from unregulated
activities results in a reduction of regulated revenue, the company has no incentive
to generate revenue.
Second, this alternative results in extremely unattractive incentives for allocative
effi ciency. In the airport example, the revenue from unregulated activities increases
with the degree of congestion of terminals, driving down the regulated tariffs for
the terminals’ use. This phenomenon sends the wrong signals for effi cient alloca-
tion of resources.
Separation of companiesAn alternative is to require that regulated activities and unregulated activities be
developed by different legal entities. This separation can take two forms.
The less strict form of separation requires that the unregulated activities are per-
formed by a separate legal entity but does not prohibit common ownership. Thus a
regulated operator or its shareholders can own a subsidiary company performing
unregulated activities.
AFIR_083-110_ch06.indd 86AFIR_083-110_ch06.indd 86 4/3/08 8:58:59 AM4/3/08 8:58:59 AM

87
Core Issues in Regulatory Accounting
6
The stricter form of separation imposes restrictions on cross-ownership of regu-
lated activities and unregulated activities. The regulated company, and in some
cases even its shareholders, cannot own companies that render services or sell prod-
ucts in unregulated activities. Under this stricter form of the approach, the problem
of unregulated activities disappears for the regulator—but at the cost of preventing
the company and its shareholders (and indirectly its customers) from taking advan-
tage of potential economies of scope between activities. In summary, the regulatory
load is minimized at the expense of the company’s productive effi ciency.
Separation of activities and accountingThe two alternatives discussed above are extreme cases that either ignore or prohibit
unregulated activities within the regulated company. In general, these alternatives
are not effi cient, and most countries decide instead to demand separate accounting
of regulated activities and unregulated activities. This separate information becomes
the basic input for regulatory allocation and determination of the operator’s revenue
requirement. This input can be supported by “behavioral requirements,” such as
limits on sharing of information between regulated entities and nonregulated enti-
ties and provision of information to customers. Box 6.1 provides an example of an
approach that combines various ring-fencing requirements.
The next section deals with some of the key elements needed to create a basic
framework of information for regulatory accounting and the regulatory alterna-
tives for use of that information.
Accounting separation of activities
Accounting separation of regulated activities and unregulated activities appears
to be the most common alternative used by regulators to treat unregulated activi-
ties. This alternative requires a cost accounting system, as defi ned in chapter 3,
but one adapted to the regulator’s needs, as explained in chapters 4 and 5. The
regulator will need to specify segmentation of activities (functions) and to specify
classifi cation and segmentation of costs (to assess the effi ciency level of particular
lines of costs).
Using the concepts of cost classifi cations presented in chapter 3, costs could be
separated, from a regulatory point of view, in several ways. They could be
• divided into operation costs and maintenance costs,
• categorized by function (for example, in the case of a vertically integrated elec-
tricity company, by generation, transmission, distribution, and supply),
AFIR_083-110_ch06.indd 87AFIR_083-110_ch06.indd 87 4/3/08 8:58:59 AM4/3/08 8:58:59 AM

88
Accounting for Infrastructure Regulation: An Introduction
6
Box 6.1. Treatment of unregulated activities in New South Wales, Australia
The Australian National Electricity Code requires regional regulators to develop guidelines for ring fencing (separating regulated activities from unregulated activities). The Independent Pricing and Regulatory Tribunal (IPART) has developed various proposals for these guidelines, as have other regional and national regulatory authorities, such as the Australian Competition and Consumer Commission.
IPART defi nes ring fencing as “the clear separation of subsidiaries or divi-sions of a company that may be viewed as having competitive advantages in their dealings with each other.” IPART believes that such separation will help the regulator identify the true nature and provision costs of the activities that need to be regulated (because they constitute natural monopolies).
Some of the guidelines suggested by IPART are the following:
• Legally separate the entity through which a network service pro-vider provides network services from any other entity through which it conducts business.
• Establish and maintain consolidated and separate accounts for prescribed services and other services provided by (1) the trans-mission network service provider and (2) the distribution net-work service provider.
• Allocate costs between prescribed services and other services provided by the transmission network service provider and between prescribed distribution services and other services provided by the distribution network service provider.
• Limit the fl ow of information between the network service pro-vider and any other person.
• Where the potential for a competitive disadvantage exists, limit the fl ow of information between the parts of the network ser-vice provider’s business that provide prescribed services and the parts of the network that provide any other services, and between the parts of the network service provider’s business that provide prescribed distribution services and the parts that provide any other services.
Source: Authors.
AFIR_083-110_ch06.indd 88AFIR_083-110_ch06.indd 88 4/3/08 8:58:59 AM4/3/08 8:58:59 AM

89
Core Issues in Regulatory Accounting
6
• divided into controllable costs and uncontrollable costs (some regulatory
schemes focus incentives on controllable costs and adopt pass-through mecha-
nisms for uncontrollable costs), or
• divided into central costs (for example, head offi ce) costs and functional costs.
Regulators usually require clear identifi cation of other specifi c lines of costs, such
as regulatory fees (fees paid to the regulatory authority), concession fees (if any), and
management fees (all related-party transactions above a certain amount).
Energy purchases are of specifi c interest to the regulator, particularly when cost
pass-through mechanisms or inappropriately designed indexation formulas under-
cut incentives to replace costly energy sources with lower-cost alternatives.
Table 6.1 presents an example of the classifi cation of an electricity operator’s
operating costs. These costs are divided into functional costs and central costs.
Items in boldface represent typical uncontrollable costs that should be aggregated
to allow an analysis of controllable costs and uncontrollable costs as well as an anal-
ysis of total operating costs.
This example assumes that the company is involved in two regulated activities
(electricity transmission and distribution) and two unregulated activities (electric-
ity generation and trading). The fi rst separation requires identifi cation of the direct
(or functional) costs of each phase. In general, these costs are relatively easy to iden-
tify, because they are directly incurred in development of the activity. With respect
Table 6.1. Classifi cation of costs for an electricity operator
Unregulated activities Regulated activities
Generation Trading Transmission Distribution Total
Functional costs
Personnel
Goods and materials
Contracted services
Lubricants
Fuels
Total functional costs
Central costs
Management
Trading
Source: Authors.
AFIR_083-110_ch06.indd 89AFIR_083-110_ch06.indd 89 4/3/08 8:58:59 AM4/3/08 8:58:59 AM

90
Accounting for Infrastructure Regulation: An Introduction
to these direct costs, regulators will require details on cost nature, such as personnel,
intermediary products, third-party services, and so on.
For regulated activities, a second level of disaggregation will allow for more
detailed analysis of subactivities. Table 6.2 shows a possible classifi cation of subac-
tivities in electricity production.
Chapter 4 noted that the electricity regulator in Argentina decided to apply the
activity-based costing approach to give users additional information about the use
of all the resources directly or indirectly associated with each of the activities devel-
oped by the distribution companies, because the services provided by these compa-
nies should be affected by a share of resource costs. The accounts selected by this
regulator are classifi ed according to activities, which are further classifi ed by type of
good and nature of the associated cost, as shown in table 6.3.
This strategy facilitates control of the use of resources by relating them to activi-
ties. Separation of subactivities is unnecessary for unregulated activities. The regu-
lator needs only to identify the costs shared by the regulated activities and the
unregulated activities. When the regulated activity purchases a service from its
unregulated arm, the regulator will need to ensure that the price is reasonable and
that the action is not an attempt to shift costs and profi ts between the two activities.
(These cases are discussed in the section below on related-party transactions.)
Some regulators require that when the costs of third-party contracted services
exceed a certain threshold they be broken down by cost nature as if the activities
were provided in-house. For example, the Offi ce of Water Service ([Ofwat] the UK
water regulator) sets the threshold at 20 percent of the activity costs, but it encour-
ages fi rms to break down the costs of contracted activities well below that limit.
Depending on the structure of the operator and the nature of its market, the
regulator may establish criteria for disaggregating costs according to location, tech-
nical system, technology, and other dimensions. For example, if the operator serves
an important geographic area with a high degree of heterogeneity (in terms of cus-
tomer density and demand composition, for example), the regulator may require
the operator to identify the cost of serving each area. If the operator provides ser-
vices in more than one system, as in the case of water companies providing services
in separate cities or villages that are not interconnected, the regulator needs infor-
mation on the revenues and costs arising from each system even when it decides to
apply homogeneous tariffs across all systems. The reason is that separation of reve-
nues and costs allows identifi cation of potential fl ows of funding or cross-subsidies
among the systems.
AFIR_083-110_ch06.indd 90AFIR_083-110_ch06.indd 90 4/3/08 8:58:59 AM4/3/08 8:58:59 AM

91
Core Issues in Regulatory Accounting
6
Tab
le 6
.2. S
ub
acti
viti
es in
reg
ula
ted
an
d u
nre
gu
late
d a
ctiv
itie
s o
f an
ele
ctri
city
op
erat
or
Ph
ase
Su
bp
has
eFu
nct
ion
Inve
stm
ent
Gen
erat
ion
To tu
rn p
rimar
y en
ergy
into
ele
ctric
ity
Pow
er s
tatio
ns (h
ydro
elec
tric
, the
rmal
, gas
po
wer
ed, c
oal p
ower
ed, n
ucle
ar, w
ind,
so
lar)
; cap
acity
fro
m 1
–1,0
00 m
egaw
atts
Tran
sfor
mat
ion
To tu
rn e
lect
ricity
gen
erat
ion
volta
ge le
vel i
nto
tran
smis
sion
vol
tage
le
vel;
to a
llow
long
-dis
tanc
e tr
ansm
issi
on o
f lar
ge c
apac
ities
Tr
ansf
orm
ers,
bar
s, p
rote
ctio
n, m
eter
ing
and
cont
rol e
quip
men
t, a
nd c
ivil
wor
ks
Tran
smis
sion
To t
rans
port
ele
ctric
ity f
rom
gen
erat
ion
site
s to
the
bou
ndar
ies
of la
rge
cons
umpt
ion
cent
ers;
usu
ally
mes
h sy
stem
Net
wor
ks o
f 11
5–76
5 ki
lovo
lts, w
ith
capa
city
of
50–2
,000
meg
awat
ts
Dis
trib
utio
nTr
ansf
orm
atio
n To
turn
ver
y hi
gh v
olta
ge e
lect
ricity
into
low
er v
olta
ge to
faci
litat
e tr
ansm
issi
on in
a c
erta
in g
eogr
aphi
cal a
rea
Tran
sfor
mer
s, b
ars,
pro
tect
ion,
met
erin
g an
d co
ntro
l equ
ipm
ent,
and
civ
il w
orks
Sub
tran
smis
sion
To d
istr
ibut
e th
e el
ectr
icity
rec
eive
d fr
om v
ery
high
-vol
tage
/hig
h-vo
ltage
tra
nsfo
rmer
sta
tions
to
high
-vol
tage
/med
ium
-vol
tage
tr
ansf
orm
er s
tatio
ns fo
r re
gion
al d
istr
ibut
ion
Net
wor
ks o
f 66
–220
kilo
volts
, with
cap
acity
of
35–
200
meg
avol
t am
pere
s
Tran
sfor
mat
ion
To r
ecei
ve e
lect
ricity
fro
m s
ubtr
ansm
issi
on s
yste
ms
and
turn
it
into
low
er v
olta
ge t
o al
low
loca
l dis
trib
utio
n; u
sual
ly, m
ore
than
on
e di
strib
utio
n le
vel
Tran
sfor
mer
s, b
ars,
pro
tect
ion,
met
erin
g an
d co
ntro
l equ
ipm
ent,
and
civ
il w
orks
Tran
sfor
mat
ion
post
s To
rec
eive
ele
ctric
ity f
rom
feed
ers
and
dist
ribut
ors
and
conv
ert
it to
the
prim
ary
volta
ge le
vel o
f di
rect
use
rs
Tran
sfor
mer
(thr
ee p
hase
, tw
o ph
ase,
and
si
ngle
pha
se),
civi
l wor
ks (a
ir, la
nd,
unde
rgro
und)
, and
pro
tect
ion
equi
pmen
t;
capa
city
of
3–1,
000
kilo
volt
ampe
res
Sec
onda
ry
dist
ribut
ion
in
low
vol
tage
To d
istr
ibut
e en
ergy
from
med
ium
-vol
tage
/low
-vol
tage
tr
ansf
orm
atio
n po
sts
to u
sers
; alw
ays
radi
al fr
om th
e st
andp
oint
of
oper
atio
n; fr
om th
e st
andp
oint
of c
onst
ruct
ion,
usu
ally
sec
tions
be
twee
n ci
rcui
t end
s fo
r rec
onfi g
urat
ion
Net
wor
ks m
ade
by c
onve
ntio
nal o
verh
ead
lines
, pre
asse
mbl
ed, a
nd u
nder
grou
nd
wire
s; v
olta
ge le
vels
of
110–
400
volts
Invo
icin
g M
eter
rea
ding
and
invo
ices
to
cust
omer
s In
stal
latio
n an
d m
aint
enan
ce o
f m
eter
s an
d in
voic
ing
and
colle
ctio
n sy
stem
s
Trad
ing
Purc
hase
and
sal
e of
ele
ctric
ity b
y co
ntra
ct o
r in
the
spo
t m
arke
t;
pote
ntia
lly c
ompe
titiv
e ac
tivity
Sou
rce:
Aut
hors
.
AFIR_083-110_ch06.indd 91AFIR_083-110_ch06.indd 91 4/3/08 8:58:59 AM4/3/08 8:58:59 AM

92
Accounting for Infrastructure Regulation: An Introduction
6
6.2. Regulatory asset base determination
From an economic perspective, tariff determination should meet several regulatory
objectives, including sustainability, allocative effi ciency, productive effi ciency, and
equity. Economic and fi nancial sustainability require that tariffs generate enough
revenue to cover the economic cost of service provision, including a return on capi-
tal. The rate of return must be determined on the basis of the opportunity cost of
capital—what could be earned from the best alternative investment with similar
risk. However, this approach covers only one part of the problem. The regulator
must also determine the composition and value of the regulatory asset base to
which this rate of return would apply.
This key part of the regulatory process raises two related problems. First, the
regulator must determine which investments by the regulated operator are specifi c
to the service and also meet effi ciency and prudence criteria. Second, the regulator
must decide how to value these investments for regulatory purposes. In the context
of regulatory accounting, the relation between the regulatory asset base and the
book value of the operator’s assets is important to consider, as is the matter of how
to reconcile the two if they do not match.
Asset base valuation
Regardless of the approach selected to quantify the asset base, certain general prin-
ciples apply, such as that the asset base should refl ect mainly the value of the assets
engaged in the public service. In most cases the approach focuses on the entries
under the assets account in the balance sheet, updated as necessary, for example, for
depreciation (Goodman 1998, 732). Discussion of the most appropriate way to
Table 6.3. Example of activity classifi cation by electricity regulator
Level 1: Chapters
Level 2: Items
Level 3: Activities and subactivities
Levels 4–5: Type of goods
Level 6: Nature of cost
7. Expenditures 3. Technical operation
40. Transformation—preventive maintenance
1. Substations– 1.1. Substations
high voltage/ high voltage
1. Payroll 2. Materials 3. Contracted
services and others
Source: Authors.
AFIR_083-110_ch06.indd 92AFIR_083-110_ch06.indd 92 4/3/08 8:59:00 AM4/3/08 8:59:00 AM

93
Core Issues in Regulatory Accounting
6
value the asset base is not new. At the end of the nineteenth century, in Smyth vs.
Ames, the U.S. Supreme Court ruled that
the basis of all calculations as to the reasonableness of rates to be charged by a cor-
poration maintaining a highway under legislative sanction must be the fair value
of the property being used by it for the convenience of the public. And in order to
ascertain that value, the original cost of construction, the amount expended in per-
manent improvements, the amount and market value of its bonds and stocks, the
present as compared with the original cost of construction, the probable earning
capacity of the property under particular rates prescribed by statute, and the sum
required to meet operating expenses, are all matters for consideration, and are to be
given such weight as may be just and right in each case. We do not say that there
may not be other matters to be regarded in estimating the value of the property.
What the company is entitled to ask is a fair return upon the value of that which it
employs for the public convenience. On the other hand, what the public is entitled
to demand is that no more be exacted from it for the use of a public highway than
the services rendered by it are reasonably worth (Goodman 1998, 755).
Three approaches for asset base determination can be identifi ed in this court
decision:
• historic value (original building cost),
• market value (amount and market value of the fi rm’s bonds and stocks), and
• replacement value (current building cost).
The following sections briefl y examine the advantages and disadvantages of
these methods, which remain the most frequently discussed in the literature and
applied in regulatory practice at the international level.
Historical costTraditionally, companies have recorded the value of their fi xed assets on a historical
cost basis, which continues to be the basis applied in most statutory accounts (see
chapter 3). The use of a historical cost basis is consistent with the role of statutory
accounts in allowing investors to review the quality of stewardship of their invest-
ments by management. Investors are interested in the return earned on their actual
investment rather than on some notional asset base.
Market valueWhen a stock is listed, the market value provides the best guide to expectations of
future revenues derived from the company’s assets—and therefore the company’s
AFIR_083-110_ch06.indd 93AFIR_083-110_ch06.indd 93 4/3/08 8:59:00 AM4/3/08 8:59:00 AM

94
Accounting for Infrastructure Regulation: An Introduction
6
economic worth. In a regulated environment, however, this market value intro-
duces a circularity problem, whereby future revenues depend on prices that in turn
depend on the asset base derived from future revenues.
When companies are not listed on a public stock exchange, regulators must use
estimates of the discounted cash fl ows arising from that asset in the future. Again,
the circularity problem limits the usefulness of this methodology for regulatory
purposes.
Replacement costAn alternative form of valuation is to consider the cost of building the infrastructure
at current prices, but even a replacement cost measure is not a true refl ection of the
economic worth of the assets. It fails to take into account technological change and
thus to capture the extent to which more effi cient modern assets can substitute for
existing assets. It also assumes that the existing asset confi guration is the most effi -
cient confi guration.
Two refi nements of the replacement cost methodology seek to address these
issues. The fi rst is revaluation of assets on the basis of modern equivalent asset val-
ues—for example, by substituting a gas-fi red power plant for an equivalent size
coal-fi red plant. The second refi nement is creation of depreciated optimized
replacement cost estimates. This refi nement extends the fi rst refi nement by model-
ing the optimal asset confi guration to deliver the service at the current time. For
example, one large plant might replace two smaller generation plants under such a
valuation.
When multiple values are possible (for example, when the depreciated opti-
mized replacement cost differs from the market value), the appropriate rule to
apply from an effi ciency point of view is the deprival rule, which states that the
value of the assets to their owner is lower than their replacement cost (however
defi ned) and higher than their market value or scrap value. Essentially, this
value represents the value that an investor could obtain for the assets and there-
fore the value at which the investor should be compensated for being deprived
of these assets.
Formally, the deprival rule can be expressed as follows:
Value = Min[DORC, Max{PV, SV}],
where DORC is depreciated optimal replacement cost valuation of the asset
(replacement cost), PV is present value of cash fl ows earned from the asset (market
value), and SV is scrap value of the asset.
AFIR_083-110_ch06.indd 94AFIR_083-110_ch06.indd 94 4/3/08 8:59:00 AM4/3/08 8:59:00 AM

95
Core Issues in Regulatory Accounting
6
Regulatory asset base composition
In dealing with the asset base composition, the regulator must consider principles
that may not arise in asset base valuation in unregulated companies.
AssetsIn regulated companies, the rate base refl ects primarily the assets in public service
rather than a quantity of stocks or bonds devoted to the public service. The focus is
on properties on the asset side of the balance sheet adjusted only as needed by refer-
ence to various reserves on the liability side.
In deciding whether particular assets should be included in the rate base calcula-
tion, regulators may apply the principle that only assets in service in the test year or
the near-term period should be included. Whatever the method of rate base valua-
tion, investors are entitled to a return only on that portion of their investment that
is used and useful in the public service, assuming a reasonable planning period.2
Intangible property is rarely includible in the rate base.3 For example, the Mas-
sachusetts Regulatory Commission held that intangible costs that benefi t ratepay-
ers over more than one year are appropriately capitalized and included in the rate
base. Such costs would include, for example, computer software and organization
costs related to mergers involving the regulated company.
GoodwillGoodwill can be described as a global concept that captures a set of company activi-
ties related to superior earning power, such as customer loyalty, employees’ exper-
tise, management capabilities, and all the other intangible factors that motivate
people to do business with the company.
The U.S. Federal Communication Commission noted that traditionally such
excess acquisitions costs are partly or wholly excluded from rate bases, because
these costs typically benefi t the seller, not the ratepayer, and do not contribute to the
plant supporting the regulated service. In arguing for inclusion of goodwill in the
rate base, the regulated operator bears the burden of showing that its costs result
from arms-length bargaining and that the net effi ciency gains result in concrete,
tangible benefi ts to ratepayers.
Whether the costs of obtaining a franchise, as distinguished from the value of
the franchise itself, should be included in the rate base is debatable. Regulatory
commissions uniformly reject capitalized values of company franchises. When gov-
ernment confers the right to operate a utility, the only capitalizable assets are the
land, equipment, and buildings for which capital outlays have been made, even
though a market for the franchise may exist.
AFIR_083-110_ch06.indd 95AFIR_083-110_ch06.indd 95 4/3/08 8:59:00 AM4/3/08 8:59:00 AM

96
Accounting for Infrastructure Regulation: An Introduction
6
Deferred operating costs and regulatory assetsWhen the operator, with the regulator’s approval, postpones the collection of a cost
from ratepayers, it may be allowed to create a deferred cost or a regulatory asset on
its books for a stated period. It thereby capitalizes the cost and will thereafter amor-
tize the cost through charges to ratepayers, with or without inclusion of the unam-
ortized balance in the rate base. Deferred costs are included in the rate base only
when ratepayers have not yet been called on to bear the costs in any of the rates. If
ratepayers have already paid the deferred cost, that cost may not be included in the
rate base. A utility typically uses deferred costs and regulatory assets to account for
the period between the in-service date of a major generating plant and the time that
its costs can be refl ected in new rates.
Leased propertyRegulators generally distinguish between a capital lease and an operating lease. Only
the properties under a long-term capital lease qualify for inclusion in the capital
structure and rate base. Such inclusion does not automatically follow for every cap-
ital lease. Lease payments under operating leases are included in operating expenses
on the operator’s income statement and taken as an allowable expense for ratemak-
ing purposes.
Third-party contributionsMost agencies will deduct from the rate base any part of the capital that either has
been donated (or deposited) and bears no capital cost to the company, or is other-
wise maintained on the company’s books at no cost to investors. The widely followed
rule is that the property account shall include no cost or value for facilities or land
contributed or paid for by government agencies, individuals, or others. Alternatively,
such sums can be carried as booked investment—but at a zero cost of capital or
deducted from the allowance for working capital and hence from the rate base.
Working capitalThe regulatory asset base includes not only physical assets but also liquid funds
needed for the operation of the business. These funds are known as working capital
and are based on the funds that the operator must keep on hand to continue day-to-
day operations. The working capital allowance takes into account short-term assets
and liabilities. It assumes that a well-managed company will have a reasonable mar-
gin of current assets over current liabilities (that is, net working capital) on hand at
all times. Typically, working capital requirements are assessed through a lead/lag
study that analyses the time between the utility’s provision of a service and receipt
AFIR_083-110_ch06.indd 96AFIR_083-110_ch06.indd 96 4/3/08 8:59:00 AM4/3/08 8:59:00 AM

97
Core Issues in Regulatory Accounting
6
of revenues (the “lag”) and the time between the utility’s receipt of goods or services
and payment for those goods or services (the “lead”). The resulting working capital
requirements are then included in the rate base on which the operator will be given
the opportunity to earn a fair return.
Other principlesIn dealing with the asset base composition, the regulator must also consider the fol-
lowing principles:
• The rate base is usually a net valuation fi gure after deduction of the current
depreciation reserve, including all past accumulated depreciation on the same
assets. The depreciation reserve must be deducted from the rate base, because a
depreciation charge is a fi nancial transaction between consumers and the opera-
tor. Because consumers contribute revenue for the investment amortization, the
recovered depreciation should be deducted from the property valuation. Other-
wise, consumers pay returns on property values that are already amortized.
• Losses on the sale of property or on purchases made by the operator that it rec-
ognized by a reduction in retained earnings are not properly included in the rate
base.
• A regulated company cannot properly attempt to recover prior operating losses
through inclusion of such losses in the rate base.
• An electric utility is entitled to include a reasonable allowance for coal, oil, and
diesel fuel inventories in the rate base.
• In recent years a major issue has been whether deferred taxes on utility books
should be included or excluded from the rate base. Most utility regulators exclude
those sums, fi nding that they have been contributed by ratepayers rather than by
investors in the regulated company and so carry no associated cost of capital.
Alternatively, a treatment equal or equivalent to removal from the rate base
would be treatment of deferred taxes as zero cost capital in the rate of return and
capital structure computations.
• Regulatory treatment of the differences between forecast and actual capital
expenditures depends directly on the regulatory regime adopted, but some cases
are worth mentioning. For example, in the United Kingdom capital expendi-
tures larger or smaller than forecast receive asymmetric treatment. If the opera-
tor invests more than the capital expenditure approved in the fi ve-year tariff
review, the amount over the approved expenditure is not included in the asset
base. Thus, the regulator prevents users of the regulated service from paying for
excessive capital expenditure—which might be caused by the operator’s lack of
effi ciency. If the capital expenditure is lower than forecast, the regulator allows
AFIR_083-110_ch06.indd 97AFIR_083-110_ch06.indd 97 4/3/08 8:59:00 AM4/3/08 8:59:00 AM

98
Accounting for Infrastructure Regulation: An Introduction
6
the forecast value to be incorporated into the asset base to provide incentives to
improve effi ciency. When companies spend less in delivering the required out-
puts than the amount determined at periodic reviews, they may keep the benefi ts
of these capital effi ciencies for a specifi c period of time, after which the benefi ts
are passed on to customers.
Box 6.2 describes the approach of one regulator (the UK’s Offi ce of Water Services
[Ofwat]) to the problem of establishing and rolling forward the regulatory asset
base.
6.3. Depreciation policies of the regulatory asset base
Depreciation is an important issue for the regulator, for several reasons:
• Regulated utilities are capital intensive, and depreciation is a major component
of the costs.
• The approach to calculating depreciation is considerably fl exible, and the choice
of the depreciation profi le can smooth prices and cash fl ows and reduce risks for
the investor.
• Changes in depreciation profi les can result in windfall gains and losses if not
handled carefully.
Annex 4 provides further analysis of the principles for depreciation and the
impacts of different depreciation profi les.
Regulatory approaches to depreciation
The regulator needs to consider the full range of regulatory objectives in setting
depreciation requirements. Economic objectives are important, but which of the
most commonly used approaches most closely approaches economic depreciation
remains unclear. Thus, fl exibility in the depreciation profi les is considerable, and
the choice of these profi les should be guided by such noneconomic objectives as
administrative simplicity, certainty, price stability, and intergenerational equity.
The key requirements for the regulator are the following:
• total (accumulated) depreciation over the asset’s life equals the difference
between the asset’s undepreciated value and the residual value;
• any changes to the depreciation profi le have a net present value–neutral effect on
prices and the income stream (this insight should follow from the point above); and
• the approach is transparent, administratively simple, and consistent with inter-
generational equity.
AFIR_083-110_ch06.indd 98AFIR_083-110_ch06.indd 98 4/3/08 8:59:00 AM4/3/08 8:59:00 AM

99
Core Issues in Regulatory Accounting
6
Box 6.2. Regulatory capital values, Offi ce of Water Services, United Kingdom
The following are regulatory accounting guidelines from Ofwat in the United Kingdom:
• The valuation of initial operating assets should disregard the impact of the regulatory regime which would otherwise imply that the value to the business was the recoverable amount. To date, MEA [modern equivalent asset] values have been refl ected in the regulatory accounts with no reference to or inclusion of the value placed on the asset base for regulatory purposes (pri-marily for price setting). However, over time analysts and inves-tors have increased their focus on the RCV [regulatory capital value], using it as a proxy for market values. Therefore from the 2002–03 fi nancial year onward, the regulatory capital value will be included in a note to the regulatory accounts. This will enable readers of the accounts to assess the value of the assets used for regulatory purposes (the RCV) relative to the largely replace-ment value of the assets (the MEA value).
• The RCV starts with a direct measure of the value placed on each company’s capital and debt by the fi nancial markets follow-ing privatisation (or a broadly similar measure for water only companies which were not fl oated). This is then rolled forward to take account of new capital investment, net of depreciation. The calculation of RCVs is an essential element in Ofwat’s price determination process. They also act as a proxy for market val-ues and as such form an important basis for measuring fi nancial performance.
• The Ofwat methodology is effectively a regulatory hybrid to pro-vide equitable treatment between consumers and sharehold-ers. It is based on acquisition costs to ensure that there is no
(continues)
AFIR_083-110_ch06.indd 99AFIR_083-110_ch06.indd 99 4/3/08 8:59:00 AM4/3/08 8:59:00 AM

100
Accounting for Infrastructure Regulation: An Introduction
6
windfall gain to shareholders. Consumers incur depreciation charges based on current replacement (MEA) costs, so that each period consumers pay for the asset value used in the ser-vices supplied.
• The initial RCV is calculated as the average of the market value of each water and sewerage company for the fi rst 200 days for which the shares were listed plus the total value of debt at priva-tisation. A proxy for the initial market value was used for the water only companies that were not privatised in 1989.
• The value has been adjusted each year to take account of net investment. Capital expenditure to enhance and maintain the network which has been assumed in setting price limits has been added to the value. This is after deducting the amount of depreciation (based on the MEA values of the assets) which has been assumed in setting price limits. Any grants and contribu-tions and associated amortisation are also taken into account. Infrastructure renewals expenditure is not added to the RCV but the movement in the infrastructure renewals accrual or prepay-ment is included. Adjustments are also made in respect of dis-posals of land to remove the value of this from the RCV.
• The RCV is adjusted each year by RPI [retail price index] to take account of infl ation.
• By setting out clear guidance on RCV methodology and publish-ing the values of the RCV in the regulatory accounts, transpar-ency will be aided and there will be consistency between the companies. The fi gures in the reconciliation will be those deter-mined by Ofwat at Periodic Reviews.”
Source: Regulatory Accounting Guidelines (RAG) 1.03, Offi ce of Water Services, United Kingdom.
Box 6.2. (continued)
AFIR_083-110_ch06.indd 100AFIR_083-110_ch06.indd 100 4/3/08 8:59:00 AM4/3/08 8:59:00 AM

101
Core Issues in Regulatory Accounting
6
Alternative approaches to depreciation
A range of depreciation methodologies, which vary in complexity and profi le of
depreciation charges and prices over time, is available to the regulator:
• Straight-line depreciation: A constant percentage of the undepreciated asset value
is deducted from the opening asset value in each year. This approach is simple
and easily applied but may not refl ect economic depreciation.
• Declining balance depreciation: Depreciation is a constant proportion of the
opening asset value. Thus depreciation is front-end loaded (the dollar amount
of depreciation is larger in the early years of an asset’s life). This approach may
better match the economic depreciation of some assets (such as cars) than oth-
ers (such as buildings).
• Annuity depreciation: For a constant annual revenue the net present value of which
equals the cost of the asset, the depreciation in each period is the amount left after
the deduction of a normal return on the opening value of the asset for the period.
This approach, which is similar to repayment of principal on a mortgage, is not
often used in business, but it yields a constant price over the asset’s life.
Estimation of asset lives
In principle, an asset should be depreciated over its expected productive life. Esti-
mating asset life accurately may be diffi cult. The condition, even the age, of current
assets may not be well known. The long life of infrastructure assets also means that
their useful economic life may be diffi cult to estimate. Some assets (such as water
mains or aging gas pipelines) may not be replaced but may instead have their ser-
vice lives extended through maintenance and renewal technologies. For these assets,
a renewal accounting approach may be most appropriate.
There may be circumstances in which the regulator wishes to change the assumed
economic life of assets, but the regulator should do so carefully and only when the
new assumed life would have a purely prospective impact.
Treatment of depreciation on variations from forecast
capital expenditures
As noted in the discussion of the regulatory asset base, actual and forecast capital
expenditure will almost certainly vary. Treatment of the difference between the two
has important implications for the operator’s incentives and should be taken into
account in the overall decision about how to roll forward the asset base.4 One option
AFIR_083-110_ch06.indd 101AFIR_083-110_ch06.indd 101 4/3/08 8:59:01 AM4/3/08 8:59:01 AM

102
Accounting for Infrastructure Regulation: An Introduction
6
is to roll forward the asset base between reviews by adding capital expenditure to
assets as incurred and depreciating those assets from that point on using the stan-
dard depreciation lives. For the operator, this strategy increases incentives to pursue
effi ciency gains but imposes higher risks.
Alternatively, the asset base could be rolled forward through the addition of
actual capital expenditure to the asset base and the deduction of forecast deprecia-
tion. This strategy reduces incentives for effi ciency improvements, but it also
reduces risks from unexpected variations in capital expenditure requirements.
The regulator’s primary obligation is to clearly specify the proposed treatment
of depreciation in the roll forward of the asset base at the start of the regulatory
period and to incorporate this treatment in the accounting rules.
Principles for depreciation
The following principles should guide treatment of depreciation:
• A simple, easily implemented approach to calculating depreciation, such as the
use of straight depreciation, is to be preferred.
• Such an approach is unlikely to coincide with economic depreciation, but no
single approach is necessarily more likely than another to refl ect the economic
depreciation of individual assets.
• Applying a uniform approach (but not uniform asset life) to all assets is clearest,
simplest, and most easily verifi ed, and it avoids the need to monitor the demar-
cation between asset classes.
• Maintaining a consistent approach to and assumptions about depreciation over
time helps to avoid uncertainty and windfall gains or unexpected losses.
• The option to revise the depreciation profi le and assumed asset lives should be
left open in light of changing information about asset conditions and lives, mar-
ket risks, and the need to manage potential price or cash fl ow shocks.
• Changes in assumed asset lives or depreciation profi les should have a prospec-
tive impact: for example, the opening asset value prior to the change should be
estimated on the basis of the previous depreciation assumptions.
6.4. Related-party transactions and transfer pricing
Related-party transactions are becoming increasingly common as utilities adopt
more complex, and often more effi cient, structures. The challenge for the regulator
AFIR_083-110_ch06.indd 102AFIR_083-110_ch06.indd 102 4/3/08 8:59:01 AM4/3/08 8:59:01 AM

103
Core Issues in Regulatory Accounting
6
is to determine when two entities are related and what powers the regulator has
with regard to related-party transactions, as well as the appropriate bases for cost
allocation and pricing. The regulator’s objectives will be the same as those that drive
other aspects of regulatory accounting:
• obtaining better information on the costs of regulated monopoly services for
future determinations,
• ensuring the equitable allocation of costs to regulated activities and unregulated
activities,
• assessing the performance of the operator,
• improving the transparency of cost allocations and regulation, and
• protecting users against anticompetitive behavior.
Often, an operator will have a fi nancial relationship with a related party. It may
be as simple as sharing costs with a subsidiary providing unregulated commercial
engineering or consumer services. Increasingly, however, relationships are more
complex. The regulated operator may be part of a multisector company in which
costs are shared across sectors, jurisdictions, and regulatory regimes. The regulated
operator may pay a management fee to a holding company with diversifi ed inter-
ests, or it may have structured itself as an asset-owning trust with a separate, unreg-
ulated service company managing the assets. Or a company may have put assets
into a separate asset-owning trust in which the company owns as little as 20 percent
of the shares but provides most of the management and operational services
through a separate wholly owned subsidiary.
Such complex structures are becoming more common as competition is intro-
duced into utility sectors and as utilities seek effi ciencies through economies of
scale or scope and placement of greater competitive pressures on their own activi-
ties. This makes dealing with related-party and transfer pricing more diffi cult.
Without undermining incentives to improve effi ciency, the regulator needs to
ensure that the benefi ts of more effi cient means of providing services are fairly
shared and that no profi t shifting or cost padding occurs.
Whether a regulator needs to incorporate related-party provisions in the
accounting code is an open question. If the current structures are simple, the issues
may be entirely academic, according to the materiality principle (see chapters 3 and
7), and no provision is necessary. This is more likely to be the case where the entity
remains entirely in government ownership. In other cases, it will be impossible to
avoid the issue, because the structures already exist, or the regulator may wish to
provide greater certainty to operators for the future by anticipating the issues and
providing clear guidelines.
AFIR_083-110_ch06.indd 103AFIR_083-110_ch06.indd 103 4/3/08 8:59:01 AM4/3/08 8:59:01 AM

104
Accounting for Infrastructure Regulation: An Introduction
6
Defi nition of related parties
Figure 6.1 illustrates some of the more complex structures that may exist and the
transactions of interest to the regulator.
The defi nition of related parties is likely to focus on one or more of the following
elements: ownership, control, and common economic interests.
Ownership can be quantifi ed and clear rules can be set, but control and com-
mon economic interests are more nebulous concepts. U.S. Financial Accounting
Board Standard 57 incorporates all three elements. Included in this standard are
transactions between an entity and its principal owners, wherein a principal owner
is defi ned as having more than 10 percent of the voting interest in the entity. The
UK equivalent, Financial Reporting Standard 8 (FRS 8), does not specify a percent-
age ownership share in its primary defi nition, which focuses on the capacity to
control or infl uence.5 However, it does indicate that where a shareholder exercises
control over 20 percent or more of the voting rights or where the entity is managed
under a management contract, the regulator will assume that the entities are related,
unless demonstrated otherwise.
Often, the existing structures may be simple, consisting of various wholly owned
or majority-owned entities. In these cases, a simple defi nition based on ownership
Figure 6.1. Possible structures and relationships affecting a regulated entity
Source: Authors.
Holding or management company
Other regulated utilities
Asset operation and management
company
Joint venture competitive
Regulated activity
Unregulated activity
Regulated entity
100% ownershipPart ownership
Provision of servicesPayment for services
AFIR_083-110_ch06.indd 104AFIR_083-110_ch06.indd 104 4/3/08 8:59:01 AM4/3/08 8:59:01 AM

105
Core Issues in Regulatory Accounting
6
of a set percentage of voting shares may be suffi cient. In other cases, more complex
defi nitions may be required.
The UK energy and water regulators start from the defi nition of related parties
in FRS 8. The Offi ce of Gas and Electricity Markets (Ofgem) has modifi ed FRS 8 so
that if an entity is considered a related party of any company within the group, it is
considered a related party of the regulated entity. Ofgem has a general power to
deem any entity or person a related party (Ofgem 2002, 29).
In Australia, the Queensland and Victorian regulators adopted defi nitions based
on whether an entity “has control or signifi cant infl uence” over another entity
(QCA 2003, 26–27). In a draft accounting code, the Independent Pricing and Regu-
latory Tribunal of New South Wales proposed a test based on common economic
goals (IPART 2001, 7–8). The proposed interpretation of this test mirrored many
aspects of the tests for control or infl uence under FRS 8, including the indicative 20
percent shareholding test.
Tests that rely on subjective judgments of control, infl uence, or common interests
cope better with emerging structures, but they create challenges for the operator,
because anticipating future obligations is diffi cult under different structures, and for
the regulator, because subjective case-by-case decisions may be hotly contested.
Specifi ed transactions
The regulator needs to specify the transactions of interest as well as the defi nition
of related parties. The regulator may determine that all transactions between related
parties are of interest, but this need not be the case. Some transactions may involve
purchasing services at an arm’s-length regulated price. For example, the engineer-
ing division may provide services at a customer’s site on a competitive basis and as
part of the service arrange for connection with its related utility. Other transactions
may be too small to be of concern. Ofgem’s requirements do not cover transactions
with a total expected value of less than 0.25 percent of the regulated business turn-
over, or £500,000.
Table 6.4 classifi es the types of transactions that may be involved and provides
examples of those transactions.
Information disclosure
The accounting standards that apply generally to related-party transactions spec-
ify the requirements for disclosure and auditing of those transactions. Regulators
have typically set similar, or more stringent, requirements for the disclosure of
AFIR_083-110_ch06.indd 105AFIR_083-110_ch06.indd 105 4/3/08 8:59:01 AM4/3/08 8:59:01 AM

106
Accounting for Infrastructure Regulation: An Introduction
6
Table 6.4. Types and examples of related-party transactions
Type of transaction Examples Issues
Service provider: unregulated associate Service consumer: regulated activity Competition: none in service provision
Gas services are provided by a local subsidiary of an international fi rm that funded the original bid and provides fi nancial and management support. The subsidiary pays a management fee for this service.
Are the management fees reasonable relative to the costs and risks? What is a reasonable cost attribution? Are there comparators for these fees? What are the powers of the regulator in regard to these fees?
Service provider: unregulated associate Service consumer: regulated activity Competition: actual or potential competition
A gas distribution trust owns the network assets and is the regulated license holder but contracts out asset management and operation to a company that owns 30 percent of the trust.
Are the costs charged to the trust reasonable, or are they padded to transfer profi ts to the contractor? Is the contractor a related party? What are the regulator’s powers? Are there benchmark prices? Was there competition to provide the services?
Service provider: regulated activity Service consumer: unregulated associate Competition: none in service provision
A regulated electricity utility gives access to its network assets and easements to a communications service joint venture in which it has a 50 percent interest.
Communication services are competitive but the input (access to network assets) is not. Although additional costs may be small, what share of the fi xed costs should the communications activity pay for?
A regulated gas distribution utility gives access to its pipes to its subsidiary for retail supply of gas.
If access is at standard regulated price, terms, and conditions, no issues arise.
Service provider: regulated activity Service consumer: unregulated associate Competition: actual or potential competition
The engineering staff of a regulated water utility provides advice to a joint venture bidding to build a water treatment plant outside the utility’s monopoly territory.
Are the resources used properly tracked and costed? Is the price received comparable to competitive benchmarks? Does the revenue received exceed the costs incurred?
Source: Authors.
AFIR_083-110_ch06.indd 106AFIR_083-110_ch06.indd 106 4/3/08 8:59:01 AM4/3/08 8:59:01 AM
107
Core Issues in Regulatory Accounting
6
information on related-party transactions in regulated utilities. The regulator may
require disclosure of the
• name of the related party involved,
• amount paid,
• services provided,
• method by which the price was determined (details of the cost allocation or
market testing adopted), and
• means by which the transaction is refl ected in the regulatory accounting
statement.
Basis of cost allocation
The objectives in determining acceptable cost allocations or prices for related-party
transactions are no different from those for transactions within the utility between
regulated services and unregulated services. The regulator wants to be sure that the
regulated utility pays no more than is reasonable for the services provided by related
parties and is fairly compensated for services it provides to related parties. In prin-
ciple, the same cost allocation and pricing methodologies that are deemed appro-
priate for internal transactions could apply to related-party transactions. In broad
terms the regulator can specify the basis of the cost allocations from the operator
and related parties for the services provided or compare the prices charged for the
services with market benchmarks.
Specifying the basis of cost allocations is a common approach. As noted in chap-
ter 4, several approaches to the allocation of costs are feasible. Although the regula-
tor may fi nd that it can specify cost allocation methodologies and information
requirements when the regulated operator provides a service to a related party, its
powers with regard to services provided by related parties to the regulated operator
may be much more limited. For example, the operator may purchase management
services from a related company that provides similar services to other companies
within the group. Whether the regulator can request information on the cost allo-
cations underpinning the services provided to the regulated operator depends on
the powers its legislation provides.
Ofgem and Ofwat prefer to compare prices with market benchmarks wherever
possible. Transfer prices are to be based on the market price, and market testing is to
be used to establish the market prices for supplies. Where no market exists, transfer
prices are based on costs allocated in relation to the way resources are consumed.6
Many approaches can be used for market testing: competitive letting, comparison
AFIR_083-110_ch06.indd 107AFIR_083-110_ch06.indd 107 4/3/08 8:59:01 AM4/3/08 8:59:01 AM

108
Accounting for Infrastructure Regulation: An Introduction
6
to published prices, third-party evaluation, and benchmarking. The problem is that
for some services a service in the market may not be readily identifi able. An exam-
ple may be a single-line contract for the management and operation of a water sup-
ply system.
In summary, specifying the requirements for transfer pricing and assessing the
reasonableness of prices are among the most diffi cult challenges facing the regulator.
Additional reading and resources
Allen Consulting Group. 2003. “Principles for Determining Regulatory Depreciation Allow-
ances.” Note to the Independent Pricing and Regulatory Tribunal of New South Wales, Allen
Consulting Group, Melbourne, Australia. www.ipart.nsw.gov.au.
IPART (Independent Pricing and Regulatory Tribunal of New South Wales). 2001. “Proposed
Accounting Separation Code of Practice for Regulated Electricity Businesses in New South Wales.”
Issue 2, Section 3.4., IPART, Sydney, Australia. www.ipart.nsw.gov.au.
Ofwat (Offi ce of Water Services). 2003. “Regulatory Accounting Guideline 1.03: Guideline for
Accounting of Current Costs and Regulatory Capital Values.” Ofwat, London. www.ofwat.gov.uk.
Notes
1. A common test for unfair competition through predatory pricing is whether the company
is pricing at below marginal cost.
2. In many cases assets are built with excess capacity to allow for future growth and to avoid
costly incremental additions to capacity. Optimization based solely on current use, or short-term
expectations of use, may discourage effi cient investment.
3. If the intangible asset, whether or not included in the rate base, has attained its value as a
result of charges to ratepayers, revenue from its transfer should be imputed in a rate base.
4. Roll forward refers to the periodic adjustment of the regulatory asset base. Typically this
adjustment will include the addition of capital expenditures less regulatory depreciation. If the
asset base is measured in real terms, it may also be indexed or restated to depreciated replacement
costs.
5. According to the Accounting Standards Board (1995, 7): “Two or more parties are related
parties when . . .
• one party has direct or indirect control over the other party
• the parties are subject to common control from the same source
AFIR_083-110_ch06.indd 108AFIR_083-110_ch06.indd 108 4/3/08 8:59:01 AM4/3/08 8:59:01 AM
109
Core Issues in Regulatory Accounting
6
• one party has infl uence over the fi nancial and operating policies of the other to the
extent that the other party might be inhibited from pursuing at all times its own sepa-
rate interests
• the parties, in entering a transaction, are subject to infl uence from the same source to
such an extent that one of the parties to the transaction has subordinated its own sepa-
rate interests.”
6. Ofwat indicates that appointees are to demonstrate that a cross-subsidy does not exist, per-
haps suggesting that a wide range of methodologies may be acceptable. A stand-alone or incre-
mental cost allocation model can ensure that no cross-subsidies exist, and it could be argued that
such a model refl ects a view of relative resource consumption.
AFIR_083-110_ch06.indd 109AFIR_083-110_ch06.indd 109 4/3/08 8:59:02 AM4/3/08 8:59:02 AM

AFIR_083-110_ch06.indd 110AFIR_083-110_ch06.indd 110 4/3/08 8:59:02 AM4/3/08 8:59:02 AM

111
Chapter 7
For clarity and transparency, international best practice recommends that the regulator publish regulatory accounting guidelines summariz-ing the regulator’s requirements, motivation, legal background, prin-ciples, and processes. These guidelines and the information they provide are discussed in the fi rst major section of this chapter. Regulatory pro-cesses require utilities and possibly other stakeholders to provide substan-tial volumes of information over long periods of time. The processes and mechanisms, competencies, tools, and time and methodology required for this exchange are covered in the chapter’s remaining sections.
7.1. Contents of regulatory accounting guidelines
Regulatory accounting guidelines (RAGs) usually include the following sections:
• purpose of the guidelines,
• legal basis and authorities,
• defi nitions of terms,
• general principles refl ected in preparation of the guidelines,
• principles for preparing regulatory accounting statements, and
• information reporting requirements.
This chapter’s annexes provide detailed templates for information reporting; pro
forma documents; and detailed methodologies for revenue and cost allocation,
asset valuation, calculation of cost of capital, and the like.
Scope of a Regulatory Accounting System
AFIR_111-134_ch07.indd 111AFIR_111-134_ch07.indd 111 4/3/08 9:03:34 AM4/3/08 9:03:34 AM

112
Accounting for Infrastructure Regulation: An Introduction
7
Purpose of regulatory accounting guidelines
RAGs defi ne principles and directives to be followed by the regulated operator in
preparing regulatory accounting. As described by the Essential Services Commis-
sion of Victoria (Australia; 2004), “The RAGs specify the Regulatory Body’s require-
ments for the collection, allocation and recording of business data by the Regulated
Operator and the reporting of that data to the regulatory Body.”1
RAGs usually open with the principles underlying regulatory accounting: sus-
tainability, productive and allocative effi ciency, and equity (distributive effi ciency).
For example, infrastructure regulators in the United Kingdom (Ofgem and others
2001) commonly cite the following objectives:
• Monitor performance against the assumptions underlying price controls
• Detect anticompetitive behavior (unfair cross-subsidization and undue
discrimination)
• Assist in monitoring the fi nancial health of the operator
• Set prices
• Assist comparative competition (by promoting the submission of comparable
information)
The fi rst three objectives are essential in regulatory practice. The fi rst two implic-
itly require an allocation of costs and revenues to
• verify that there is no discrimination among users of the regulated services,
• verify productive and allocative effi ciency, and
• look for evidence of possible cross-subsidization of services.
Regulators can add other more general or specifi c objectives. One might be to
improve transparency and help all parties to understand the regulator’s informa-
tion requirements and regulatory functions. Another objective might be to ensure
that regulated operators report to the regulator on a timely, consistent, structured,
and accurate basis.
Legal basis and authorities
The regulator’s (independent body or ministry department’s) rights and duties as
defi ned by laws or decrees must be identifi ed. By what legal authority is the regula-
tor issuing guidelines? What are the regulator’s powers of investigation, control, and
auditing? The issue of the legitimization of the regulatory process is addressed in
this chapter’s last section.
AFIR_111-134_ch07.indd 112AFIR_111-134_ch07.indd 112 4/3/08 9:03:34 AM4/3/08 9:03:34 AM

113
Scope of a Regulatory Accounting System
7
Disclosure and confi dentiality rulesA position should be taken on the following issues:
• What is the status of the information provided by the regulated operator to the
regulator?
• What kind of information should be kept confi dential, and in what circumstances
(acknowledging that some information might be commercially sensitive)?
• Can the regulator eventually decide to disclose any kind of information if it
thinks the information is in the public interest?2
RAGs should put in perspective the obligations of delivering regulatory account-
ing statements with other obligations imposed by law. For example, Essential Ser-
vices Commission of Victoria (2004, issue 3, clause 2.3.5) states the following in its
Electricity Industry Guidelines:
The Guidelines are minimum requirements. The obligation of a Licensee to com-
ply with the Offi ce’s Guidelines—
• Are additional to any obligation imposed under any other law applying to
the Licensee’s business; and
• Do not derogate from such an obligation.
This last issue could be a source of confusion. The utility may be subject to other
obligations (for example, general company legislation and corporate reporting)
under other laws. These provisions make it clear that regulatory reporting provi-
sions do not displace any other obligations and are not displaced by any other obli-
gations under other laws. This issue is considered again in the context of the con-
cept of precedence, which is examined below.
Revision, dates, and periodsRAGs should mention the following dates and periods:
• effective date of the RAGs’ implementation,
• delivery dates (within “x” days of the end of the regulated company’s fi nancial
year), and
• accounting periods to which the RAGs apply.
RAGs should acknowledge that they may be amended and expanded to meet the
changing needs of interested parties. Therefore, they should state how these changes
will occur and what process they will follow. Because transparency and consulta-
tion are key principles of all regulatory processes, it is advisable to create a working
AFIR_111-134_ch07.indd 113AFIR_111-134_ch07.indd 113 4/3/08 9:03:34 AM4/3/08 9:03:34 AM

114
Accounting for Infrastructure Regulation: An Introduction
7
group to establish RAGs and to include the relevant professional accounting asso-
ciation in the process.
A good formal conceptual process is adopted in the above-noted Electricity
Industry Guidelines. Whenever revising these guidelines, the Essential Services
Commission of Victoria (2004) states that it will
1. state its intention;
2. call for input from industry participants and other interested parties;
3. have regard to that input, develop a draft, and publish it for comment by
industry participants and other interested parties; and
4. have regard to the comments received on the draft, and develop and publish
a revised guideline.
Defi nitions of terms
As is common in contract design, RAGs should provide accurate defi nitions of all
terms they use.
General principles of preparation of the Regulatory
Accounting Guidelines
Several general principles apply in preparation of RAGs.
General accounting and allocation principlesThe general accounting and allocative principles most commonly listed in RAGs
are causality, objectivity, transparency, consistency, and materiality.
• Causality: Costs, revenues, and capital should be allocated to the activities (ser-
vices offered by the regulated operator) that cause those costs or revenues to arise
(see chapter 4). The accounting system used by the regulated operator should
allow verifi cation of the causality between the amount taken into account and the
activity (service). The Info-Communications Development Authority of Singa-
pore (2001) states what, in practice, the regulated operator will need to do:
• Review each cost and revenue item.
• Identify the process that caused the cost to be incurred or the revenue to be
earned (the driver).
• Use the driver to attribute the cost or revenue to the relevant product or ser-
vice and, accordingly, to the appropriate accounting separation segment.
• Objectivity: Allocation and valuation methodologies should not be designed in a
way that benefi ts the regulated operator or any other party. This principle should
AFIR_111-134_ch07.indd 114AFIR_111-134_ch07.indd 114 4/3/08 9:03:34 AM4/3/08 9:03:34 AM

115
Scope of a Regulatory Accounting System
7
be applied to identifi cation and treatment of costs to product, service, compo-
nent, business, or disaggregated business.
• Transparency: The allocation methodology chosen by the operator should allow
a breakdown analysis of the information for identifying types of costs, revenues,
and capital. Where changes are made, the operator should restate the previous
year’s separate accounts on the new bases. Any change in accounting policies has
to be explained in detail, and the effects have to be documented as well (in some
cases, an authorization of the regulator will be needed before the change is
implemented).
• Consistency: The bases of allocation of valuation should preferably be the same
from year to year. Any change should be motivated and documented.
• Materiality: An item is considered material if its omission, misstatement, or non-
disclosure has the potential to prejudice understanding of the fi nancial position
and nature of regulated business activities. To determine whether an item is mate-
rial, the nature and the amount of the item should be assessed and compared to
the regulated activity’s basic fi nancial fi gures, such as net worth, operating result,
revenues, and costs. Some regulators, such as Ofwat (2002a), specifi cally mention
a materiality threshold as a percentage of total income, costs, or profi ts.
Conformity of regulatory accounting with national accounting standardsRAGs should be considered obligations additional to any other general accounting
obligations imposed by law (publication of statutory accounts).3 RAGs usually require
information that is not normally provided under a country’s generally accepted
accounting principles. Nevertheless, where applicable, regulatory accounting principles
and policies should be adopted in compliance with national accounting standards.
Some guidelines also require an explicit reconciliation of general statutory
accounts and regulatory accounts, which also serves the objective of comparability
(Ofwat 2002a, clauses 3.4.2. and 3.4.3):
Where a Statutory Account amount has been consolidated or disaggregated in
the Regulatory Accounting Statements, a worksheet must accompany the Regu-
latory Accounting Statements reconciling the Statutory Account amount shown
in the Regulatory Accounting Statement to the Statutory Account amount in the
Statutory Accounts of the Entity.
The movement from Statutory Account to Regulatory Account will be clearly
reported in the Regulatory Accounting Statements.
RAGs should also address potential confl icts with national accounting standards
and take a position on whether these standards or RAGS take precedence. In the
AFIR_111-134_ch07.indd 115AFIR_111-134_ch07.indd 115 4/3/08 9:03:34 AM4/3/08 9:03:34 AM

116
Accounting for Infrastructure Regulation: An Introduction
7
United Kingdom, a working group on the Role of Regulatory Accounts in Regu-
lated Industries has indicated that RAGs should take precedence in the event of a
confl ict (Ofwat 2002a, footnote 1), whereas Ofwat’s (1992, 2003a) RAGs state that
“where the RAGs do not specifi cally address an accounting issue, then [UK] Gener-
ally Accepted Accounting Principles should be followed.”
Substance to prevail over legal formUK and Australian RAGs often state specifi cally that regulatory accounting state-
ments should report the commercial substance of transactions. Where substance
and form differ, the commercial substance rather than the legal form of a transac-
tion or event shall be reported.
Related-party transactions and third-party benefi tsThe treatment of related-party transactions is likely to be one of the most diffi cult
and controversial elements in the RAGs.
Related-party transactions. Related-party transactions (see chapter 6) occur
between the regulated operator and legal entities affi liated with it (holding compa-
nies, branches, or subsidiaries of the same group) or commercially linked to it
(through commercial agreements or common economic goals). The motivation for
identifying these transactions separately is to allow the regulator to assess whether
the transactions were recorded on a fair basis or under competitive conditions and
to ensure that there was no unreasonable transfer of profi ts between the parties or
between the operator’s regulated activities and unregulated activities.
The Independent Pricing and Regulatory Tribunal (IPART) of New South Wales
went into considerable detail in establishing the existence of related-party transac-
tions (IPART 2001). First, IPART proposed to assess the regulated businesses inde-
pendently of the legal structures used by the operators and bases its approach on
the concept of common economic goals. It defi ned a related party as “any business
that, operating with a Regulated Network Business or Regulated Retail Business,
pursues objectives that are consistent with those of the regulated business (termed
Common Economic Goals)” (IPART 2001). To establish the existence of common
economic goals, several factors were proposed: ownership structure, options to
purchase shares, control, decision-making capacity, economic dependence, inter-
company loans and guarantees, and tax optimization. When related parties are dif-
ferent legal entities, IPART defi ned the existence of the relationship as the holding
of 20 percent of voting rights or as the possibility of a party exercising “substantial
infl uence over the policies and actions of the regulated business even though the
AFIR_111-134_ch07.indd 116AFIR_111-134_ch07.indd 116 4/3/08 9:03:34 AM4/3/08 9:03:34 AM

117
Scope of a Regulatory Accounting System
7
infl uence is not based upon shareholding, shareholders, directors or offi cers”
(IPART 2001).
Most regulators require that the principles and policies for trading between the
regulated operator and related parties be documented. The regulator could even
propose that the regulated operator adopt specifi c methodologies for “transfer
pricing.”4 Regulators commonly use the following methodologies:5
• fully allocated costs,
• incremental pricing,
• prevailing market prices (through competitive tendering),
• tariff-based pricing,
• negotiated pricing, and
• asymmetric pricing.
Five methodologies are taken from the guidelines of the Organisation for Economic
Co-operation and Development (1995):
• comparable uncontrolled price,
• resale price,
• cost plus,
• profi t split, and
• transactional net margin method.
Third-party benefi ts. Transactions associated with subcontracting, purchasing, or
other arrangements that cause the regulated operator or any related party to enjoy
a materially benefi cial interest in income or another value that accrues to a third
party should be fully documented (value of transaction, description of arrange-
ment and its purpose, details of involved parties, and so on).
Directors’ responsibilityThe regulator requires that the regulated operator attach a directors’ responsibility
statement to the regulatory accounting statement. This statement confi rms that the
regulatory accounting statement is fairly presented in accordance with RAGs and
with regulatory and corporate legislation.6 Typically, at least two directors of the
regulated company sign and date the document.
AuditThe regulatory accounts provided by the regulated company will have to be audited
(see chapter 5). Debate about who should audit the regulatory accounts is ongoing.
AFIR_111-134_ch07.indd 117AFIR_111-134_ch07.indd 117 4/3/08 9:03:34 AM4/3/08 9:03:34 AM

118
Accounting for Infrastructure Regulation: An Introduction
7
In most cases, the auditors of the regulated operator’s statutory accounts will also
audit the operator’s regulatory accounts.
To verify compliance of the regulatory accounts statements with RAGs, the audi-
tor must understand the regulatory framework and the obligations derived from
the RAGs.7 The audit should be conducted in accordance with the auditing stan-
dards in force in the country.
RAGs will specify the procedure for appointment and acceptance of the auditor
(the auditor will have to be approved by the regulator).
The regulator can provide a pro forma regulatory audit report in the RAGs
annex.
Principles for preparing the regulatory accounting statements
Regulatory accounting statements are derived from the statutory accounts (the reg-
ulated operator should reconcile the amounts from the regulatory accounting
statements with the statutory accounts). The regulator will indicate how to treat
items related to unregulated activities, consolidated amounts, and disaggregated
items (which should be explicitly described in the “information requirements” sec-
tion), as well as items related to separation of activities (such as production, trans-
port, and distribution).
Cost and revenue allocationCosts and revenues should be allocated to the different services from which they
arise.8 To allocate the different account items on a causality basis, the operator must
identify one of the following relationships:
• a directly traceable cause-and-effect relationship with provision of the service;
• a verifi able relationship between the item and the output of the service; and
• a revenue or cost having a direct causal relationship with a pool of common
costs or revenues and allocation of that pool on the basis of a relevant, reliable,
and verifi able factor such as relative use.
Thus, regulated operators can attribute cost and revenues using the following
categories:
• direct or directly attributable revenues or costs (revenues or costs solely generated
by a particular service—for example, the cost of chemical products allocated to
water production),
• indirectly attributable revenues or costs (revenues or costs that are part of a pool
of common revenues or costs but that can be attributed to a particular service
AFIR_111-134_ch07.indd 118AFIR_111-134_ch07.indd 118 4/3/08 9:03:35 AM4/3/08 9:03:35 AM

119
Scope of a Regulatory Accounting System
7
through a nonarbitrary and verifi able cause-and-effect relationship—for exam-
ple, the cost of a team that performs maintenance on assets belonging to differ-
ent services), and
• unattributable revenues or costs (revenues or costs that are part of a pool of com-
mon revenues or costs and that cannot be attributed to a particular service, asset,
or function through a nonarbitrary and verifi able cause-and-effect relation-
ship—for example, administration or marketing costs).
Indirectly attributable revenues and costs will be allocated using an appropriate
“driver.” Nonattributable revenues and costs will be allocated using an appropriate
factor.
Revision of methodologiesThe regulator should make clear its right to change an allocation methodology that
it considers does not meet its information requirements.
Qualifi cation of costsQualifi cation of costs could be a source of misunderstanding for operators unfa-
miliar with regulatory environments. Operators may not understand why some
expenses, accepted from a statutory accounts or fi scal point of view, are not accepted
by a regulator. The main reason is that the regulator bases its decision on an eco-
nomic perspective and defends the interests of users. If the regulator judges, on a
rational and motivated basis, that some costs are imprudent, unnecessary, or ineffi -
cient, it would deem recovery of these costs though tariffs paid by users (see chapter
5) to be economically ineffi cient and would exclude the costs from the calculation
basis for future tariffs.
The rules for qualifying expenses proposed by the National Electricity Regulator
of South Africa (NER 2002) are illustrative:
1. Expenses must be incurred in an arms’-length transaction; where possible
suppliers are treated equally without prejudice.
2. Expenses must be incurred for the production and supply of electricity.
3. Expenses must be prudently incurred after careful consideration of avail-
able options.
4. Expenses must be incurred in the normal operations of the business. Where
an expense is incurred under abnormal or extraordinary circumstances,
consideration shall be given to spreading the expense over a number of years
to match the time periods over which the benefi t is derived.
5. The regulated entity shall have the onus to justify to the Regulator that the
expenses incurred conform to the above criteria.
AFIR_111-134_ch07.indd 119AFIR_111-134_ch07.indd 119 4/3/08 9:03:35 AM4/3/08 9:03:35 AM

120
Accounting for Infrastructure Regulation: An Introduction
7
6. The regulator shall have the fi nal discretion in allowing or disallowing an
expense based on the above criteria.
7. Expenses on research and development, charitable donations, lobbying
expenses and advertising may or may not be included, in part or as a whole,
as part of costs of supply at the regulator’s discretion.
8. The utility shall, in its price increase application, highlight all transactions
with subsidiaries and sister companies.
Regulatory asset baseThe regulator has to defi ne the regulatory asset base (treatment of capital work in
progress, inclusion of working capital, and the like). The regulatory asset base should
include all assets necessary for effi cient provision of the service. Long- or short-term
fi nancial investments, for example, will be excluded from the regulatory asset base.
The regulator must also defi ne
• the cost accounting principles (current cost accounting, historical cost account-
ing, modern asset equivalent, market value; see chapter 6) to be used to deter-
mine asset values,
• depreciation policies for the regulatory asset base (see chapter 6), and
• its position toward revaluation of assets and goodwill or intangible assets.
The regulator should state that it has the ability to exclude some parts of the
capital base of the regulated services if it considers that the parts are not necessary,
effi cient, or prudent.
Information (reporting) requirements
The information requirements section of RAGs defi nes the contents and structure
of regulatory fi nancial statements and repeats the accounting periods and delivery
dates.
RAGs will impose a specifi c format of presentation. Ideally, the regulator pro-
vides the operator with an electronic worksheet each year for setting out detailed
statements. The worksheet stores historical data and requests medium-term (usu-
ally fi ve-year) projections of revenues, costs, capital expenditures, and other items
(see this chapter’s annexes for examples of reporting templates).9
RAGs will indicate the level of disaggregation of items as well as the main asset
categories, activity areas, and cost categories. In addition, they will provide instruc-
tions on how to identify and treat specifi c items, such as customer contributions,
tax effects, and related-party transactions.
AFIR_111-134_ch07.indd 120AFIR_111-134_ch07.indd 120 4/3/08 9:03:35 AM4/3/08 9:03:35 AM

121
Scope of a Regulatory Accounting System
7
The following is an example of a standard structure proposed for regulatory
fi nancial statements (Essential Services Commission 2004, issue 3): (1) profi t and
loss statement, (2) balance sheets, (3) revenue data (by tariff class and customer
type, by region), (4) operating and maintenance expenditure, (5) capital expendi-
ture, (6) fi xed assets and depreciation (book values, tax values, regulatory values),
(7) interest rates and borrowings, and (8) nonfi nancial data (general operating sta-
tistics and indicators, technical, physical, commercial).
Box 7.1 provides a list of the RAGs issued by Ofwat.
7.2. Information exchange processes
Detailed information is required to ensure that
• operators do not earn excessively high or excessively low profi ts,
• operations are run effi ciently (run with allocative and productive effi ciency),
and
• users and all participants in the sector are treated fairly.
Box 7.1. Ofwat’s Regulatory Accounting Guidelines
The Offi ce of Water Services (Ofwat), the economic regulator for the water and sewerage industry in England and Wales, lists the following docu-ments in its RAGs:
• RAG 1: Guideline for accounting for current costs and regulatory capital values [version 1.03 of January 2003]
• RAG 2: Guideline for classifi cation of expenditure regulatory accounting guideline [version 2.03 of January 2003]
• RAG 3: Guideline for the contents of regulatory accounts [version 3.05 of January 2003]
• RAG 4: Guideline for the analysis of operating costs and assets [version 4.02 of January 2003]
• RAG 5: Transfer pricing in the water industry [version 5.03 of April 2000]
Source: www.ofwat.gov.uk (publication section).
AFIR_111-134_ch07.indd 121AFIR_111-134_ch07.indd 121 4/3/08 9:03:35 AM4/3/08 9:03:35 AM

122
Accounting for Infrastructure Regulation: An Introduction
7
This section focuses more specifi cally on information exchanges between the
regulator and other parties, while also addressing relationships with the regulated
operators (see fi gure 7.1).
Because its role is to defend the interests of all parties, the regulator can occupy
a critical position in information exchange, but the regulator’s precise role will
depend on the design of the regulatory framework and methodologies. The regula-
tor can play a credible and effi cient role only in the following circumstances:
• Its role, rights, and obligations are legally defi ned and enforced.
• It is independent.
• It has the fi nancial capacity and the specialized competencies to perform its role.
• It has clear and transparent processes for information exchange, validation of
information, and dispute resolution.
The Utility Regulators Forum of Australia (1999) has listed nine best-practice regu-
lation principles: communication consultation, consistency (across market partici-
pants and over time), predictability (reputation that facilitates planning by players)
fl exibility, independence, effectiveness and effi ciency (cost-effectiveness empha-
sized in data collection and policies), accountability (clearly defi ned processes and
rationales for decisions, with appeals), and transparency (openness of the process).
Eventually, adherence to these principles will reduce the regulatory risk that fi gures
in operators’ perception of the cost of capital.
Figure 7.1. Information exchanges between regulator and regulated operators and other parties
Source: Authors.
Ministries Operators
Regulator
Users
AFIR_111-134_ch07.indd 122AFIR_111-134_ch07.indd 122 4/3/08 9:03:35 AM4/3/08 9:03:35 AM

123
Scope of a Regulatory Accounting System
7
Institutional issues are not covered here, but it should be clear that the regulator
should avoid political interference and that its role should be clearly defi ned.
Accountability, communication and dissemination, consultation, and transparency
are key principles in information exchange.
Accountability
Information exchange processes have to be clearly defi ned, both the operator’s obli-
gations regarding the delivery of information and the regulator’s obligations to
operators and other involved parties (fi gure 7.2).
A formal process for communication and dissemination of information should
include explicit deadlines, consultation periods, and dispute resolution processes.
Deadlines Clear deadlines should be specifi ed for
• formatted and scheduled information, x days after the end of the month, quar-
ter, or year, depending on the nature of information;
• responses to questions, x days after question was raised;
• publication of main decisions; and
• reactions to consultation documents or fi nal decisions.
Figure 7.2. Accountability of regulator and operator in the information exchange process
Source: Authors.
Operators and other interested parties
Regulator
Operator Regulator
• Should follow formal processes• Should comply with RAGs• Should document information,
which should be clearly motivated
Regulator Operator
• Should follow formal processes• Should favor consultation and
dissemination of information• Should document decisions,
which should be clearly motivated
AFIR_111-134_ch07.indd 123AFIR_111-134_ch07.indd 123 4/3/08 9:03:35 AM4/3/08 9:03:35 AM

124
Accounting for Infrastructure Regulation: An Introduction
7
Consultation periodDuring the consultation period, the various parties will have an opportunity to
provide comments on the document made available for consultation by the regula-
tor. The regulator will have to respond to each comment.
Dispute resolutionDisputes should be resolved in a reasonable timeframe.10 Disputes can be resolved
by litigation in court, arbitration, or alternate procedures (such as structured nego-
tiations between parties; mediation involving a neutral third party; mini-trials with
a hearing before a neutral legal adviser, such as a retired judge; or an expert deter-
mination). Arbitration and alternative dispute resolution procedures are common
for managing confl icts for several reasons:
• Confl icts among operators, government, and regulators usually require consid-
erable technical expertise. Compared with judges, arbiters with such expertise
can be easier to fi nd.
• Procedures (including the use of “fast track” mechanisms) are more fl exible and
convenient in arbitration and alternate dispute resolution than in national courts.
• Confi dential information is better protected.
Applying appropriate dispute resolution procedures can save money and time.
Procedures should be well designed, clear, simple, and transparent to all parties,
and they should take place within a reasonable timeframe. Affordability is impor-
tant. The expense of arbitration by international courts or organizations (in the
millions of dollars) can penalize or discourage some parties.11
Communication and dissemination
The information gathered by the regulator should be public and at the disposal of
consumers and other interested parties. The only constraint to availability should
be specifi c confi dentiality rules on commercially sensitive information or obliga-
tions derived from national information acts. (RAGs will address this matter and
defi ne criteria for confi dentiality.) For dissemination of information, the regulator
should use
• the Internet (to post reports, laws, decrees, resolutions, opinions, and decisions;
see examples of electric utility Web sites in box 7.2),
• an open library on its premises, and
• public audiences and press conferences.
AFIR_111-134_ch07.indd 124AFIR_111-134_ch07.indd 124 4/3/08 9:03:35 AM4/3/08 9:03:35 AM

125
Scope of a Regulatory Accounting System
7
Consultation
Interested parties should be allowed to participate in regulatory decisions. Use of
discussion documents is recommended. When planning to take important decisions
on major regulatory topics (regulatory regime, tariff determination, accounting
Box 7.2. Examples of utility regulator Web sites with substantial information
Europe
Ofwat (water, United Kingdom): www.ofwat.org.uk
Asia
Energy Regulatory Commission (electricity, Philippines): www.erc.gov.ph
Oceania
Independent Pricing and Regulatory Tribunal (multisector, Australia): www.ipart.nsw.gov.au
Essential Services Commission (multisector, Australia): www.reggen.vic.gov.au
Africa
Autorité de Régulation (multisector, Mauritania): www.are.mrNational Energy Regulator (electricity, South Africa): www.ner.org.zaElectricity Regulatory Board (electricity, Kenya): www.erb.go.keCommission de Régulation du Secteur de l’Electricité (electricity,
Senegal): www.crse.sn
Latin America
Brazilian Electricity Regulatory Agency (energy, Brazil): www.aneel.gov.brEnte Nacional Regulador de la Electricidad (electricity, Argentina):
www.enre.gov.arSuperintendencia Nacional de Servicios de Saneamiento (water and
sanitation, Peru): www.sunass.gob.peOrganismo Supervisor de la Inversion en Energia (energy, Peru):
www.osinerg.gob.peSuperintendencia de Servicios Sanitarios (water and sanitation, Chile):
www.siss.cl
Source: Authors.
AFIR_111-134_ch07.indd 125AFIR_111-134_ch07.indd 125 4/3/08 9:03:35 AM4/3/08 9:03:35 AM

126
Accounting for Infrastructure Regulation: An Introduction
7
guidelines), the regulator should fi rst seek the opinions of involved parties (opera-
tor, ministries, users associations) in consultation meetings. It should then draft a
consultation document on the topic, which should be made public (through letters
to parties and Web posting). Involved parties should have a specifi ed period in which
to comment on the document. The regulator should then make public all comments
and its reactions. After a second round of reactions and possible adjustments, deci-
sions can be taken or formally challenged. Figure 7.3 summarizes this process, and
box 7.3 provides an example of the process for revision of a regulatory framework.
Figure 7.3. Regulatory decision-making process
Source: Authors.
Regulator in interaction with other parties (ministries, operators, users).
Thinking about problems and solutions.
RegulatorInitial draft proposal: “Discussion document.”
Meetings and interactions between regulator and involved parties.
Regulator publishes and disseminates comments of all parties, along with its own position.
Parties still do not agree: dispute resolution mechanism.
Parties agree:implementation.
Regulator disseminates document.
All parties involved make detailed comments.
Second round of comments on regulator’s position.
Regulator publishes and disseminates final document.
AFIR_111-134_ch07.indd 126AFIR_111-134_ch07.indd 126 4/3/08 9:03:36 AM4/3/08 9:03:36 AM

127
Scope of a Regulatory Accounting System
7
Box 7.3. Example of consultation process: Revision of the regulatory framework for the economic regulation of the electricity supply industry of South Africa
Eskom dominates the electricity industry in South Africa. It supplies about 96 percent of South Africa’s requirements. Eskom owns and controls the high-voltage transmission grid and supplies about 60 percent of electricity directly to customers; 177 local authorities (most of which purchase their energy and services from Eskom) supply the other 40 percent.
2001
National Electricity Regulator (NER) introduces a rate-of-return methodology to regulate the national electricity operator, Eskom. NER decides to refi ne its approach and prepares a proposal of detailed regulatory methodologies.
July 2002
NER produces the “Regulatory Framework for the Economic Regulation of the ESI [Electricity Supply Industry] of South Africa: A Discussion Docu-ment.” NER later recognizes the document as “the fi rst formal economic regulatory document in the history of the South African ESI” and as “a milestone in the development of robust regulatory methodologies for reg-ulation in South Africa” (NER 2002).
August 2002
The document is approved for public comment by NER’s board and is posted on NER’s Web site. Comments are invited until December 2002.
December 2002
NER extends the deadline for comments to February 28, 2003.
February 2003
NER receives submissions from 11 organizations: Eskom, the Energy Intensive User Group, municipalities, PB Power, the Chamber of Mines of South Africa, and consultants.
May 2003
NER consolidates all comments in a summary document, “Summary of Comments of the Regulatory Framework for the Economic Regulation of the ESI of South Africa: A Discussion Document.” It sends the document to stakeholders with an invitation to participate in a workshop to discuss the comments and to fi nd “a consensus view on the most controversial issues.”
Source: Authors.
AFIR_111-134_ch07.indd 127AFIR_111-134_ch07.indd 127 4/3/08 9:03:36 AM4/3/08 9:03:36 AM

128
Accounting for Infrastructure Regulation: An Introduction
7
Transparency
Clear rules add to the transparency of the process and reduce regulatory risk. In
addition, they discourage any party from taking advantage of the weaknesses of a
specifi c process to delay fi nal decisions.12
7.3. Need for competencies, tools, and time and methodology
Analysis and validation of the operator’s data and assessment of the operator’s effi -
ciency will likely require considerable interaction between the regulator and the
operator. Clear rules for asking questions, exchanging comments, and taking deci-
sions for tariff determination are required.
The large volume of data to record, process, and analyze will require competen-
cies, tools, and time and methodology, each of which is discussed below.
Competencies
The regulator will have to analyze data of various types, including technical, fi nan-
cial, economic, social, environmental, and legal. This task will require assembling a
staff with diversifi ed skills, which may be diffi cult in developing countries. The
organization of a regulatory authority is beyond the scope of this volume, but as a
general principle, regulators should focus on issues that have a substantial impact
on the rate of return of the concession and on effi ciency and not on every manage-
ment detail.13
Tools
Processing a large volume of data and information requires appropriate tools. Two
are especially important: the economic-fi nancial model and business information
systems (knowledge database).
Models (see annex 2) are useful for tariff determination and arbitrage quantifi ca-
tion, and the process of feeding the model with inputs will reveal any missing data.
Infrastructure concessions have a long life. During that time, the regulator will
need to record and store crucial information of various kinds:
• historical data on operators;
• historical market data;
AFIR_111-134_ch07.indd 128AFIR_111-134_ch07.indd 128 4/3/08 9:03:36 AM4/3/08 9:03:36 AM

129
Scope of a Regulatory Accounting System
7
• contracts and annexes;
• laws, decrees, and resolutions related to the concession;
• regulatory guidelines;
• regulatory decisions; and
• all mail exchanged between interested parties, including comments, motiva-
tions, and justifi cations of issues raised.
Setting up an organized database with search engines on keywords will help regula-
tors manage this information and preserve the knowledge.
Time and methodology
The regulator will have to process the data. As discussed above, regulation should
be based on participation and collaboration, requiring time for the exchange of
views, validation of key data and plans, and so on. Periodic tariff determination, in
particular, requires years of advance work.
Consider Ofwat’s 2004 periodic tariff review, a well-defi ned process that requires
two years. Ofwat manages the review as a project requiring substantial resources
from many stakeholders.14 Figure 7.4 shows Ofwat’s general planning for the tariff
review. Box 7.4 provides details of Ofwat’s planning process.
Ofwat’s sophisticated procedures require substantial resources (time, money,
competencies). Regulators in developing countries with few resources have to make
their choices on the basis of their capacity, environment, and priorities. Neverthe-
less, their workload will be heavy, and major deadlines such as those for tariff deter-
minations should be anticipated well in advance.
Figure 7.4. Ofwat’s general planning schedule for tariff review
Source: Authors.
2002
Q3 Q4 Q1 Q2 Q3 Q4 Q1 Q2 Q3 Q4 Q1
2003 2004 2005
Framework and issues
Assessment of draft business plans and market research
Decisions and determinations
Implementation
AFIR_111-134_ch07.indd 129AFIR_111-134_ch07.indd 129 4/3/08 9:03:36 AM4/3/08 9:03:36 AM

130
Accounting for Infrastructure Regulation: An Introduction
7
Box 7.4. Ofwat’s 2004 tariff periodic review
The four phases in fi gure 7.4 are broken down into more detail here.
Phase 1: Framework and issuesConsultation on approach to review, input from ministries, and publica-tion of results of negotiation:
• Oct. 2002: open consultation on Ofwat’s approaches to the 2004 review
• Nov. 2002: market research stage 1 and publication of report• Dec. 2002: receive initial guidance (on environmental and water
quality improvement and social issues) from ministers• Jan. 2003: consultation period ends• March 2003: publish decisions on Ofwat’s approach to the review• May 2003: release update of fi nancial model, issue draft business
plan, publish feedback on cost base submissions (comparisons among operators made possible), confi rm reference assumptions
Phase 2: Assessment of draft business plans and market researchMeetings with operators, annual reports, business plan proposals, feed-back from regulator, and consultation with consumers’ association:
• May–June 2003: Ofwat meets operators to prepare business plan• June 2003: operators submit 2003–04 annual reports• Aug. 2003: operators submit draft business plans• Oct. 2003: publication identifi es issues emerging from draft
business plans• Nov. 2003: Ofwat meets WaterVoice (consumers’ association) to
hear view on draft business plans• Dec. 2003: operators receive details of 2005–06 programs;
Ofwat publishes results of joint customer research• Jan. 2004: ministers provide fi nal guidance on the required qual-
ity program
Phase 3: Decisions and determinationsFinal business plan, decisions project, annual reports, reactions from opera-tors and users, publication of fi nal tariffs, and fi nal meetings with operators:
(continues)
AFIR_111-134_ch07.indd 130AFIR_111-134_ch07.indd 130 4/3/08 9:03:36 AM4/3/08 9:03:36 AM

131
Scope of a Regulatory Accounting System
7
7.4. Legitimizing the regulatory methodology
The regulatory methodology is a set of principles, rules, and processes that include
• regulatory objectives,
• the regulatory regime (rate of return, price cap, yardstick competition, hybrid),
• RAGs,
• topics related to tariff determination (determination itself, review dates, tariff struc-
ture, indexation formulas, cost pass-through, tariff stabilization mechanisms), and
• dispute resolution mechanisms for different categories of disputes.
This methodology should be legally enforced, whether in legislation or in the con-
tract between the operator and the government (the regulator neither is nor should
be a party to the contract).
Primary legislation (laws) is generally used to establish the broad framework of
the infrastructure and to defi ne the general objectives of the regulatory methodol-
ogy. Secondary legislation (decrees, resolutions) is used for more detailed decisions.
• April 2004: operators submit fi nal business plans• June 2004: operators submit June returns, annual reports 2003–04• July 2004: draft determinations published for consultation• Sept.–Oct. 2004: ministers fi ne tune their decisions; Ofwat meets
operators and other parties (points of view on determinations)• Nov. 2004: Ofwat publishes fi nal determinations• Nov.–Jan. 2005: operators have two months to decide whether
to accept or challenge price limits
Phase 4: Implementation
• March 2005: operators publish monitoring plans against which Ofwat will check progress annually
• April 2005: new price limits come into effect
Source: Authors.
Box 7.4. (continued)
AFIR_111-134_ch07.indd 131AFIR_111-134_ch07.indd 131 4/3/08 9:03:36 AM4/3/08 9:03:36 AM

132
Accounting for Infrastructure Regulation: An Introduction
7
The primary legislation should include principles similar to the four main regu-
latory objectives:
• fi nancial sustainability (just and reasonable rate of return),
• allocative effi ciency (prices refl ecting costs),
• productive effi ciency (minimization of costs over time), and
• equity (nondiscrimination).
Including more details of the regulatory methodology in the primary legislation
could enhance the methodology’s credibility or power, but the resulting loss of fl ex-
ibility could increase the diffi culty of implementing future changes. Thus details are
preferably handled through secondary legislation or decisions of the regulator.
The regulatory methodology should be suffi ciently enforced by (1) defi nition of
the general principles in the primary legislation and (2) mentions in legislation or in
the contract that the regulator will use regulatory tools such as models, defi ne RAGs
that should be applied by operators, and defi ne processes for exchanging and vali-
dating information. The legislation should mention that regulatory decisions will be
made after consultation with interested parties.
In brief, the foundation of the legal status of the regulatory methodology will
always be the four main regulatory objectives, but to reinforce the practical imple-
mentation of that methodology, clear reference should be made in the legislation or
the contract to tools and processes to be developed by the regulator.
Additional reading and resources
Essential Services Commission, Victoria. 2004. “Electricity Industry Guideline No. 3: Regula-
tory Information Requirements.” Essential Services Commission, Victoria, Australia. www.esc.
vic.gov.au.
NER (National Energy Regulator). 2002. “Regulatory Framework for the Economic Regula-
tion of the Electricity Supply Industry of South Africa: A Discussion Document.” Pricing and
Tariff Department, NER, Pretoria. www.ner.org.za.
Ofwat (Offi ce of Water Services). 2002. “The Review of Regulatory Accounting Guidelines: A
Second Consultation Paper.” Ofwat, London. www.ofwat.gov.uk.
———. 2003. “Regulatory Accounting Guideline 1.03, 2.03, 3.05, 4.02 and 5.03.” Ofwat, Lon-
don. www.ofwat.gov.uk.
Rosso, D. J., and C. S. Dorgan. 2002. “Arbitration and Dispute Resolution in the Electricity
Industry.” Power Economics 6 (6): 24–27.
AFIR_111-134_ch07.indd 132AFIR_111-134_ch07.indd 132 4/3/08 9:03:36 AM4/3/08 9:03:36 AM

133
Scope of a Regulatory Accounting System
7
Utility Regulators Forum, Australia. 2002. “National Regulatory Reporting for Electricity Dis-
tribution and Retailing Businesses.” Discussion paper, Utility Regulators Forum, Melbourne,
Australia.
———. 1999. “Best Practice Utility Regulation.” Discussion paper, Utility Regulators Forum,
Melbourne, Australia.
Notes
1. Formerly, the commission was the Offi ce of the Regulator-General Victoria.
2. Information acts or other laws governing statistical information could serve as a guideline
for treatment of confi dential information.
3. Statutory accounts will usually include a company board’s report, an auditor’s report, a
profi t and loss account, and a balance sheet. Most countries authorize smaller companies to pub-
lish abbreviated reports. Public companies, quoted on a stock exchange, will usually face addi-
tional disclosure requirements.
4. IPART summarizes these methodologies and their use by regulators in appendix 3 of its
“proposal of accounting separation code” (footnote 10).
5. For example, the National Association of Regulatory Utility Commissioners in the United
States recommends the prevailing market price or the fully allocated costs methodology.
6. Most RAGs annex a pro forma statement to be used by the regulated operator.
7. Finding auditors with knowledge of utility regulations can be a problem in some develop-
ing countries.
8. The regulator and the regulated operator must clearly defi ne the list of services (on the basis
of a general separation of unregulated services from regulated services and a disaggregation of the
latter).
9. In the Argentine gas sector, the information sent by the companies to the regulator has the
status of a sworn affi davit. Companies have two months to send any revisions, and after that the
information is taken as fi nal. Errors or misrepresentation can result in fi nes (which are clearly
stated in the rules).
10. This section is based on Rosso and Dorgan (2002).
11. The International Chamber of Commerce (ICC) in Paris, for example, is used as an arbiter
in many concession contracts (see www.iccwbo.org/index_court.asp).
12. An operator could attempt to take advantage of a political situation (election year, change of
staff of the regulatory authority) that might favor its position, or a regulator or government could
attempt to take advantage of coming changes in the business strategy of the operator’s group.
13. For more detail on this topic, see Smith (1997), Kerf and Geradin (2000), and Kerf (2000).
14. See “Timetable for 2004 Periodic Review” (www.ofwat.co.uk).
AFIR_111-134_ch07.indd 133AFIR_111-134_ch07.indd 133 4/3/08 9:03:36 AM4/3/08 9:03:36 AM

AFIR_111-134_ch07.indd 134AFIR_111-134_ch07.indd 134 4/3/08 9:03:36 AM4/3/08 9:03:36 AM

135
Annex 1
Accounting is aimed at recording all of a fi rm’s economic facts, but it implies more
than fi nancial statements. Analysis of the information in these fi nancial statements
can identify key relationships and trends underlying the fi rm’s economic and fi nan-
cial performance. Stakeholders interested in the company’s business (shareholders,
investors, credit institutions, staff) can use the branch of accounting known as
“analysis and interpretation of fi nancial statements” to assess the company’s perfor-
mance across periods (horizontal analysis) or against other businesses or sectors
(vertical analysis) when they engage in investment, fi nancial, and business deci-
sion-making processes.
The most widely used technique in the analysis of accounting and fi nancial data
is ratio analysis, which provides insight into a specifi c aspect of the fi rm’s perfor-
mance that may be related to the fi rm’s liquidity, activity, capital structure, or prof-
its and profi tability.
In addition, fi nancial analysts generally use two criteria to assess the reasonabil-
ity of a fi nancial ratio: a trend analysis, to assess performance over time, and a verti-
cal analysis, to compare the company’s fi nancial ratios with those of similar busi-
nesses or industry averages. In a trend analysis, the macroeconomic context of the
company’s business is an important consideration—for instance, businesses often
operate with less liquidity in a high-infl ation context than in a more stable situa-
tion—because this element may bias an indicator’s interpretation over time. In
trend analysis and vertical analysis, the ratios are meaningful only when compared
with reference points, whether of other periods or with the levels found in other
businesses in the same or a similar industry.
Understanding Financial Statements: Ratio Analysis
AFIR_135-140_annex01.indd 135AFIR_135-140_annex01.indd 135 4/3/08 9:04:37 AM4/3/08 9:04:37 AM

136
Accounting for Infrastructure Regulation: An Introduction
A1
Liquidity ratio analysis
Liquidity analysis concentrates on the short run, for no longer than a year’s time
from each year-end. Financial ratios in this category measure the ability of a com-
pany to meet its current obligations as they come due. These obligations are part
of the company’s liabilities and, in general, they exceed the company’s cash
resources.
Current ratio
The money to meet the company’s current liabilities is generated from the compa-
ny’s current assets—out of the company’s own liquid reserves, plus temporary
investments, plus accounts receivable and inventories. One of the fi rst measures of
liquidity is this current or global liquidity ratio, which is calculated with the follow-
ing formula:
Current ratio = current assets / current liabilities.
This ratio shows the number of monetary units of current assets that fi nance
each unit of current liabilities. A ratio below 1 is usually evidence of diffi culties.
A much higher value does not necessarily indicate a positive situation; it might be
evidence, for instance, that the fi rm is giving large credits to its customers.
Acid test
Like the current ratio, the acid test is a static index. It is calculated at year-end,
although from a more restrictive point of view than the current ratio. The acid test
indicates the company’s immediate ability to pay its debts, which strongly indicates
its liquidity. The acid test ratio is calculated as follows:
Acid test = (cash + temporary investments + accounts receivable) / current liabilities.
A value near 1 means that the company can meet its current liabilities with its
available assets or assets readily convertible into cash.
AFIR_135-140_annex01.indd 136AFIR_135-140_annex01.indd 136 4/3/08 9:04:38 AM4/3/08 9:04:38 AM

137
Understanding Financial Statements: Ratio Analysis
A1
Activity ratios
Activity ratios represent a measure of operative effi ciency in the use of a company’s
resources.
Accounts receivable turnover ratio
The ratio of accounts receivable to turnover shows the number of days it takes cus-
tomers to pay their bills. The greater the number of days, the higher the delinquency
rate seen in customers’ payment habits. The lower the number of days, the better
for the company, because its resources will not result in idle investments in accounts
receivable, which usually generate a low rate of return. The accounts receivable
turnover ratio is calculated as follows:
Accounts receivable turnover = accounts receivable / daily credit sales,
where daily credit sales is calculated as
Daily credit sales = net credit sales per period / days in period.
The collection term may vary from company to company, depending on trading
practices. Thus, a typical collection term in sales conditions would be 30 days,
although this term depends on the industrial sector in which the company oper-
ates. A higher ratio for accounts receivable may indicate a problem with the compa-
ny’s credit policy. In addition, it may imply that the company is competitively weak
and, therefore, that it needs to offer longer collection terms.
Inventory turnover ratio
The inventory turnover ratio indicates the time it takes to sell inventory—that is,
the time before the goods are converted into cash. This ratio is calculated in the fol-
lowing manner:
Inventory turnover = (cost of goods sold / average inventory).
AFIR_135-140_annex01.indd 137AFIR_135-140_annex01.indd 137 4/3/08 9:04:38 AM4/3/08 9:04:38 AM

138
Accounting for Infrastructure Regulation: An Introduction
A1
To assess whether the resulting ratio is appropriate, analysts should compare it
with another company in the same industry. If the ratio is too high, it may be evi-
dence of a low inventory turnover, which might result in lost sales. A low ratio could
be evidence of inventory obsolescence, which will clearly depend on the sector in
which the company operates.
Accounts payable turnover ratio
The accounts payable turnover ratio indicates the time it takes the company to meet
its obligations. This ratio is calculated as follows:
Days in accounts receivable = accounts payable / daily cost of goods sold.
The daily cost of goods sold is calculated as follows:
Daily cost of goods sold = cost of goods sold / days in period.
If the number of days the company takes to pay its accounts payable exceeds the
ordinary credit terms (for instance, 30 days), the company may be too confi dent in
suppliers’ attitudes and may lose the discounts available for prompt payment,
though the right value of this ratio will generally depend on the sector of the indus-
try in which the company does business.
Capital structure (leverage ratios)
Capital structure ratios measure the relative position of equity owners compared
with that of a company’s lenders. One such ratio is the debt-to-equity ratio, mea-
sured as follows:
Debt-to-equity ratio = total liabilities / owners’ equity.
This ratio measures the combination of funds in the company’s net worth fi nan-
cial situation (funds-fi nancing assets) and is used to compare the capital invested
by the company’s owners (shareholders) with the funds provided by lenders. As a
general rule, the higher the ratio, the greater the risk that the company may experi-
ence diffi culties in repaying loans and meeting its liabilities.
AFIR_135-140_annex01.indd 138AFIR_135-140_annex01.indd 138 4/3/08 9:04:38 AM4/3/08 9:04:38 AM

139
Understanding Financial Statements: Ratio Analysis
A1
No general agreement on an adequate value for this ratio exists, but in general a
value higher than 1 is considered risky. However, if a company generates profi ts and
has relatively stable cash fl ows, such a value may be considered acceptable, whereas
it would not be for a fi rm with highly volatile profi ts. Typical debt-to-equity ratios
vary substantially among industries, and ratios above 1 are more common in the
utility sectors, in which business risk is comparatively low.
The debt-to-equity ratio is often used together with an indicator called interest
coverage, which alerts analysts when net interest (if negative) starts to represent a
signifi cant part of a company’s profi ts.
Profi ts and profi tability
Profi tability ratios are used to measure management’s ability to generate profi ts and
to analyze their relation with the company’s overhead. Although various indicators
are used to measure profi tability, this section presents the ones most frequently
obtained from a company’s fi nancial statements.
Gross margin ratio
The gross margin represents the difference between sales and the cost of goods sold;
it is calculated as follows:
Gross margin ratio = gross margin / total sales.
This ratio expresses the extent to which profi ts depend on a company’s opera-
tions. An increase of the gross margin means that the company is more effi cient—
that the share of sales represented by its costs is decreasing.
Net margin
The net profi t ratio shows the share of the company’s sales that is turned into prof-
its. This ratio is calculated as follows:
Net profi t margin ratio = net profi t of fi scal year / total sales.
In general, the higher this indicator, the more effi cient the company is in producing
and selling goods and services.
AFIR_135-140_annex01.indd 139AFIR_135-140_annex01.indd 139 4/3/08 9:04:38 AM4/3/08 9:04:38 AM

140
Accounting for Infrastructure Regulation: An Introduction
A1
Return-on-assets ratio
The return-on-assets ratio, widely used in corporate fi nance analysis, enables evalu-
ation of management’s ability to generate a reasonable return on assets, regardless
of whether the assets were fi nanced by debt or equity. Investment opportunities for
the company’s capital are many; therefore, obtaining the best return possible,
according to the appropriate commercial risks, is necessary. The most commonly
used calculation formula is the following:1
Return on assets % = (net profi t of fi scal year / average total assets × 100).
This indicator is highly sensitive to the capital requirements of each sector.
Therefore, comparison of this indicator for businesses in the same industry sector
is recommended.
Return-on-equity ratio
The return-on-equity ratio considers only the return obtained by management on
shareholders’ investment (owners’ equity) rather than on the whole company’s
capital, as with return on assets.
“Return” for shareholders is the business’s net profi t. Therefore, return on equity
is calculated as follows:
Return on equity % = (net profi t before taxes / average owners’ equity × 100).
A high return on equity implies high prices for the shares of stock, which not
only eases the capture of new funds, but also puts the company in a better condition
to grow.
Note
1. Analysts commonly assume that calculation of net profi ts takes into account the tax shield
generated by interest payment.
AFIR_135-140_annex01.indd 140AFIR_135-140_annex01.indd 140 4/3/08 9:04:38 AM4/3/08 9:04:38 AM
141
Annex 2
This annex provides an introduction to the design and uses of fi nancial and eco-
nomic models to quantify transparently the impact of regulatory decisions. It draws
on the lessons from developed countries and developing countries in ordinary and
extraordinary revisions in the context of contract renegotiations.
The most effective regulators in developing countries follow remarkably similar
approaches. They essentially rely on UK-type regulatory processes adapted to local
constraints and concerns. The main common element is use of relatively simple
quantitative models of operators’ behavior and constraints to measure the impact
of regulatory decisions on some key fi nancial and economic indicators of concern
to operators, users, and government.
To simplify, these models force regulators to recognize that, in the long run, pri-
vate operators need to at least cover their opportunity cost of capital, including the
various types of risks specifi c to the country, sector, and projects in which they are
involved. Because these variables change over time, revisions that allow adjustment
in the key determinants of the rate of return for the operator are needed. These
revisions must refl ect recognition that all tariffs, subsidies, quality, investments, and
other service obligations are interrelated, and that they jointly determine the rate of
return. At every revision, the rules of the game for the regulator are exactly the
same: fi guring out the changes in the cost of capital and adjusting the variables
driving the rate of return to ensure that it remains consistent with the cost of
capital.
These models have to be based on sound data collection processes for each of the
key decision indicators. If the models can draw on reasonable data, they do every-
thing any fi nancial model would do for day-to-day management of a company, as
Regulatory Model
This annex is drawn from Estache and others (2002).
AFIR_141-154_annex02.indd 141AFIR_141-154_annex02.indd 141 4/3/08 9:07:06 AM4/3/08 9:07:06 AM

142
Accounting for Infrastructure Regulation: An Introduction
A2
well as take a longer-term view and explicitly identify the key regulatory instru-
ments. They can help regulators monitor the consistency between cash fl ow gener-
ated by the business, on the one hand, and debt service and operational expense
needs, on the other, to address the main concerns of operators. They can also
account for many key policy factors, including access and affordability concerns for
various types of consumers. They generally account for the sensitivity of operators
and users to various regulatory design options.
What are regulatory models?
Regulatory models are essentially “improved” fi nancial models designed to provide
a rigorous analytical tool to allow regulators to address their most predictable con-
cerns in a consistent way. They calculate the internal rate of return (just as a fi nan-
cial model would), accounting for all contractual constraints imposed on opera-
tors. In particular, they allow the regulator to account for social concerns and
for the behavior of the various agents (users, operators, and government). They
also allow for simulation of consequences for agents of any policy or behavioral
change.
However detailed these regulatory models may be, they all follow a similar struc-
ture (summarized in fi gure A2.1). They build on an initial database (summarizing
the company’s physical and fi nancial performance, including most of the account-
ing information regularly collected by the operator), an identifi cation of the main
regulatory instruments (for example, tariff structure, quality options, and invest-
ment speed and timing), and some economic parameters (for example, demo-
graphic characteristics of the area of operation, macroeconomic indicators driving
demand, and effi ciency levels).
Next, they rely on explicit assessments of the expected impact on cash fl ows of
the reaction of the main actors (users and operators) to the regulatory instruments
summarized analytically. This reaction is refl ected in the regulatory models through
incorporation, for example, of the relationship between consumption levels and
prices. Assessment of the reaction drives the fi nancial equilibrium for the operator
(this assessment can be performed on a fairly detailed level for the main categories
of costs and revenue).
Once the regulator has a good assessment of the operator’s situation based on a
relatively large set of performance indicators, and depending on the specifi c regula-
tory regime (price cap, profi t sharing, or rate of return) selected, it can determine
AFIR_141-154_annex02.indd 142AFIR_141-154_annex02.indd 142 4/3/08 9:07:07 AM4/3/08 9:07:07 AM

143
Regulatory Model
A2
the revenue that the operator will be allowed to collect though its tariff. The equi-
librium tariff is the one that generates a net present value of zero for the investment
or the operation. This assessment is driven by the cash fl ow forecast, which is built
into the forecasted income statement of the operator through a complex set of sec-
ondary spreadsheets. These spreadsheets are used to generate the main monitoring
indicators on which a regulator needs to focus. Once these indicators are accept-
able, the fi nal average tariff is known. “Negotiations” between operators and regula-
tors usually require several rounds until agreement is reached or until the regulator
decides to stop them, but in each round the process is exactly the same.
This generic defi nition can be complemented by a brief summary of the contri-
butions of regulatory models to implementation of regulatory policies:
• Quantitative rigor in regulatory assessments: Regulatory models allow regulators
to avoid subjective or impressionistic assessments of the impact of their deci-
sions. What should be the impact of a devaluation on a tariff? This question
Database
Parameters
Cash flowestimation
Instruments
Inputs
Economicforecasts
Financialclosure
Indicators
Economicclosure
Income statementbalance sheet
Functionalrelationships
Secondaryspreadsheets
EconomicFinancial
Operational
Equilibrium
Figure A2.1 Building Blocks of Regulatory Models
Source: Authors.
AFIR_141-154_annex02.indd 143AFIR_141-154_annex02.indd 143 4/3/08 9:07:07 AM4/3/08 9:07:07 AM

144
Accounting for Infrastructure Regulation: An Introduction
A2
requires an understanding of a company’s fi nancial structure (how much for-
eign debt it includes) and that understanding must have a quantitative basis.
What is the impact on the tariff of a change in the country risk premium between
two tariff revision periods? No less demanding in terms of numbers, this ques-
tion is probably one of the most common questions that regulators in develop-
ing countries need to be able to answer. Without the rigor imposed by the kinds
of models presented here, the responses to these questions are at best
unreliable.
• Distinction between economic and fi nancial concerns: Regulatory models allow
regulators to account for the fi nancial and accounting concerns of operators
without having to abandon monitoring of the wider concerns of society. Invest-
ment decisions by operators and consumption decisions are endogenous. The
models recognize that regulators may have to account for social concerns. They
are designed to assess the trade-offs between types of resource allocation prob-
lems. They can also provide useful input into the fi scal budgetary process when
subsidies are needed. All these features make them more appropriate to the reg-
ulator’s concerns than traditional fi nancial models, but without quite fully being
economic models. They can be labeled “quasi-economic” models, because they
still fall short of what economic models do for policy makers. For instance, they
rely on market prices rather than shadow prices, and ignore externalities such as
the environmental effects of operations and any other distortions of factor or
product markets.
• Consistency in accounting for multiple concerns: Regulatory models force consis-
tent quantifi cation of the fi nancial and (quasi-)economic viewpoints of regula-
tory decisions. From a fi nancial perspective, the regulator is asked to focus on
synthetic indicators, such as the cost of capital and the internal rate of return or
equivalent concepts, and to understand the trade-offs of various regulatory or
policy instruments in terms of their impacts on these indicators. How will a
government’s request to revise a contract in terms of investment levels or speed
infl uence the profi tability of the business? How should tariff levels be adjusted
to restore the original profi tability? Only a model that recognizes all the interac-
tions of the various decision variables can answer these questions.
From an economic perspective, the main concern of the regulator is to ensure
continuity of services, to achieve various types of effi ciency (cost and resource
allocation minimization while ensuring that prices are consistent with costs),
and to meet political mandates in terms of any social and redistributive con-
cerns. One sort of social concern that policy makers and regulators must be able
AFIR_141-154_annex02.indd 144AFIR_141-154_annex02.indd 144 4/3/08 9:07:07 AM4/3/08 9:07:07 AM

145
Regulatory Model
A2
to address is consistency of a tariff adjustment authorized to compensate for an
unexpected change in macroeconomic conditions with the poorest users’ ability
to pay. Policy makers have not always clarifi ed their policy preferences, and there
may be policy options (for example, explicit payments or vouchers) that can bet-
ter address their concerns. Policy makers’ lack of action or direction on social
issues places regulators in a diffi cult position; they have not always met the chal-
lenge of simultaneously accounting for multiple variables. In many of these fail-
ures, the main victims are the people least capable of arguing their case. In prac-
tice, these victims are often the poorest users. Social concerns often are
inadequately addressed through social policy and often are left out of the regula-
tory decision-making process.
• Transparency and accountability: Regulatory models are crucial in increasing
transparency in monitoring of the behavior of regulators and operators. They
reduce the scope for corruption and collusion, the cost of which they capture or
at least signifi cantly increase. They facilitate the job of watchdogs to ensure that
no abuses occur and that the expected gains from reform are indeed achieved
and shared with users. By increasing the transparency of the factors driving the
operator’s allowed rate of return, ensuring that it covers the company’s expected
cost of capital until the next tariff revision, and by increasing the transparency of
the factors increasing the operator’s cost of doing business, the models provide a
regulatory tool for organizing consultation processes.
Regulatory models will not alleviate the need for discussion. In fact, public
hearings are organized to elicit input on the main elements to be addressed by
the models and to allow all actors to intervene. Ultimately, however, the regula-
tor will have to decide most matters on objective, technical grounds rather than
on subjective, political grounds. The former make regulation fairer, more effi -
cient, and less amenable to political interference or corruption.
Even the best regulatory models are by necessity simplifi cations of the interac-
tions they represent. The quality of a model depends, among other factors, on the
strength of assumptions about future costs and investment requirements, growth
in demand, the consumption profi le of users, and the ability of the operator to
improve its effi ciency. How good these assumptions are, in turn, depends on the
quality of the data available. Regulators should never forget that the data they need
must match the goals of the model. The regulator must always arbitrate between
the costs and benefi ts to the operator and users of generating additional informa-
tion. In many countries the information available is so limited that the initial
AFIR_141-154_annex02.indd 145AFIR_141-154_annex02.indd 145 4/3/08 9:07:07 AM4/3/08 9:07:07 AM

146
Accounting for Infrastructure Regulation: An Introduction
A2
assumptions have often been quite broad. As time goes by, the information asym-
metry between regulators and operators shrinks, and narrower assumptions are
needed. Unlike the operator’s fi nancial department, regulators need not be con-
cerned with weekly or monthly monitoring. Their focus is on the medium to long
run, and hence their data requirements are likely to be lower.
Matching regulatory objectives and instruments
Most regulatory regimes attempt to meet multiple objectives. Their ranking varies
across countries, and in many instances trade-offs are unavoidable. A few of these
objectives appear to dominate. The regulatory challenge then becomes the need to
consider various instrument combinations as a way of simultaneously meeting pri-
mary and secondary objectives or at least of minimizing the need to face socially
and politically diffi cult trade-offs.
Regulatory objectives
The main objectives quoted by regulators are as follows:
• Financial viability of the operator: Ultimately, if tariffs (including subsidies) do
not cover costs, private operators are not interested. Most companies are willing
to be in the red for a couple of years early on when they take over the business,
but only for the short run. The related indicators are the internal rate of return
and the net present value.
• Productive effi ciency: This goal refl ects the concern to push operators to mini-
mize costs for a given level of production or to maximize production for a given
level of inputs. A problem with rate-of-return regulation is that it does not pro-
mote cost minimization. A benefi t of price or revenue caps is that, when effec-
tive, they tend to improve productive effi ciency. Related indicators are produc-
tion or coverage levels for given expenditure levels on inputs, or vice versa.
• Allocative effi ciency: This goal refl ects the need to ensure that tariffs refl ect mar-
ginal cost. Yet distortions in factor markets, limited credit markets, unionized
labor, and complex tax systems are completely out of the regulator’s control.
Related indicators refl ect changes in the input or output mixes as a result of
changes in input or output prices.
• Dynamic effi ciency: This relatively subtle goal is to ensure that the operator has an
incentive to think of future users and to invest accordingly. This goal reinforces
AFIR_141-154_annex02.indd 146AFIR_141-154_annex02.indd 146 4/3/08 9:07:07 AM4/3/08 9:07:07 AM

147
Regulatory Model
A2
the importance of ensuring that tariffs cover costs, including the cost of invest-
ments needed for future users. Related indicators establish a link between demand
forecast and current investment levels.
• Distributional fairness: This goal implies that tariff structures per user type are
consistent with ability to pay. When government cannot credibly commit to sub-
sidies, regulators often rely on cross-subsidies to help the poorest users. Provid-
ing these users with additional, cheaper technologies is another way to achieve
fairness. One indicator of affordability is the percentage of income spent on the
services classifi ed by income groups. Trade-offs between objectives—such as
between sustainability and effi ciency, between effi ciency and fairness, and
between sustainability and fairness—are many.
• Sustainability and effi ciency: The regulator needs to strike a balance between
marginal cost pricing and exclusion of ineffi cient costs, which may promote
allocative and productive effi ciency, and preservation of the fi nancial sustain-
ability of service provision. Variations in fi nancial conditions mean that this
problem is not static. At every tariff revision, the regulator will have to ensure
that prices are consistent with the need to recognize the consequences of fl uc-
tuations in global fi nancial markets on the operator’s fi nancial viability. The
balance between price and market fl uctuations is particularly important in
countries in which long-term borrowing capacity is limited because of the
weakness of credit markets. Most borrowing is short term, and hence short-
term fl uctuations have immediate impacts on the fi nancial state of the opera-
tor. This needs to be refl ected in the average level of prices just as much as the
concern for effi ciency revealed by the usual emphasis on long-run marginal
cost pricing.
• Effi ciency and fairness: There are two main types of trade-offs. The fi rst is between
effi ciency, on the one hand, and price discrimination in favor of the poor to
address equity concerns, on the other hand. Cross-subsidies have long been crit-
icized for ineffi ciency. When the ability of the government to fi nance direct sub-
sidies is limited, cross-subsidies may be unavoidable, but different subsidy
designs will have different effi ciency effects. The second trade-off is between the
extent of and quickness with which users benefi t from effi ciency gains, on the
one hand, and the incentive of the operator to maximize these gains, on the
other hand. The strength of the incentive for fi rms to cut costs is related to the
share of the savings they are allowed to appropriate. If all gains must be passed
on immediately to users, fi rms have no incentive to cut costs. At the other
extreme, allowing a fi rm to keep all effi ciency gains achieved in delivery of a
AFIR_141-154_annex02.indd 147AFIR_141-154_annex02.indd 147 4/3/08 9:07:07 AM4/3/08 9:07:07 AM
148
Accounting for Infrastructure Regulation: An Introduction
A2
monopolistic public service is both socially and politically unrealistic. Effi ciency
gains eventually must be shared with users through a combination of lower tar-
iffs and better service quality.
• Sustainability and fairness: Historical subsidy levels may not be consistent with
the desire to guarantee fi nancial viability to the operator. The transition from
public to private provision of public services often implies a review of many his-
torical subsidy levels and designs tolerated under soft budget constraints for
public enterprises. Once a private operator takes over, the cost of subsidies
becomes a more serious issue, and the concern for fi nancial sustainability forces
the regulator to rethink subsidy levels and structures. The “privatization” process
thus may force decisions on politically sensitive trade-offs.
The existence of these trade-offs and the related political sensitivities imply that
regulatory regimes must fi t into more formal processes to ensure their political
acceptance and long-run sustainability. Where the regulator is required to make
trade-offs, these trade-offs should be transparent, and the regulator should be
accountable for its choices. Regulatory regimes must be simple, justifi able and justi-
fi ed, transparent, acceptable to the majority of actors, and fair in the allocation of
total costs. Moreover, they must avoid unjustifi ed price discrimination as well as
excessively fl uctuating price levels. Models such as those described here are not
merely instruments for checking quantitative consistency: they are the key to
accountable and acceptable processes that ensure the long-run viability of reforms.
The transparency achieved through use of models is particularly important when
trade-offs between objectives have highly differentiated consequences for different
interest groups.
Regulatory instruments
To achieve a particular combination of regulatory objectives, the policy maker or
regulator has many instruments from which to choose, as illustrated in fi gure A2.2.
These instruments can be aggregated into three broad categories:
• regulatory regime,
• contractual obligations, and
• tariff level and design.
A distinctive feature of regulation is that these instruments are interrelated through
their fi nancial impact on the fi rm.
AFIR_141-154_annex02.indd 148AFIR_141-154_annex02.indd 148 4/3/08 9:07:08 AM4/3/08 9:07:08 AM

149
Regulatory Model
A2
The relation between the various goals and instruments is reasonably close and
can be summarized as in table A.2.1.
It should be clear by now that the average tariff level drives the operator’s fi nan-
cial sustainability. The tariff should allow an effi cient fi rm to cover its cost and
achieve a reasonable rate of return. If the tariff does not cover costs, subsidies will
be a complementary option. But the design of subsidies may have an impact on
allocative effi ciency, because subsidies change relative prices. In highly unpredict-
able markets, the regulatory regime drives the incidence of the level of risk on tariff
levels. Price caps in highly volatile environments, combined with excessively spaced
tariff revisions, may result in fi nancial unsustainability for the operator.
Tarifflevel
Investment levelobligations
Quality of serviceobligations
Payments togovernment
Fines fornoncompliance
Regulatoryregime
Amortizationrules
Contractduration
Timing ofobligations
Tariffstructure
Subsidies
Policyinstruments
?
Figure A2.2 Main Policy Instruments for Regulators
Source: Authors.
Table A2.1 Regulatory Goals and Instruments for Their Achievement
Goals Instruments
Sustainability Tariff levels and subsidies; regulatory regimeAllocative effi ciency Tariff structureProductive effi ciency Regulatory regime (sharing of effi ciency gains)Fairness Tariff structure; service obligations (e.g., investment levels and
service quality); regulatory regime (sharing of effi ciency gains)
AFIR_141-154_annex02.indd 149AFIR_141-154_annex02.indd 149 4/3/08 9:07:08 AM4/3/08 9:07:08 AM
150
Accounting for Infrastructure Regulation: An Introduction
A2
Within regulated activities, allocative effi ciency is infl uenced essentially by the
tariff structure. Unless the structure is closely (negatively) related to the demand
elasticity of the various users, allocative effi ciency is distorted. Tariff structures may
refl ect social concerns, revealing a major trade-off between these concerns and
allocative effi ciency.
Next, the tariff level allowed for sustainability must be consistent with the desire
to achieve productive effi ciency—that is, to authorize only the recovery of effi cient
costs. The design of the regulatory regime essentially determines the operator’s
incentive to minimize costs. Price or revenue caps that are set for a specifi ed period
(for example, fi ve years) are more likely to achieve productive effi ciency than yearly
cost-based adjustments.
Finally, fairness is clearly associated with the design of the tariff structure because,
in addition to subsidies, the tariff structure is the main mechanism used to match
prices with ability to pay. The regulatory regime also matters, but in a more subtle
way, because the effect of the level of risk on tariff levels is driven by the regulatory
regime. In a highly volatile environment, a cost-plus regime with frequent adjust-
ments can result in frequent large changes in prices. But if these risks are borne by
the operator under a medium-term price cap, they will need to be refl ected in the
cash fl ow modelling or allowed cost of capital.
What regulators need to know about the operator’s fi nances
Ultimately, what the regulator does is identify a tariff level that will generate a cash
fl ow consistent with valuation of the fi rm. That tariff level must be consistent with
the fi rm’s opportunity cost of capital. In other words, the regulator needs to focus
on two main groups of indicators: the cost of capital, which is a hurdle rate to
decide whether a tariff level is reasonable, and the fi rm’s cash fl ows, which are used
to assess the fi rm’s internal rate of return. The ideal regulatory situation is one in
which the tariff is set so that the internal rate of return of a project or concession is
equal to the cost of capital. For the project to be attractive to a private operator, the
internal rate of return must be at least equal to this cost of capital. When the cost of
capital is higher than the internal rate of return, the net present value of the project
is negative.
Figure A2.3 depicts key factors driving cash fl ows and hence the internal rate of
return. The fi gure illustrates the reality that operators and regulators do not drive
AFIR_141-154_annex02.indd 150AFIR_141-154_annex02.indd 150 4/3/08 9:07:08 AM4/3/08 9:07:08 AM

151
Regulatory Model
A2
all sources of cash fl ow fl uctuations. They share responsibility in infl uencing the
internal rate of return.
At the beginning of the process, the discount rate used to calculate the net pres-
ent value of the cash fl ow is the weighted average cost of capital. The appropriate
average tariff is the one that ensures a net present value of zero at that discount rate.
Any change to the operational conditions of the operation or to the cost of capital
will result in an imbalance between the internal rate of return and the cost of capi-
tal. If this change is structural, the scheduled and sometimes unscheduled tariff
revisions will be designed to restore the equilibrium.
Conclusion
In the process of ordinary and extraordinary tariff revisions or contract renegotia-
tions, the regulator always arbitrates between the interests of the various actors
(users, operators, and government) that participate directly in the service to achieve
certain goals using available regulatory instruments. The multiplicity of variables
and interests simultaneously engaged in such processes requires that the processes
Tariffstructure
Tarifflevel
• Regulatory design• Tax• Subsidy• Payments to government
• Investment• Quality of service• Timing• Other obligations
Financial structure
• Foreign vs. domestic debt• Complexity of the structure• Leverage
AlsoType of restructuring:• Degree/duration of exclusivity• Composition of client base (poor/nonpoor)
Internal Rate of Return
?
GovernmentFirmRegulatorFirm/regulator
Figure A2.3 Drivers of the Internal Rate of Return
Source: Authors.
AFIR_141-154_annex02.indd 151AFIR_141-154_annex02.indd 151 4/3/08 9:07:08 AM4/3/08 9:07:08 AM

152
A2
Accounting for Infrastructure Regulation: An Introduction
be performed within an integral, consistent, and transparent analytical framework
capable of quantifying the impact of regulatory decisions.
The integrity of the process implies that the regulator carry out the analysis
using indicators that account for the economic, fi nancial, and operating perfor-
mance of the fi rm. For this purpose, the regulator needs to consider simultaneously
all the variables affecting the economic equation, the minimum needs of fi nance,
and the operator’s operating conditions.
The transparency of a regulatory process is enhanced when all the relevant fac-
tors affecting the economic and fi nancial variables of service provision are accounted
for, and participants have access to such information.
The consistency of the analysis requires that all the variables affecting the indica-
tors of the operator’s performance are combined in a way that properly represents
the behavior of market participants as well as sectoral, (quasi-)economic, and
fi nancial relations and constraints. Performance of this task will help ensure that
implementation of regulatory instruments has a quantitative effect that refl ects the
actual situation of the concession under study.
To meet these criteria, the regulatory process may be performed through a regu-
latory model that combines the variables describing the service’s initial condition,
regulatory objectives, and regulatory instruments. The model allows the regulator
to simulate new scenarios and test the sensitivity of the results to different assump-
tions in a more objective manner. Hence, regulatory decisions are less subjective
and more robust for the uncertainties and risks that lie within and beyond the regu-
latory period.
The model can perform all the functions that any fi nancial model of a fi rm
would perform, but the model is designed with a longer-term view and explicitly
identifi es the key regulatory instruments. Thus, one of the elements to be taken into
account by the regulator is that the fi rm can earn suffi cient revenue to cover its costs
(that is, operating costs, investments on fi xed assets, and working capital) and to
obtain a return equivalent to the opportunity cost of capital. For this purpose, the
model forecasts the fi rm’s net cash fl ow and internal rate of return, which the regu-
lator compares with the cost of capital to determine the prices or revenues neces-
sary to sustain service provision. Moreover, in the forecast fi nancial statements, the
model includes the key indicators for analyzing the fi rm’s fi nancial viability, which
the regulator also considers in the regulatory process.
Although a regulatory model permits development of an appropriate regulatory
process, it also poses at least two important challenges to regulators. The fi rst is the
necessity of using uniform quantifi cations of (quasi-)economic and fi nancial
AFIR_141-154_annex02.indd 152AFIR_141-154_annex02.indd 152 4/3/08 9:07:08 AM4/3/08 9:07:08 AM

153
Regulatory Model
A2
benchmarks for, or indicators of, regulatory decisions. Then, the regulator is asked
to focus on analysis of a group of variables, such as the cost of capital and the inter-
nal rate of return, as well as to fully understand the economic and fi nancial con-
cepts generating the trade-offs of various regulatory and policy instrument combi-
nations in terms of their impacts on these indicators. The second challenge is that
the quality of the model’s results depends on the quality of the data used. Therefore,
the regulator must generate a set of data—including quantifi cation of the capital
asset, service supply information, and demand and fi nancial information—with a
structure consistent with the model’s requirements.
The analysis that can be performed with a regulatory model has certain limita-
tions. The most important limitation arises from the use of spreadsheets, although
new software programs have remarkably broadened the spectrum of the analysis
that can be carried out with them.
A model is a way of representing the reality under analysis in a simplifi ed man-
ner. Therefore, the structure and degree of complexity of the model and the degree
of disaggregation of the variables representing the real world will refl ect judgments
about what is critical (or not critical) for forecasting the future fi nancial and eco-
nomic outcomes. The success of the model will depend on the soundness of these
judgments.
AFIR_141-154_annex02.indd 153AFIR_141-154_annex02.indd 153 4/3/08 9:07:08 AM4/3/08 9:07:08 AM

AFIR_141-154_annex02.indd 154AFIR_141-154_annex02.indd 154 4/3/08 9:07:08 AM4/3/08 9:07:08 AM

155
Annex 3
This annex presents some guidelines and templates representative of the best prac-
tices in regulatory accounting.
Australia: Electricity Industry Guideline
Australia’s Essential Services Commission (ESC) specifi es requirements for “the
collection, allocation and recording of business data by the licensee in the electricity
supply in Victoria.” Guideline 3 (ESC 2004a) establishes “a mechanism for the col-
lection of information and certain recurring substantive information requirements”
to enable the Commission
• to ensure the correct allocation of revenue and costs between the Distribution
Business and non-distribution businesses;
• to inform Electricity Distribution Price Determinations and to perform other
functions under relevant Acts;
• to measure actual fi nancial performance of Distribution Businesses against
forecast;
• to publish information on fi nancial performance of Distribution Businesses;
• to improve the level(s) of transparency in the regulatory processes;
• to generally give effect to the objectives of the Commission as stated in the
Essential Services Commission Act 2001 and the Electricity Industry Act 2000.
In addition, Guideline 3
• details the nature of information that the Commission will require to monitor
the Licensee’s performance;
Examples of Guidelines and Templates
AFIR_155-174_annex03.indd 155AFIR_155-174_annex03.indd 155 4/3/08 9:08:39 AM4/3/08 9:08:39 AM

156
Accounting for Infrastructure Regulation: An Introduction
A3
• explains the way in which a Licensee must prepare separate accounts and main-
tain its accounting records;
• describes requirements for other information that a Licensee must report to the
Commission to facilitate the Commission’s Electricity Distribution Price Determination; and
• outlines a mechanism by which information that may be required by the Com-mission to fulfi l its obligations and functions may be collected.
Australia: Regulatory Accounting Statements—Templates
The Australian Index to Regulatory Accounting Statements (ESC 2004b) includes
• Profi t and Loss
• Balance Sheet
• Cash Flow
• Fixed Assets
• Cost Opening
• Cost Additions
• Cost Disposals
• Cost Closing
• Additions by Reason
• Additions by Reason (O’heads)
• Depreciation Opening
• Depreciation Annual Charge
• Depreciation Disposals
• Depreciation Closing
• Written-down Value Opening
• Written-down Value Movements
• Written-down Value Disposals
• Written-down Value Closing
• Maintenance by Asset Category
• Activity Areas
• Provision Accounts
• Noncausal Allocations
• Distribution Revenue
• Excluded Services and Other Activities
• Avoided Cost Payments
AFIR_155-174_annex03.indd 156AFIR_155-174_annex03.indd 156 4/3/08 9:08:40 AM4/3/08 9:08:40 AM

157
Examples of Guidelines and Templates
A3
Some of the templates specifi ed in the index are presented.
Regulatory Accounting Statement PL
Profit and Loss
For the period ended [ ]
Legal
Entity
Code/s
Statutory
Account
Code/s or
Reference
Description
Audited
Statutory
Amount
AdjustmentsDistribution
Business
Excluded
Services and
Other
Activities
Regulated by
Price Cap
$'000 $'000 $'000 $'000 $'000
Distribution revenue 0 0
0Proceeds from sale of assets 0
Customer contributions 0 0 xxxxx xxxxxOther revenue 0 0
Total Revenue 0 0 0 0 0
0000Maintenance 0
0000Grid fees 0
0000Operating expenses 0
0000Depreciation 0
0000WDV assets disposed 0
Other
Profit before Interest and Tax (PBIT) 0 0 0 0 0
Abnormals 0 0
In addition, it is mandatory to produce for each cost or revenue item that has been allocated to the Regulated Business Segments a supporting workpaper that includes the following:(a) the amounts that have been directly attributed to each business segment(b) the amounts that have been allocated to each business segment(c) a description of the allocation basis (d) the numeric quantity of each allocator.
AFIR_155-174_annex03.indd 157AFIR_155-174_annex03.indd 157 4/3/08 9:08:40 AM4/3/08 9:08:40 AM

158
Accounting for Infrastructure Regulation: An Introduction
A3
Regulatory Accounting Statement BS
Balance Sheet
As at [ ]
Legal
Entity
Code/s
Statutory
Account
Code or
Reference
Description
Audited
Statutory
Amount
AdjustmentsDistribution
Business
Excluded
Services and
Other
Activities
Regulated by
Price Cap
$'000 $'000 $'000 $'000 $'000
CURRENT ASSETS
Cash 0 0
Receivables 0 0
Investments 0 0
Prepayments 0 0
Accrued revenue 0 0
Inventories 0 0
Other 0 0
Total Current Assets 0 0 0 0 0
NONCURRENT ASSETS
Receivables 0 0
Investments 0 0
Other 0 0
Property, plant, and equipment 0 0 0 0 0
Total Noncurrent Assets 0 0 0 0 0
TOTAL ASSETS 0 0 0 0 0
CURRENT LIABILITIES
Trade creditors and accruals 0 0
Loans 0 0
Customer deposits 0 0
Bank overdraft 0 0
Provisions 0 0
Other 0 0
Total current liabilities 0 0 0 0 0
NONCURRENT LIABILITIES
Provisions 0 0
Loans 0 0
Other 0 0
TOTAL LIABILITIES 0 0 0 0 0
NET ASSETS /(LIABILITIES) 0 0 0 0 0
In addition, it is mandatory to produce for each asset or liability that has been allocated to the Regulatory Business Segments a supportingworkpaper that includes the following(a) the amounts that have been directly attributed to each business segment(b) the amounts that have been allocated to each business segment(c) a description of the allocation basis (d) the numeric quantity of each allocator.
AFIR_155-174_annex03.indd 158AFIR_155-174_annex03.indd 158 4/3/08 9:08:40 AM4/3/08 9:08:40 AM

159
Examples of Guidelines and Templates
A3
Regulatory Accounting Statement CF
Cash Flow - Operations
For the period ended [ ]
Legal
Entity
Code/s
Statutory
Account
Code or
Reference
Description
Audited
Statutory
Amount
AdjustmentsDistribution
Business
Excluded
Services and
Other
Activities
Regulated by
Price Cap
Receipts
Distribution revenue 0 0
Proceeds from sale of assets 0 0
Customer contributions 0 0
Customer deposits 0 0
Payments
Grid fees 0 0
Operating expenses 0 0
Movements in working capital 0 0
Asset investment 0 0
Customer refunds 0 0
Net Operating Cash Flow 0 0 0 0 0
In addition, it is mandatory to produce for each cashflow item that has been allocated to the Regulated Business Segments a supportingworkpaper that includes the following:(a) the amounts that have been directly attributed to each business segment(b) the amounts that have been allocated to each business segment(c) a description of the allocation basis (d) the numeric quantity of each allocator.
AFIR_155-174_annex03.indd 159AFIR_155-174_annex03.indd 159 4/3/08 9:08:40 AM4/3/08 9:08:40 AM

160
Accounting for Infrastructure Regulation: An Introduction
A3
Fixed Assets at Cost - OPENING
Post Vesting Assets (PV)
Entity Stat A/c Statutory Adjust. Distrib. Excluded/
Code/s Code Accounts Business Other Subt'n HV LV Other
$'000 $'000 $'000 $'0000 xxxxx xxxxx xxxxx xxxxx
Subtransmission xxxxx xxxxx xxxxxCBD xxxxxxxxxx
Urban xxxxxxxxxxRural – short xxxxxxxxxxRural – long xxxxxxxxxx
Nonstandard metering xxxxx xxxxx xxxxxStandard metering xxxxx xxxxx xxxxx
Public lighting xxxxx xxxxx xxxxxSCADA/Network Control xxxxx xxxxx xxxxx
Nonnetwork xxxxx xxxxx xxxxx00000
<-- Customer contributions included in adjustments
Total Pre & Post 0 0 0 0 0 0 0 0
VOLTAGE
OCtnemetatS gnitnuoccA yrotalugeR
/ / GNINEPO - tsoC ta stessA dexiF
Vesting Assets (V)
Entity Stat A/c Statutory Adjust. Distrib Excluded/
Code/s Code Accounts Business Other Subt'n HV LV Other
000'$000'$000'$000'$000'$000'$000'$000'$0 xxxxxxxxxxxxxxxxxxxx
Subtransmission xxxxx xxxxx xxxxxCBD xxxxxxxxxx
Urban xxxxxxxxxxRural – short xxxxxxxxxxRural – long xxxxxxxxxx
Nonstandard metering xxxxx xxxxx xxxxxStandard metering xxxxx xxxxx xxxxx
Public lighting xxxxx xxxxx xxxxxSCADA/Network Control xxxxx xxxxx xxxxx
Nonnetwork xxxxx xxxxx xxxxx0 0 0 0 0
VOLTAGE
AFIR_155-174_annex03.indd 160AFIR_155-174_annex03.indd 160 4/3/08 9:08:40 AM4/3/08 9:08:40 AM

161
Examples of Guidelines and Templates
A3
ACtnemetatS gnitnuoccA yrotalugeR
/ / SNOITIDDA - tsoC ta stessA dexiF
Vesting Assets (V)
Entity Stat A/c Statutory Adjust. Distrib. Excluded/
Code/s Code Accounts Business Other Subt'n HV LV Other
000'$000'$000'$000'$xxxxxxxxxxxxxxxxxxxxxxxxxxxxxxxxxxxxxxxx
Subtransmission xxxxx xxxxx xxxxx xxxxxCBD xxxxx xxxxx xxxxx xxxxx
Urban xxxxx xxxxx xxxxx xxxxxRural – short xxxxx xxxxx xxxxx xxxxxRural – long xxxxx xxxxx xxxxx xxxxx
Nonstandard metering xxxxx xxxxx xxxxx xxxxxStandard metering xxxxx xxxxx xxxxx xxxxx
Public lighting xxxxx xxxxx xxxxx xxxxxSCADA/Network Control xxxxx xxxxx xxxxx xxxxx
Nonnetwork xxxxx xxxxx xxxxx xxxxx
VOLTAGE
Fixed Assets at Cost - ADDITIONS
Post Vesting Assets (PV)
Entity Stat A/c Statutory Adjust. Distrib. Excluded/
Code/s Code Accounts Business Other Subt'n HV LV Other
$'000 $'000 $'000 $'0000 0 xxxxx xxxxx xxxxx xxxxx
Subtransmission 0 xxxxx xxxxx xxxxxCBD xxxxx 0 0 xxxxx
Urban xxxxx 0 0 xxxxxRural – short xxxxx 0 0 xxxxxRural – long xxxxx 0 0 xxxxx
Nonstandard metering xxxxx xxxxx xxxxx 0Standard metering xxxxx xxxxx xxxxx 0
Public lighting xxxxx xxxxx xxxxx 0SCADA/Network Control xxxxx xxxxx xxxxx 0
Nonnetwork xxxxx xxxxx xxxxx 000000
<-- Customer contributions included in adjustments
Total Pre & Post 0 0 0 0 0 0 0 0
VOLTAGE
AFIR_155-174_annex03.indd 161AFIR_155-174_annex03.indd 161 4/3/08 9:08:40 AM4/3/08 9:08:40 AM

162
Accounting for Infrastructure Regulation: An Introduction
A3
ODtnemetatS gnitnuoccA yrotalugeR
/ / GNINEPO - noitaicerpeD stessA dexiF
Vesting Assets (V)
Entity Stat A/c Statutory Adjust. Distrib. Excluded/
Code/s Code Accounts Business Other Subt'n HV LV Other
$'000 $'000 $'000 $'0000 xxxxx xxxxx xxxxx xxxxx
Subtransmission xxxxx xxxxx xxxxxCBD xxxxxxxxxx
Urban xxxxxxxxxxRural – short xxxxxxxxxxRural – long xxxxxxxxxx
Nonstandard metering xxxxx xxxxx xxxxxStandard metering xxxxx xxxxx xxxxx
Public lighting xxxxx xxxxx xxxxxSCADA/Network Control xxxxx xxxxx xxxxx
Nonnetwork xxxxx xxxxx xxxxx00000
VOLTAGE
Fixed Assets Depreciation - OPENING
Post Vesting Assets (PV)
Entity Stat A/c Statutory Adjust. Distrib. Excluded/
Code/s Code Accounts Business Other Subt'n HV LV Other
$'000 $'000 $'000 $'0000 xxxxx xxxxx xxxxx xxxxx
Subtransmission xxxxx xxxxx xxxxxCBD xxxxxxxxxx
Urban xxxxxxxxxxRural – short xxxxxxxxxxRural – long xxxxxxxxxx
Nonstandard metering xxxxx xxxxx xxxxxStandard metering xxxxx xxxxx xxxxx
Public lighting xxxxx xxxxx xxxxxSCADA/Network Control xxxxx xxxxx xxxxx
Nonnetwork xxxxx xxxxx xxxxx00000
<-- Customer contributions included in adjustments
Total Pre & Post 0 0 0 0 0 0 0 0
VOLTAGE
AFIR_155-174_annex03.indd 162AFIR_155-174_annex03.indd 162 4/3/08 9:08:40 AM4/3/08 9:08:40 AM

163
Examples of Guidelines and Templates
A3
Regulatory Accounting Statement AR
Fixed Assets at Cost - ADDITIONS by REASON / /
(Net of Customer Contributions)
latoT000’$
Subt'n HV LV Other
DEMAND RELATED
Reinforcements
Subtransmission xxxxx xxxxx xxxxxCBD xxxxxxxxxx
Urban xxxxxxxxxxRural – short xxxxxxxxxxRural – long xxxxxxxxxx
0 0 0 0 0New Customer Connections
Subtransmission xxxxx xxxxx xxxxxCBD xxxxxxxxxx
Urban xxxxxxxxxxRural – short xxxxxxxxxxRural – long xxxxxxxxxx
0 0 0 0 0Load Movement
Subtransmission xxxxx xxxxx xxxxxCBD xxxxxxxxxx
Urban xxxxxxxxxxRural – short xxxxxxxxxxRural – long xxxxxxxxxx
0 0 0 0 0NONDEMAND RELATED
Reliability & Quality Maintained
Subtransmission xxxxx xxxxx xxxxxCBD xxxxxxxxxx
Urban xxxxxxxxxxRural – short xxxxxxxxxxRural – long xxxxxxxxxx
0 0 0 0 0Reliability & Quality Improvements
Subtransmission xxxxx xxxxx xxxxxCBD xxxxxxxxxx
Urban xxxxxxxxxxRural – short xxxxxxxxxxRural – long xxxxxxxxxx
0 0 0 0 0Environmental, Safety, & Legal
Subtransmission xxxxx xxxxx xxxxxCBD xxxxxxxxxx
Urban xxxxxxxxxxRural – short xxxxxxxxxxRural – long xxxxxxxxxx
0 0 0 0 0TOTALS ACROSS VOLTAGE LEVELS
Subtransmission 0 xxxxx xxxxx xxxxxCBD xxxxx 0 0 xxxxx
Urban xxxxx 0 0 xxxxxRural – short xxxxx 0 0 xxxxxRural – long xxxxx 0 0 xxxxx
0 0 0 0 0
Standard metering 0 xxxxx xxxxx xxxxxSCADA/Network Control 0 xxxxx xxxxx xxxxxNonnetwork General - IT 0 xxxxx xxxxx xxxxxNonnetwork General - Other 0 xxxxx xxxxx xxxxx
RBPC - TOTAL ADDITIONS 0 0 0 0 0
latoT000’$
Nonstandard metering 0 xxxxx xxxxx xxxxx 0Public lighting 0 xxxxx xxxxx xxxxx 0Other 0 xxxxx xxxxx xxxxx 0
Excl\Other - TOTAL ADDITIONS 0 0 0 0 0
TOTAL ALL ADDITIONS 0 0 0 0 0
VOLTAGE
Regulated by Price Cap
Excluded Services\Other
AFIR_155-174_annex03.indd 163AFIR_155-174_annex03.indd 163 4/3/08 9:08:41 AM4/3/08 9:08:41 AM

164
Accounting for Infrastructure Regulation: An Introduction
A3
Regulatory Accounting Statement MA
Maintenance / /
Legal
Entity
Statutory
Account
Code or $’000
Audited
StatutoryAdjustments
Distribution
Business
Excluded
Services and
Other
Regulated by
Price Cap
Code/sReference seitivitcA
AmountSubt'n HV L V Other
Network
0noissimsnartbuS 0 xxxxx xxxxx xxxxx0DBC 0 xxxxxxxxxx0nabrU 0 xxxxxxxxxx0trohs – laruR 0 xxxxxxxxxx0gnol – laruR 0 xxxxxxxxxx0gniretem dradnatsnoN xxxxx xxxxx xxxxx xxxxx0gniretem dradnatS xxxxx 0 xxxxx xxxxx xxxxx
00 Public lighting xxxxx xxxxx xxxxx xxxxx0lortnoc krowteN/ADACS 0 xxxxx xxxxx xxxxx0 rehtO 0 xxxxx xxxxx xxxxx
Total 0 0 0 0 0 0 0 0 0
VOLTAGE
Regulatory Accounting Statement AA
Activity areas
Legal
Entity
Code/s
Statutory
Account Code
or Reference$’000
Audited
Statutory
Amount
AdjustmentsDistribution
Business
Excluded
Services and
Other
Activities
Regulated by
Price Cap
Grid Fees
0eeF noitcennoC noissimsnarT 0
TUOS Charges 0 0
Cross-Boundary Network ChargesTotal 0 0 0 0 0
Operating Costs
0 0
Network operating costs 0 0
Meter data services 0 0 xxxxx0revenue collection & gnilliB 0
Advertising/marketing 0 0
Customer service 0 0
Regulatory 0 0
0amortization lliwdooG xxxxx xxxxx xxxxxOther (See Apppendix 5) 0 0
Total 0 0 0 0 0
Executive Remuneration (included above) Audited
Statutory
Amount
Regulatory
Adjustment
Allocated to
Distribution
Business
Excluded
Services and
Other
Activities
Regulated by
Price Cap
Amount in $'000s 00
Headcount 00
Average in $s 0 0 0 0 0
AFIR_155-174_annex03.indd 164AFIR_155-174_annex03.indd 164 4/3/08 9:08:41 AM4/3/08 9:08:41 AM

165
Examples of Guidelines and Templates
A3
Regulatory Accounting Statement PA
Provisions
A separate table is required for each provision
Legal
Entity
Code/s
Statutory
Account Code
or Reference
<provision name>Audited
Statutory
Amount
AdjustmentsDistribution
Business
Excluded
Services and
Other
Activities
Regulated by
Price Cap
Workpaper
reference
00ecnalaB gninepO
00noisivorp morf diap seitilibaiL00tiforp ot degrahc noisivorp ni esaercnI00stnemtsujda rehtO
00000ecnalaB gnisolC
In addition, it is mandatory to produce for each provision that has been allocated to the Regulated Business Segments a supporting- written explanation of the need for the provision- written explanation of the movements in the provision.
Workpaper supporting Regulatory Accounting Statements
Noncausal allocations
For the period ended [ ] NA
No causal relationship could be established to allocate the items listed below. The amounts have been allocated to the regulated distribution business on the basis described which has been specificallyapproved by the office.
Description Legal
Entity
Code/s
Statutory
Account Code
or Reference
Audited
Statutory
Amount
Adjustments
(GL 3.4)
Distribution
Business
Excluded
Services and
Other Activities
Regulated by
Price Cap
$'000 $'000 $'000 $'000 $'000
Basis of allocation:
Reason for choosing this basis:
Date on which office approval granted:
AFIR_155-174_annex03.indd 165AFIR_155-174_annex03.indd 165 4/3/08 9:08:41 AM4/3/08 9:08:41 AM
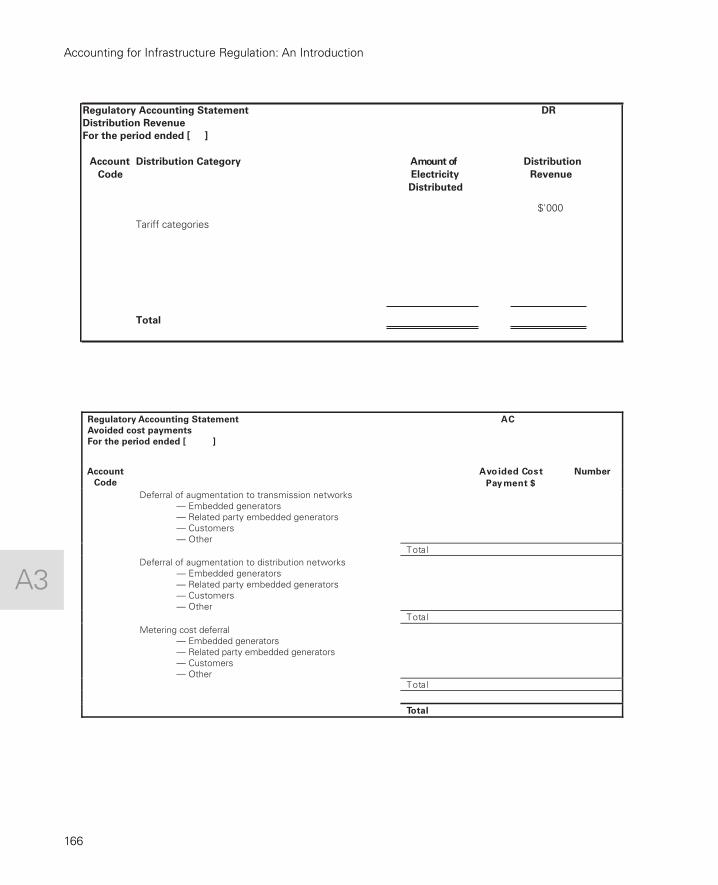
166
Accounting for Infrastructure Regulation: An Introduction
A3
Regulatory Accounting Statement DR
Distribution Revenue
For the period ended [ ]
Account
Code
fo tnuomA Distribution Category
Electricity
Distributed
Distribution
Revenue
$'000
Tariff categories
Total
Regulatory Accounting Statement
Avoided cost payments
For the period ended [ ]
AC
Account
Code
Avoided Cost
Payment $
Number
Deferral of augmentation to transmission networks — Embedded generators — Related party embedded generators — Customers — Other
Tota lDeferral of augmentation to distribution networks — Embedded generators — Related party embedded generators — Customers — Other
Tota lMetering cost deferral — Embedded generators — Related party embedded generators — Customers — Other
Tota l
Total
AFIR_155-174_annex03.indd 166AFIR_155-174_annex03.indd 166 4/3/08 9:08:41 AM4/3/08 9:08:41 AM

167
Examples of Guidelines and Templates
A3
United Kingdom: Ofwat Regulatory Accounting Guideline
Ofwat’s regulatory accounting guideline covers the requirements for accounting
information, with three exceptions: the current cost accounting methodology,
which is covered by regulatory accounting guideline 1 (RAG 1); the classifi cation of
expenditure (RAG 2); and the activity cost analysis and methodology (RAG 4).1
The guideline addresses (1) the appointee’s accounting statements, (2) the appointed
business’s activity cost analysis, (3) transactions with associated companies, and (4)
audit and publication of accounting statements.
United Kingdom: Ofwat Regulatory Accounting Statements—Templates
According to Ofwat’s regulatory accounting statements, all appointees must prepare
a profi t and loss account, a statement of assets and liabilities, and a statement of
source and application of funds. Each of these statements must address the appointed
business, the nonappointed business, and the total business of the appointee.
Regulatory accounting statements, “should, as far as is practicably possible, have
the same content as the statutory annual accounts of the Appointee and be pre-
pared in accordance with the formats and the accounting policies and principles
which apply to those annual accounts” (Ofwat 2002a). Appointees are to use one
format to present the information in the regulatory accounts for all companies.
The Ofwat Index to Regulatory Accounting Statements consists of the
• historic cost profi t and loss account,
• historic cost balance sheet,
• historic cost balance sheet reconciliation to statutory accounts,
• current cost profi t and loss account and current cost balance sheet,
• cash fl ow statement and analysis of turnover and operating income,
• current cost analysis of fi xed assets by asset type and service,
• current cost working capital,
• movement on current cost reserve,
• reconciliation of current cost operating profi t to net cash fl ow from operating
activities,
• analysis of net debt,
• regulatory capital value, and
• fi ve-year rolling summary—profi t and loss, and fi ve-year rolling summary—
balance sheet disaggregated activities.
AFIR_155-174_annex03.indd 167AFIR_155-174_annex03.indd 167 4/3/08 9:08:41 AM4/3/08 9:08:41 AM

168
Accounting for Infrastructure Regulation: An Introduction
A3
Some of the templates specifi ed in the index are presented.
Historic Cost Profit and Loss Account
for the Twelve Months
ended 31 March 20XX
Current
Year
Prior
Year
Note Appointed Nonappointed Total Appointed Nonappointed Total
Turnover (b) I I C I I COperating costs (b) I I C I I COperating income (b) I I C I I C
Operating profit (b) C C C C C COther income (b) I I C I I CInterest receivable (b) I I C I I CInterest payable (b) I I C I I C
Profit on ordinary activities Before taxation
C C C C C C
Taxation – current – deferred
(b) II
II
CC
II
II
CC
Profit on ordinary activitiesAfter taxation
C C C C C C
Extraordinary items (b) I I C I I C
Profit for the year C C C C C C
Dividends (b) I I C I I C
Retained profit for year C C C C C C
I: inputC: calculation(a) Note required; see separate table for further analysis.(b) Note required only if different from statutory accounts note.
AFIR_155-174_annex03.indd 168AFIR_155-174_annex03.indd 168 4/3/08 9:08:41 AM4/3/08 9:08:41 AM

169
Examples of Guidelines and Templates
A3
Historic Cost Balance Sheet
as of 31 March 20XX
Current
Year
Prior
Year
Note Appointed Nonappointed Total Appointed Nonappointed Total
Fixed assets
Tangible assets (b) I I C I I CInvestment I I C I I CTotal fixed assets C C C C C CCurrent assets
Stocks I I C I I CDebtors (b) I I C I I CCash at bank and in hand I I C I I CShort-term investments I I C I I CTotal current assets C C C C C CCreditors: Amounts falling
due within one year (b)
Borrowings I I C I I CDividends payable I I C I I COther creditors I I C I I CTotal creditors C C C C C CNet current assets C C C C C C
Total assets less current liabilities C C C C C C
Creditors: Amounts falling
due after one year (b)
Borrowing I I C I I COther creditors I I C I I CTotal creditors I I C I I C
Provisions for liabilities & charges- Deferred tax- Other provisions
(b)II
II
CC
II
II
CC
Deferred income (b) I I C I I CNet assets employed C C C C C C
Capital and reserves
Called up share capital I I C I I CShare premium I I C I I CProfit & loss account I I C I I COther reserves (b) I I C I I C
Capital & reserves C C C C C CI: inputC: calculation(a) Note required; see separate table for further analysis(b) Note required only if different from statutory accounts note
AFIR_155-174_annex03.indd 169AFIR_155-174_annex03.indd 169 4/3/08 9:08:41 AM4/3/08 9:08:41 AM

170
Accounting for Infrastructure Regulation: An Introduction
A3
Current Cost Analysis
of Fixed Assets
by Asset Type
Water ServicesSpecialized Nonspecialized Infrastructure Other TotalOperational Operational Assets Tangible
Assets Properties Assets
Gross replacement cost
At 1 April 20XX I I I I CAMP adjustment I I I I CRPI adjustment I I I I CDisposal I I I I CAdditions I I I I CAt 31 March 20XX C C C C C
Depreciation
At 1 April 20XX I I I I CAMP adjustment I I I I CRPI adjustment I I I I CDisposals I I I I CCharge for year I I I I CAt 31 March 20XX C C C C C
Net book amount at31 March 20XX
C C C C C
Net book amount at1 April 20XX
C C C C C
I: inputC: calculation
AFIR_155-174_annex03.indd 170AFIR_155-174_annex03.indd 170 4/3/08 9:08:41 AM4/3/08 9:08:41 AM

171
Examples of Guidelines and Templates
A3
Current Cost Cash Flow
Statement for Twelve Months
Ended 31 March 20XX
Current
Year
Prior
YearAppointed Nonappointed Total Appointed Nonappointed Total
Net cash flow from operating activities I I C I I C
Returns on investments & servicing offinance
Interest received I I C I I CInterest paid I I C I I CInterest in finance lease rentals I I C I I CPreference Non-equity dividends paid I I C I I CNet cashflow from returns on
investment & servicing of finance C C C C C CTaxationUK corporation tax paid I I C I I CCapital expenditure and financial investment
Gross cost of purchase of fixed assets I I C I I CReceipt of grants and contributions I I C I I CInfrastructure renewals expenditure I I C I I CDisposal of fixed assets I I C I I CNet cash outflow from investing activities
Acquisitions and disposals I I C I I CEquity dividends paid I I C I I C
Management of liquid resources
Withdrawals from short-term deposits I I C I I CDisposal or redemption of other liquid assets I I C I I CPurchase of short-term deposits I I C I I CPurchase of other liquid investments I I C I I C
Net cash flow from management of liquidresources
C C C C C C
Net cash flow before financing C C C C C CFinancingCapital element in finance lease rentals I I C I I CNew bank loans I I C I I CRepayment of bank loansProceeds from share issues I I C I I CNet cash inflow from financing C C C C C CIncrease (decrease) in cash and cash
equivalentsC C C C C C
I: inputC: calculation
AFIR_155-174_annex03.indd 171AFIR_155-174_annex03.indd 171 4/3/08 9:08:42 AM4/3/08 9:08:42 AM

172
Accounting for Infrastructure Regulation: An Introduction
A3
Current Cost
Working Capital
Current
Year
Prior
Year
Stocks I I
Trade debtors I I
Working cash balances I I
Trade creditors I I
Short-term capital creditors I I
Infrastructure renewals accrual/prepayment I I
Other accruals I I
Trade payments in advance I I
Payroll related taxes and social security contributions I I
Group trade debtors/(creditors) I I
Other short-term group debtors/(creditors) I I
Prepayments and other short-term debtors I I
Total working capital C C
I: input
C: calculation
AFIR_155-174_annex03.indd 172AFIR_155-174_annex03.indd 172 4/3/08 9:08:42 AM4/3/08 9:08:42 AM

173
Examples of Guidelines and Templates
A3
Analysis of Net Debt
At 1 April20XX
CashFlow
OtherNoncashCharges
Acquisitions At 31 March20XX
Cash in hand and bank I I I I C
Overdrafts I I I I C
Loans due after one year I I I I C
Loans due within one year I I I I C
Finance leases I I I I C
Current asset investment I I I I C
Total C C C C C
I: inputC: calculation
Regulatory
Capital Value
Note Current Year
Opening RCV for the year (a) I
Capital expenditure (a) I
Infrastructure renewals expenditure I
Grants and contributions I
Depreciation I
Infrastructure renewals charge I
Outperformance of RegulatoryAssumptions (5 years in arrears)
I
Closing RCV carried forward (a) C
Average regulatory capital value C
I: input
C: calculation
(a) Notes required : To explain that the table shows the RCV used in setting the price limits for the period2000-01 to 2004-05; the differences from the actual capital expenditure and depreciation etc. will not affectprice limits in the current period. Capital efficiencies will be taken into account in the calculation for the nextperiodic review.
Companies may also explain items which may be logged up and items of discretionary expenditure forpossible inclusion in the RCV in future. The commentary should note that these items will requireagreement with Ofwat prior to the next price-setting period.
AFIR_155-174_annex03.indd 173AFIR_155-174_annex03.indd 173 4/3/08 9:08:42 AM4/3/08 9:08:42 AM

174
A3
Accounting for Infrastructure Regulation: An Introduction
Notes
1. The current RAGs and drafts for consultation are available at www.ofwat.gov.uk/aptrix/
ofwat/publish.nsf/Content/navigation-publications-regulatoryaccountingguidelines.
Published Activity Cost Table–Water and Sewerage CompaniesAppointed Business–Revenue Account Only
Service Analysis
Water Supply Sewerage Services
Business Analysis£1000s
Resource &treatment
Distribution
Watersupplysubtotal
Sewerage
Sewagetreatment
SludgeT&DSubtotal
SewageT&D
subtotal
Sewerageservice
subtotal
Customerservices
Scientific
services
Costofregulaton
Direct CostsEmployment CostsPowerAgenciesHired and Cont. ServicesAssociated CompaniesMaterials and ConsumablesService ChargesOther Direct Costs
II
IIIII
II
III
I
CC
CCCCC
IIIIIIII
II
IIIII
II
IIIII
CCCCCCCC
CCCCCCCC
Total Direct CostsGeneral & Support Exp.
CI
CI
CC
CI
CI
CI
CC
CC
II
II
II
Functional ExpenditureCapital CostsCC DepreciationInfrastructure Ren. Exp.Inf. Ren. Accrual/Prepayment
C
III
C
III
C
CCC
C
III
C
III
C
I
C
CCC
C
CCC
C C C
Functional Cost C C C C C C C C
Total (from above)RatesDoubtful DebtsExceptional Intangible AssetsBusiness Acts. Cap. Costs
IIIIII
IIIIII
Service Cost C C
Services for Third PartiesTotal
IC
IC
CCA (MEA) ValuesService ActivitiesBusiness ActivitiesService Totals
I I CI
C
III
I I CI
C
CCC
Services for Third PartiesTotal
IC
IC
I: Input C: Calculation
AFIR_155-174_annex03.indd 174AFIR_155-174_annex03.indd 174 4/3/08 9:08:42 AM4/3/08 9:08:42 AM

175
Annex 4
Treatment of depreciation is an important issue for the regulator for several rea-
sons. First, because regulated utilities are capital-intensive industries, depreciation
is a major component of costs. Second, fl exibility in the approach to calculating
depreciation is considerable, resulting in a wide range of supportable profi les of
depreciation charges over time. Used judiciously, these profi les can smooth prices
and cash fl ows. But changes in depreciation profi les can also result in windfall gains
and losses if not handled carefully. Third, depreciation profi les can help reduce risk
for the investor. A greenfi eld gas pipeline may benefi t from low or negative depreci-
ation in its early years of operation, when it seeks to build the volume of gas trans-
ported. Conversely, a utility concerned about the threat of technological or policy
change for the use of current assets (for example, electricity network or generation
assets) may benefi t from a higher depreciation rate in the early years to reduce
future market or regulatory risks.
Perspectives on depreciation
For the accountant, depreciation is a means of allocating the outlays on physical
long-term assets as expenses of earning revenue in measuring periodic income.
Depreciation is central to the generally accepted accounting principle of matching
costs to the revenues earned in each period.1 Hence, the primary purpose of depre-
ciation is to allocate the net cost of the asset over the asset’s effective working life in
a systematic and rational way. The starting point is the cost of acquiring the asset,
and the end point is its residual value.
For the economist, depreciation is the change in the market value of the asset
over a period (normally a year). In this sense, depreciation is a direct measure of
Impacts of Alternative Depreciation Profi les
AFIR_175-186_annex04.indd 175AFIR_175-186_annex04.indd 175 4/3/08 9:09:48 AM4/3/08 9:09:48 AM

176
Accounting for Infrastructure Regulation: An Introduction
A4
economic income (being a change in net wealth). However, it does not matter
whether the change in value is owing to obsolescence, wear and tear, or a change in
exchange rates that affected the cost of a new equivalent asset. The accounting and
economic perspectives share the same starting point (the cost of acquiring the
asset) and end point (the asset’s residual value). Thus, net depreciation over the life
of the asset is the same.
In neither perspective is depreciation a means of funding the replacement of
assets, although it is often viewed that way. Depreciation is a noncash expense, and
when regulated prices are set at the sum of costs including depreciation, higher
depreciation will provide increased cash fl ows during that period.2 However, these
higher cash fl ows will be offset by lower depreciation and lower cash fl ows in other
periods.
Straight-line depreciation is the most common means of determining accounting
depreciation, but many other methods, such as reducing balance or production unit
depreciation (see discussion below), are possible. The economists’ view of deprecia-
tion is arguably more precise in theory but less useful in practice for the regulator.
For most of the assets commonly owned by a regulated operator, there exists no sec-
ond-hand market that is independent of the prices set by the regulator for the ser-
vices provided. Attempts to calculate economic depreciation require an assumption
of the prices that the regulator is to set. Hence, an element of circularity arises.3
Regulatory approaches to depreciation
The regulator will need to consider the full range of regulatory objectives in setting
depreciation requirements. Economic objectives will be important, but which of the
most commonly used approaches may most nearly approach economic deprecia-
tion remains unclear. In practice, the pattern of economic depreciation—the change
in the market value of an asset—is likely to differ between different asset classes (for
example, buildings and motor vehicles) even within a single utility. Therefore, fl exi-
bility in depreciation profi les is considerable, and the choice of profi les may refl ect
other objectives that can provide clearer guidance, such as administrative simplicity,
certainty and consistency, price stability, and intergenerational equity.
Depreciation profi les can affect the risks to asset owners of asset underutiliza-
tion or obsolescence. When these risks are beyond the operator’s control, there can
be merit in using depreciation profi les to reduce these risks through, say, acceler-
ated depreciation. However, the operator can often manage these risks to some
AFIR_175-186_annex04.indd 176AFIR_175-186_annex04.indd 176 4/3/08 9:09:48 AM4/3/08 9:09:48 AM

177
Impacts of Alternative Depreciation Profi les
A4
extent. It may be able to defer or stage capital expenditure to reduce its postexpen-
diture risks and reduce the risk of low capacity utilization through alternative pric-
ing structures. Hence, using depreciation to minimize postexpenditure risk is not
necessarily optimal.
In determining the approach to regulation, the key requirements for the regula-
tor are likely to be the following:
• The total (accumulated) depreciation over the asset’s life is equal to the differ-
ence between the undepreciated value and the residual value of the asset.
• Following from the previous point, any changes to the depreciation profi le have
a net present value–neutral effect on prices and the income stream.
• The approach is transparent, administratively simple, and consistent with inter-
generational equity.
Alternative approaches to depreciation
Many depreciation methodologies, varying in complexity and profi le of deprecia-
tion charges and prices over time, are available to the regulator.
Straight-line depreciation involves deduction of a constant percentage of the
undepreciated asset value from the opening asset value in each year. In historic cost
accounting, the result equates to a constant dollar amount found by dividing the
initial cost of the asset by its expected life. Straight-line depreciation can be criticized
as too simple and not properly refl ecting declines in the service potential or market
value of assets, but such depreciation is commonly used and easily applied.
Declining balance depreciation front-end loads depreciation (the dollar amount
of depreciation is largest in the early years of asset life). Such depreciation is calcu-
lated as a constant proportion of the opening asset value for each period. It may be
argued that this approach better refl ects the pattern of change in the market value
of some assets, such as motor vehicles. But arguably it does not refl ect well the
change in the market value of other assets, such as buildings.
Production unit depreciation involves estimation of the asset’s total output and
calculation of depreciation for each year on the basis of the actual year’s output.
This strategy may front-end load depreciation if use of an asset, like electricity gen-
erators, is likely to decline over the asset’s life. For other assets, such as substations,
production unit depreciation may defer depreciation, because loadings on those
assets may increase over their life. The production unit approach may be most use-
ful for assets with gradually used capacity, such as pipelines or transmission assets,
AFIR_175-186_annex04.indd 177AFIR_175-186_annex04.indd 177 4/3/08 9:09:48 AM4/3/08 9:09:48 AM

178
Accounting for Infrastructure Regulation: An Introduction
A4
because it avoids excessive unit prices in the early years, when the assets may be
lightly loaded.
Annuity depreciation is akin to the principal being repaid on a mortgage. For a
given constant annual revenue the net present value of which is equal to the original
cost of the asset, the depreciation in each period is the amount left after the deduc-
tion of a normal return on the opening value of the asset for the period. Annuity
depreciation is not often used in business but is sometimes proposed for regulated
utilities, because it yields a constant price over the asset’s life and reduces potential
price shocks as assets are replaced.
Estimation of asset lives
In principle, an asset should be depreciated over its expected productive life. This
practice is not essential, but an artifi cially short asset life is likely to magnify volatil-
ity in prices over time and result in intergenerational inequities as current custom-
ers pay for resources to be used by future customers. Conversely, asset lives that are
too long may raise funding concerns and result in intergenerational inequities as
future customers pay for resources used by current customers.
One challenge is to estimate asset lives accurately. The condition, and even the
age, of current assets may not be well known. The long life of infrastructure assets
also means that their useful economic lives may be diffi cult to estimate. The uncer-
tainties of obsolescence through technological change (for example, new, more
economic generation technologies) or policy change (for example, limits on out-
puts due to environmental concerns) make it diffi cult to estimate asset lives 30–50
years into the future. Some assets (such as water mains or aging gas pipelines) may
not be replaced but may have their service lives continually extended through main-
tenance and new technologies. In these cases, a renewal accounting approach may
be appropriate. Estimating total production over the asset’s life under a production
unit approach may be even more diffi cult than estimating the asset’s life in years.
Changing the assumed age of assets from time to time may be warranted.
Changing this age should be done carefully and prospectively. There should be no
modifi cation of past depreciation or re-estimation of the opening asset value on
the basis of the new assumed asset lives. The reasons are illustrated by (1) the
impact of different approaches to calculating depreciation on the recovering pro-
fi le of depreciation expenses and prices and revenues over time, and (2) the effect
of changing the approach to calculating depreciation or changing the assumed
asset life midway through an asset’s life. The examples below simplify analysis of
AFIR_175-186_annex04.indd 178AFIR_175-186_annex04.indd 178 4/3/08 9:09:48 AM4/3/08 9:09:48 AM

179
Impacts of Alternative Depreciation Profi les
A4
this impact and this effect by assuming one asset rather than numerous assets of
different ages and by assuming that regulated prices and revenues are established
from the build-up of costs (including a return on the asset base) so that the depre-
ciation profi le is directly related to the price and revenue profi le.
Impact of different approaches to calculating depreciation
Figures A4.1 and A4.2 compare straight-line, annuity, and declining balance depre-
ciation and the resulting price profi les. All values are in constant prices. Assump-
tions are as follows: (1) the asset costs 100 units and has a 40-year economic life; (2)
to derive the annuity depreciation, the weighted average cost of capital is 7 percent
(real); (3) for the diminishing balance depreciation the fi rst year is double that of
straight-line depreciation (that is, double declining balance), but a switch is made
to straight-line depreciation after year 20.
Each depreciation profi le yields income streams with the same net present value
over the life of the assets, but the depreciation in any given year can vary signifi cantly
among the depreciation profi les. In practice, however, the extreme differences
1 2 3 4 5 6 7 8 9 10 11 12 13 14 15 16 17 18 19 20 21 22 23 24 25 26 27 28 29 30 31 32 33 34 35 36 37 38 39 40
1
0
2
3
4
5
6
7
8
Declining balance
Annuity
Straight line
Year
Figure A4.1 Depreciation Charge Profi les over Time
Source: Allen Consulting Group 2003, 20.
AFIR_175-186_annex04.indd 179AFIR_175-186_annex04.indd 179 4/3/08 9:09:48 AM4/3/08 9:09:48 AM

180
Accounting for Infrastructure Regulation: An Introduction
A4
between the total depreciation charges in any year under the alternative profi les will
not be observed, because an operator will have many assets of many different ages.
Total depreciation will be the sum of the depreciation charge for individual assets
of different ages; therefore, the effect of different depreciation profi les will be aver-
aged out.
However, changing from one depreciation profi le to another during an asset’s
life can create signifi cant changes in prices and, if not handled carefully, windfall
gains or losses.
Impact of changing depreciation profi les
Figures A4.3 and A4.4 show the impact of switching from straight-line deprecia-
tion to annuity depreciation after 15 years. Until year 15, the asset is depreciated
on a straight-line basis. The depreciated value at the end of year 14 is then depreci-
ated over the remaining 25 years on a declining balance basis. A consequence of
changing depreciation profi les is that the change in depreciation and revenues
may be signifi cant. Depreciation drops below what it would have been if the
declining balance were used from the start of the asset’s life, and revenues also
1 2 3 4 5 6 7 8 9 10 11 12 13 14 15 16 17 18 19 20 21 22 23 24 25 26 27 28 29 30 31 32 33 34 35 36 37 38 39 40
2
0
4
6
8
10
12
14
Declining balance
Annuity
Straight line
Year
Figure A4.2 Prices over Time under Different Depreciation Charge Profi les
Source: Allen Consulting Group 2003, 21.
AFIR_175-186_annex04.indd 180AFIR_175-186_annex04.indd 180 4/3/08 9:09:49 AM4/3/08 9:09:49 AM

181
Impacts of Alternative Depreciation Profi les
A4
1 2 3 4 5 6 7 8 9 10 11 12 13 14 15 16 17 18 19 20 21 22 23 24 25 26 27 28 29 30 31 32 33 34 35 36 37 38 39 40
1
0
2
3
4
5
6
7
8
Switch after year 15
Annuity
Straight line
Year
Figure A4.3 Switch from Straight-Line to Annuity Depreciation: Depreciation Profi le
Source: Allen Consulting Group 2003, 22.
1 2 3 4 5 6 7 8 9 10 11 12 13 14 15 16 17 18 19 20 21 22 23 24 25 26 27 28 29 30 31 32 33 34 35 36 37 38 39 40
1
0
3
4
6
7
8
10
2
5
9
Switch after year 15
Annuity
Straight line
Year
Figure A4.4 Switch from Straight-Line to Annuity Depreciation: Price Effects
Source: Allen Consulting Group 2003, 23.
AFIR_175-186_annex04.indd 181AFIR_175-186_annex04.indd 181 4/3/08 9:09:49 AM4/3/08 9:09:49 AM

182
Accounting for Infrastructure Regulation: An Introduction
A4
drop sharply. However, because the depreciated value of the asset at the end of year
14 is used as the starting point, two highly desirable properties are preserved: total
depreciation (undiscounted) over the asset’s life is unchanged, and the income net
present value of the net income stream over the asset’s life is unchanged.
Under some systems, assets are revalued to their depreciated replacement cost at
the start of the regulatory period. Depreciation would be double counted, to a
degree, under these systems, and the new depreciation rate would be used to estab-
lish the opening asset value. In fi gures A4.3 and A4.4, annual depreciation and rev-
enues track annuity lines as if the asset had been depreciated on an annuity basis
from the outset. The result is that total depreciation over the asset’s life exceeds the
asset’s original value and that the net present value of the income stream increases
over the asset’s life.
Impact of changing the assumed asset life
Changing an asset’s assumed life midway through its life can have a similar effect
(fi gure A4.5). In this example, optimized replacement costs are used to value the
asset at the start of each regulatory period. Better asset maintenance, better assets,
or better information may mean that assets are expected to have a longer service
life. However, if the new asset life assumption is used to calculate the depreciated
asset value, the asset is being double depreciated, resulting in a windfall gain for the
operator. To avoid this result, the opening depreciated asset value has to be calcu-
lated under the previous asset life assumptions so that the change in assumed asset
lives has only a prospective impact. If more than one change has been made in
assumed asset lives, the opening asset value would need to be calculated sequen-
tially using the relevant asset valuation assumption for each period.
Treatment of depreciation on variations
from forecast capital expenditure
The issue of depreciation of the over- and underexpenditure relative to forecast
may arise if a prospective price cap is set on the basis of forecast capital expenditure.
Treatment of such depreciation will be linked to the regulator’s approach to effi -
ciency incentives.
One option is to roll forward the asset base between reviews by adding capital
expenditure to the asset as incurred and depreciating the asset from that point using
AFIR_175-186_annex04.indd 182AFIR_175-186_annex04.indd 182 4/3/08 9:09:49 AM4/3/08 9:09:49 AM

183
Impacts of Alternative Depreciation Profi les
A4
the standard depreciation life for the asset. In this case, if expenditure is less than
forecast, actual depreciation is less than that built into revenue and price controls.
The converse applies to overexpenditures. Hence, incentives for greater effi ciency
are increased, but the risks for poor returns on unexpected capital expenditure
requirements are also increased.
The other option is to roll forward the asset base by adding actual capital expen-
diture to the asset base and deducting the forecast depreciation. In effect, expendi-
ture in excess of forecast expenditure is included in the next regulatory asset base at
its undepreciated value—its depreciation is deferred, not forgone. The converse
applies to underexpenditure. This treatment for over- and underexpenditures
reduces incentives for effi ciency improvements, but it also reduces risks for the
operator from unexpected variations in capital expenditure requirements.
The regulator’s primary obligation is to clearly specify the proposed treatment
of depreciation in the roll forward of the asset base at the start of the regulatory
period, and to incorporate this treatment in the accounting rules.
Ass
et v
alue
Time
OR
C
OD
RC
Rev
alua
tion
date
Ass
et v
alue
Time
OR
C
DO
RC
Rev
alua
tion
date
Historical valuation and depreciation profile
Revaluation of partially depreciated asset Revaluation of fully depreciated asset
Proposed valuation and depreciation profileProspective application of revised depreciation profile
Figure A4.5 Revaluation of a Partially Depreciated Asset and a Fully Depreciated Asset
Source: Authors.ORC = Optimized replacement cost.DORC = Depreciated optimized replacement cost.
AFIR_175-186_annex04.indd 183AFIR_175-186_annex04.indd 183 4/3/08 9:09:49 AM4/3/08 9:09:49 AM

184
Accounting for Infrastructure Regulation: An Introduction
A4
Data requirements
Regulatory depreciation can be calculated at the various levels of disaggregation.
In principle, depreciation could be calculated at a highly aggregated level. Typi-
cally, a regulated operator will have a mix of system assets and nonsystem assets;
variation between the two groups is often substantial. The balance between these
categories of assets is likely to vary over time. Furthermore, if there are related-
party transactions or unregulated outputs, the underlying activities are unlikely to
use system assets and nonsystem assets in the same proportion as the core monop-
oly activities. For both reasons—variation in the composition of assets over time
and variation between the related-party or unregulated activities and the monopoly
activities—a split between system assets and nonsystem assets is likely to be the
minimum requirement.
In practice, these reasons, together with the possible concern over allocation of
costs among regulated service categories, are likely to result in the need for a more
disaggregated approach. The challenge for the regulator is to balance the complex-
ity of its fi nancial modeling and the additional data burdens on the utility against
the benefi ts of more accurate modeling of depreciation and attribution of costs.
Given the selected level of disaggregation, the regulator can specify the classifi ca-
tion scheme for a regulatory asset register. This scheme is the basis for tracking
depreciation, capital expenditure, disposals, and the roll forward of the regulatory
asset base. The regulator will also need to specify the average asset life to be used for
each asset category.
Principles for depreciation
Seven principles should guide regulatory treatment of depreciation:
• A simple, easily implemented approach to calculating depreciation, such as
straight depreciation, is often preferred. However, some fl exibility should be
provided on this approach.
• The simplest, most easily implemented approach is unlikely to match economic
depreciation, but whether economic depreciation would be front-end or back-
end loaded depends on the operator’s specifi c assets. No one approach is neces-
sarily more likely to refl ect the economic depreciation of individual assets than
another.
AFIR_175-186_annex04.indd 184AFIR_175-186_annex04.indd 184 4/3/08 9:09:49 AM4/3/08 9:09:49 AM

185
Impacts of Alternative Depreciation Profi les
A4
• Matching of regulatory depreciation with tax depreciation is neither likely nor
necessarily desirable.
• Applying a uniform approach (but not uniform asset life) to all assets has strong
merits, including clarity, simplicity, and easy verifi cation.
• Maintaining a consistent approach to and assumptions about depreciation over
time can help operators avoid uncertainty and the risks of windfall gains or
losses.
• However, regulators should leave open the option of revising the depreciation
profi le and assumed asset lives in light of
° changing information on assets’ conditions and lives,
° the need to avoid unnecessary exposure to potential market risks, and
° the need to manage potential price or cash fl ow shocks.
• When assumed asset lives or depreciation profi les are changed, they should have
a prospective impact—the opening asset value before the change should be esti-
mated on the basis of the previous depreciation assumptions.
Notes
1. The matching principle requires “that the value of all resources consumed in the process of
earning the current period’s revenue must be charged against that revenue before any operating
profi t is earned” (Barton 1977, 74).
2. Although unregulated businesses may also be tempted to view depreciation as a source of
cash fl ows, if prices are set in the market, net cash fl ow is the difference between cash revenues
and cash expenses. Depreciation may account for a signifi cant component of this gap. Changing
the rate of depreciation provides no additional cash, but it does alter the allocation of free cash
fl ows between profi ts and depreciation.
3. One suggestion is that the regulator should assume a uniform price for the asset’s services
over the asset’s life and calculate the value of the asset at the end of each year on the basis of the
net present value of the hypothetical income stream over the remainder of the asset’s life. The
resulting profi le for depreciation is similar to the repayment of principal on a loan—low in the
early years and high in the last years of the asset’s life.
AFIR_175-186_annex04.indd 185AFIR_175-186_annex04.indd 185 4/3/08 9:09:49 AM4/3/08 9:09:49 AM

AFIR_175-186_annex04.indd 186AFIR_175-186_annex04.indd 186 4/3/08 9:09:49 AM4/3/08 9:09:49 AM

187
Annex 5
Technical performance indicators are quantitative or qualitative indicators related
to a particular performance aspect of a company. These indicators can be related to
values used as benchmarks to help explain positive or negative deviations from
performance values. The fi nal step in analysis of historical data is to put company
performance in the context of overall industry performance and the performance
of other similar companies in the region. Ratio analysis is then a valuable tool to
assist the analyst in answering questions about how well the company is doing or
how effi cient it is compared with other companies.
However, any indicator portrays an incomplete picture of a company, because it
often excludes other contributing factors (institutional, incentives). As a result,
indicators cannot be used mechanically, and critical judgment is needed to inter-
pret them.
Indicators are based on data from management information systems. Hence,
having a reliable information system is as important as choosing the right
indicators.
The following defi nitions (drawn from World Bank 1996) are some commonly
used indicators:
• Working ratio: The working ratio is the ratio of operating costs to operating rev-
enues. The common defi nition of this ratio excludes depreciation and interest
payments from costs. When used for utilities analysis, sound fi nancial manage-
ment requires a working ratio well below 1. Caution should be used in interpret-
ing this ratio when there is evidence that utilities are cutting down on mainte-
nance costs that would improve the working ratio but that could lead to a critical
situation in the future. The operating ratio is similar to the working ratio but
includes depreciation and interest payments.
List of Sample Performance Indicators
AFIR_187-188_annex05.indd 187AFIR_187-188_annex05.indd 187 4/3/08 9:10:38 AM4/3/08 9:10:38 AM

188
Accounting for Infrastructure Regulation: An Introduction
A5
• Personnel costs/operating costs: Personnel costs are expressed as a ratio of total
operating costs (depreciation and debt service excluded). Depreciation and debt
are excluded because of the lack of uniformity in treating revaluation of fi xed
assets and to facilitate comparison of utilities with and without debt service
obligations.
• Staff productivity index: This index relates the number of staff to the number of
connections. As a guideline, a staff productivity index of less than 4 could be
considered adequate, but with room for improvement. A reduction in the index
cannot necessarily be interpreted as an increase in effi ciency. To complete the
analysis of staff productivity, expenditures on personnel (personnel costs/oper-
ating costs) also need to be examined. An alternative is an analysis based on pro-
duction: number of staff/production (kilowatt hours for electricity or cubic
meters for water, for example).
• Unit operational cost: This ratio is normally computed as operational costs/pro-
duction. Differences in this ratio between companies can be associated with dif-
ferences in quality levels.
There are also some technical indicators that regulators normally watch when
dealing with quality issues, metering, and network length, among others:
• Consumption: Consumption is average daily consumption per person served or
average daily consumption per connection served (for example, liters for water
or kilowatt hours for electricity per capita per day). The distinction between user
and connection is particularly important in countries where no individual
metering exists, and different users are connected to one connection.
• Network length: This length is the length of distribution network as a function of
number of people served (kilometers/users) or as a function of connections
(kilometers/connections).
• Distribution losses: A major concern about utility operations is the level of losses.
Basically, losses refl ect the difference between deliveries to the distribution sys-
tem and quantities sold. The level of losses is a good proxy for overall effi ciency
of operations. Distributional losses as defi ned here include physical losses as well
as commercial losses (illegal connections). Other defi nitions can isolate the effect
of commercial losses. The two types of losses have different regulatory implica-
tions: physical losses can be reduced to a certain minimum (and hence there is
an optimal allowed level of optimal losses), but commercial losses can be reduced
by a company’s specifi c actions against illegal connections.
AFIR_187-188_annex05.indd 188AFIR_187-188_annex05.indd 188 4/3/08 9:10:39 AM4/3/08 9:10:39 AM

189
Annex 6
Consider a simple case in which a company produces two products, A and B, and
management wants to undertake a detailed cost analysis of each product. Manage-
ment already has the information about the revenues generated by A and B sepa-
rately, because this information is usually easy to obtain.
Step 1: Identify cost objectives
Identify the cost objectives—in this case, product A and product B.
Step 2: Identify direct costs
On the basis of accounting information and knowledge of costs and production
process, identify direct costs.
First, identify all direct costs—all costs that can easily be traced directly to product
A or product B, such as direct labor costs (salary costs of workers involved only in the
production of product A or product B) and direct materials (raw materials used only
in the production of product A or product B). Figure A6.1 illustrates the process.
Step 3: Classify indirect costs and allocate cost pools to cost objectives
Classify all remaining costs, which are indirect costs, into categories related to each
of the cost objectives, and group them into cost pools. On the basis of activity-
based costing, identify all the different activities involved in the production of
Cost Allocation: Illustration of a Step-by-Step Approach
AFIR_189-192_annex06.indd 189AFIR_189-192_annex06.indd 189 4/3/08 9:11:28 AM4/3/08 9:11:28 AM

190
Accounting for Infrastructure Regulation: An Introduction
A6
product A and product B, such as purchasing, customer management, and so on.
Then identify the cost allocation bases to allocate the different cost pools to the cost
objectives (fi gure A6.2).
Accounting information
Direct labor costs
Direct materials
Indirect costs
Product BProduct A
Tracing direct costs to cost objectives
Figure A6.1 Identifying Direct Costs
Accounting information
Direct labor costs
Direct materials
Top management
salaries
Marketingcosts
Otherindirectcosts
Cost poolpurchasing
Cost poolcustomer
management
Othercost pools
Product BProduct A
Figure A6.2 Classifying Indirect Costs and Allocating Cost Pools to Cost Objectives
AFIR_189-192_annex06.indd 190AFIR_189-192_annex06.indd 190 4/3/08 9:11:28 AM4/3/08 9:11:28 AM

191
Cost Allocation: Illustration of a Step-by-Step Approach
A6
Box A6.1 provides an example of this process for power and maintenance costs.
Box A6.1 Example of Allocation of a Specifi c Pool of Costs: Power and Maintenance Costs (overhead manufacturing costs)
Different machines are necessary to produce products A and B. The direct costs (direct labor and direct raw materials) linked to the machines have been traced easily to each product. Now other indirect costs have to be allocated. All costs linked to use of machines, such as power and mainte-nance, could be regrouped. Machine hours can be chosen as the cost driver that explains the variations of power cost and maintenance cost (the more machine hours, the higher the power and maintenance costs). After all costs related to power and maintenance are regrouped in a spe-cifi c cost pool, the costs for that pool are totaled. Then the total cost of that pool is divided by the number of machine hours to obtain the pool rate, which equals cost / machine hour. Then the number of machine hours used to produce product A is estimated, and the cost (number of machine hours multiplied by pool rate) of product A is assigned.
Source: Authors.
AFIR_189-192_annex06.indd 191AFIR_189-192_annex06.indd 191 4/3/08 9:11:29 AM4/3/08 9:11:29 AM

AFIR_189-192_annex06.indd 192AFIR_189-192_annex06.indd 192 4/3/08 9:11:29 AM4/3/08 9:11:29 AM

193
Annex 7
The overview of international experience presented below suggests that consensus
on the best way to value the assets of a regulated fi rm does not exist. Regardless of
the method adopted, a basic requirement is consistency in the valuation of assets
over time.
The U.S. Interstate Commerce Commission (ICC) considered replacement cost
based on present values to be “impractical, extremely expensive and subjected to
great differences of opinion regarding the value,” and other regulatory agencies
concluded that “the net effect of this load is that the commission’s ability to prop-
erly serve users is endangered” (Goodman 1998, 770). Another drawback of replace-
ment cost is the underlying assumption that the existing plant would be exactly
reproduced, an unlikely occurrence if the plant had to be rebuilt at current prices
and in light of the possibility that a more effi cient or economic plant might
be built.
In the case of recently privatized companies, the use of replacement cost for
valuing assets results in effi cient tariffs from an allocative point of view; however, it
gives investors an extraordinary return on capital against users every time the con-
cession fee is lower than said replacement cost.
In view of all these problems, U.S. regulatory practice fi nally settled on use of the
original (historic) cost of assets (Goodman 1998, 775, 777), which is represented by
the cash spent on the property engaged in the public service, and regulators resorted
to the company’s books to get the relevant information for the asset base valuation.
An advantage of this method, as reported in Goodman (1998, 776), is that “it is
based on well defi ned facts; it is not subject to unlimited imagination or sharp fl uc-
tuations of prices and, therefore, it represents a more accurate measure of the value
on which the owner will be allowed to earn a return—through tariffs [...].” At the
Regulatory Asset Base Valuation
AFIR_193-204_annex07.indd 193AFIR_193-204_annex07.indd 193 4/3/08 9:12:47 AM4/3/08 9:12:47 AM

194
Accounting for Infrastructure Regulation: An Introduction
A7
same time, it “stabilizes tariffs so economic shocks are greatly reduced....” (Good-
man 1998, 776). According to Goodman (1998, 776–77),
the arguments in favor of using the original cost to calculate the asset base are
overwhelming....it is quite simple and objective to determine the original cost...
the use of a fair value rather than the original cost calls for substantially more
preparation on the company and agency’s staff, whose costs are ultimately sup-
ported by the consumers.
Privatization of public utilities introduces a new dimension to this valuation
problem, because the sale in itself implies, to some extent, breaking with the previ-
ous situation. This dimension came to regulators’ attention with privatizations in
the United Kingdom. The market value of electricity, gas, and water companies at
the time of privatizations was substantially lower than the historic cost (adjusted)
of the companies’ assets. Applying the cost of capital to said cost resulted in a return
for the company that appeared to be unfairly split between shareholders and
consumers.
The Monopolies and Mergers Commission (MMC) initially resolved this matter
in its review of British Gas (MMC 1993). The commission decided to compensate
investors on the basis of the market value of their assets on a specifi c postprivatiza-
tion date, rather than on the basis of replacement cost. This approach has become
common practice for determination of the regulatory value of assets (Grout
1997).
Slightly different variants of this approach are also in use. For example, asset
value can be determined on the basis of market value on a specifi c date; in this case,
the cost of capital employed for the old assets (before that date) is not the total cost
of capital but that amount reduced by the market-to-asset ratio. The UK general
director of electricity based his proposals for regulatory value of assets on the initial
market value of the company (at the end of the fi rst day of operations). He argued
that the expectations revealed by investors was a more solid basis on which to deter-
mine the company’s value than the book value of assets or the value set by the gov-
ernment for the privatization (fl otation price) (MMC 1997). In his opinion, inves-
tor expectations would take into account any deliberate undervaluation of shares
made to ensure the success of the sale. The director general believed that investors
had to be compensated for what they had actually paid.
During its review of electricity distribution companies, the UK Offi ce of Elec-
tricity Regulation (OFFER) stated that
AFIR_193-204_annex07.indd 194AFIR_193-204_annex07.indd 194 4/3/08 9:12:47 AM4/3/08 9:12:47 AM

195
Regulatory Asset Base Valuation
A7
it is appropriate to take into account the money effectively paid to purchase the
company, and not just the accounting value of assets. The valuation of a com-
pany at the moment of “fl otation” refl ects what the original shareholders consid-
ered to be the prospective fl ow of future dividends, taking into account the infor-
mation in a very detailed Prospect and the risks associated to the investment and
valuing each company completely. It would be wrong not to consider this matter
fairly important. (OFFER 1994)
On the other hand, using the amount actually paid by investors at the moment
of privatization can be disadvantageous, because it may result in ineffi cient tariffs
from the standpoint of allocative effi ciency (because the tariffs fall below the eco-
nomic cost of service provision), though fair from the point of view of effective
capital investment. The main objection to use of this method is the circular nature
of the determination: what the company paid during privatization represents the
net present value of future cash fl ow, and the cash fl ow depends on tariffs set in the
future. This method would, in theory, remove any limit on the amount to be paid
by the company. If the principle were applied, the next tariff review would necessar-
ily incorporate the purchase value into tariffs, thus ensuring a fair and reasonable
rate of return on whatever was paid for the assets. This circularity problem between
market value and tariffs is not relevant during tariff review, because the idea that
the amount to be paid by the company is unlimited is completely untrue. The cir-
cularity argument can be strictly applied only to determination of tariffs and the
value of capital at the same moment in time.
As regards privatizations, OFFER sets tariffs, on the basis of which it determines
a company’s value. At the tariff review, the value of capital is given by the price paid
at the privatization so that the value can be used to determine tariffs without raising
circularity problems.
In other countries, particularly in Chile, regulation is based almost exclusively
on the replacement value of a system economically adapted to expected level of
demand in a predefi ned time horizon (typically fi ve years). This so-called model
effi cient company method rests on the idea of promoting effi cient tariffs from the
point of view of allocation, without considering sustainability to any great extent.
In regulation of the model effi cient company in Chile, valuation departs from
the depreciated optimized replacement cost (DORC), because for each tariff review,
100 percent of the assets necessary to meet demand are considered but are unad-
justed according to their economic life. In this sense, the regulated asset base has no
relation to the investment effectively carried out by the company.
AFIR_193-204_annex07.indd 195AFIR_193-204_annex07.indd 195 4/3/08 9:12:48 AM4/3/08 9:12:48 AM

196
Accounting for Infrastructure Regulation: An Introduction
A7
In Australia, the statement of principles for the regulation of electricity network
revenues establishes the framework for a sector’s regulation. The statement proposes
that the maximum value for the regulatory asset base be given by the DORC of a
transmission company’s assets. The DORC valuation of the regulatory asset base is
rolled forward between reviews by adding proposed capital expenditure and deduct-
ing depreciation. At the next review, a new estimate of the DORC may be made.
Determination of a DORC valuation involves three stages. First, the optimal
confi guration (network setup) of assets is identifi ed. Second, the costs of the assets
that would form part of this optimal network are calculated. Finally, the assets are
depreciated using the standard economic life of the asset, together with an estimate
of the asset’s remaining life.
Valuation approach
To establish required revenue, the regulator must fi rst clarify what constitutes the
opening asset base. The approach to be adopted for valuing the opening asset base
and the revenue necessary to cover an appropriate rate of return on assets will be
infl uenced by interpretation of the asset base’s nature.
The point is to determine whether the asset base represents shareholders’ fi nan-
cial investments in the fi rm (maintenance of the fi rm’s fi nancial capital in real
terms) or the fi rm’s physical assets (the company’s ability to keep the same output
level of assets over time). Box A7.1 summarizes the two alternatives, as defi ned by
the Accounting Standards Committee for the United Kingdom.
The amount taken as the return on capital will depend on the approach, whether
based on physical assets or fi nancial investments. If the fi nancial investments
approach is adopted, the amount will represent the profi t needed to maintain the
purchasing power of the investments made by shareholders. If the physical capital
approach is adopted, the return on capital will be represented by the amount of
depreciation of the sum required to replace (or renew) the stock of existing assets,
when and as needed. In some cases, both approaches can be equivalent, though sig-
nifi cantly different.
It could be argued that, under the physical capital approach, assets paid for or
contributed by consumers augment a company’s capacity to provide services and
therefore should be included in the calculation. Furthermore, these assets will even-
tually be replaced or renovated. A fi nancial view of the asset base would exclude
AFIR_193-204_annex07.indd 196AFIR_193-204_annex07.indd 196 4/3/08 9:12:48 AM4/3/08 9:12:48 AM

197
Regulatory Asset Base Valuation
A7
assets paid for or contributed by consumers from calculation of assets in determi-
nation of required revenue, because these assets are not part of the fi nancial capital
invested by shareholders. It could be argued that their inclusion would result in the
user paying twice for the same asset.
The asset base used to determine the return will vary, depending on the concepts
chosen. From the fi nancial investment perspective, the monetary investment should
be adjusted if the purchasing power of the currency changes. Under the physical
capital approach, the asset base will vary according to asset replacement expense.
Box A7.1 Two Valuation Approaches Defi ned by the UK Accounting Standards Committee
The UK Accounting Standards Committee handbook, Accounting for the Effects of Changing Prices (1986), discusses two alternative measures of a company’s profi ts.
Real fi nancial capital maintenance is concerned with maintenance of the real fi nancial capital of a company and with the company’s ability to continue fi nancing its functions. Under real fi nancial capital maintenance, profi t is measured after provision has been made to maintain the pur-chasing power of opening fi nancial capital. This calculation involves use of a general infl ation index such as the retail price index. Real fi nancial capi-tal maintenance, therefore, addresses the principal concerns of share-holders. In the absence of general infl ation, real fi nancial capital mainte-nance is equivalent to conventional historical cost accounting, with the exception of the treatment of unrealized holding gains.
Operating capability maintenance is concerned with maintenance of the physical output capability of a company’s assets. Profi t is measured after provision has been made for replacing the output capability of a company’s physical assets (a major concern of management). This opera-tion involves use of specifi c infl ation indexes, such as the construction price index or the Baxter index, to adjust asset values. This approach was used in Statement of Standard Accounting Practice (SSAP) 16—Current Cost Accounting (this standard was withdrawn).
Source: Authors.
AFIR_193-204_annex07.indd 197AFIR_193-204_annex07.indd 197 4/3/08 9:12:48 AM4/3/08 9:12:48 AM

198
Accounting for Infrastructure Regulation: An Introduction
A7
The two approaches require different indexes to express the asset value in real
terms (that is, constant dollars). Under the fi nancial investment approach, a general
price index should be used, because it refl ects the change in the purchasing power
of money. Under the physical capital approach, the ideal choice would be an index
(or a properly weighted combination of indexes) that refl ects inasmuch as possible
the changes in costs related to the purchase/installation/construction of the assets.
Table A7.1 summarizes the advantages and disadvantages of the different
alternatives.
Once an approach is chosen, regulatory decisions on the return on capital,
indexation, redundant assets, and other matters must be consistent with that
approach.
Regulatory asset base and accounting
Privatizations introduce a break in the institutional scheme of the sector, which
necessarily affects the way a fi rm’s capital is refl ected. The relation between the reg-
ulated asset base and the value of capital in the fi rm’s fi nancial statements will
Table A7.1 Advantages and Disadvantages of Financial Investment and Physical Capital Approaches
Financial investment approach Physical capital approach
Advantages • It is simple. There is no need to value • It focuses on maintaining the fi rm’s output the replacement costs of specifi c assets capacity—the services rendered to customers. or make adjustments for obsolescence.
• It ensures maintenance of the purchasing • It allows adjustments in case of assetpower of the opening investment, which obsolescence or poor investment decisions. represents the main requirement from the investor’s point of view.
Disadvantages • Physical investments and fi nancial • It requires complex formulation and yieldsinvestments are unrelated. results subject to different interpretations.
• It can maintain the fi nancial capital • It entails greater costs in implementationregardless of inappropriate investments (data validation and so on).or obsolescent assets. In competitive • It increases the problem of informationmarkets, this leads to a loss of market value asymmetry for the regulator by increasingin competitive markets. the technical complexity of regulation.
Source: Authors.
AFIR_193-204_annex07.indd 198AFIR_193-204_annex07.indd 198 4/3/08 9:12:48 AM4/3/08 9:12:48 AM

199
Regulatory Asset Base Valuation
A7
depend greatly on the treatment given to the initial capital value during the privati-
zation process. This effect is only temporary. As time passes, the fi rm’s fi nancial
statements refl ect the investments carried out under the new rules, and the valua-
tion at the time of privatization loses its relative weight. However, due to the typical
long useful life of infrastructure assets, this transition may last for several decades.
The following sections review real cases of asset valuation in Argentina, the
United Kingdom, Bolivia, and Chile and a case involving accounting assets in
Mali.
Asset Valuation on the Basis of Best Bid Price: Argentina
The Argentine case concerns creation of a new company and valuation of the assets
to be transferred based on the best bid price.
Argentina began its privatization process in 1991. A basic law governing the sec-
tor was passed by Congress in December 1991 and went into effect in January 1992.
The main thermal plants and distribution and transmission companies owned by
the national government were sold to the private sector through competitive bid-
ding in 1992 and 1993, and most of the national government’s hydro plants were
sold the following year. Segba, the state-owned electricity company, was divided
into seven companies: four generation companies and three distribution compa-
nies: Edenor, Edesur, and Edelap.
Valuation of the initial asset base was similar for Edenor and Edesur.1 Each com-
pany’s initial valuation (July 1992) was made by Banco Nacional de Desarrollo
(Banade) on the basis of forecast cash fl ows and was considered the offi cial bud-
geted value. This valuation was supposed to be the accounting valuation at the
moment of privatization, and no mention was made of the price paid in the bid-
ding process. However, decree 282/93 (February 1993) took into account the fact
that the offi cial value proposed by Banade was signifi cantly below the price obtained
in the bidding process, and thus it stated that assets were to be valued on the basis
of the price paid in the bidding process. As a result, fi nancial statements were calcu-
lated from scratch on a paid price basis—the price obtained in the bidding pro-
cess—to refl ect the true market value at the time.
Flotation of Shares on the Stock Market: United Kingdom
The UK case illustrates the sale of an existing company through fl otation of its
shares on the stock market. The new companies own the assets and operate under
AFIR_193-204_annex07.indd 199AFIR_193-204_annex07.indd 199 4/3/08 9:12:48 AM4/3/08 9:12:48 AM

200
Accounting for Infrastructure Regulation: An Introduction
A7
licences. The values that they paid were substantially lower than the adjusted his-
toric values in the fi nancial statements.
The issue of the valuation of existing assets was addressed in the water and gas
industries. At privatization, this valuation was intended to ensure that existing
owners would neither gain nor lose from the change in regime. Calculations of the
“indicative value” required estimation of the cash fl ows that the existing assets
would have generated if the regulatory regime had not changed. The discounted
value of this cash fl ow is defi ned as the indicative value (IV):
IVzK D
r
z
rK
r z
r
D
rt t
tt
Tt
tt
= ++
= + −+
−
=∑ 1
10
1 1( )
( )
( )==∑
1
T
,
where Kt–1
is the replacement cost value of assets at the end of period t–1, Dt is asset
depreciation (current cost), r is cost of capital, z is the accounting rate of return on
existing assets, and K0 is the replacement cost at the end of period 0.
This complicated procedure was necessary because assets that were in the public
sector had no observable market value before privatization. However, when prices
were reset, some corrections were made to transform that value into an equivalent
market value. For example, when reviewing the rate of return for the transportation
assets of British Gas (BG), the Monopolies and Mergers Commission (MMC)
stated that
Ofgas and BG agreed on the need to allow for the difference between the amounts
realized from the sale of BG and BG’s CCA [capital cost allowance] asset value
at that time, and for subsequent discrepancies between the stock market’s valua-
tion and CCA-based values, referred to [...] as the market to assets ratio (MAR)
[...] on balance a MAR of 60 percent would seem reasonable, allowing share-
holders to retain many of the gains since privatization. This ratio is of course to
be applied only to the return on existing assets; it does not affect the return on
new investment. (MMC 1993)
Although the company and the MMC argued about the values of the cost of
capital and the market-to-assets ratio (MAR), the regulator accepted the methodol-
ogy. By doing so, it basically implied that corrections were not to be made on the
existing assets but on the allowed rate of return on those assets, so for these assets
the allowed rate of return should be the cost of capital times the MAR:
z = r x MAR.
AFIR_193-204_annex07.indd 200AFIR_193-204_annex07.indd 200 4/3/08 9:12:48 AM4/3/08 9:12:48 AM

201
Regulatory Asset Base Valuation
A7
Privatization through Capitalization: Bolivia
This example illustrates privatization through capitalization. The best tender in the
bidding process represents the value to be capitalized in the company.
In 1994, Bolivia reformed its electricity sector with a new legal framework that
privatized the sector. Under the new structure, the sector was unbundled into sepa-
rate generation, transmission, and distribution activities to allow establishment of
a competitive market in which supply is represented by generators, and demand by
distribution companies and consumers. Distribution, transmission, and generation
are private, but only distribution and transmission are regulated.
Bolivia is the fi rst emerging market economy to attempt privatization of the
electricity supply industry through the capitalization process. The process is aimed
at transferring half of the ownership of the state-owned companies to individuals
who would in turn develop pension funds and capital markets. The process ensures
capitalization through timely investments of amounts equal to those contributed
by private investors.
Bolivia offered the enterprises for sale by international tender. The successful
bidder paid the agreed price not to the government but to the company, doubling
its net worth. The best tender in the bidding process represented the value to be
capitalized in the company. This value is associated with the following concepts:
• new replacement value,
• asset that best serves demand, and
• adaptation to demand.
The cash was used for investment in the sector, stimulating expansion and effi -
ciency improvements, as well as job creation. Initially, the strategic investor and the
government each held 50 percent stakes in the new company. The government
immediately gave its share in equal parts to all adult Bolivians.2
Asset base accounting based exclusively
on net replacement value: Chile
This case illustrates an asset base accounting based exclusively on net replacement
value—that is, with no relation to the capital invested in the company.
Electricity sector. Chile started its reform process in the late 1980s. The norms
included regulation of production, transportation, distribution, concessions, ease-
ments, prices, facility quality and safety conditions, machinery and instruments,
AFIR_193-204_annex07.indd 201AFIR_193-204_annex07.indd 201 4/3/08 9:12:48 AM4/3/08 9:12:48 AM

202
Accounting for Infrastructure Regulation: An Introduction
A7
and relations of the companies with the state and the private sector. In preparation
for privatization, Chile began separating the different productive stages of the elec-
tricity sector in 1981. Divestiture of Chilectra resulted in creation of one generation
company (Chilgener) and two distribution companies (Chilquinta in Valparaiso
and Chilectra in Santiago). Endesa was broken into fi ve independent distribution
companies, three generating complexes (Endesa, Pullinque, and Pilmaiquén), and
three independent integrated systems (Edelnor in the north, and Edelaysen and
Edelmag in the extreme south).
The state assumed that electricity generation was a potentially competitive mar-
ket but considered distribution and transmission to be local and natural monopo-
lies and, therefore, in need of regulation. It used four privatization mechanisms: (1)
sale of small distribution and generation subsidiaries of Endesa through public
bidding (Saesa and Frontel), (2) privatization of large-scale distribution and gener-
ation companies by auctioning blocks of shares on the stock exchange, (3) sale of
shares to the public in small quantities (“popular capitalism”), and (4) divestiture
of ownership in two distributors (Chilectra and Chilquinta) through repayment in
shares of the reimbursable fi nancial contributions clients make in order to access
the network (start-up investment).
Consumers whose demand for power is less than 2 megawatts face regulated
prices; consumers demanding more than 2 megawatts are free to negotiate prices,
power, and energy directly with generators or distribution companies.
Water and sanitation sector. Until the 1980s, the statutory, regulatory, and opera-
tive responsibilities of the water sector were vested in a public autonomous entity
called Sendos (National Sanitary Services). Sendos directly operated 11 of the 13
regions in the country and was responsible for regulating the two autonomous
state-owned companies (EMOS in Santiago and ESVAL in Region V) as well as
many minor private or municipal companies. The reform in the late 1980s turned
the regional companies into corporations in which public entities own 100 percent
of the shares.
The largest companies in the sector have been privatized in the last few years.
The companies were sold in a variety of ways: a strategic partner bought a block of
shares through a bidding process and subscribed to a certain number of shares
under a capital increase decided before the bidding, 10 percent of shares were sold
in the stock market, and 10 percent of shares were sold to workers. The state retained
ownership of at least 35 percent of the shares.
Regulatory asset base. Tariffs for public services are based on a model effi cient
company (engineering economic model). The assets of the model effi cient company,
AFIR_193-204_annex07.indd 202AFIR_193-204_annex07.indd 202 4/3/08 9:12:48 AM4/3/08 9:12:48 AM

203
Regulatory Asset Base Valuation
A7
not those of the real company, are used. Therefore, the asset base is based exclusively
on the new replacement value and has no relation to the capital invested by the
company.
Accounting of assets: Mali
The way in which private participation is introduced (concession, licence, sale of
assets, management contract) greatly affects representation of assets in the fi rm’s
accounting.
In some forms of private participation—typically concessions—different types
of assets coexist: transferred assets that are owned by the state, assets directly funded
by third parties (users), and assets owned by the company. Regulatory accounting
must deal with these different types of ownership in a way that ensures adequate
transparency as well as proper allocation of funds among the different “owners.”
In this regard, the case of EDM in Mali is typical. In 2000, the state sold a major-
ity stake in the electricity and water operator EDM to a private joint venture (owned
by SAUR, the Bouygues group, and I.P.S.; the latter entity is owned by the Aga Khan
Fund for Economic Development).
Among the assets listed in the balance sheet were assets belonging to the domaine
concédé (conceded domain or state assets) and assets belonging to the domaine
privé (private domain).
Among the liabilities, considered quasi-equity, were subsidies from the state and
from international donors and third-party contributions.
The electricity concession contract defi nes the assets belonging to the con-
ceded domain as “hydroelectric works with land and buildings,” and “works,
lines, production, transport and distribution installations essential to the service.”
So these assets do not belong to the company, and they have to be handed over to
the state at the end of concession, but they are listed in the company’s balance
sheet. The concession fee paid by the company to the state represents a rent for
these assets.
The assets belonging to the private domain are the other assets, and all assets that
will be acquired by the company during the life of the concession.
A further accounting differentiation is introduced between assets that must be
handed over to the state at the end of concession (if belonging to the private sector,
they will be acquired by the state or the next operator) and assets that need to be
renewed (when assets life ends before the end of the concession). All these catego-
ries of assets benefi t from a specifi c accounting treatment.
AFIR_193-204_annex07.indd 203AFIR_193-204_annex07.indd 203 4/3/08 9:12:49 AM4/3/08 9:12:49 AM

204
Accounting for Infrastructure Regulation: An Introduction
A7
Public and private assets essential to regulatory work should be identifi ed as
assets belonging to the state and should not be part of the regulatory asset base.
These assets will not be included in the regulatory asset base when determining
tariffs.
Some “public” assets were and are fi nanced in part by subsidies from the state or
from international agencies. Users fi nance connection equipment, for which they
are charged. Therefore, these assets belong to users and should be clearly identifi ed
as belonging to them. The inclusion or exclusion of these assets in the regulatory
asset base is a regulatory decision.
Regardless of the criteria adopted for valuation of the regulatory asset base and
representation of that base in the fi nancial statements at the time of privatization,
reconciliation of the regulatory asset base and the asset value in the fi nancial state-
ments is a key element of regulatory accounting. This reconciliation calls for explicit
rules for determination and valuation of the regulated asset base and for the way in
which the accounting reconciliation between this valuation and the valuation in the
fi nancial statements should be performed for regulatory purposes.
Notes
1. The valuation approach was different for Edelap but after two years it was changed to the
approach followed for the other two distribution companies.
2. When all six sectors in the plan (telecommunications, electricity, oil and gas, railways, avia-
tion, and parts of mining) were privatized as described, about $2 billion of shares had been dis-
tributed to Bolivian adults, and about $2 billion in new funds were available for investment by the
now privatized companies.
AFIR_193-204_annex07.indd 204AFIR_193-204_annex07.indd 204 4/3/08 9:12:49 AM4/3/08 9:12:49 AM

205
Allen Consulting Group. 2003. “Principles for Determining Regulatory Deprecia-
tion Allowances.” Note to the Independent Pricing and Regulatory Tribunal of
New South Wales, Melbourne, Australia. www.ipart.nsw.gov.au.
Arizu, Beatriz, Luiz Maurer, and Bernard Tenenbaum. 2004. “Pass Through of
Power Purchase Costs: Regulatory Challenges and International Practices.”
Energy and Mining Sector Board Discussion Paper 10, Energy and Mining
Sector Board, World Bank, Washington, DC.
Baron, D.P., and R.B. Myerson. 1982. “Regulating a Monopolist with Unknown
Costs.” Econometrica 50 (4): 911–30.
Barton, A.D. 1977. Anatomy of Accounting. 2nd ed. Brisbane, Australia: University
of Queensland Press.
Beesley, M.E., and S.C. Littlechild. 1989. “The Regulation of Privatized Monopo-
lies in the United Kingdom.” In Regulators and the Market, ed. C. Veljanovski.
London: Institute of Economic Affairs.
Berg, S., and J. Tschirhart. 1988. Natural Monopoly Regulation: Principles and
Practice. Cambridge, UK: Cambridge University Press.
Byatt, I.C.R. 1991. “Offi ce of Water Services: Regulation of Water and Sewerage.”
In Regulators and the Market, ed. C. Veljanovski. London: Institute of Economic
Affairs.
Carey, A., M. Cave, R. Duncan, G. Houston, and K. Langford. 1994. “Accounting
for Regulation in UK Utililties.” University of Bath School of Management,
Centre for the Study of Regulated Industries, Bath, and Institute of Chartered
Accountants in England and Wales, London.
Coelli, T., A. Estache, S. Perelman, and L. Trujillo. 2003. A Primer on Effi ciency
Measurement for Utilities and Transport Regulators. Washington, DC: World
Bank Institute.
Bibliography
AFIR_205-210_biblio.indd 205AFIR_205-210_biblio.indd 205 4/3/08 9:13:37 AM4/3/08 9:13:37 AM

206
Accounting for Infrastructure Regulation: An Introduction
Dufi ls, P., C. Lopater, and E. Guyomard. 2002. Comptable 2003. Mémento Pratique
Francis Lefebvre. Paris: Editions Francis Lefebvre.
ESC (Essential Services Commission [Australia]). 2004a. “Electricity Industry
Guideline No. 3: Regulatory Information Requirements.” Essential Services
Commission, Victoria, Australia. www.esc.vic.gov.au.
———. 2004b. “Electricity Industry Guideline No. 3: Templates for Regulatory
Accounting Statements.” Essential Services Commission, Victoria, Australia.
www.esc.vic.gov.au..
Estache, A., and P. Burns. 1999a. “Information, Accounting, and the Regulation of
Concessioned Infrastructure Monopolies.” Policy Research Working Paper
2034, World Bank, Washington, DC.
———. 1999b. “Infrastructure Concessions, Information Flows, and Regulatory
Risk.” Viewpoint 203, Finance, Private Sector, and Infrastructure Network,
World Bank Group, Washington, DC.
Estache, A., M. Rodriguez Pardina, J. M. Rodríguez, and G. Sember. 2002. “An
Introduction to Financial and Economic Modeling for Utility Regulators.”
Policy Research Working Paper 3001, World Bank, Washington, DC.
Estache, A., Q. Wodon, and V. Foster. 2002. “Accounting for Poverty in Infrastruc-
ture Reform: Learning from Latin America’s Experience.” World Bank, Wash-
ington, DC.
Friedlob, G.T., and F. Plewa, Jr. 2000. Financial and Business Statements. 2nd ed.
Hauppauge, NY: Barron’s Educational Series.
Galetovic, A., and A.E. Bustos. 2004. “Monopoly Regulation, Chilean Style: The
Effi cient-Firm Standard in Theory and Practice.” Working Paper 180, Center
for Applied Economics, University of Chile, Santiago.
Garrison, R.H., and E.W. Noreen. 1994. Managerial Accounting. Burr Ridge, IL:
Irwin/McGraw-Hill.
Goodman, L.S. 1998. The Process of Ratemaking. Vienna, VA: Public Utilities
Reports, Inc.
Green, R.J., and M. Rodriguez Pardina. 1999. Resetting Price Controls for Privatized
Utilities: A Manual for Regulators. Washington, DC: Economic Development
Institute of the World Bank.
Grifell-Tatjé, E., and C.A. Knox Lovell. 2003. “The Managers vs. the Consultants.”
The Scandinavian Journal of Economics 105 (1): 119–38.
AFIR_205-210_biblio.indd 206AFIR_205-210_biblio.indd 206 4/3/08 9:13:37 AM4/3/08 9:13:37 AM

207
Scope of a Regulatory Accounting System
Grout, P.A. 1997. “The Cost of Capital and Asset Valuation.” In Regulatory Review
1997, ed. P. Vass. Bath, UK: Centre for the Study of Regulated Industries,
University of Bath School of Management.
Guasch, J.L. 2004. Granting and Renegotiating Infrastructure Concessions: Doing It
Right. Washington, DC: World Bank.
Horngren, C.T., and G. Foster. 1987. Cost Accounting: A Managerial Emphasis. 6th
ed. Upper Saddle River, NJ: Prentice Hall.
Info-Communications Development Authority of Singapore. 2001. “Accounting
Separation Guidelines.” Annex A, Info-Communications Development
Authority of Singapore.
IPART (Independent Pricing and Regulatory Tribunal of New South Wales). 2001.
“Proposed Accounting Separation Code of Practice for Regulated Electricity
Businesses in New South Wales.” Issue 2, Section 3.4, IPART, Sydney, Australia.
www.ipart.nsw.gov.au.
Kerf, M. 2000. “Do State Holding Companies Facilitate Private Participation in the
Water Sector? Evidence from Côte d’Ivoire, the Gambia, Guinea, and Senegal.”
Policy Research Working Paper 2513, World Bank, Washington, DC.
Kerf, M., and D. Geradin. 2000. “Post-Liberalization Challenges in Telecommuni-
cations: Balancing Antitrust and Sector-Specifi c Regulation—Tentative Lessons
from the Experiences of the United States, New Zealand, Chile and Australia.”
World Competition: Law and Economics Review 23 (1): 27–77.
Laffont, J.J. 1999. “Translating Principles into Practice in Regulation Theory.”
Working Paper, Centro de Estudios Económicos para la Regulación, Buenos
Aires, Argentina.
Laffont, J.J., and J. Tirole. 1994. A Theory of Incentives in Procurement and Regula-
tion. Cambridge, MA: MIT Press.
Laudon, K.C., and J.P. Laudon. 1998. Management Information Systems: New
Approaches to Organization and Technology. 5th ed. Upper Saddle River, NJ:
Prentice Hall.
Loeb, M., and W.A. Magat. 1979. “A Decentralized Method for Utility Regulation.”
Journal of Law and Economics 22 (2): 399–404.
MMC (Monopolies and Mergers Commission). 1993. Gas and British Gas plc:
Reports under the Gas and Fair Trading Acts. London: HMSO.
———. 1997. Northern Ireland Electricity plc. London: HMSO.
AFIR_205-210_biblio.indd 207AFIR_205-210_biblio.indd 207 4/3/08 9:13:37 AM4/3/08 9:13:37 AM

208
Accounting for Infrastructure Regulation: An Introduction
Munasinghe, M. 1990a. Electric Power Economics. London: Butterworth-Heine-
mann Press.
———. 1990b. Energy Analysis and Policy. London: Butterworth-Heinemann
Press.
NER (National Energy Regulator). 2002. “Regulatory Framework for the Eco-
nomic Regulation of the Electricity Supply Industry of South Africa: A Discus-
sion Document.” Pricing and Tariff Department, NER, Pretoria, South Africa.
www.ner.org.za.
OECD (Organisation for Economic Co-operation and Development). 1995.
Transfer Pricing Guidelines for Multinational Enterprises and Tax Administra-
tions. Paris: OECD.
OFFER (UK Offi ce of Electricity Regulation). 1994. Regional Electric Companies
Price Review. Birmingham, UK: OFFER.
Ofgem (Offi ce of Gas and Electricity Markets). 2002. “The National Grid Com-
pany plc Regulatory Accounting Guidelines Working Paper.” Ofgem, London.
Ofgem Chief Executive; Director General of Telecommunications; Director
General of Water Services; Director General of Electricity and Gas Supply,
Northern Ireland; Rail Regulator; Civil Aviation Authority; and Postal Services
Commission. 2001. “The Role of Regulatory Accounts in Regulated Industries.”
Ofgem, London.
Ofwat (Offi ce of Water Services). 1992. “Regulatory Accounting Guideline 1.03.”
Ofwat, London. www.ofwat.gov.uk.
———. 2002a. “Regulatory Accounting Guideline 3.05.” Ofwat, London. www.
ofwat.gov.uk.
———. 2002b. “The Review of Regulatory Accounting Guidelines: A Second
Consultation Paper.” Ofwat, London. www.ofwat.gov.uk.
———. 2003a. “Regulatory Accounting Guideline 1.03, 2.03, 3.05, 4.02 and 5.03.”
Ofwat, London. www.ofwat.gov.uk.
———. 2003b. “Regulatory Accounting Guideline 1.03: Guideline for Accounting
of Current Costs and Regulatory Capital Values.” Ofwat, London. www.ofwat.
gov.uk.
Oxera. 2003. “Assessing Profi tability in Competition Policy Analysis.” Economic
Discussion Paper 6. Prepared for the UK Offi ce of Fair Trading, London.
Pintaux, P. 2002. “Le Système Comptable Ouest Africain (SYSCOA): L’intégration
économique par la comptabilité.” Tertiaire 104. Paris.
QCA (Queensland Competition Authority). 2003. “Electricity Distribution:
Regulatory Accounting and Information Guidelines.” August draft, QCA,
Brisbane, Australia.
AFIR_205-210_biblio.indd 208AFIR_205-210_biblio.indd 208 4/3/08 9:13:38 AM4/3/08 9:13:38 AM

209
Scope of a Regulatory Accounting System
Rossi, M., and C. Ruzzier. 2001. “On the Regulatory Applications of Effi ciency
Measures.” Utilities Policy 9 (2): 81–92.
Rosso, D.J., and C.S. Dorgan. 2002. “Arbitration and Dispute Resolution in the
Electricity Industry.” Power Economics 6 (6): 24–27.
Shim, J.K., and J.G. Siegel. 2000. Modern Cost Management and Analysis. 2nd ed.
New York: Barron’s Business Library.
Smith, W. 1997. “Utility Regulators—Decision-making Structures, Resources, and
Start-up Strategy.” Viewpoint 129, Finance, Private Sector and Infrastructure
Network, World Bank, Washington, DC.
UEMOA (Union Economique et Monétaire Ouest Africaine). 1997. Système
Comptable Ouest Africain: guide d’application. Paris: Foucher.
U.S. Financial Accounting Standards Board. 1978. “Statement of Financial
Accounting Concepts No. 1.” Norwalk, CT.
Utility Regulators Forum. “National Regulatory Reporting for Electricity Distribu-
tion and Retailing Businesses.” Discussion paper. Australian Competition and
Consumer Commission, Melbourne, Australia.
Walton, P. 2001. La comptabilité anglo-saxonne. Paris: La Découverte.
World Bank. 1996. “Water and Wastewater Utilities—Indicators.” 2nd ed. Water
and Sanitation Division, World Bank, Washington, DC.
———. 2002. “Financial Modeling of Regulatory Policy: Introduction to Theory
and Practice.” CD-ROM, World Bank Institute, Washington, DC.
AFIR_205-210_biblio.indd 209AFIR_205-210_biblio.indd 209 4/3/08 9:13:38 AM4/3/08 9:13:38 AM

AFIR_205-210_biblio.indd 210AFIR_205-210_biblio.indd 210 4/3/08 9:13:38 AM4/3/08 9:13:38 AM

211
Index
Boxes, fi gures, notes, and tables are indicated by b, f, n, and t.
A
access subsidies, 8accountability
See also transparencyinformation exchange process,
123f, 123–24regulatory models and, 145
accountingcosts in tariff determination, 71–77defi nition of, 5information, importance of, 1–13
“Accounting Manual for Electricity Public Services, Latin America,” 20, 21t, 22t
accounts payable turnover ratio, 138accounts receivable, 33accounts receivable turnover ratio, 137accrual accounting, 31acid test, 136activity-based costing, 56, 59activity ratios, 137–38actual costs, 60–61, 61nadvertising costs, 74Africa
See also specifi c countriesprivatization and deregulation in,
1, 15–18, 18t, 19t
utility regulator information web sites, 125b
West African Economic and Monetary Union, 37, 39, 40, 40t, 41n
AFUCD (allowance for funds used during construction), 9
Aga Khan Fund for Economic Development, 203
AGL (Australian Gas and Light Company), 52–53b
airport regulation, 86allocation of costs. See cost allocationallocative effi ciency, 3, 7, 146, 150alternative dispute resolution, 124American National Association of
Accountants, 28Anglo-Saxon accounting approach, 30, 30b,
37, 39annual periodicity of fi nancial information,
67annuity depreciation, 101, 178, 179–81f, 180arbitration, 124Argentina
activity-based costing approach in, 90, 92tasset valuation on basis of best bid price
in, 199cost structure of gas companies in, 10breporting requirements in gas sector in,
133utility regulator information web site,
125b
AFIR_211-224_index.indd 211AFIR_211-224_index.indd 211 4/3/08 9:14:51 AM4/3/08 9:14:51 AM

212
Index
Asia, privatization and deregulation in, 1assets, classifi cation of, 17, 18t, 26nauditing of regulated companies, 77–80
audit standard, 78, 79f, 79–80duty of care of auditor, 78–79eligibility to be an auditor, 78process of appointing an auditor, 78pro forma of audit report, 78, 80qualifi ed audit report, consequences of,
78, 80RAGs and, 117–18
AustraliaDORC in, 196electricity industry guideline, 155–56Essential Services Commission (ESC),
112, 113, 114, 121, 155–56exclusion of costs by electricity operator
in, 74IPART in, 4, 52–53b, 88b, 105, 116–17National Electricity Code, 88bRAGs in, 116, 121regulatory accounting statement
template, 156–66related-party transactions in, 105unregulated activities treatment in, 88butility regulator information web sites,
125bAustralian Competition and Consumer
Commission, 88bAustralian Gas and Light Company (AGL),
52–53bAustralian Index to Regulatory Accounting
Statements, 156average cost, 45, 46–47
B
balance sheets, 32Bande (Banco Nacional de Desarrollo,
Argentina), 199Baron, D.P., 2benchmarking, 13n, 21, 23–25, 64, 77, 107–8benefi ts received and cost allocation, 64BG. See British Gasbiannual periodicity of fi nancial
information, 67
Boliviaeffi cient-fi rm regulation in, 5privatization through capitalization in,
201, 204nBrazil, utility regulator information web
site, 125bBritish Gas (BG), 194, 200budgeted costs, 60–61, 61nBurns, P., 2Byatt, I.C.R., 3
C
capacity studies, 8capacity to bear model of cost allocation, 54capital expenditures and asset base
determination, 97–98capital structure, 138–39case studies, 3, 15–26
effi cient model company regulation in Latin America, 21, 23–25, 25t
privatization of electricity and water operator in Africa, 15–18, 18t, 19t
regulating operators in Latin America, 18, 20–21, 21–23t
cash, 32cash equivalents, 32–33cash fl ow
factors driving, 150–51, 151fstatement, 36–37, 38t
causality principle, 14, 53, 64, 68, 114certainty and consistency as elements of
regulatory regimes, 4chart of accounts, 20, 37, 38b, 39, 39t, 40tChile
asset base accounting based on net replacement value in, 201–3
effi cient-fi rm regulation in, 5, 13nmodel effi cient company method,
195, 202–3utility regulator information web site,
125bChilectra, 202Chilgener, 202Chilquinta, 202classifi cation of assets, 17, 18t, 26n
AFIR_211-224_index.indd 212AFIR_211-224_index.indd 212 4/3/08 9:14:51 AM4/3/08 9:14:51 AM

213
Index
classifi cation of costs for electricity operators, 89t, 89–90
common costs, 9, 13n, 49, 61ncomparative competition, 64comparison of operators, 68, 77competencies for data analysis, need for, 128competition, 1, 9, 64, 108nconceptual framework of regulation, 1–13
external and internal regulatory information, 5–8, 6b
limitations of traditional accounting information for regulatory purposes, 8–11, 10b
objectives of public service regulation, 3–4
concession contracts, 17, 18t, 203confi dentiality, 69, 113, 124, 133nconservatism and recording information, 31consistency in allocation and valuation
principles, 68, 115, 144–55consolidated fi nancial statements, 29consultation process, 124, 125–27,
126f, 127bconsumption, 187content of information, 65, 66contract obligations, 16, 129controllable costs, 49–50core issues in regulatory accounting, 3, 83–109
depreciation policies of regulatory base asset, 98, 101–2, 175–85
regulatory asset base determination, 92–98, 99–100b
related-party transactions and transfer pricing, 102–8, 104f, 106t
See also related-party transactionsseparation of activities, 9, 84–92, 88b,
89t, 91t, 92corporate information and fi nancial
accounting, 3, 27–41corporate information systems, 27–29, 29f
external reporting, 29internal reporting, 28–29
statutory fi nancial statements, 29–40cost accounting. See management and
cost accounting
cost allocation, 53–61allocated budget costs or actual costs,
60–61approaches and methods, 57–60
accounting approaches, 57–59activity-based costing, 59economic approach to allocation,
59–60fully distributed costs, 57–59Ramsey pricing, 59–60, 61n
cost distortion or cross-subsidization, 60criteria for, 54goals of, 54in regulatory accounting, 65, 118–19related-party transactions and basis of,
107–8step-by-step process for, 55–57
cost allocation base, choosing, 56–57
cost objective, choosing, 55–56, 189cost objects, assigning direct and
indirect costs to, 57, 189–90, 190fdirect costs, identifying and tracing
to cost objectives, 53, 56, 189, 190fillustration of, 189–91, 190f, 191bpooling indirect costs related to cost
objectives, 56cost analysis and fi nancial accounting
compared, 44tcost classifi cations, 45–52
averaging, degree of, 45, 46–47by behavior, 47comparison of, 51t, 51–52, 52–53bmanagement function and, 45, 46manufacturing costs, 46, 51nonmanufacturing costs, 46, 51relevance to planning, control, and
decision making, 45, 47–50controllable and uncontrollable
costs, 49–50cost classifi cation by behavior, 47cost typologies unrelated to behavior,
49direct and indirect costs, 48–49,
51f, 56
AFIR_211-224_index.indd 213AFIR_211-224_index.indd 213 4/3/08 9:14:52 AM4/3/08 9:14:52 AM

214
Index
cost classifi cations (continued)relevance to planning, control, and
decision making (continued)incremental or differential costs
and marginal costs, 50, 51f, 52–53b, 74–75
opportunity costs, 50stand-alone costs, 50–51, 52–53bsunk costs, 50variable and fi xed costs, 47–48, 48t,
51, 51f, 56timing of charges against revenue and,
45, 47cost distortions, 60, 81ncost drivers, 56–57cost effi ciency, 13ncost of goods sold in income statements, 34cost of measurement and cost drivers, 57cost pools, 56cost typologies unrelated to behavior, 49cross-subsidies
cost allocation and, 60information and, 8, 66Ofwat and, 109nRAGs and, 112regulator’s allowance of, 81nregulatory objectives and, 64, 147separation of activities and, 90
current assets, 32–33current cost accounting, 41ncurrent ratio, 136
D
data development analysis, 77deadlines for information exchange
process, 123declining balance depreciation, 101, 177,
179, 179f, 180, 180fdeferred operating costs and regulatory
assets, 96deferred taxes, 97degree of correlation and cost drivers, 57demand for goods and services,
information on, 7, 8depreciated optimized replacement cost
(DORC), 195–96
depreciation, 175–85alternative approaches to, 101, 177–78asset base determination and, 97data regulatory requirements, 184estimation of asset lives, 101, 178–79impact of different approaches to
calculation of, 179f, 179–83, 180fchanging assumed asset life, 182, 183fchanging depreciation profi les,
180–82, 181fvariations from forecast capital
expenditure, 182–83in income statements, 34–35perspectives on, 175–76principles for, 102, 184–85regulatory approaches to, 98, 176–77regulatory capital values, 99–100btreatment on variations from forecast
expenditures, 101–2deprival rule, 94differential costs, 50direct costs, 48–49, 51f, 53, 56, 57direct labor, 46, 51, 51fdirect materials, 46, 51, 51fdirect or directly attributable revenues or
costs, 118directors’ responsibility and RAGs, 117disaggregation of costs, 90disclosure and confi dentiality rules, 113dispute resolution, 124distributional fairness, 147distribution losses, 187distributive effi ciency, 4donations, 74DORC (depreciated optimized replacement
cost), 195–96dynamic effi ciency, 146
E
economic and fi nancial sustainability, 3, 6Edelap (Argentina), 199, 204nEdenor (Argentina), 199Edesur (Argentina), 199EDM (Mali), 203effi ciency, 2, 3–4, 7, 67, 147–48effi cient-fi rm regulation, 5, 13n
AFIR_211-224_index.indd 214AFIR_211-224_index.indd 214 4/3/08 9:14:52 AM4/3/08 9:14:52 AM

215
Index
effi cient model company regulation in Latin America, 21, 23–25, 25t, 26t
Electricity Industry Guidelines (Australia), 113, 114
electricity sector, 80See also case studiesin Chile, 5, 13n, 201–2classifi cation of costs for, 89t, 89–90, 92texclusion of costs and, 74in Mali, 203objectives of regulatory accounting
and, 64regulating operators in Latin America,
18, 19t, 20–21subactivities in regulated and
unregulated activities for, 90, 91tunregulated activities in, 85–86
electronic spreadsheets, 81nelements of regulatory accounting, 3, 63–81
accounting costs in tariff determination, 71–77, 79f
auditing of regulated companies, 77–80, 79f
information needs, 65–68rationale for regulatory accounting, 64–65regulator’s behavior and principles to
follow, 70–71statutory accounts and regulatory
accounts, consistency between, 69–70
traditional and management accounting of regulated company, limitations of, 68–69
Emergency Railroad Transportation Act (U.S., 1933), 81n
Endsea (Chile), 202energy purchases, 81n, 89equilibrium tariff, 143equity effi ciency, 4equity objectives, 8Eskom (South Africa), 127bEssential Services Commission (ESC,
Australia), 112, 113, 114, 121, 155–56
Estache, A., 2excess capacity, 108n
excessive expenses, 75external reporting, 29
F
fairness, 147–48, 150FDC (fully distributed costs) accounting
approach, 57–59Federal Communication Commissions
(FCC, U.S.), 5, 95fi nal average tariff, 143fi nancial accounting, 29, 44t
See also corporate information and fi nancial accounting
Financial Accounting Board Standard 8 (FRS 8, U.K.), 104, 105
Financial Accounting Board Standard 57 (U.S.), 104
fi nancial capital maintenance, 197bfi nancial statements. See ratio analysis;
statutory fi nancial statementsfi nancial sustainability, 13nfi nancial viability of operator, 146fi nancing activities in cash fl ow
statements, 37fi rm, role of, 2fi xed costs, 47–48, 48t, 51, 51fforecast and actual capital expenditures,
97–98, 101–2format of information, 65, 66–67France
accounting approach in, 30, 30bPlan Comptable Général (PCG) in, 37,
39, 40franchises, 95Frontel (Chile), 202FRS 8 (Financial Accounting Board
Standard 8, U.K.), 104, 105fully distributed costs (FDC) accounting
approach, 57–59
G
GAAP. See generally accepted accounting principles
game, regulation as, 2Garrison, R.H., 59Gas Natural Ban (Gasban, Argentina), 10b
AFIR_211-224_index.indd 215AFIR_211-224_index.indd 215 4/3/08 9:14:52 AM4/3/08 9:14:52 AM

216
Index
generally accepted accounting principles (GAAP), 29–31, 30b, 41n, 68
“gold-plating” behavior, 75Goodman, L.S., 193–94goodwill, 95gross margin ratio, 139guidelines and templates, 155–74
audit reports, 80Australia
electricity industry guideline, 155–56regulatory accounting statement
template, 156–66United Kingdom, Ofwat regulatory
accounting, 167–74
H
historical costs, 31, 93historical data, 126homogeneity in identifi cation of accounts,
9, 10b
I
IASB (International Accounting Standards Board), 39
ICC (International Chamber of Commerce), 133n
ICC (Interstate Commerce Commission, U.S.), 193
IFRS (International Financial Reporting Standards) norms, 39–40
importance of accounting information, 1–13incentives, 5, 67income statement, 34–36, 36tincome tax in income statements, 36incremental costs, 50, 51f, 52–53b, 74–75Independent Pricing and Regulatory
Tribunal (IPART, New South Wales, Australia), 4, 52–53b, 88b, 105, 116–17
indirect costs, 49, 51f, 56, 57, 60indirectly attributable revenues or costs,
118–19ineffi cient costs, 72, 75information
corporate information systems, 27–29, 29fcost of, 11
exchange process, 121–28, 122faccountability, 123f, 123–24best practices for, 122competencies, tools, and time and
methodology, 128–31consultation process, 124, 125–27,
126f, 127bdeadlines, 123dispute resolution, 124processes and mechanisms for, 12transparency, 128utility regulator web sites, 125b
external and internal regulatory information, 5–8, 6b
as key element in regulation, 1–3, 4, 12nlimitations of traditional accounting
information for regulatory purposes, 8–11, 10b, 68–69
needs, 65–68allocation and valuation needs, 68content of information, 65, 66format of information, 65perimeter of information, 65–66, 72periodicity of reporting, 65, 67–68regulators’ behavior and, 70–71related-party transactions and
transfer pricing, 105, 107statutory accounts and regulatory
accounts, consistency between, 69–70
traditional and management accounting of regulated company, limitations of, 68–69
originating in the fi rm, 5–7, 6boriginating outside the fi rm, 7–8physical aspect of services and, 11privatization of electricity and water
operator in Africa case study and, 16–17
quality of services and, 11recording information, principles
related to, 31regulatory models and, 145–46statutory fi nancial statements, 29–40validation of, 11
infrastructure, 7, 8, 126input based cost driver, 57
AFIR_211-224_index.indd 216AFIR_211-224_index.indd 216 4/3/08 9:14:52 AM4/3/08 9:14:52 AM

217
Index
intangible property and asset base determination, 95, 108n
interest expense in income statements, 36interference by regulators, 71internal and external regulatory
information, 5–8, 6binformation originating in the fi rm,
5–7, 6binformation originating outside the
fi rm, 7–8internal reporting, 28–29International Accounting Standards Board
(IASB), 39International Chamber of commerce
(ICC), 133nInternational Financial Reporting
Standards (IFRS) norms, 39–40Internet, communication and
dissemination via, 124, 125bInterstate Commerce Commission (ICC,
U.S.), 193inventoriable costs, 47inventory, 33inventory turnover ratio, 137–38investing activities in cash fl ow
statements, 37investment obligations, failure to meet, 67IPART (Independent Pricing and
Regulatory Tribunal, New South Wales, Australia), 4, 52–53b, 88b, 105, 116–17
J
joint accountability for audit process, 78–79joint costs, 49, 52just and reasonable cost standard, 72
K
Kenya, utility regulator information web site, 125b
L
Laffont, J.J., 1–2Latin America
See also specifi c countrieseffi cient model company regulation in,
5, 21, 23–25, 25t, 26t
privatization and deregulation in, 1regulating operators in, 18, 20–21, 21–23tutility regulator information
web sites, 125bleased property, 96legal basis and authorities, 72, 112–14, 131–32liabilities in statutory fi nancial statements,
33, 34limitations of accounting, 8–11, 10b, 68–69liquidity of assets, 32liquidity ratio analysis, 136lobbying expenses, 74Loeb, M., 2long-term assets, 32, 33losses on sale of property, 97
M
Magat, W.A., 2Mali, accounting of assets in, 203–4management and cost accounting, 3, 43–61
benchmarking managerial performance, 13n
cost accounting and cost allocation systems for motivation, 17–18, 44, 45b
cost allocation, 53–61cost classifi cations, 45–52limitations of, 8–11, 10b, 68–69objectives of, 43–61, 44t
management fees, 74manufacturing costs, 46, 51, 51fmarginal costs, 50, 74–75market value, 93–94Massachusetts Regulatory Commission, 95matching principle, 31, 185nmateriality, 31, 79–80, 115Mauritania, utility regulator information
web site, 125bMetrogas (Argentina), 10bmicromanagement, 71mismanagement, 77model effi cient company method,
195, 202–3modifi ed historical cost, 41nmonopolies, 1, 63Monopolies and Mergers Commission
(MMC, U.K.), 194, 200
AFIR_211-224_index.indd 217AFIR_211-224_index.indd 217 4/3/08 9:14:52 AM4/3/08 9:14:52 AM

218
Index
motivation and cost accounting and cost allocation systems, 44, 45b
Myerson, R.B., 2
N
National Electricity Regulator (NER, South Africa), 119–20, 127b
net margin, 139net replacement value, 201–3network industries, 64network length, 187New South Wales, Australia
IPART in, 4, 52–53b, 88b, 105, 116–17unregulated activities treatment in, 88b
noncompliance, 67nonfi nancial data, 66nonfi nancial indicators, list of sample,
187–88nonmanufacturing costs, 46, 51, 51fNoreen, E.W., 59
O
objectives of public service regulation, 3–4objectivity in allocation and valuation
principles, 68, 114–15Oceania, utility regulator information web
sites, 125bOECD (Organisation for Economic
Co-operation and Development) related-party transaction guidelines, 117
Offi ce of Electricity Regulation (OFFER, U.K.), 194–95
Offi ce of Gas and Electricity Markets (Ofgem, U.K.), 105, 107–8, 112
Offi ce of Water Services (Ofwat, United Kingdom)
cross-subsidies and, 109nIndex to Regulatory Accounting
Statements, 167–74information web site, 125bperiodic tariff review, 129, 129f, 130–31bRAGs and, 116, 121bregulatory accounting guidelines, 167regulatory accounting statements, 167–74
regulatory capital values, 98, 99–100brelated-party transactions and, 107–8third-party contracted services and, 90
operating activities in cash fl ow statements, 37
operating and fi nancial reports, 17operating capital maintenance, 197boperating costs, 188operating expenses in income statements, 34operating losses, 97operating ratio, 187operator’s fi nances, required information
on, 150–51, 151fopportunity costs, 50Organisation for Economic Co-operation
and Development (OECD) related-party transaction guidelines, 117
output based cost driver, 57
P
PCG (Plan Comptable Général (PCG)), 37, 39, 40
peak-load pricing, 67perimeter of information, 65–66, 72period costs, 47periodicity of reporting, 31, 65, 67–68personnel costs, 188Peru
effi cient-fi rm regulation in, 5utility regulator information
web sites, 125bPhilippines, utility regulator information
web site, 125bPilmaiquén (Chile), 202Plan Comptable Général (PCG, France),
37, 39, 40popular capitalism, 202power and maintenance costs, 191bpredatory pricing, 108nprice-based index numbers, 77price-cap regulation, 2price determination, 44price elasticity, 8, 13nprice stability, 4
AFIR_211-224_index.indd 218AFIR_211-224_index.indd 218 4/3/08 9:14:52 AM4/3/08 9:14:52 AM

219
Index
private participation, introduction of, 203–4privatization
Argentina, utilities in, 199deregulation and, 1effect of, 198electricity and water operator in Africa
case study, 15–28confl icts and solutions, 17–18, 18t, 19tinformation requirements, 16–17obligations in contract and law, 16operating and fi nancial reports, 17powers of regulatory authority, 16standard accounting and cost
accounting, 16–17of public utilities, 194–95through capitalization in Bolivia,
201, 204nproduct costs, 47production unit depreciation, 177–78productive effi ciency, 4, 146profi ts and profi tability, 44, 139–40promotion funds, 8prudent management, presumption of, 76public service regulation, objectives of, 3–4public service tariffs, 8Pullinquel (Chile), 202
Q
qualifi cation of costs, 119–20quantitative rigor in regulatory
assessments, 143–44quarterly reporting, 67quasi-economic models, 144Queensland Competition Authority
(Australia), 79–80
R
RAGs. See regulatory accounting guidelinesRamsey pricing, 59–60, 61nratio analysis, 135–40
accounts payable turnover ratio, 138accounts receivable turnover ratio, 137acid test, 136activity ratios, 137–38capital structure, 138–39
current ratio, 136gross margin ratio, 139inventory turnover ratio, 137–38leverage ratios, 138–39liquidity ratio analysis, 136net margin, 139profi ts and profi tability, 139–40return-on-assets ratio, 140return-on-equity ratio, 140use of, 187
reference numbers in charts of accounts, 39, 39t
regulation, theoretical analysis of, 1–2Regulator General, Offi ce of (Australia), 74regulators
behavior of, 70–71role of, 2
regulatory accounting guidelines (RAGs), 3, 111–21
accounting and allocation principles, 114–15
audit, 117–18communication and dissemination
issues and, 124contents of, 111–21defi nitions of terms, 114directors’ responsibility, 117general principles in preparation of,
114–18information (reporting) requirements,
120–21, 121blegal basis and authorities, 112–14
disclosure and confi dentiality rules, 113
revision, dates, and periods, 113–14legitimizing regulatory methodology
and, 117national accounting standards,
conformity with, 115–16Ofwat regulatory accounting
guidelines, 167purpose of, 112regulatory accounting statements, 69,
118–20, 156–74related-party transactions and, 116–17
AFIR_211-224_index.indd 219AFIR_211-224_index.indd 219 4/3/08 9:14:52 AM4/3/08 9:14:52 AM

220
Index
regulatory accounting guidelines (RAGs) (continued)
substance over legal form in, 116third-party benefi ts, 117
regulatory accounting statements, 118–20Australia, template from, 156–66cost and revenue allocation in, 118–19Offi ce of Water Services (Ofwat), 167–74qualifi cation of costs, 119–20regulatory asset base, 120revision of methodologies, 119statutory accounts and, 69
regulatory asset base determination, 92–98accounting and, 198–209composition, 95–98
assets, 95deferred operating costs and
regulatory assets, 96goodwill, 95leased property, 96other principles, 97–98, 99–100bthird-party contributions, 96working capital, 96–97
in regulatory accounting statements, 120valuation, 92–94, 183–204
accounting and, 198–209approach to, 196–98, 197b, 198tArgentina, 199Bolivia, 201Chile, 201–3historical cost, 93Mali, 203–4market value, 93–94replacement cost, 94United Kingdom, 199–200
regulatory authority, 16, 65regulatory models, 141–53
confl icts and solutions and, 18elements of, 142–46, 143fobjectives and instruments, matching,
146–50, 149f, 149toperator’s fi nances, required
information on, 150–51, 151fsuggestions for, 151–53use of, 128
related-party transactions, 102–8basis of cost allocation, 107–8defi nition of related parties, 104f, 104–5
exclusion of costs and, 74information disclosure, 105, 107RAGs and, 116–17specifi ed transactions, 105, 106t
replacement cost, 94, 193replacement value, 195, 201–3reporting requirements
See also informationaudit reports, 80external reporting, 29general objectives of external fi nancial
reporting by companies, 6binternal reporting, 28–29operating and fi nancial reports, 17periodicity of reporting, 67–68RAGs and, 120–21, 121bregulatory accounting and, 3to regulatory authority, 65statutory fi nancial statements, 29–40
return-on-assets ratio, 140return-on-equity ratio, 140revenue based cost driver, 57revenue recognition, 31revenues, 31, 61nring-fencing requirements, 87, 88brisks and regulators’ behavior, 71roll forward, 108nRPI-X (retail price index minus expected
future productivity gains), 2
S
Saesa (Chile), 202sales in income statements, 34sanitation. See water and sanitation sectorscope of regulatory accounting system,
3, 111–33competencies, tools, and time and
methodology, 128–31, 129t, 130–31b
information exchange process, 121–28, 122f
legitimizing regulatory methodology, 131–32
regulatory accounting guidelines (RAGs), 3, 111–21, 167
seasonal pattern for services, 67Segba (Argentina), 199Sendos (Chile), 202
AFIR_211-224_index.indd 220AFIR_211-224_index.indd 220 4/3/08 9:14:53 AM4/3/08 9:14:53 AM

221
Index
separation of activities, 84–92in accounting, 9, 87, 88b, 89t, 89–92,
91t, 92tregulatory alternatives, 86–87
separation of companies, 86–87single till regulation, 86
service interruptions, 67shareholders’ equity, 32, 33–34, 35tsimplicity as element of regulatory regimes, 4single till regulation, 54, 86Smyth v. Ames (1898), 93social concerns, effect of, 144–45, 150South Africa
consultation process in electrical supply industry in, 127b
qualifi cation of costs, 119–20utility regulator information
web site, 125bspreadsheets, 143staff productivity index, 187stand-alone costs, 50–51, 52–53bstandard accounting and cost accounting
requirements, 16–17state-owned enterprises, 1statutory accounts, 81n
regulatory accounts and, 69–70statutory fi nancial statements, 29–40
balance sheet, 32cash fl ow statement, 36–37, 38tchart of accounts, 20, 37, 38b, 39, 39t, 40tcurrent assets, 32–33generally accepted accounting principles
(GAAP), 29–31, 30b, 41n, 68basic postulates of fairness, 30–31recording information, principles
related to, 31socioeconomic environment and, 31valuation, principles related to, 31
income statement, 34–36, 36tInternational Financial Reporting
Standards (IFRS) norms, 39–40key elements of, 32, 35tliabilities, 33, 34long-term assets, 32, 33problems with relying in, 68sample, 34, 35tshareholders’ equity, 33–34, 35t
stochastic frontier analysis, 77
straight-line depreciation, 101, 176, 177, 179–81f
subactivities, separation of, 90subsidiaries, 29, 86subsidies, 8, 60, 149substance over form in recording
information, 31, 41nsunk costs, 50sustainability, 147–48, 149–50Système Comptable Ouest-Africain
(Syscoa), 37, 39, 40, 40t, 41n
T
tariff determination, 71–77, 73bSee also case studiesaccounting costs in, 71–77, 73fconfl icts and solutions and, 18consistency in tariff adjustment, 145criteria and guidelines, 76–77
materiality, 76mismanagement, fi nding of, 77objective assessment and, 77prudent management, presumption
of, 76realism, 76
effi cient costs and, 66excluding costs and, 72, 74–76
full exclusion of cost items, 74–75partial exclusion of incurred
expenses, 75–76fairness and, 150fi nal average tariff, 143full exclusion of cost items, 74–75partial exclusion of incurred expenses,
75–76social concerns and, 150sustainability and, 149–50
taxationdeferred taxes and asset base
determination, 97income tax in income statements, 36
telecommunications, 64, 85templates. See guidelines and templatestheoretical analysis of regulation, 1–2third-party benefi ts and RAGs, 117third-party contracted services, 90third-party contributions and asset base
determination, 96
AFIR_211-224_index.indd 221AFIR_211-224_index.indd 221 4/3/08 9:14:53 AM4/3/08 9:14:53 AM

222
Index
time and methodology for data analysis, need for, 120–31b, 129f, 129–31
tools for data and information processing, need for, 128–29
traditional and management accounting of regulated company, limitations of, 8–11, 10b, 68–69
transaction costing, 59transfer prices, 107–8transparency
in allocation and valuation principles, 68information exchange process, 128as objective of regulatory accounting, 65RAGs and, 113–14, 115regulatory models and, 145, 152
Triole, J., 2
U
U.K. Accounting Standards Committee, 196, 197b
unattributable revenues or costs, 119uncontrollable costs, 49–50undue discrimination, 64unfair competition, 108nUnited Kingdom
airport regulation in, 86Financial Accounting Board Standard 8,
104, 105Financial Reporting Standards in, 30fl oatation of shares on stock market in,
199–200modifi ed historical cost in, 41nOffi ce of Water Services. See Offi ce of
Water Services (Ofwat)price-cap regulation with RPI-X in, 2privatization of public utilities in, 1, 194–95RAGs in, 112, 116valuation approach in, 196, 197b
United Statesasset base determination in, 93deregulation in, 1FCC in, 5, 95Financial Accounting Board Standard
57, 104
honest, economic, and effi cient management standard in regulatory decisions in, 81n
ICC in, 193just and reasonable cost standard in, 72regulatory asset base valuation in, 193Statement of Financial Accounting
Standards in, 30telecommunications sector in, 5utility management, presumption in
favor of, 76unit operational cost, 187units of measure, 31utility management, presumption in favor
of, 76Utility Regulators Forum of Australia, 122utility regulator web sites, 125b
V
validation of information, 11valuation, 31, 68
See also regulatory asset base determination
variable costs, 47–48, 48t, 51, 51f, 56
W
water and sanitation sectorin Chile, 202effi cient model company regulation in
Latin America, 21, 23–25, 25t, 26tobjectives of regulatory accounting
and, 64privatization of electricity and water
operator in Africa, 15–18, 18t, 19tWeb sites of utility regulators, 124, 125bWest African Economic and Monetary
Union, 37, 39, 40, 40t, 41nwillingness-to-pay studies, 8working capital, 96–97working ratio, 187
Y
yardstick competition, 9
AFIR_211-224_index.indd 222AFIR_211-224_index.indd 222 4/3/08 9:14:53 AM4/3/08 9:14:53 AM

AFIR_211-224_index.indd 223AFIR_211-224_index.indd 223 4/3/08 9:14:53 AM4/3/08 9:14:53 AM

ECO-AUDIT
Environmental Benefi ts Statement
The World Bank is committed to preserv-
ing endangered forests and natural resources.
The Offi ce of the Publisher has chosen to print
Accounting for Infrastructure Regulation: An
Introduction on recycled paper with 30 percent
post-consumer waste, in accordance with the
recommended standards for paper usage set by
the Green Press Initiative, a nonprofi t program
supporting publishers in using fi ber that is not
sourced from endangered forests. For more
information, visit www.greenpressinitiative.org.
Saved:
• 7 trees
• 318 lbs. of solid waste
• 2,478 gallons of waste water
• 597 lbs. of net greenhouse gases
• 5 million BTUs of total energy
AFIR_211-224_index.indd 224AFIR_211-224_index.indd 224 4/3/08 9:14:53 AM4/3/08 9:14:53 AM

Developing effective regulation for utilities has always depended on getting
good accounting information on fi nances and operations. But reforms
within the utility sector—such as promoting competition and encouraging
private participation—make accurate regulatory accounting even more
important. As sector and corporate structures become more complex, with
utilities operating in both competitive and regulated markets or across several
jurisdictions, cost allocations have become both more critical and complex.
Clear requirements for regulatory accounts are an essential element in the
transparent, consistent, and credible regulation of utilities and reporting
of their performance.
Accounting for Infrastructure Regulation: An Introduction provides a practical
guide for regulators, policy makers and utility managers to establishing
regulatory accounts that can be the cornerstone for better, more complete,
and more reliable accounting information. Drawing upon a number of case
studies to illustrate key issues and choices, the book sets out the essential
accounting features of regulatory accounts and provides practical guidance
on controversial areas such as the allocation of costs, the valuation of assets,
and depreciation. The book emphasizes the need for consistency with Generally
Accepted Accounting Principles (GAAP), but highlights the specifi c role and
requirements of regulatory accounts from the perspective of sector reform
and best-practice regulation.
ISBN 978-0-8213-7179-4
SKU 17179