accuracy and limitations of full-scale dynamic shaft...
TRANSCRIPT

so TRANSPORTATION RESEARCH RECORD 1331
Accuracy and Limitations of Full-Scale Dynamic Shaft Testing
B. HERITIER, J. PAQUET, AND R. T. STAIN
Dynamic methods of load testing driven piles and bored shafts are in common use throughout the United States and Europe. The complex equations and computer programs used to analyze the data from such tests might lead to the assumption that the results are equally precise. In fact, little is known or has been pub!ished about the absolute accuracy of such methods . The potential ources of error that may exist in all phases of the operation , from data collection to correlation with static load tests are described. The differences between the classical CASE method and the SIMBAT technique are discussed .
Method of predicting the capacity of driven piles using dynamic loading have been available for many years and are well documented and extensively used . When these techniques are used on bored cast-in-place shafts, new problems arise, not the least being that of increased scale. More important, the shaft dimensions and properties are more difficult to quantify than those of precast piles, and these factors influence the accuracy of the predictions.
The Centre Experimental de Recherches et d'Etudes du Batiment et des Travaux Publics (CEBTP) has carried out research in dynamic test methods since 1980 and has participated in Class A prediction trials in the United States and Europe. Working tests have been carried out on shafts ranging in diameter from 8 to 48 in . in a wide range of soil conditions . This research led to the development of a methodology specifically adapted to bored shafts known as SIMBAT (Simulation de Battage). It also made the authors aware of the potential errors inherent in all types of dynamic pile test and the difficulty of obtaining genuine static/dynamic correlations.
This paper has the following aims: to create an awareness of the potential cumulative errors that are inherent in dynamic load testing, to highlight the difficulty of obtaining genuine statiddynamic correlations, and to compare the CASE method of predicting static load test results with the SIMBA T technique.
TEST ACCURACY
The result of a dynamic load test is either a single value quoted as being the shaft capacity or a load settlement plot . How accurate are these results? Plus or minus 5 percent? Plus or minus 50 percent? Most engineers would find the former to be an acceptable possible error but the latter unacceptable. A shaft capacity reported as being 100 tons but that could be
B. Heritier and J. Paquet, CEBTP, Domaine de St. Paul , B.P. No. 37, 78470 Saint-Remy-les-Chevreuse, Paris , France. R. T. Stain, Testconsult CEBTP Limited, 11 Trinity Court , Risley, Warrington, Cheshire WA3 6QT, United Kingdom .
anything between 50 and 150 tons is of little or no practical use.
The problem is that the real accuracy of dynamic testing is not known . It is all too easy to develop complicated formulas and compute results to the nth decimal place, and when the job is done it looks very accurate . It is an easy and fatal step to think that the accuracy of our arithmetic is equivalent to the accuracy of our knowledge about the problem in hand.
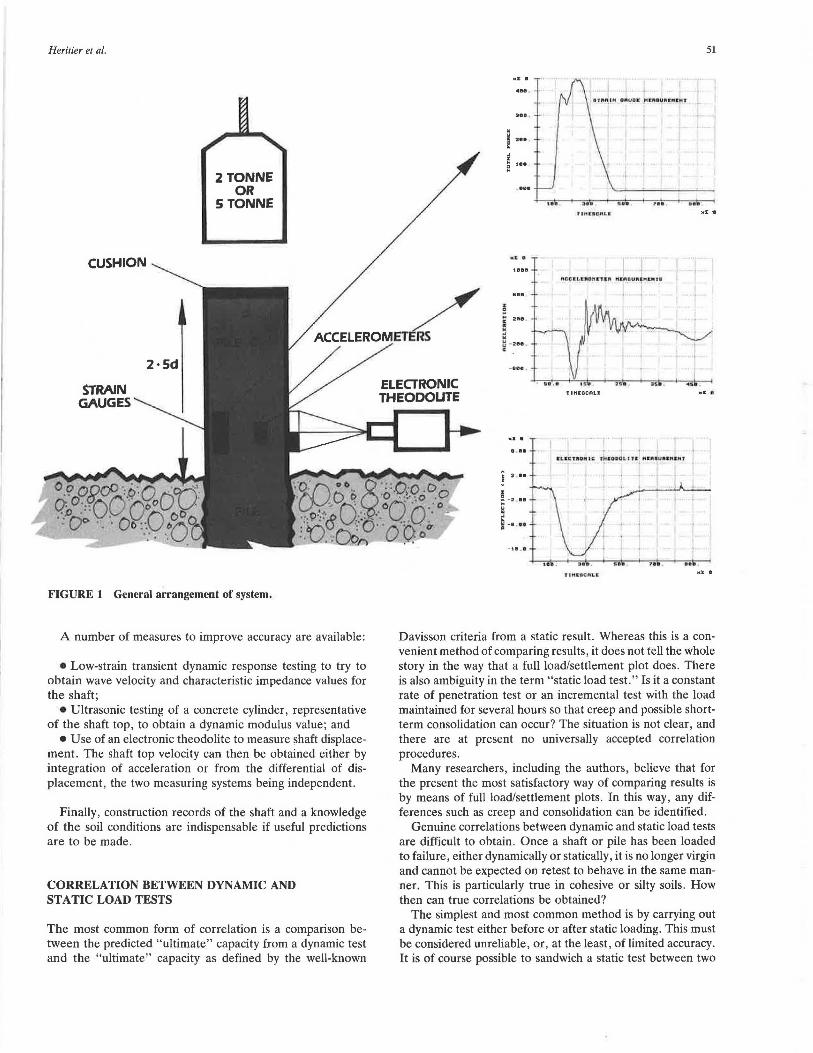
This paper does not attempt to answer these problems but instead considers the various sources of error that can arise . The general arrangement of a dynamic test system is shown in Figure 1, and the separate stages of a test are shown in Figure 2.
The potential sources of error in the various phases of the test are given in Tables 1 through 3. Readers might like to insert their own estimates in the right-hand column. Often, some of these errors will be positive and some negative, and they will partially cancel each other out. They may , however, conspire together and produce a cumulative effect.
In a driven precast pile many of the assumed values are interlocking, and there is less room for global error. For example, the pile impedance is calculated from the same terms as is the conversion of strain to force.
Z = pCA
where
p = concrete density, C = bar wave velocity in pile , and A = pile cross-section
Force = Strain x EA
where
E = dynamic modulus of concrete = pC '
(1)
(2)
(3)
For a bored shaft, however, it must be remembered that the strain to force calculation is based on the properties of the instrumented section of shaft , whereas the impedance calculation requires a knowledge of these parameters for the shaft as a whole . It is unlikely, for example, that the shaft cross-sectional area will be uniform over the full length or that the concrete modulus of the shaft will be identical to that of the instrumented section. It is apparent that even if modest values are inserted in the "estimated accuracy" column of Tables 1 through 3, the net effect on global accuracy will be significant.
Heritier et al.
2 TONNE OR
5 TONNE
/
51
411119 .
»•• .
2•• .
fltl UC ,.1. r
... \9911
81119 .
2•• .
ACCELEROMETERS -2••
2·5d -aee ,
... 1:.1. l CfPIO"T C r \.. cooOLlt& ft .l~l.uRl,.bT
• I ...
2 ..
' C> .... '. 0 . ;·cµ: bo~ .. g :o::.O;o .oo·
" ~ 0 • • ." 0
·:: 9~r-..c0::: _ ... Q.o.: oU :O··o· ' "
. = -2 ••
~ ~
. • .. !?:'"\.: • 0 · ·~f"I . .
= -· .••
FIGURE 1 General arrangement of system.
A number of measures to improve accuracy are available:
• Low-strain transient dynamic response testing to try to obtain wave velocity and characteristic impedance values for the shaft;
• Ultrasonic testing of a concrete cylinder, representative of the shaft top, to obtain a dynamic modulus value; and
• Use of an electronic theodolite to measure shaft displacement. The shaft top velocity can then be obtained either by integration of acceleration or from the differential of displacement, the two measuring systems being independent.
Finally, construction records of the shaft and a knowledge of the soil conditions are indispensable if useful predictions are to be made.
CORRELATION BETWEEN DYNAMIC AND STATIC LOAD TESTS
The most common form of correlation is a comparison between the predicted "ultimate" capacity from a dynamic test and the "ultimate" capacity as defined by the well-known
_,, .. .. . .. r I H.t • C"L C
Davisson criteria from a static result. Whereas this is a convenient method of comparing results, it does not tell the whole story in the way that a full load/settlement plot does. There is also ambiguity in the term "static load test." Is it a constant rate of penetration test or an incremental test with the load maintained for several hours so that creep and possible shortterm consolidation can occur? The situation is not clear, and there are at present no universally accepted correlation procedures.
Many researchers, including the authors, believe that for the present the most satisfactory way of comparing results is by means of full load/settlement plots. In this way, any differences such as creep and consolidation can be identified.
Genuine correlations between dynamic and static load tests are difficult to obtain. Once a shaft or pile has been loaded to failure, either dynamically or statically, it is no longer virgin and cannot be expected on retest to behave in the same manner. This is particularly true in cohesive or silty soils . How then can true correlations be obtained?
The simplest and most common method is by carrying out a dynamic test either before or after static loading. This must be considered unreliable, or, at the least, of limited accuracy. It is of course possible to sandwich a static test between two

52
I /\'I.ml ~00 TO PILE I I
I DG'ACI' 'DIE PI1E I
a:tlllERT TO FORCE
TRANSPORTATION RESEARCH RECORD 1331
dynamic tests, one carried out before and one after the static test. This would give a good indication of performance changes brought about by the testing itself-if there were none, the correlation could be considered valid .
a:tlllERT VEUJCl'lY TO Z V
An alternative approach, and one which was used on a trial site in Belgium (J), was to construct a series of shafts, each with its own twin a few feet away. Dynamic tests were carried out on the first set of shafts, followed by static loading of the twins. One can never know for certain whether the twins were identical, but encouraging results were obtained.
PIOl' LOAD/SEITll!lIDlr GRARI
a:MlUl'ER SIMllATION
OR C(JOI'E UIJl'IMl\TE CAPACITY 1-----~
FIGURE 2 Stages of a test.
COMPARISON OF THE CASE AND SIMBAT METHODOLOGIES
The SIMBA T technique is a relative newcomer in the field of dynamic load testing. It was developed in France by CEBTP and is the result of some 10 years of research , both in the laboratory and in the field. The system uses many of the
TABLE I TOTAL FORCE MEASUREMENT
OPERATIOO rorENl'IAL SOORCE OF ERRJR ESTIM1\'l'ED ACXIJRACT
Attachment of strain fbor Bonding/attachment ± % Gauges to Pile Shaft Non-Verticality
Measurement of Strain Does strain measured at 2 points on ± % pile surface accurately represent average strain over the full shaft section
Strain gauge accuracy, ~ture ± % effects etc.
Eccentricity of hal1lner :inpact on shaft ± %
Transmission of strain gauge signal ± % through connecting cables to Data Acquisition
A=uracy and resolution of Data ± % Acquisition system
conversion of strain EQ[Qll ~ ~tnlin K li.!l!<ti2D K Modulll,l; to Faroe
Accuracy of Modlllus Assunrption -± % (particularly if pile has steel sleeve)
Accuracy of Section Measurement ± %
Global Accuracy of Faroe Measurement ± %
TABLE 2 VELOCITY MEASUREMENT
OPERATIOO rorENl'IAl, SCXJRCE ESTIM1\'l'ED OF ERR:>R ACXIJRACT
Attachment of fbor attachment ± % Aooelerareters to Pile Non-Verticality
Measurement of Strain Aa:elerareter accuracy, ~ture ± % Acceleration effects etc.
Transmission of signal to Data ± % Acquisition system
Accuracy and resolution of Data ± % Acquisition system
conversion of ~!i!l21<it¥ "' ;i;ntearal 2' Acael!i!r.i!.U2D Acceleration to Velocity Progressive errors, integration ± %
constant etc.
Global Accuracy of Velocity Measurement ± %

Heritier et al.
TABLE 3 PREDICTION OF ULTIMATE CAPACITY FROM FORCE AND VELOCITY
OPERATIOO PCll'EID'IAL SOORCE ESTIMATED OF ERROR AOOJRACY
Multiply Velocity Assun¢ion of ± % by Inpedance (Z) z = PCA, where
p = concrete density c = Bar wave velocity in pile A = Pile cross-section
Separation of Forces 010ice of position on Force Separation ± % an:i calculation of Diagram (See Fig 3) Total Reaction
Are all the upward forces due to soil ± % effects or, in the case of bored shafts, is there a cxintri.bution from shaft enlargements etc.
Conversion of Total O»l.Q!l QC: M!i!thodol~ Reaction to static Reaction CA.SE ± %
CAmAP WO SIMBAT
Prediction of Ul till\ate What is Ultill\ate capacity? Oloice of ± % capacity definitions, Velocity
Have all the soil resistance forces ± % been utilised?
Global Accuracy of Prediction ± %
xE 0
2400
TOTAL FORCE UPWARDS FORCE IN FREE SHAFT
DYNAMIC RESISTANCE FROM SOIL
~ ~ ,_ u < ~ u ~
~ < z >-0
-800.
50.0 I O. 250. 350. 4 o.
TIMESCALE ( x 80 micro secs > xE 0
FIGURE 3 Force separation diagram.
original wave equation theories but differs from other systems in a number of areas. These have been described previously by Paquet (2). Probably the most important single difference is the conversion of dynamic total resistance to static resistance.
The classical CASE formula states that the dynamic to static conversion is related to the pile top velocity as described by Hannigan (3) :
where
RsTAT static resistance, Rov dynamic or total resistance,
V1 velocity at Time 1, F1 force at Time 1, and Jc = dimensionless CASE damping factor.
53
(4) This assumes that all the damping resistances are concentrated at the shaft toe.

54
In the SIMBA T method it is proposed that the relationship between dynamic and static resistance is a function of the penetration velocity of the shaft with respect to the soil:
RsTAT = Rov - f(Vpen) (5)
where f(Vpen) is a function of penetration velocity. The shaft velocity and the penetration velocity are quite
different, as can be seen in Figure 4. The second important difference between methodologies is
that SIMBAT uses a series of impacts on the shaft, often 10 or more, the permanent settlement of penetration being mea-
><E 0
I. 40
I ,/PIL.E VELOCI Y
!. 00 I\
TRANSPORTATION RESEARCH RECORD 1331
sured for each blow. The reactions are then plotted against cumulative penetration. Finally, Equation 5 is applied to the set of results as a whole to obtain a static load settlement plot. This procedure does not require the assumption of a soil damping factor.
The two methods were compared using a series of blows on a driven cast-in-place shaft in France. The shaft was 550 mm in diameter and 16.4 min length and formed in silty sand. The CASE capacity was calculated for four of the blows using a soil damping factor (J) of both 0.2 and 0.4, these being appropriate values for the soil conditions. The results are given in Table 4 and are plotted in Figure 5. The differences between the two predictions are immediately apparent.
I \ PENETR. ,TION VI LOCITY , 0
I ' E
~ u 0
i:rl >
• 600
• 200
-.200
f \ ' \ ./SOI\ VELOCI
I ~ I \
/\ I /v \
_) . \
\ 50.0 150, ~
FIGURE 4 Velocities in pile-soil interaction.
lrY
\. \PE ETRllT!f N
/ ----v
!g../ 350, 4~0.
TABLE 4 COMPARISON OF CASE AND SIMBA T PREDICTIONS
Bla'I !R)p PEI'! DYNAMIC SIMBAT CASE No, HEIG!fl' (llln) RESISTANCE S'OO'IC STATIC RESISTANCE (l<N)
(m) (I<N) RESISTANCE (I<N) J = 0.2 J = 0.4
l 0.3 0.85 2300 2650
2 0.4 0.96 2900 2166
3 0.5 0.85 2900 2250
4 0.6 l.48 3460 2328
5 0.7 l. 73 3755 2432
6 l.O 2.47 4480 2590 3876 3187
7 0.4 0.44 2900 2563
8 l.O 2.51 4750 2830 4153 3330
9 0.5 0.81 3360 2740
10 l.2 3.36 5400 2830 4571 3689
ll 0.5 l.00 3680 2915
12 l.5 3.65 6000 3208 5221 4241
4"
~
0
><E 0

Heritier et al. 55
j
I -45. I. . I CASE PREDICTION RANGE
.... _.._ ____ .,. __ FDR J • O.i! - 0.4
( BLOllS 6, B, JO & Ji! )
BOO . 4000 5600 7200
xE 0 SOIL RESISTANCE (KN)
FIGURES SIMBAT and CASE pile capacity predictions.
CONCLUDING REMARKS
It may seem strange that practitioners of dynamic testing should seek to publicize the potential errors and limitations of these methods. The intention is not to discredit such tests, but rather to create an awareness of potential errors and the measures that can be taken to reduce them. Dynamic/static correlations of 1:1 are probably the result of happy coincidence rather than the application of science.
The current Federal Highway Administration program of dynamic testing in California and Texas is providing an enormous data base from which some of the questions raised in this paper may be answered.
REFERENCES
1. P. J. Hannigan. Dynamic Pile Testing and Analysis. 11th Annual Fundamentals of Deep Foundation Design, University of Missouri at Rolla, Rolla, 1986.
2. J. Paquet. Checking Beating Capacity by Dynamic LoadingChoice of a Methodology. Third International Conference on Application of Stress-Wave Theory to Piles, Ottawa, Ontario, Canada, 1988.
3. P. J. Hannigan. Pile Dynamic Testing, Integrity and Bearing Capacity. Conference proceedings. Groupement Beige de la Societe Internationale de Mechanique des Sols et des Travaux de Fondations, Brussels, 1987.