accuracy assessment of lidar-derived … · mohd radhie mohd salleh a,*, zamri ismail b, muhammad...
TRANSCRIPT
ACCURACY ASSESSMENT OF LIDAR-DERIVED DIGITAL TERRAIN MODEL (DTM)
WITH DIFFERENT SLOPE AND CANOPY COVER IN TROPICAL FOREST REGION
Mohd Radhie Mohd Salleh a,*, Zamri Ismail b, Muhammad Zulkarnain Abdul Rahman a
a TropicalMAP RESEARCH GROUP
b Photogrammetry & Laser Scanning RESEARCH GROUP, Department of Geoinformation, Faculty of Geoinformation and Real
Estate, Universiti Teknologi Malaysia, 81310 UTM Johor Bahru, Johor, Malaysia.
*Corresponding author e-mail: [email protected]
KEY WORDS: Airborne LiDAR, Accuracy, Vegetation, Slope, Tropical Forest
ABSTRACT:
Airborne Light Detection and Ranging (LiDAR) technology has been widely used recent years especially in generating high accuracy
of Digital Terrain Model (DTM). High density and good quality of airborne LiDAR data promises a high quality of DTM. This study
focussing on the analysing the error associated with the density of vegetation cover (canopy cover) and terrain slope in a LiDAR
derived-DTM value in a tropical forest environment in Bentong, State of Pahang, Malaysia. Airborne LiDAR data were collected can be consider as low density captured by Reigl system mounted on an aircraft. The ground filtering procedure use adaptive triangulation
irregular network (ATIN) algorithm technique in producing ground points. Next, the ground control points (GCPs) used in generating
the reference DTM and these DTM was used for slope classification and the point clouds belong to non-ground are then used in
determining the relative percentage of canopy cover. The results show that terrain slope has high correlation for both study area (0.993 and 0.870) with the RMSE of the LiDAR-derived DTM. This is similar to canopy cover where high value of correlation (0.989 and
0.924) obtained. This indicates that the accuracy of airborne LiDAR-derived DTM is significantly affected by terrain slope and canopy
caver of study area.
1. INTRODUCTION
Light Detection and Ranging (LiDAR) is an active remote
sensing technique that able to map various activities of the Earth’s surface and features such as vegetation and building,
which also provides Digital Terrain Model (DTM) with up to
sub-meter vertical accuracy (Bater, 2009) and increasingly being
used to map forested terrain (Reutebuch et al., 2003). It works by determine the distance between the sensors and ground objects
by measuring the time of the transmitted pulse return to the
LiDAR sensor from the objects or ground surface. Nowadays,
airborne LiDAR is one of the technology that widely used in surveying and industrial measurement applications (Cui, 2013).
This technology acquire digital elevation data effectively and
accurately as compared to conventional methods (Ismail et al., 2015). Furthermore, LiDAR with high resolution data can be
used in generating the digital terrain models (DTMs) and digital
surface models (DSMs) which is important to support wide range
of applications such as specific research, education, management of public resources (Hodgson et al., 2005) engineering projects,
hydrology and floodplain management, corridor mapping, etc.
(Cui, 2013). By applying suitable processing technique, a high
quality of DTM can be generated from LiDAR data (Cui et al., 2013). Hence, an effective of LiDAR data processing is
important to all the applications (Axelsson, 1999).
However, the classification of point cloud or LiDAR data filtering process which focusing on the ground and non-ground
points separation are very crucial to most of the applications (Cui,
2013). Although, most of the research agree that the RMSE of
LiDAR elevation data is ±15 cm but it is only for the limited area with flat terrain, less vegetation, and low altitude during data
collection (Hodgson and Bresnahan, 2004). More studies should
be conducted to determine the level of accuracy with various
physical environment and also other external factors that will
give an impact to the quality of DTM such as land cover type,
land forms, etc. Besides that, the classification of LiDAR point clouds that represents as terrain is a fundamental problem in the
production of high quality of DTMs (Pingel et al., 2013). The
filtering of LiDAR data become more challenging especially at
high relief area or hybrid geographic features (Li, 2013). Although dozens of filtering algorithm have been developed in
separation of ground points, the difficulties in this extraction still
exist where most of the algorithm need specific condition to
produce good results (Meng et al., 2010) such as flat and open areas, . Due to this scenario, more studies should be conducted in
order to providing the understanding of the limitations of DTM
accuracy relative to various intended end uses, and also may provide direction in improving the DTM development (Su and
Bork, 2006)
Many studies on the capability of airborne LiDAR system in producing DTM have been done in developed or temperate
countries but still demanded in tropical area especially in
Malaysia (Ismail et al., 2015). Terrain slope and land cover type
become emerging factor in contributing the error to the LiDAR-derived DTM (Goncalves et al., 2006; Hodgson and Bresnahan,
2004; Raber et al., 2002; Su and Bork, 2006). An area with highly
dense canopy facing difficulties for airborne LiDAR signal to
penetrate and reach to the ground. This may lead to the density of ground point is lower than open space area. This situation
contribute significantly to the error of DTM generated. In term of
slope effects, Figure 1 shows the illustration on how terrain slope
effect the LiDAR data.
ISPRS Annals of the Photogrammetry, Remote Sensing and Spatial Information Sciences, Volume II-2/W2, 2015 Joint International Geoinformation Conference 2015, 28–30 October 2015, Kuala Lumpur, Malaysia
This contribution has been peer-reviewed. The double-blind peer-review was conducted on the basis of the full paper. doi:10.5194/isprsannals-II-2-W2-183-2015
183

Figure 1. The illustration for impact of slope towards the accuracy of LiDAR data (Lewis and Hancock, 2007).
Based on the Figure 1, although sample (a) as tree return such as
from tree crown, branches, etc. but the terrain slope causing the classification of sample (a) as ground points because sample (b)
as ground return is at a higher altitude (Lewis and Hancock,
2007). This situation is challenging in filtering the LiDAR data
for major filtering algorithms. Besides that, horizontal error may introduce “apparent” error in the elevation value where any 100
cm horizontal error on a 100 slope can be up to 18 cm of elevation
error (Hodgson and Bresnahan, 2004). In addition, high density of vegetation also reduce the number of LiDAR ground points
due to less signal can penetrate the canopy and reach to the
ground along with the slope affects the generation of highly
accurate DTM.
2. STUDY AREA AND DATA
2.1 Description of the data and study area
In this study, two study area are chosen where located in the
south-west of Bentong District, State of Pahang, Malaysia (see
Figure 2 (a) and (b)). The first study area is mainly covered by
rubber trees while the next study area covered with mixed forest. Both of these two study areas can be considered as tropical forest
area where they covered by high canopy density and undulating
terrain. The slope gradient range between 00 and 150 and the
canopy density more than 60 percent (%). The sample of photos taken over study areas as shown in the Figure 3 (a),(b), and (c).
(a)
(b)
Figure 2. Map of study area covered with (a) rubber trees
vegetation; (b) mixed forest.
(a) (b)
(c)
Figure 3. Photographs taken over study area covered with rubber
trees (a) and (b) with understorey vegetation (c) mixed forest
Airborne LiDAR data (Figure 4 and Figure 5) were collected by
survey firm company on January 2009 using REIGL laser
scanner which is mounted on a British Nomad aircraft. The data were delivered in LAS format and the average point density is
about 1.3 points per meter square (rubber trees) and 3.2 points
per meter square (mixed forest). The airborne LiDAR data were
processed using an automated methods in classifying ground returns and using manual interpretation. This process known as
ISPRS Annals of the Photogrammetry, Remote Sensing and Spatial Information Sciences, Volume II-2/W2, 2015 Joint International Geoinformation Conference 2015, 28–30 October 2015, Kuala Lumpur, Malaysia
This contribution has been peer-reviewed. The double-blind peer-review was conducted on the basis of the full paper. doi:10.5194/isprsannals-II-2-W2-183-2015
184
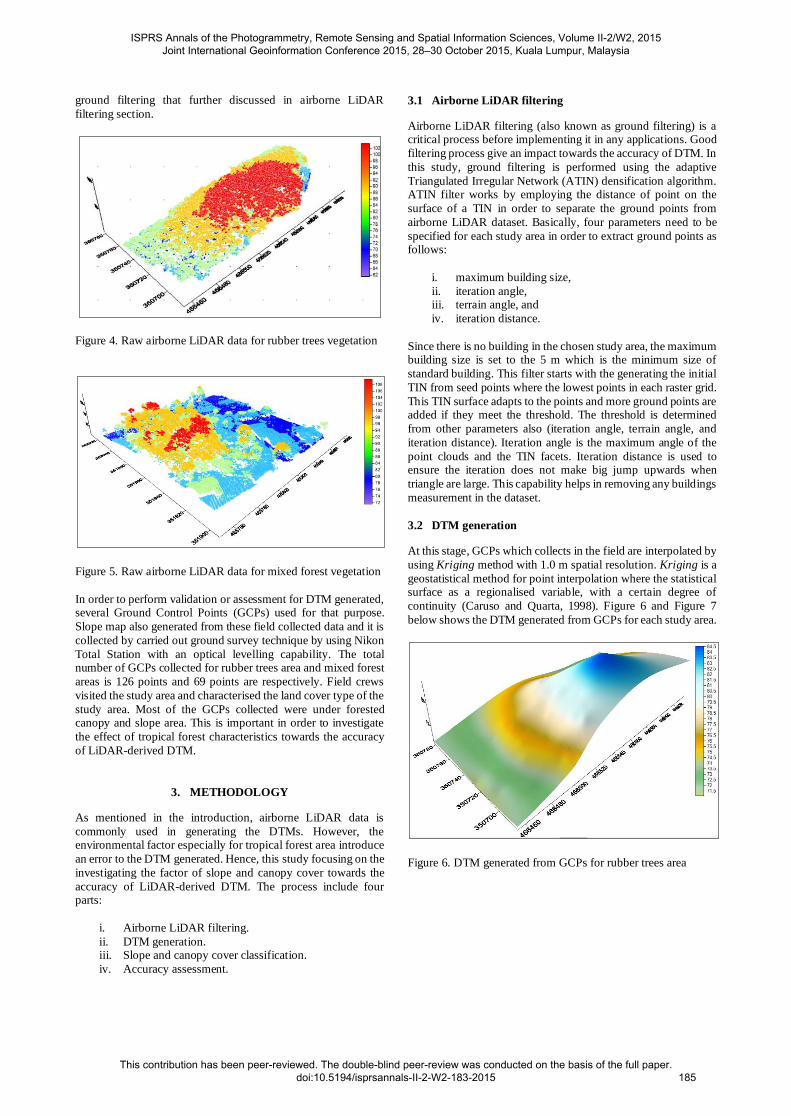
ground filtering that further discussed in airborne LiDAR
filtering section.
Figure 4. Raw airborne LiDAR data for rubber trees vegetation
Figure 5. Raw airborne LiDAR data for mixed forest vegetation
In order to perform validation or assessment for DTM generated, several Ground Control Points (GCPs) used for that purpose.
Slope map also generated from these field collected data and it is
collected by carried out ground survey technique by using Nikon
Total Station with an optical levelling capability. The total number of GCPs collected for rubber trees area and mixed forest
areas is 126 points and 69 points are respectively. Field crews
visited the study area and characterised the land cover type of the
study area. Most of the GCPs collected were under forested canopy and slope area. This is important in order to investigate
the effect of tropical forest characteristics towards the accuracy
of LiDAR-derived DTM.
3. METHODOLOGY
As mentioned in the introduction, airborne LiDAR data is
commonly used in generating the DTMs. However, the environmental factor especially for tropical forest area introduce
an error to the DTM generated. Hence, this study focusing on the
investigating the factor of slope and canopy cover towards the
accuracy of LiDAR-derived DTM. The process include four parts:
i. Airborne LiDAR filtering.
ii. DTM generation. iii. Slope and canopy cover classification.
iv. Accuracy assessment.
3.1 Airborne LiDAR filtering
Airborne LiDAR filtering (also known as ground filtering) is a critical process before implementing it in any applications. Good
filtering process give an impact towards the accuracy of DTM. In
this study, ground filtering is performed using the adaptive
Triangulated Irregular Network (ATIN) densification algorithm. ATIN filter works by employing the distance of point on the
surface of a TIN in order to separate the ground points from
airborne LiDAR dataset. Basically, four parameters need to be
specified for each study area in order to extract ground points as follows:
i. maximum building size,
ii. iteration angle, iii. terrain angle, and
iv. iteration distance.
Since there is no building in the chosen study area, the maximum building size is set to the 5 m which is the minimum size of
standard building. This filter starts with the generating the initial
TIN from seed points where the lowest points in each raster grid.
This TIN surface adapts to the points and more ground points are added if they meet the threshold. The threshold is determined
from other parameters also (iteration angle, terrain angle, and
iteration distance). Iteration angle is the maximum angle of the
point clouds and the TIN facets. Iteration distance is used to ensure the iteration does not make big jump upwards when
triangle are large. This capability helps in removing any buildings
measurement in the dataset.
3.2 DTM generation
At this stage, GCPs which collects in the field are interpolated by
using Kriging method with 1.0 m spatial resolution. Kriging is a
geostatistical method for point interpolation where the statistical surface as a regionalised variable, with a certain degree of
continuity (Caruso and Quarta, 1998). Figure 6 and Figure 7
below shows the DTM generated from GCPs for each study area.
Figure 6. DTM generated from GCPs for rubber trees area
ISPRS Annals of the Photogrammetry, Remote Sensing and Spatial Information Sciences, Volume II-2/W2, 2015 Joint International Geoinformation Conference 2015, 28–30 October 2015, Kuala Lumpur, Malaysia
This contribution has been peer-reviewed. The double-blind peer-review was conducted on the basis of the full paper. doi:10.5194/isprsannals-II-2-W2-183-2015
185
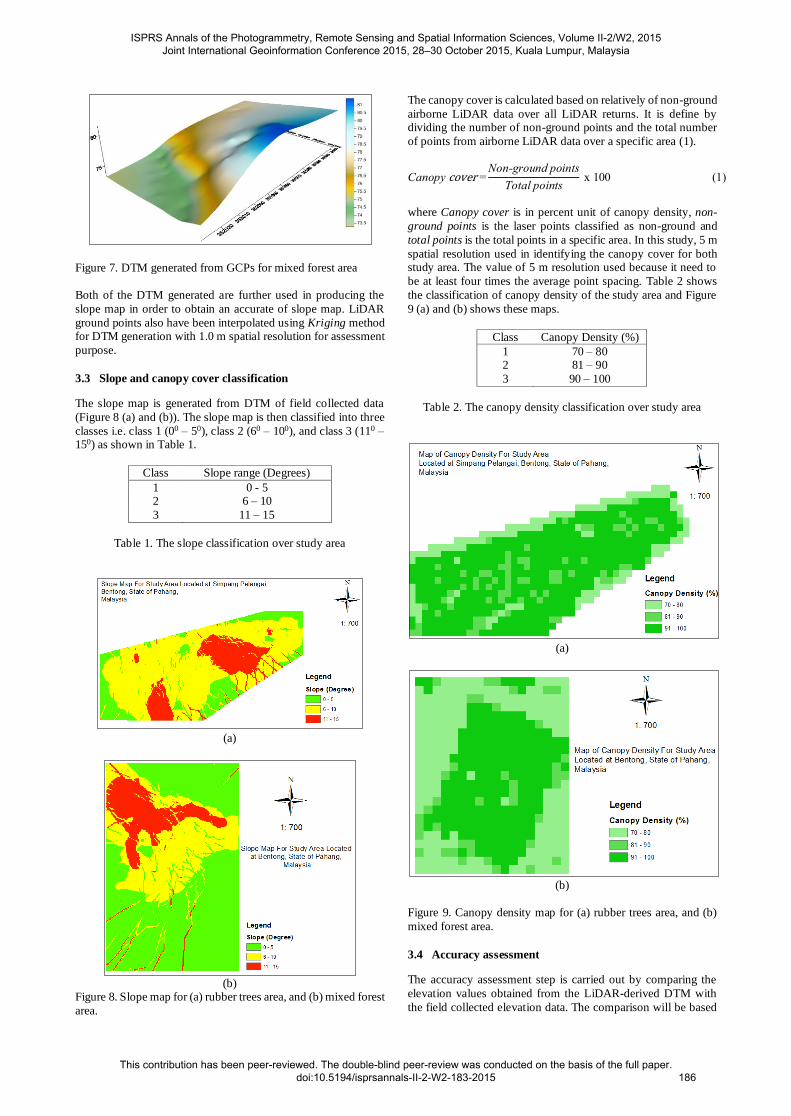
Figure 7. DTM generated from GCPs for mixed forest area
Both of the DTM generated are further used in producing the
slope map in order to obtain an accurate of slope map. LiDAR
ground points also have been interpolated using Kriging method for DTM generation with 1.0 m spatial resolution for assessment
purpose.
3.3 Slope and canopy cover classification
The slope map is generated from DTM of field collected data
(Figure 8 (a) and (b)). The slope map is then classified into three
classes i.e. class 1 (00 – 50), class 2 (60 – 100), and class 3 (110 – 150) as shown in Table 1.
Class Slope range (Degrees)
1 0 - 5 2 6 – 10
3 11 – 15
Table 1. The slope classification over study area
(a)
(b)
Figure 8. Slope map for (a) rubber trees area, and (b) mixed forest
area.
The canopy cover is calculated based on relatively of non-ground
airborne LiDAR data over all LiDAR returns. It is define by dividing the number of non-ground points and the total number
of points from airborne LiDAR data over a specific area (1).
Canopy cover =Non-ground points
Total points x 100 (1)
where Canopy cover is in percent unit of canopy density, non-
ground points is the laser points classified as non-ground and
total points is the total points in a specific area. In this study, 5 m
spatial resolution used in identifying the canopy cover for both study area. The value of 5 m resolution used because it need to
be at least four times the average point spacing. Table 2 shows
the classification of canopy density of the study area and Figure
9 (a) and (b) shows these maps.
Class Canopy Density (%)
1 70 – 80 2 81 – 90
3 90 – 100
Table 2. The canopy density classification over study area
(a)
(b)
Figure 9. Canopy density map for (a) rubber trees area, and (b)
mixed forest area.
3.4 Accuracy assessment
The accuracy assessment step is carried out by comparing the
elevation values obtained from the LiDAR-derived DTM with
the field collected elevation data. The comparison will be based
ISPRS Annals of the Photogrammetry, Remote Sensing and Spatial Information Sciences, Volume II-2/W2, 2015 Joint International Geoinformation Conference 2015, 28–30 October 2015, Kuala Lumpur, Malaysia
This contribution has been peer-reviewed. The double-blind peer-review was conducted on the basis of the full paper. doi:10.5194/isprsannals-II-2-W2-183-2015
186
on the value of Root Mean Squared Error (RMSE), Mean
Absolute Error (MAE) and Mean Bias Error (MBE) presented in equation (2) to (4).
RMSE = √ ∑ (ZLiDARi
-ZGCPi)²n
i=1
n (2)
MAE = ∑ |ZLiDAR𝑖
− ZGCP𝑖|n
i=1
𝑛 (3)
MBE = ∑ (ZLiDARi
-ZGCPi)n
i=1
n (4)
where n is the number of samples, ZLiDAR is the terrain elevation
obtained from the LiDAR-derived DTM, ZGCP is terrain
elevation value obtained from the field GCP.
4. RESULTS AND DISCUSSION
4.1 The effect of terrain slope on airborne LiDAR-derived
DTM
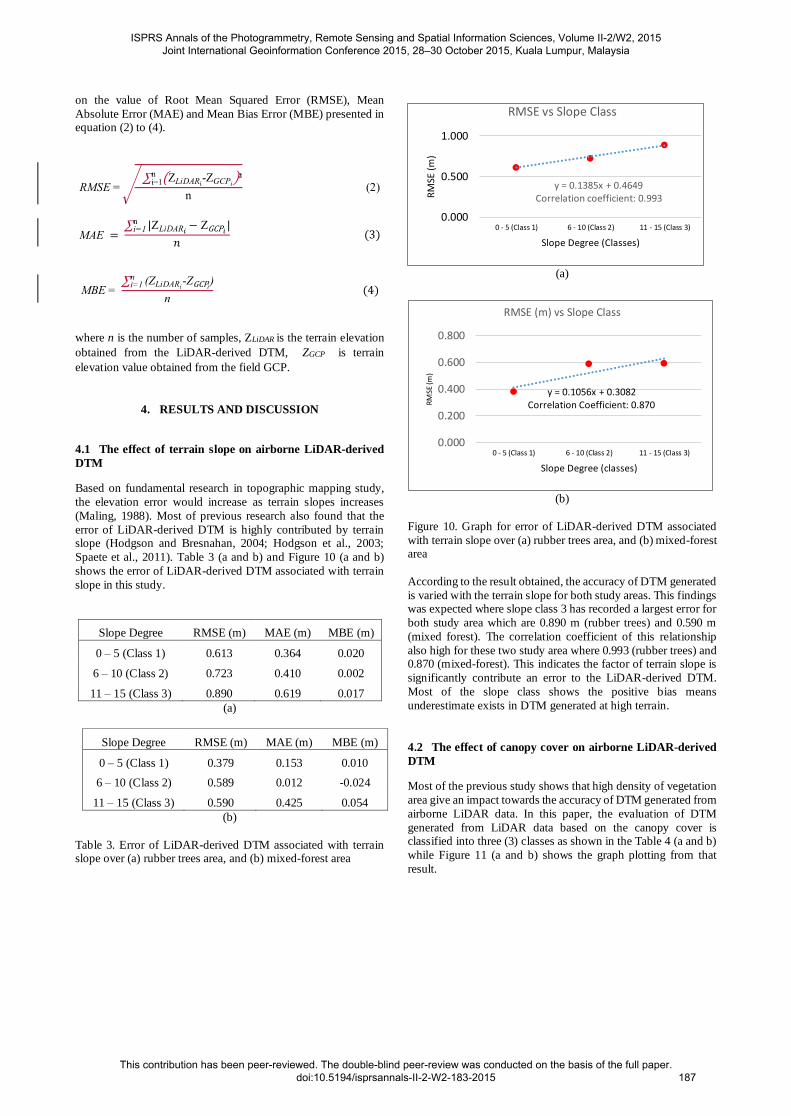
Based on fundamental research in topographic mapping study,
the elevation error would increase as terrain slopes increases
(Maling, 1988). Most of previous research also found that the
error of LiDAR-derived DTM is highly contributed by terrain slope (Hodgson and Bresnahan, 2004; Hodgson et al., 2003;
Spaete et al., 2011). Table 3 (a and b) and Figure 10 (a and b)
shows the error of LiDAR-derived DTM associated with terrain
slope in this study.
Slope Degree RMSE (m) MAE (m) MBE (m)
0 – 5 (Class 1) 0.613 0.364 0.020
6 – 10 (Class 2) 0.723 0.410 0.002
11 – 15 (Class 3) 0.890 0.619 0.017
(a)
Slope Degree RMSE (m) MAE (m) MBE (m)
0 – 5 (Class 1) 0.379 0.153 0.010
6 – 10 (Class 2) 0.589 0.012 -0.024
11 – 15 (Class 3) 0.590 0.425 0.054
(b)
Table 3. Error of LiDAR-derived DTM associated with terrain slope over (a) rubber trees area, and (b) mixed-forest area
(a)
(b)
Figure 10. Graph for error of LiDAR-derived DTM associated
with terrain slope over (a) rubber trees area, and (b) mixed-forest area
According to the result obtained, the accuracy of DTM generated
is varied with the terrain slope for both study areas. This findings was expected where slope class 3 has recorded a largest error for
both study area which are 0.890 m (rubber trees) and 0.590 m
(mixed forest). The correlation coefficient of this relationship
also high for these two study area where 0.993 (rubber trees) and 0.870 (mixed-forest). This indicates the factor of terrain slope is
significantly contribute an error to the LiDAR-derived DTM.
Most of the slope class shows the positive bias means
underestimate exists in DTM generated at high terrain.
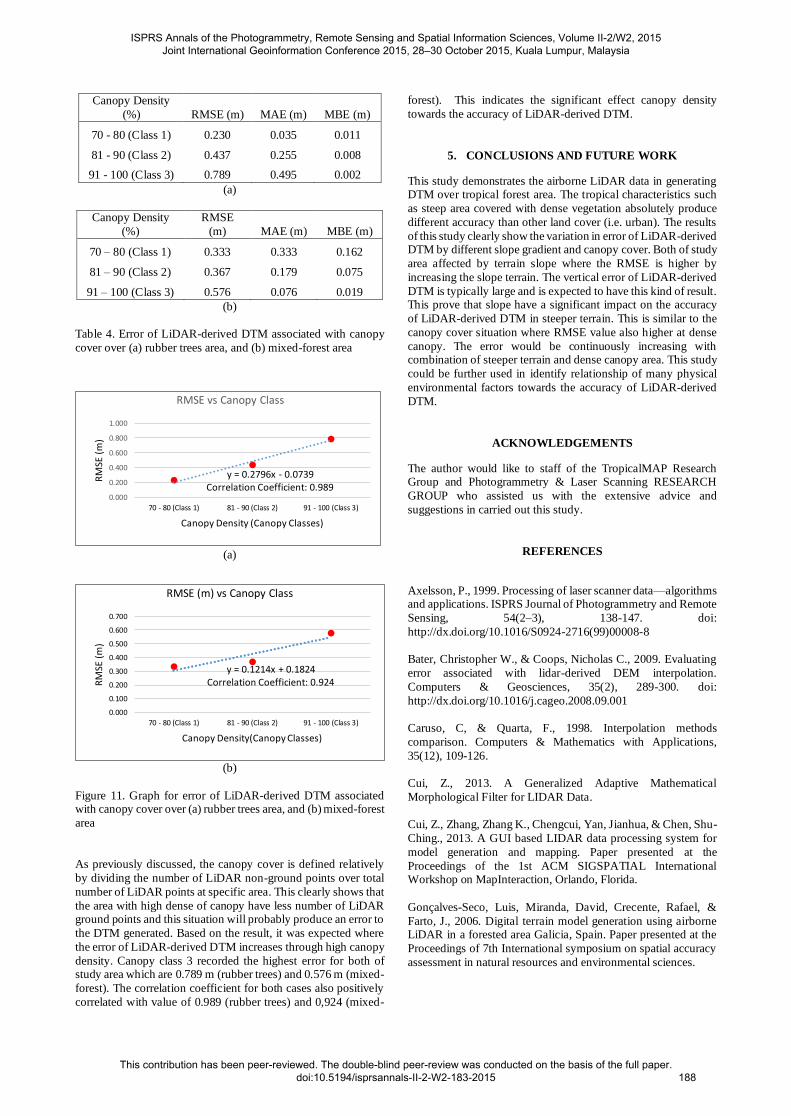
4.2 The effect of canopy cover on airborne LiDAR-derived
DTM
Most of the previous study shows that high density of vegetation
area give an impact towards the accuracy of DTM generated from
airborne LiDAR data. In this paper, the evaluation of DTM
generated from LiDAR data based on the canopy cover is classified into three (3) classes as shown in the Table 4 (a and b)
while Figure 11 (a and b) shows the graph plotting from that
result.
y = 0.1385x + 0.4649Correlation coefficient: 0.993
0.000
0.500
1.000
0 - 5 (Class 1) 6 - 10 (Class 2) 11 - 15 (Class 3)
RM
SE (
m)
Slope Degree (Classes)
RMSE vs Slope Class
y = 0.1056x + 0.3082Correlation Coefficient: 0.870
0.000
0.200
0.400
0.600
0.800
0 - 5 (Class 1) 6 - 10 (Class 2) 11 - 15 (Class 3)
RM
SE (m
)
Slope Degree (classes)
RMSE (m) vs Slope Class
ISPRS Annals of the Photogrammetry, Remote Sensing and Spatial Information Sciences, Volume II-2/W2, 2015 Joint International Geoinformation Conference 2015, 28–30 October 2015, Kuala Lumpur, Malaysia
This contribution has been peer-reviewed. The double-blind peer-review was conducted on the basis of the full paper. doi:10.5194/isprsannals-II-2-W2-183-2015
187
Canopy Density
(%) RMSE (m) MAE (m) MBE (m)
70 - 80 (Class 1) 0.230 0.035 0.011
81 - 90 (Class 2) 0.437 0.255 0.008
91 - 100 (Class 3) 0.789 0.495 0.002
(a)
Canopy Density
(%)
RMSE
(m) MAE (m) MBE (m)
70 – 80 (Class 1) 0.333 0.333 0.162
81 – 90 (Class 2) 0.367 0.179 0.075
91 – 100 (Class 3) 0.576 0.076 0.019
(b)
Table 4. Error of LiDAR-derived DTM associated with canopy
cover over (a) rubber trees area, and (b) mixed-forest area
(a)
(b)
Figure 11. Graph for error of LiDAR-derived DTM associated with canopy cover over (a) rubber trees area, and (b) mixed-forest
area
As previously discussed, the canopy cover is defined relatively
by dividing the number of LiDAR non-ground points over total
number of LiDAR points at specific area. This clearly shows that
the area with high dense of canopy have less number of LiDAR ground points and this situation will probably produce an error to
the DTM generated. Based on the result, it was expected where
the error of LiDAR-derived DTM increases through high canopy
density. Canopy class 3 recorded the highest error for both of study area which are 0.789 m (rubber trees) and 0.576 m (mixed-
forest). The correlation coefficient for both cases also positively
correlated with value of 0.989 (rubber trees) and 0,924 (mixed-
forest). This indicates the significant effect canopy density
towards the accuracy of LiDAR-derived DTM.
5. CONCLUSIONS AND FUTURE WORK
This study demonstrates the airborne LiDAR data in generating DTM over tropical forest area. The tropical characteristics such
as steep area covered with dense vegetation absolutely produce
different accuracy than other land cover (i.e. urban). The results
of this study clearly show the variation in error of LiDAR-derived DTM by different slope gradient and canopy cover. Both of study
area affected by terrain slope where the RMSE is higher by
increasing the slope terrain. The vertical error of LiDAR-derived
DTM is typically large and is expected to have this kind of result. This prove that slope have a significant impact on the accuracy
of LiDAR-derived DTM in steeper terrain. This is similar to the
canopy cover situation where RMSE value also higher at dense
canopy. The error would be continuously increasing with combination of steeper terrain and dense canopy area. This study
could be further used in identify relationship of many physical
environmental factors towards the accuracy of LiDAR-derived
DTM.
ACKNOWLEDGEMENTS
The author would like to staff of the TropicalMAP Research Group and Photogrammetry & Laser Scanning RESEARCH
GROUP who assisted us with the extensive advice and
suggestions in carried out this study.
REFERENCES
Axelsson, P., 1999. Processing of laser scanner data—algorithms and applications. ISPRS Journal of Photogrammetry and Remote
Sensing, 54(2–3), 138-147. doi:
http://dx.doi.org/10.1016/S0924-2716(99)00008-8
Bater, Christopher W., & Coops, Nicholas C., 2009. Evaluating
error associated with lidar-derived DEM interpolation.
Computers & Geosciences, 35(2), 289-300. doi:
http://dx.doi.org/10.1016/j.cageo.2008.09.001
Caruso, C, & Quarta, F., 1998. Interpolation methods
comparison. Computers & Mathematics with Applications,
35(12), 109-126.
Cui, Z., 2013. A Generalized Adaptive Mathematical
Morphological Filter for LIDAR Data.
Cui, Z., Zhang, Zhang K., Chengcui, Yan, Jianhua, & Chen, Shu-
Ching., 2013. A GUI based LIDAR data processing system for
model generation and mapping. Paper presented at the
Proceedings of the 1st ACM SIGSPATIAL International Workshop on MapInteraction, Orlando, Florida.
Gonçalves-Seco, Luis, Miranda, David, Crecente, Rafael, &
Farto, J., 2006. Digital terrain model generation using airborne LiDAR in a forested area Galicia, Spain. Paper presented at the
Proceedings of 7th International symposium on spatial accuracy
assessment in natural resources and environmental sciences.
y = 0.2796x - 0.0739Correlation Coefficient: 0.989
0.000
0.200
0.400
0.600
0.800
1.000
70 - 80 (Class 1) 81 - 90 (Class 2) 91 - 100 (Class 3)
RM
SE (
m)
Canopy Density (Canopy Classes)
RMSE vs Canopy Class
y = 0.1214x + 0.1824Correlation Coefficient: 0.924
0.000
0.100
0.200
0.300
0.400
0.500
0.600
0.700
70 - 80 (Class 1) 81 - 90 (Class 2) 91 - 100 (Class 3)
RM
SE (
m)
Canopy Density(Canopy Classes)
RMSE (m) vs Canopy Class
ISPRS Annals of the Photogrammetry, Remote Sensing and Spatial Information Sciences, Volume II-2/W2, 2015 Joint International Geoinformation Conference 2015, 28–30 October 2015, Kuala Lumpur, Malaysia
This contribution has been peer-reviewed. The double-blind peer-review was conducted on the basis of the full paper. doi:10.5194/isprsannals-II-2-W2-183-2015
188
Hodgson, M. E., & Bresnahan, P., 2004. Accuracy of Airborne
Lidar-Derived Elevation. Photogrammetric Engineering & Remote Sensing, 70(3), 331-339.
Hodgson, M.E., J.R. Jensen, L. Schmidt, S.R. Schill, and B.
Davis, 2003. An evaluation of LIDAR-and IFSAR-derived digital elevation models in leaf-on conditions with USGS Level
1 and Level 2 DEMs. Remote Sensing of Environment, 84(2),
295-308.
Hodgson, M.E., J.R. Jensen, G.T. Raber, J.A. Tullis, B.A. Davis,
G. Thompson and K., 2005. An evaluation of lidar-derived
elevation and terrain slope in leaf-off conditions.
Photogrammetric Engineering & Remote Sensing, 71(7), 817-823.
Ismail, Z., Rahman, M. Z. A., Salleh, Salleh, M. R. M., & Yusof,
A. R. M., 2015. Accuracy Assessment of LIDAR-Derived Elevation Value Over Vegetated Terrain in Tropical Region.
Jurnal Teknologi, 73(5).
Lewis, P, & Hancock, S., 2007. LiDAR for vegetation applications. UCL, Gower St, London, UK.
Li, Yong., 2013. Filtering Airborne LiDAR Data by An
Improved Morphological Method Based on Multi-gradient Analysis. ISPRS, 191-194.
Maling, Derek H., 1988. Measurements from maps: principles
and methods of cartometry: Butterworth-Heinemann.
Meng, X., Currit, N., & Zhao, K., (2010). Ground Filtering
Algorithms for Airborne LiDAR Data: A Review of Critical
Issues. Remote Sensing, 833-860.
Pingel, Thomas J., Clarke, Keith C., & McBride, William A.,
2013. An improved simple morphological filter for the terrain
classification of airborne LIDAR data. ISPRS Journal of Photogrammetry and Remote Sensing, 77(0), 21-30. doi:
http://dx.doi.org/10.1016/j.isprsjprs.2012.12.002
Raber, George T, Jensen, John R, Schill, Steven R, & Schuckman, Karen, 2002. Creation of digital terrain models
using an adaptive lidar vegetation point removal process.
Photogrammetric engineering and remote sensing, 68(12), 1307-
1314.
Reutebuch, S. E, McGaughey, R. J., Andersen, Hans-Erik, &
Carson, W. W., 2003. Accuracy of a high-resolution lidar terrain
model under a conifer forest canopy. Canadian Journal of Remote Sensing, 29(5), 527-535.
Spaete, Lucas P., Glenn, N.F., Derryberry, D. R, Sankey,
Temuulen, T., Mitchell, J. J., & Hardegree, S. P., 2011. Vegetation and slope effects on accuracy of a LiDAR-derived
DEM in the sagebrush steppe. Remote Sensing Letters, 2(4), 317-
326.
Su, J., & Bork, E., 2006. Influence of vegetation, slope, and lidar
sampling angle on DEM accuracy. Photogrammetric Engineering
& Remote Sensing, 72(11), 1265-1274.
ISPRS Annals of the Photogrammetry, Remote Sensing and Spatial Information Sciences, Volume II-2/W2, 2015 Joint International Geoinformation Conference 2015, 28–30 October 2015, Kuala Lumpur, Malaysia
This contribution has been peer-reviewed. The double-blind peer-review was conducted on the basis of the full paper. doi:10.5194/isprsannals-II-2-W2-183-2015
189