aces red experiment #1 environmental test results for
TRANSCRIPT

Nixon 1 32nd Annual AIAA/USU
Conference on Small Satellites
[SSC18-IV-07]
ACES RED Experiment #1 Environmental Test Results for Industrial Grade, Non-
traditional, and Other Components Lacking Flight Heritage
Mason Nixon, Dr. Chris Duron
SMDC
Martin Road, Bldg. 5221, Redstone Arsenal, AL 35898
(256) 955-7807
Jameson Hilliard, Eric Becnel
Radiance Technologies
350 Wynn Drive, Huntsville, AL 35805
(901) 896-7762
Gauge Day, John Gould, Jessica Shrontz, Evan Swinney, Andrew Webb
UAH SMAP Center
200 Sparkman Drive NW Suite #2, Huntsville, AL 35805
(256) 955-7818
Elizabeth Neilson
SIXGEN
844 West St., Suite 200, Annapolis, MD 21401
(256) 955-2930
Abstract
Results of the thermal vacuum chamber (TVAC) testing and vibrational testing of the ACES RED Experiment #1
are presented. Performance of commercial-off-the-shelf components such as the Avnet PicoZed, the Xiphos Q7, the
MAI-400, and a NovaTel GNSS during TVAC testing are provided and analyzed. To our knowledge, this is the first
orbital flight of this version of the GNSS, this version of the MAI-400, and the PicoZed. The experiment utilizes a
novel structural concept for ease of electronics assembly and disassembly. The health monitoring system measures
temperatures, vibration, voltages, and currents for situational awareness of each of these component's relative
performance. An assessment and progression of the technology readiness level of the hardware is also presented.
Introduction
The Army Cost-Efficient Spaceflight Research
Experiments and Demonstrations (ACES RED) is an
iterative, periodic flight experiment and
demonstration effort to test singular phenomena,
technologies, and concepts for future Science and
Technology (S&T) projects that are directly related to
and in support of the United States Army Space S&T
Roadmap Programs. The first ACES RED
experiment, AR#1, or the Attitude Determination and
Control System (ADCS) Flyer, has a main focus to
expand on the available dataset to verify long-
duration performance as well as mature various
commercial-off-the-shelf (COTS) technologies that
will reduce the cost and complexity while
maintaining or improving performance of Army
small satellites. AR#1 has a primary focus on attitude
determination and control components.
The primary payload is an MAI-400 ADCS.
Secondary and tertiary payloads include: FPGA-
based flight computers, low cost flight computers
(Avnet PicoZed, Atmel microcontroller), global
positioning system, low cost star-tracker, and various
internal vehicle diagnostic sensors. The experiment
will be mounted on the Department of Defense Space
Test Program’s STP-H6 pallet on the International
Space Station (ISS) ELC-3 (ExPRESS Logistics
Carrier-3) with operation and access to continuous
Nixon 2 32nd Annual AIAA/USU
Conference on Small Satellites
on-orbit data for greater than one year with reliable
reference instrumentation. Because of the nature of
the launch and the ISS mission, NASA requirements
must be met. Among these requirements include both
individual and integrated-level environmental testing,
including both thermal vacuum (TVAC) and
vibrational tests. Additional information on the
mission and objectives can be found in [1].
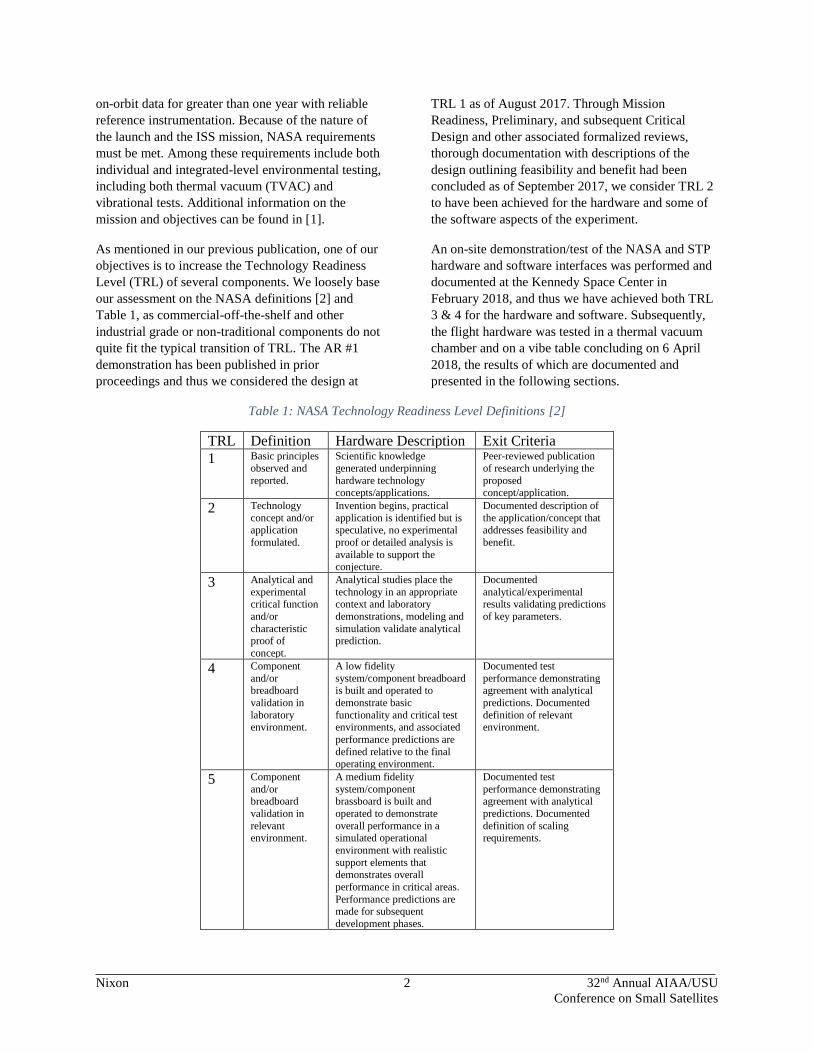
As mentioned in our previous publication, one of our
objectives is to increase the Technology Readiness
Level (TRL) of several components. We loosely base
our assessment on the NASA definitions [2] and
Table 1, as commercial-off-the-shelf and other
industrial grade or non-traditional components do not
quite fit the typical transition of TRL. The AR #1
demonstration has been published in prior
proceedings and thus we considered the design at
TRL 1 as of August 2017. Through Mission
Readiness, Preliminary, and subsequent Critical
Design and other associated formalized reviews,
thorough documentation with descriptions of the
design outlining feasibility and benefit had been
concluded as of September 2017, we consider TRL 2
to have been achieved for the hardware and some of
the software aspects of the experiment.
An on-site demonstration/test of the NASA and STP
hardware and software interfaces was performed and
documented at the Kennedy Space Center in
February 2018, and thus we have achieved both TRL
3 & 4 for the hardware and software. Subsequently,
the flight hardware was tested in a thermal vacuum
chamber and on a vibe table concluding on 6 April
2018, the results of which are documented and
presented in the following sections.
Table 1: NASA Technology Readiness Level Definitions [2]
TRL Definition Hardware Description Exit Criteria
1 Basic principles
observed and
reported.
Scientific knowledge
generated underpinning
hardware technology concepts/applications.
Peer-reviewed publication
of research underlying the
proposed concept/application.
2 Technology
concept and/or application
formulated.
Invention begins, practical
application is identified but is speculative, no experimental
proof or detailed analysis is
available to support the conjecture.
Documented description of
the application/concept that addresses feasibility and
benefit.
3 Analytical and
experimental critical function
and/or
characteristic proof of
concept.
Analytical studies place the
technology in an appropriate context and laboratory
demonstrations, modeling and
simulation validate analytical prediction.
Documented
analytical/experimental results validating predictions
of key parameters.
4 Component
and/or breadboard
validation in
laboratory environment.
A low fidelity
system/component breadboard is built and operated to
demonstrate basic
functionality and critical test environments, and associated
performance predictions are
defined relative to the final operating environment.
Documented test
performance demonstrating agreement with analytical
predictions. Documented
definition of relevant environment.
5 Component
and/or breadboard
validation in
relevant environment.
A medium fidelity
system/component brassboard is built and
operated to demonstrate
overall performance in a simulated operational
environment with realistic
support elements that demonstrates overall
performance in critical areas.
Performance predictions are made for subsequent
development phases.
Documented test
performance demonstrating agreement with analytical
predictions. Documented
definition of scaling requirements.

Nixon 3 32nd Annual AIAA/USU
Conference on Small Satellites
The following sections present the results from the
tests. Several rounds of testing were performed. The
first round was leveraged to determine the nuances
associated with the testing and any other pertinent
information required to determine that our test article
met the specifications required for the STP-H6
mission.
Design Overview
AR #1 utilizes a unique design scheme not often
found within the space community. Many
CubeSatsTM utilize a “stacking” method of placing
the various hardware boards and components on top
of each other, creating an array of flight computers,
power boards, etc1,2,3,4. This limits the engineer if a
board within the stack malfunctions or fails. The
satellite integrator would need to remove the
subsequent items in the stack in order to reveal the
problematic board. AR#1 was designed to avoid this
issue by developing a modular design, leveraging a
sort of “plug and play” system that would allow
components to be changed without having to remove
the rest of the stack.
The final iteration of this design is a “modular tray”
system. Slots with standardized dimensions were
created at specific points within the AR#1 frame that
accept modular trays to which hardware components
are mounted. The trays were designed to insert
securely into the frame of AR#1 and to fit any of the
standard slots, allowing the trays to be interchanged
at any time, regardless of the hardware, and re-insert
into the frame at a different position.
Figure 1: ACES RED Experiment #1 Frame
Figure 2: ACES RED Modular Tray
TVAC Test Overview
The TVAC (thermal vacuum) testing consisted of
several phases, namely, pre-test bakeout, cold start,
hot start, and continuous operations. The target test
temperature profile for the TVAC testing is provided
below in Figure 3. The limits for the selected upper
and lower temperatures were determined by adding
margins to the safe storage and operating
temperatures of various internal components. These
safe storage and operating temperatures are provided
in Table 2.

Nixon 4 32nd Annual AIAA/USU
Conference on Small Satellites
Figure 3: Planned vs Actual TVAC Thermal Profile
During all phases temperature monitoring was
performed with T-type thermocouples placed in eight
locations on the outside of the spacecraft and seven
locations on the inside (Figure 4), this data was
logged for later analysis. While AR#1 was powered
on, board integrated thermal sensors were also
monitored. Since STP requirements prohibit syncing
excessive heat into the H6 pallet, the structure and
flange became areas of interest for temperature
monitoring because they act as the largest heat paths
for the electronic components contained in AR#1
therefore, external thermocouples were mounted to
the top, flange and each of the sides of AR#1 with a
series of three thermocouples featured on the left side
to better capture temperature distributions along the
length of the specimen. Internal thermocouples were
mounted directly to the processing units on each of
the flight computers and to the two power converters
on the power board and this data was displayed live
to inform the test operator if component operating
temperatures exceed allowable levels, requiring
chamber conditions or operating procedures to be
altered to bring component temperatures back into
the allowable ranges.
Table 2: Safe Operating Temperatures
Component Safe Operating Temperatures
Min. Max
Xiphos Q7 [a] -40 ˚C 85 ˚C
PicoZed 7020 [b] -40 ˚C 85 ˚C
PicoZed 7030 [c] -40 ˚C 85 ˚C
OEM628 GNSS [d] -40 ˚C 85 ˚C
MAI-400 [e] -40 ˚C 80 ˚C
GoPro Hero 4 [f] - 52 ˚C

Nixon 5 32nd Annual AIAA/USU
Conference on Small Satellites
Figure 4: Thermocouple Locations
Prior to starting the TVAC test sequence, the PC
clock time was noted to provide accurate timestamps
for the duration of the test. Additionally all operators
were required to use ground straps and gloves when
handling AR#1 before, during and after testing.
The procedures for each TVAC testing phase are
detailed as follows:
Pre-Test Bakeout: The pre-test bakeout was
performed to outgas all materials onboard AR#1.
This bakeout occurred in the same chamber as the
thermal vacuum test. Before bakeout a functional test
(FT) was performed. Chamber pressure was initially
brought down to 1x10⁻³ Torr and another FT was run.
As materials outgassed the chamber pressure was
brought below 1x10⁻⁵ Torr and the temperature was
raised to 70°C. The transition from ambient
temperature (~25°C) to 70°C occurred at a rate of
approximately 0.0625°C/min. Once 70°C was
reached, AR#1 remained at this temperature for
approximately 4 hours.
Thermal Vacuum Testing: The experiment cycled
through the following test scenarios after the pre-test
bakeout: Hot Start, Ambient Start, Cold Start, and
Continuous Operation. In the transition stages
between test and during continuous operations, the
temperature was varied while at a vacuum pressure of
approximately 1x10⁻⁵ Torr. Temperature stabilization
preceding testing at each temperature condition was
determined by the thermocouples mounted on the
outside of the experiment.
Hot Start: After the bakeout process, the temperature
of AR#1 was decreased to approximately 60°C. The
hot start test was performed once AR#1s temperature
had stabilized at 60°C. After initial power on, a FT
was performed by the test operator. After performing
the test, the experiment was turned off while the
temperature remained at 60°C for approximately 2
hours.
Ambient Start: After the hot start, the temperature of
AR#1 was decreased to ambient temperature (~25°C)
at the rate of approximately 0.2°C/min. After
9-MAI
10-Q7
11-Power 3.3 12-Power 5.0
13-PZ
14-SN
15-GNSS

Nixon 6 32nd Annual AIAA/USU
Conference on Small Satellites
reaching ambient temperature, AR#1 was powered on
and a Functional Test (FT) was performed to verify
the experiment was not damaged. After completing
the FT, AR#1 was powered for approximately 2
hours.
Cold Start: AR#1s temperature was further lowered
from the ambient temperature condition to -25°C.
After initial power on, a functional test was
performed by the test operator. After performing the
test, the experiment was turned off while the
temperature was kept at approximately -25°C until all
heaters cycled and the maximum current draw for
each heater was recorded.
Continuous Operations: Continuous operations
consisted of varying temperatures from -25°C to
60°C while the experiment was powered on. Internal
sensors (t-type thermocouples and AR#1 integrated)
collected temperature data via the lab computers and
NTS hardware. These temperatures were compared to
the external temperature sensors mounted to the
outside of the experiment. One cycle was performed
with a maximum transition rate of 0.24°C/min.
Figure 5: TVAC Test Chamber 1
TVAC Testing and Results
TVAC testing was originally scheduled for
03/21/2018 through 03/25/2018. Initially there was
only going to be a single round of testing performed
during TVAC that would be under vacuum, followed
by a sweep through all of the selected test
temperature profiles, and then a move into vibe
testing. However, due to certain issues explained
below, multiple TVAC testing runs were required.
During the first round of TVAC testing, the only data
gathered came from the thermocouples provided to us
through the NTS facility, and the singular external
power supply that was supplying the payload with
28V operational power. During this first round
however, the payload initially ran into some issues
regarding temperatures on the PicoZed 7030. This
temperature was measured off of a thermocouple
placed directly on the exposed silicon die of the Zynq
7030 FPGA. This meant that the main temperature
recorded was the actual IC that contained the FPGA:
the most important IC on the system on module
(SOM) per the project requirements. During the
TVAC chamber’s -25°C cold start, the PicoZed
reached 50°C: in the 70°C bakeout, the PicoZed
peaked at 150°C. After much discussion of probable
causes of this extreme temperature, it was decided
that another round of TVAC testing would be needed.
Figure 6: TVAC Test Chamber 2
During the different modes of operation in the second
round of testing, the data from the flight computer
was downloaded from our script into Excel to graph
the data and determine the cause of the extreme
temperature. The temperature was also showing
similarly high on another temperature sensor that was
not even attached to the same board as the PicoZed.
This revealed stronger evidence that something was
malfunctioning on the PicoZed than what data was
coming off of the external thermocouples provided

Nixon 7 32nd Annual AIAA/USU
Conference on Small Satellites
Figure 7: PicoZed vs. Q7 Current
by NTS. When the temperature was graphed against
the other flight computer, the Q7, it was clear that
this problem needed to be solved immediately.
Upon review, it became apparent that there was a
problem with the PicoZed 7030. The current draw of
the PicoZed 7030 was expected to never go over 1.5
amps. As shown, the PicoZed 7030 was exceeding 3
amps, which was causing the internal protection
circuitry to turn off the power. All further TVAC
testing was put on hold once this issue was identified.
At this point, various options were considered how to
fix the problem. One glaring fact was that the Q7
flight computer had the FPGA Zynq 7020. The
PicoZed had the later model FPGA, the Zynq 7030,
hence the name. It was shown that the Q7 FPGA was
not overheating and not over-drawing its current.
This was confusing at first because the 7020 and
7030 were nearly identical FPGAs, a main difference
being that the 7030 was an exposed flip-chip ball grid
array (BGA), whereas the 7020 was a “normal” style
BGA where the silicon die is wire bonded internally,
providing better heat transfer to the PCB. As
reference, the Q7 data during the same round of
testing as the PicoZed 7030 is provided in the graph
above.
The decision was made to perform a third round of
TVAC testing, featuring a previously unused PicoZed
7030 (without heatsink), PicoZed 7030 (with a
heatsink), a PicoZed 7020, as well as the previously
used power board. The heatsink used on the PicoZed
7030 was a copper heat strap attached to the
mounting system of the daughter card of the PicoZed
7030 and between the FPGA of the PicoZed 7030.
The TVAC testing procedure was to leave the
temperature at ambient and pull the pressure down
while the spacecraft was on with all computers idling.
Shortly after the chamber reached near vacuum, it
became apparent that the PicoZed 7030 without a
heatsink was quickly reaching critical temperatures
again. A small time later, the PicoZed 7030 with a
heatsink started reaching critical temperatures as
well, most likely having saturated the copper heatsink
with too much heat. Throughout the entire test, in
stark contrast to the PicoZed 7030, the PicoZed 7020
did not reach critical temperature. The PicoZed 7020
temperatures matched closely to the Q7 flight
computer’s temperature data from earlier testing.
40
50
60
70
80
90
100
110
120
0
500
1000
1500
2000
2500
3000
3500
4000
4500
00:01:06 00:01:42 00:02:19 00:02:55 00:03:32 00:04:08 00:04:45
Tem
per
atu
re (
⁰C)
Cu
rren
t (m
A)
Time (Hrs:Mins:Sec)
PicoZed 7030 vs. Q7
Q7 Current PicoZed 7030 Current Q7 Temperature PicoZed 7030 Temperature

Nixon 8 32nd Annual AIAA/USU
Conference on Small Satellites
Figure 8: PicoZed Experimental Test Data
After reviewing the results of the test, the decision
was made to swap the PicoZed 7030 with a PicoZed
7020. Thanks to the modular electrical and
mechanical system, and the foresight to have enough
on-hand, the PicoZed 7020 was integrated with the
flight hardware as our secondary flight computer in a
matter of minutes. After this modification was done,
the rest of the boards were able to be rapidly placed
back into the satellite.
A fourth and final TVAC test was performed per the
original TVAC procedure to fully and finally verify
that the system as a whole functioned correctly over
all of the temperature ranges described by the TVAC
procedure. It is notable that the PicoZed 7020
performed as it did in the previous experimental
setup. The rest of the system performed nominally
throughout the test and no further issues were
observed. Because of this, the TVAC testing was
declared complete and the system was then ready for
vibe testing. The satellite was never opened again
from this point forward.
TVAC Conclusions
TVAC testing yielded several lessons that validated
parts of our design and exposed the need to exchange
other parts. Firstly, the PicoZed 7030 thermal and
current runaway indicates that this system on module
(SOM) is not suitable for use in a vacuum without an
appropriate method to sink heat from the processor
die. This is because the die on the PicoZed 7030 is
exposed and does not sink its heat into the rest of the
SOM. The PicoZed 7020, however, does sink its heat
into the rest of the SOM. It has the same form factor
as the 7030 and is a suitable replacement.
The circumstances of the PicoZed 7030 failure also
validated our circuit protections. Although the current
fluctuated wildly on the PicoZed daughtercard itself,
our circuit protections prevented the rest of the
system from being affected. The power regulators on
the daughtercard successfully disabled power when
the PicoZed 7030 current reached approximately 4
Amps.
The modularity of the system was also put to the test
by the need to exchange the PicoZed 7020 in place of
the 7030. We were able to test multiple PicoZed
configurations in a separate, identical structure due to
the ability to insert any flight computer in any flight
computer slot. After it was determined that we
needed to replace the PicoZed, we were able to
simply switch out the cards without affecting the rest
of the system.
The second round of testing highlighted the benefits
of having access to temperature, current, and voltage
data for each subsystem. Having the software that
gave us this data allowed us to diagnose that the
PicoZed was at fault. After the PicoZed replacement,
the system operated successfully in the subsequent
testing cycle. This demonstrated that the system can
0
0.1
0.2
0.3
0.4
0.5
0.6
0.7
0.8
0
20
40
60
80
100
120
140
160
180
17:46 17:55 18:05 18:25 18:35 18:40 18:45 18:50 18:55
Cu
rren
t (m
A)
Tem
per
atu
re (
⁰C)
Time
PicoZed Experimental Test
PZ7030 (deg C) PZ7030 with heatsink (deg C)
PZ7020 (deg C) Total Current (A)

Nixon 9 32nd Annual AIAA/USU
Conference on Small Satellites
survive in a vacuum at the range of temperatures
tested. This elevated the TRL of the COTS
components in the system to level 5.
Vibration Test Overview
Space Test Program (STP) instructed the team to
perform a vibration test on the flight equipment. The
goal of this test was to identify any latent defects and
manufacturing flaws in electrical, electromechanical,
and mechanical hardware at the system level. STP
mandated that the system be tested to the following
requirements as listed in their Interface Control
Document, shown in Table 3.
Table 3: STP Random Vibration Test Spectrum
Based on the requirements laid out by STP and
several conversations with STP and NTS, the ACES
RED team created a Vibe Test Plan. This document
included an overview of the system, as well as the
STP requirements, test procedure, and safety and
handling instructions. The following is the test
procedure prescribed in the official test plan and
presented at the Test Readiness Review.
Prior to transport of the test article to the testing
facility, we performed an initial functional test. Next
the test article was mounted on the vibration table for
the X-axis tests. The Pre-Sine Sweep, Random, and
Post-Sine Sweep were performed as described in
Figure 9: AR#1 Vibe Test Procedure , and the test
article was removed for inspection. During review,
the vibration table was
Figure 9: AR#1 Vibe Test Procedure
setup for the Y-axis tests. The same procedure was
followed for the remaining Y and Z axes with
functional tests being run in between.
Vibe Testing and Results
Two rounds of vibration testing were performed on
the ACES RED flight unit. Both of the rounds were
performed in identical fashions following the vibe
test plan. The first round was intended to be a
qualification test before the experiment was shipped
onward to Houston, but the flight unit had to be
opened up after TVAC to fix issues that came up in
that testing. Therefore, the flight unit had to be re-
qualified to show that nothing had changed in the
configuration or quality of the assembly.
Technicians at National Testing Service (NTS)
located in Huntsville, AL performed the vibration
tests in their dynamics lab. The test engineer handling
the ACES RED project machined a mounting plate to
interface between the AR#1 flange and the surface of
the vibe table. Installation of the experiment onto the
vibe table entailed fastening the mounting plate to the
vibe table then the flight unit onto the mounting
plate. The only ways in which the execution of the
vibe test deviated from the original plan was that the
order of the axes tested was not X, Y, Z but instead
Y, Z, X and the sine sweeps were specified to be
performed up and down between 20Hz and 2000Hz.
This was because the vibe table was already in the
horizontal testing configuration when we arrived, so
it was more efficient to test both of the axes parallel

Nixon 10 32nd Annual AIAA/USU
Conference on Small Satellites
Figure 10: Testing Axes and Accelerometer Positions
to the ground and then flip the vibe table to test the
last axis.
Once the experiment was installed on the vibe table,
two tri-axis accelerometers provided by NTS were
affixed on the top and bottom (on opposite faces) of
the flight unit. This was achieved by placing a piece
of Kapton tape on the AR#1 structure then using a
quick-drying glue to stick the accelerometers onto the
tape. The locations of the accelerometers are shown
in the Figure 10.
While the accelerometers were being installed and
the NTS testing workstation set up, the AR#1 team
ran an aliveness, full-functionality, and STP interface
test to make sure that the experiment had not been
damaged in transport and was still completely
functional.
After the NTS technician and the AR#1 team
indicated that their equipment was functioning as
expected, all of the loose wires were staked down to
the flight unit, the mounting plate, or to the vibe table
itself in such a way that they could not shake
independently of the test configuration and affect the
outcome of the test in any measurable way.
The vibe test began with the Y-axis by performing a
0.5G sine sweep up and down between 20Hz and
2000Hz at a rate of 0.5-1 octave/minute. Then
random vibrations lasted for a minute after the
applied spectrum reached 0 db and was followed by
another identical sine sweep. After that axis was
complete, the AR#1 team conducted a visual
inspection and connected to the experiment to
perform another set of aliveness, full-functionality,
and STP Interface tests. Once those were passed, the
mounting plate was unscrewed, spun, and re-attached
to the vibe table in order to test the Z-axis. This axis
followed the same pattern and passed its electrical
testing. Then the vibe table was disconnected from
the vibration drum and the drum was flipped 90
degrees so that a circular plate could be placed on
top. The mounting plate with AR#1 still attached
were placed on the new plate and screwed into
position (as shown below). Then the X-axis (launch
axis) was tested in the same way as the previous two
axes. At the conclusion of the vibe test, the
experiment again passed the electrical testing.

Nixon 11 32nd Annual AIAA/USU
Conference on Small Satellites
Figure 11: X-Axis Vibe Test Configuration
Vibe Conclusions
ACES RED #1 performed nominally during vibe
testing. Aliveness and functional tests were
successfully conducted before and after each axis.
Visual inspections after each axis showed that the
experiment did not receive any visible damage.
Preliminary analysis of the data as it was received
showed that the experiment had frequency levels that
would be nominal for launch. No excessive
deformations were seen during or after the test. The
ACES RED #1 modular structure and contained
hardware met NASA STP (Space Test Program)
vibration requirements for acceptance and integration
onto the STP-H6 payload pallet.
Overall Conclusions
With a completed and documented demonstration in
flight-like conditions (i.e. “a relevant environment”),
we have achieved TRL designation of 5 for the
hardware in this experiment. During the TVAC
testing, we saw an immediate benefit to our
reconfigurable design architecture. Fortunately,
through contingency planning and risk mitigation
strategies utilizing our modular and reconfigurable
design, we had alternatives in place during our testing
phase. We were able to swap the PicoZed 7030 with
the PicoZed 7020 which gave us significant science
data to support leveraging the Zynq FPGA in a space
environment. Although seemingly a negative result,
this allowed us to continue to progress the
experiment, by verifying the survival of the 7020 as
an alternative processor. The big success is that our
modular design has paid off allowing us to be able to
reconfigure during testing and continue on without
significant downtime. The modularity of the design
also allows us to leverage the same data bus
architecture on any given hardware provided it can be
interfaced leveraging our interface control.
Additionally, our tray-based design met the
workmanship level NASA requirements for launch.
The payload is currently undergoing integrated vibe
testing with the other experiments on the STP-H6
pallet and preliminary results are showing further
success.
Lessons Learned
Many strategies, approaches, and best practices from
this project have been gleaned that will be able to be
carried forward to the next iteration of the program.
Listing them all would be outside of the scope of this
paper, however, some of them include things like
leveraging a team that includes both contractors and
government employees working side-by-side in the
lab. This may be the single most valuable lesson to
carry forward for future programs. As compared to
the hands-off type approach of passing on
requirements to contractors and having them develop
a system in relative isolation ultimately leads to a

Nixon 12 32nd Annual AIAA/USU
Conference on Small Satellites
product that 1) does not meet requirements, 2) is
excessive in cost, and 3) cannot be completed in a
timely manner.
Leveraging industry standards and naming
conventions can save a significant amount of time
and can better refine processes and procedures.
Another lesson is that beginning communication for
integration early and continuing to discuss it often
can make for a much more seamless transition into
that phase of the project. Also leveraging early
prototypes, time permitting, can alleviate many
design issues seen too late in the process to mitigate
against.
Future Work
After having achieved this level of performance, the
next steps include continued testing of AR#1 to
ensure proper hardware and software integration to
the associated interfaces followed by an on-orbit
demonstration of the hardware. Additionally,
development of the ground station software as well as
any software updates to the flight hardware are still
planned prior to integrated testing with the Space
Test Program Houston office in the coming months.
The follow-on project will leverage the modular tray-
based design. Additionally, depending on the final
TRL achieved for other aspects of the design,
including flight computers and subsystems, those
may be utilized as well.
References
1. M. Nixon et al., “Army Cost Efficient Spaceflight
Research Experiments and Demonstrations Attitude
Determination Experiment,” in 31st Annual
AIAA/USU Conference on Small Satellites, 2017,
no. 31, August. Small Sat 2017 paper
2. “Technology Readiness Level Definitions.” Edited
by Thuy Mai, NASA PDFs, NASA, 28 Oct. 2012,
www.nasa.gov/pdf/458490main_TRL_Definitions.pd
f.
3. “MISC 3™ 3U Nanosatellite Bus Hardware
Revision: A.” CubeSat-Class Spacecraft Bus,
Pumpkin, Inc, Feb. 2014,
www.cubesatkit.com/docs/datasheet/DS_MISC_3_71
5-00553-A.pdf.
4. “3-Unit CubeSat Structure.” Innovative Solutions
In Space, ISIS, 2006, www.isispace.nl/product/3-
unit-cubesat-structure/.
5. “SM Cubesat Structures.” Solutions in Space
Application, SpaceMind, 2016,
www.npcspacemind.com/solutions/nanosatellite-
hardware/cubesat-structure/.
6. “Begin Your CubeSat Mission with the CubeSat
Kit™.” CubeSatKit, Pumpkin Incorporated, 2000,
www.cubesatkit.com/.
7. Cubesat Space Processor (CSP). Space Micro, 13
Mar. 2018,
www.spacemicro.com/assets/datasheets/digital/slices/
CSP.pdf.
8. PicoZed™ 7010/7020 SOM (System-On-Module)
Hardware User Guide. AVNET, 2018,
zedboard.org/sites/default/files/documentations/5282-
UG-PicoZed-7010_7020-v2_0.pdf
9. PicoZed™ 7Z015 / 7Z030 SOM (System-On-
Module) Hardware User Guide. AVNET, 2018,
zedboard.org/sites/default/files/documentations/5279-
UG-PicoZed-7015-7030-V2_0.pdf
10. “Receivers OEM628™.” HIGH
PERFORMANCE GNSS RECEIVER, NovAtel, 2016,
www.novatel.com/assets/Documents/Papers/OEM62
8.pdf.
11. Self Contained ADACS Units for CubeSats and
SmallSats. Adcole Maryland Aerospace,
www.adcolemai.com/adacs.