acetone (cas no. 67-64-1) vccep submission - … · appendix i acetone production in children...
TRANSCRIPT
ACETONE (CAS No. 67-64-1)
VCCEP SUBMISSION
American Chemistry Council Acetone Panel
Sponsors:
Celanese The Dow Chemical Company
The Goodyear Tire & Rubber Company Rohm and Haas Company
Shell Chemical LP Sunoco, Inc.
Exposure Consultant:
September 10, 2003
i
TABLE OF CONTENTS Page
Glossary of Terms ..................................................................................................................... iv
1. Executive Summary ........................................................................................................1
2. Basis for Inclusion of Acetone in VCCEP Pilot Program................................................11
2.1 Introduction........................................................................................................11 2.2 NHANES Data...................................................................................................11 2.3 Indoor Air Monitoring Data.................................................................................11
3. Previous Assessments..................................................................................................13
3.1 OECD SIDS Dossier and SIAR..........................................................................13 3.2 World Health Organization Environmental Health Criteria Document.................14 3.3 EPA EPCRA Review .........................................................................................14 3.4 Patty’s Toxicology..............................................................................................15 3.5 PBPK Modeling .................................................................................................15 3.6 ATSDR Toxicological Profile..............................................................................16 3.7 NTP Testing.......................................................................................................16 3.8 IRIS Assessment ...............................................................................................16 3.9 Derivation of Inhalation RfC and Oral RfD by Gentry et al..................................18
4. Regulatory Status..........................................................................................................19
5. Product Overview..........................................................................................................21
5.1 Production Processes........................................................................................21 5.2 Volume ..............................................................................................................21 5.3 Physical and Chemical Properties .....................................................................21 5.4 Uses ..................................................................................................................22 5.5 Releases to the Environment .............................................................................22
6. Natural Presence in the Human Body and Diet .............................................................23
7. Hazard Assessment ......................................................................................................24
7.1 Introduction........................................................................................................24 7.2 Acute Toxicity (Tier 1)........................................................................................26 7.3 Metabolism and Pharmacokinetics (Tier 2) ........................................................29 7.4 Gene Mutation and Cytogenetics (Tiers 1 and 2)...............................................34 7.5 Subchronic Studies (Tier 2) ...............................................................................37 7.6 Reproductive Toxicity (Tiers 1 and 2).................................................................39 7.7 Developmental Toxicity and Teratogenicity (Tier 2) ...........................................42 7.8 Immuntoxicity (Tier 2) ........................................................................................44 7.9 Carcinogenicity (Tier 3)......................................................................................44 7.10 Neurotoxicity (Tier 3) .........................................................................................47 7.11 Developmental Neurotoxicity (Tier 3).................................................................51 7.12 Human Studies and Experience.........................................................................51
ii
7.13 Other Information – Potentiation of Toxicity of Other Compounds......................54 7.14 Hazard Summary...............................................................................................54 7.15 Robust Summaries of Toxicology Studies..........................................................61 7.16 Selection of Health Benchmarks........................................................................61
8. Exposure Assessment...................................................................................................64
8.1 Methodology/ Scope of Assessment..................................................................64 8.2 Sources of Acetone Exposure............................................................................66 8.3 Uncertainties in the Exposure Assessment......................................................121 8.4 Summary of Dose Estimates ...........................................................................124
9. Risk Assessment.........................................................................................................125
9.1 Summary of Hazard Information and Relevant Health Benchmarks.................125 9.2 Chronic Hazard Evaluation ..............................................................................127 9.3 One-Day Dose Evaluation ...............................................................................131 9.4 Short Term Exposure Concentrations ..............................................................134 9.5 Potential for Unique Susceptibility of Children to Acetone Exposure................136 9.6 Occupational Maternal Exposures ...................................................................137 9.7 Discussion of Uncertainties..............................................................................137 9.8 Conclusions.....................................................................................................137
10. Data Needs Assessment .............................................................................................139
10.1 Hazard Information ..........................................................................................139 10.2 Exposure Information.......................................................................................139
iii
LIST OF APPENDICES
Appendix A OECD SIDS Dossier and SIAR for Acetone.
Appendix B Robust Summaries for Selected Studies on Acetone and Isopropanol.
Appendix C Patty’s Toxicology Acetone Chapter (Chapter 74) (Morgott 2001).
Appendix D Gentry, P.R., Covington, T.R., Andersen, M.A. and Clewell, H.J. (2003) “Application of a Physiologically-Based Pharmacokinetic Model for Reference Dose and Reference Concentration Estimation for Acetone,” accepted for publication in the Journal of Toxicology and Environmental Health.
Appendix E Dow Product Brochure, Acetone: The Versatile, High Solvency Intermediate.
Appendix F National Toxicology Program, Memo by Study Director regarding the decision not to conduct chronic studies on acetone, June 8, 1989.
Appendix G ATSDR Federal Register notices regarding chronic toxicity testing of acetone.
Appendix H Endogenous Production Derivation
Appendix I Acetone Production in Children
Appendix J Sensitivity Analysis
iv
GLOSSARY OF TERMS
µg Microgram ACGIH American Conference of Governmental Industrial Hygienists ATSDR Agency for Toxic Substances and Disease Registry AUC Area Under Blood Concentration/Time Curve BMD Benchmark Dose CAA Clean Air Act CERCLA Comprehensive Environmental Response, Compensation and
Liability Act CNS Central Nervous System CWA Clean Water Act DEP Department of Environmental Protection EHC Environmental Health Criteria EPCRA Emergency Planning and Community Right to Know Act GRAS Generally Recognized as Safe HAP Hazardous Air Pollutant IPCS International Programme on Chemical Safety IRIS Integrated Risk Information System KD Ketogenic Diet kg Kilogram mg Milligram MRL Minimal Risk Level NCEA National Center for Environmental Assessment NED No Effect Dose NHANES National Health and Nutrition Examination Survey NOAEL No Observed Adverse Effect Level NTP National Toxicology Program ODS Ozone Depleting Substance OECD Organization of Economic Cooperation and Development OSHA Occupational Safety and Health Administration ppm Parts Per Million RCRA Resource Conservation and Recovery Act RfC Inhalation Reference Concentration RfD Oral Reference Dose SCAQMD (California) South Coast Air Quality Management District SIAR Screening Information Assessment Report SIDS Screening Information Data Set STEL Short-Term Exposure Limit TLV Threshold Limit Value TSCA Toxic Substances Control Act TWA Time-Weighted Average VOC Volatile Organic Compound VCCEP Voluntary Children’s Chemical Evaluation Program WHO World Health Organization

1
1. Executive Summary
Introduction
The sponsors of acetone have compiled the information in this submission to meet the requirements of the Voluntary Children’s Chemical Evaluation Program (VCCEP). 65 Fed. Reg. 81,700 (December 26, 2000). Consistent with the Pilot Program announcement, this submission includes a hazard assessment, exposure assessment, risk assessment and data needs assessment. Background information also is provided concerning the current regulatory status of acetone, recent agency assessments, recent peer-reviewed compilations of relevant hazard information, and other topics of interest. The biomonitoring data and indoor air monitoring data that provided the basis for including acetone in the Program also are discussed and put into context of relevant health effects information.
Acetone is unusual among commercial chemicals, in that it is a normal by-product of fatty acid metabolism and is naturally present throughout the human body at measurable levels. Physiological concentrations increase as energy requirements increase (e.g., during exercise, dieting or pregnancy). Acetone also has been extensively studied, and is generally recognized to have low acute and chronic toxicity. All toxicity studies listed in the Pilot Announcement (for all tiers of the program) have been conducted either with acetone or its metabolic precursor, isopropanol.
The Executive Summary provides an overview of the information presented in each section of the submission. Citations are not provided in the Executive Summary, but are found in the main text.
Basis for VCCEP Listing
Acetone was selected for the VCCEP Pilot Program for three reasons: (1) hazard data meeting the requirements of Tier 1 of the VCCEP Pilot are available from an OECD SIDS Screening Information Assessment Report (SIAR); (2) acetone has been reported in human blood in the NHANES study; and (3) acetone has been detected in indoor air. In fact, the available toxicity data for acetone far exceeds the Tier I VCCEP requirements. The blood level findings cited in NHANES are unremarkable, however, as they are well within the range found in normal, healthy humans. The indoor air monitoring data also is unremarkable; acetone has been found in indoor air at an average concentration of 8 ppb, which is far below levels that might be expected to pose any health concerns.
Recent Regulatory Assessments and Other Peer-Reviewed Assessments
Acetone has been the subject of several recent assessments by regulatory agencies or in peer-reviewed publications. These assessments include:
OECD SIDS Dossier and SIAR (1999). The SIDS Initial Assessment Report (SIAR) provides a comprehensive summary of relevant hazard information and concludes that acetone has been “well-studied” and its “health hazards are slight.” Acetone was determined to be “a low priority for further work.” The United States of America was the sponsoring country, and EPA was the U.S. representative to the Organization of Economic Cooperation and Development (OECD).
World Health Organization Environmental Health Criteria Document (1999). The WHO International Programme on Chemical Safety (IPCS) completed an Environmental Health
2
Criteria (EHC) document for acetone in 1999. The initial draft was prepared by D.J. Reisman, U.S. EPA Office of Research and Development, who served as one of two co-rapporteurs. A panel of independent experts worked on the assessment, which includes a chronic guidance value (analogous to an oral reference dose) of 9.0 mg/kg-day.
EPA EPCRA Delisting (1995). EPA has removed acetone from the list of “toxic chemicals” maintained under Section 313 of the Emergency Planning and Community Right to Know Act (EPCRA). In making that decision, EPA conducted an extensive review of the available toxicity data on acetone and found that acetone “exhibits acute toxicity only at levels that greatly exceed releases and resultant exposures,” and further that acetone “exhibits low toxicity in chronic studies.”
Patty’s Toxicology (2001). The Acetone Chapter in Patty’s Toxicology consists of 81 pages and includes 697 references. Extensive information pertaining to metabolism, toxicokinetics and normal endogenous production is presented, along with thorough discussions of animal and human data pertaining to the various toxicity endpoints of concern to the VCCEP.
ATSDR Toxicological Profile (1994). The Agency for Toxic Substances and Disease Registry toxicological profile of acetone includes several minimal risk levels (MRLs), defined as an exposure likely to be without an appreciable risk of adverse health effects (non-cancer) for the general population. These MRLs include: 26 ppm for inhalation exposures up to 14 days; 13 ppm for inhalation exposures from 15 to 364 days; the same value of 13 ppm for inhalation exposures of 365 days or more; and 2 mg/kg-day for oral exposures from 15 to 364 days.
NTP Testing. The National Toxicology Program (NTP) conducted 13-week drinking water studies of acetone at concentrations up to 5.0 percent for male and female rats and female mice and up to 2.0 percent for male mice. Minimally toxic concentrations of acetone were estimated to be 20,000 ppm (1700 mg/kg-day) for male rats, 20,000 ppm (4858 mg/kg-day) for male mice, and 50,000 ppm (11,298 mg/kg-day) for female mice. No toxic effects were identified for female rats at the highest tested concentration of 50,000 ppm (3100 mg/kg-day). After completing these studies, NTP recommended against conducting chronic toxicity or carcinogenicity studies of acetone because “the prechronic studies only demonstrated a very mild toxic response at very high doses in rodents,” and because of “the absence of any evidence supporting the carcinogenic potential for acetone.”
IRIS Assessment (2003). EPA’s National Center for Environmental Assessment (NCEA) posted an updated IRIS summary and Toxicological Review of Acetone on its website on July 31, 2003. The documents include an oral reference dose of 0.9 mg/kg-day, based on a NOAEL of 900 mg/kg-day for male rats reported in the 90-day studies in drinking water sponsored by NTP, and total uncertainty factors of 1000. The oral RfD is more than 10-fold below estimated normal daily endogenous production in healthy persons, and in fact is below levels of exposure nursing infants are likely to receive from the natural presence of acetone in mother’s milk (assuming no exogenous exposure for the mother). No inhalation reference concentration was proposed.
Derivation of Inhalation Reference Concentration (RfC) and Oral Reference Dose (RfD) by Gentry et al. (2003 in press). Because EPA concluded in its draft IRIS assessment that the data were insufficient to derive an inhalation RfC – even though inhalation is the most relevant route of exposure – the Panel commissioned Drs. Harvey Clewell, Robinan Gentry and their colleagues to use a pharmacokinetic model and EPA RfC/RfD methodology to derive an oral RfD and inhalation RfC for acetone. Gentry et al. calculated two oral RfD values of 8.7 and 16.0

3
mg/kg-day. These values are similar to the guidance value presented in the IPCS EHC document (9.0 mg/kg-day). The inhalation RfC of 29 ppm is similar to but somewhat higher than the intermediate and chronic inhalation MRL values derived by ATSDR (13 ppm).
Regulatory Status
Acetone must be handled carefully because of its flammability, relatively high vapor pressure, and the dangers of fire and explosion. However, acetone generally is not regulated under environmental, health and safety statutes based on toxicity concerns. The following table summarizes acetone’s treatment under various environmental, health and safety statutes.
Acetone Regulatory Status
Regulation Acetone Status CERCLA Hazardous Substances Listed because it is a RCRA hazardous waste. RQ
= 5,000 lbs. (highest category) RCRA Listed Wastes Included in F003 wastes (spent solvents) and listed
as a “U” waste (U002) based solely on ignitability RCRA Toxic Constituents (App. VIII) Not listed. EPCRA Extremely Hazardous Substances Not listed. EPCRA Toxic Release Inventory Delisted in 1995. CAA Hazardous Air Pollutants Not listed. CAA Volatile Organic Compounds Exempted from regulation as a VOC in 1995. CWA Priority Pollutant List Not listed. OSHA Z-Tables (Air Contaminants Standard) Permissible Exposure Limit (PEL) is 1,000 ppm (8-
hour TWA). ACGIH TLVs (non-regulatory) Recommended exposure limits are 500 ppm (8-
hour TWA) and 750 ppm (15-minute STEL) California Air Resources Board Toxics List Removed in 1995. Acetone is also listed as a component in food additives and food packaging and rated as a GRAS (Generally Recognized as Safe) substance at concentrations ranging from 5 to 8 mg/L.
When EPA exempted acetone from regulation as a volatile organic compound (VOC) in 1995, EPA stated that this exemption would “contribute to the achievement of several important environmental goals and would support EPA’s pollution prevention efforts.” 60 Fed. Reg. 31,634 (June 16, 1995). EPA noted that acetone could be used “as a substitute for several compounds that are listed as hazardous air pollutants (HAP) under section 112 of the [Clean Air] Act,” and “as a substitute for ozone depleting substances (ODSs) which are active in depleting the stratospheric ozone layer.”
Production, Use and Release to the Environment
Acetone is manufactured primarily as a co-product of phenol production via cumene peroxidation. The processes and equipment for manufacture, transfer and storage are all continuous and enclosed. U.S. production of acetone was approximately 4 billion pounds in 2002.
Acetone is used in surface coatings, cleaning fluids, pharmaceutical applications, adhesives and a variety of other products, and is sold in small containers (e.g., one liter) in many hardware stores. Acetone also is used in the extraction of fats, oils, waxes and resins from natural products, as a denaturant for ethyl alcohol, and as acetylene absorbent. Acetone also is used
4
as a solvent in the manufacture of cellulose acetate fibers and as a chemical intermediate in the manufacture of other chemicals such as methyl methacrylate, methyl isobutyl ketone, methyl isobutyl carbinol, hexylene glycol, and isophorone.
In 1993, the last year for which data on environmental releases is available under EPCRA section 313 (before acetone was removed from the list of covered chemicals), total reported acetone releases to the environment were 134 million pounds, most of which was released to air. This figure is small compared to other sources of acetone in the environment. About 97% of the acetone in ambient air comes from natural sources (vegetative releases, forest fires and other natural sources) or the photo-oxidation of alkanes and alkenes.
Hazard Assessment
The toxicological effects of acetone have been well-studied. All of the toxicity tests listed in Tier 1, Tier 2 and Tier 3 of the Pilot Announcement have been conducted for acetone or its metabolic precursor isopropanol, and no endpoints raise specific toxicological concerns that warrant further investigation.
Acute Toxicity. Numerous oral, inhalation, dermal and intraperitoneal acute toxicity tests in multiple species demonstrate that acetone has very low acute toxicity.
Metabolism. The metabolism and pharmacokinetics of acetone have been extensively studied. Isopropanol is readily and quantitatively metabolized to acetone, so that some toxicological studies of isopropanol can be used to address data gaps, or to supplement information, for acetone. In addition, Clewell et al. (2001) have published a PBPK model that documents quantitatively the uptake and metabolism of isopropanol and acetone in rats and humans. The SIAR notes that the “ability of humans to naturally produce and dispose of acetone may to a large degree explain its relatively low toxicity following external exposure to moderate amounts of the vapor or liquid.” Metabolism studies show that increases in blood acetone levels are quickly controlled by specific metabolic enzymes that are capable of efficiently handling the excess production; this fact pertains to exogenous exposures as well as fluctuations in endogenous production.
Systemic Toxicity. As discussed above, the National Toxicology Program conducted a 13-week subchronic toxicity test of acetone in rats and mice that found such minimal toxicity at such high doses that the NTP recommended against conducting chronic toxicity or carcinogenicity studies of acetone. The NOAEL of 900 mg/kg-day for male rats demonstrates the low systemic toxicity of acetone. No toxic effects were observed in female rats at 3100 mg/kg-day. NOAELs for male and female mice were 2300 and 5900 mg/kg-day, respectively.
Developmental and Reproductive Toxicity. Acetone’s potential to cause developmental toxicity has been evaluated in rats and mice. High doses of acetone (6600 ppm in mice; 11,000 ppm in rats) caused reductions in fetal body weight, but there was no evidence of teratogenicity. The NOAEL in each species was 2200 ppm.
A two-generation reproductive toxicity test of isopropanol, the metabolic precursor of acetone, also showed only minimal effects at high doses. Supporting reproductive toxicity studies of acetone confirm that acetone has low potential to cause reproductive effects. As already noted, acetone is produced endogenously, and normal healthy activities (e.g., exercise, diet) can cause endogenous production to increase significantly in healthy individuals. Additionally, pregnant women, nursing mothers and children all have higher blood levels of acetone naturally

5
due to their higher energy requirements. The medical community has begun using a ketogenic diet as a means to reduce the frequency and severity of epileptic attacks in infants and children with recalcitrant refractory epilepsy.
Immunotoxicity. The Panel recently sponsored a guideline immunotoxicity test which showed no immunological effects.
Genotoxicity. Acetone has been tested in more than two dozen in vitro and in vivo assays. These studies indicate that acetone is not genotoxic. In fact, acetone has been used as a vehicle for testing water insoluble substances in various mutagenicity assays.
Carcinogenicity. EPA in 1995 concluded, “There is currently no evidence to suggest a concern for carcinogenicity.” (EPCRA Review, described in Section 3.3). NTP scientists have recommended against chronic toxicity/carcinogenicity testing of acetone because “the prechronic studies only demonstrated a very mild toxic response at very high doses in rodents,” and because of “the absence of any evidence supporting the carcinogenic potential of acetone.” (See Appendix F.) These previous assessments are supported by: (1) numerous assays demonstrating a lack of mutagenic activity or cytogenetic toxicity; (2) negative chronic dermal studies using acetone; and (3) a negative chronic toxicity/carcinogencity study on isopropanol, the metabolic precursor of acetone, in rats and mice. Thus, the scientific evidence does not support a concern for carcinogenicity for acetone.
Neurotoxicity and Developmental Neurotoxicity. The neurotoxic potential of both acetone and isopropanol, the metabolic precursor of acetone, have been extensively studied. These studies demonstrate that although exposure to high doses of acetone may cause transient central nervous system effects, acetone is not a neurotoxicant. A guideline developmental neurotoxicity study has been conducted with isopropanol, and no developmental neurotoxic effects were identified, even at the highest dose tested.
In sum, the scientific data on acetone and isopropanol strongly support what the Acetone SIAR concluded: acetone has been “well-studied,” its “health hazards are slight” and the “hallmark of animal studies with acetone is the extremely high vapor concentrations of long exposure duration needed to produce an adverse effect.” (SIAR, pp. 1, 25, 31).
Selection of Health Benchmarks
The key health benchmarks for this risk assessment are the RfD and RfC values derived by Gentry, et al. (2003, in press). These values are intended to represent exposures that can be repeated daily for a lifetime without appreciable risk to the general population, including sensitive subgroups. The use of the PBPK model facilitated and improved interspecies and route-to-route extrapolation.
The lower RfD value derived by Gentry et al. (8.7 mg/kg-day) will be used as the principal chronic health benchmark for this risk assessment. This RfD value is below normal endogenous production of acetone in healthy individuals, and well below endogenous production in pregnant women, nursing mothers and children. Where appropriate, comparisons also will be made to the RfC of 29 ppm. Single day exposures, such as result from a single use of a consumer product, will be compared to normal endogenous production.

6
Exposure Assessment
EPA has requested that exposure information be submitted to determine the extent of children's exposure to acetone. The types of exposure information needed for the assessment include the identification and characterization of the population groups exposed, sources of the exposure as well as frequencies, levels, and routes of exposure. A child-centered approach was used to define realistic exposure scenarios for children’s interaction with acetone sources including endogenous levels, environmental (ambient) sources, and use of consumer products. Acetone exposure estimates have been made for 4 age ranges: infants less than 1 year, 1 to 5 years old, 6 to 13 years old, and 14 to 18 years old. These age ranges were selected because of the significant activity pattern differences which occur among these groupings (i.e., breastfeeding, school attendance, etc.)
Virtually every tissue and organ in the human body contains measurable levels of acetone. Daily endogenous production for children has been estimated based on blood levels reported in the published literature. Both mean and maximum levels have been estimated for each range as follows:
Endogenous Acetone Production Rates in Children
Acetone Production (mg/kg-day) Age Group
Mean Maximum 0 to 12 Months 121 387 1 to 5 Years 94 135 6 to 13 Years 72 104 14 to 18 Years 55 83
Acetone occurs naturally in a wide variety of foods such as onions, grapes, cauliflower, tomatoes, milk, cheese, beans, and peas (SIDS, 1999). Acetone is present in raw cow’s milk as a result of the animal’s normal metabolism. The levels of acetone in the milk of healthy cows range from 0 to 0.2 millimoles (0 to 11.6 mg/l). Thus, all children have acetone exposure via natural sources in the diet. Exposure estimates from dietary sources were quantified and annual average daily doses range from 0.032 to 0.16 mg/kg-day. These results indicated dietary exposures are at least 500 fold lower than daily endogenous production and at least 50 times lower than the RfD derived by Gentry et al. of 8.7 mg/kg-day.
Because acetone had been detected in human milk, infants’ exposures to acetone via this pathway were considered. No published estimates of acetone concentration were identified in the peer-reviewed literature, thus exposure concentrations were estimated based on acetone blood levels in the mother. For mothers occupationally exposed to acetone, average blood levels were estimated using the PBPK model for acetone, assuming the mother was exposed at the ACGIH TLV of 500 ppm during every working day. The annual average daily dose from the human milk pathway was 1.5 mg/kg-day and 7.9 mg/kg-day for infants of non-occupational and occupationally-exposed mothers, respectively. Both of these doses are less than the RfD of 8.7 mg/kg-day and on a daily basis the dose is at least 10-fold lower than the infant’s average daily endogenous production.
Ambient environmental exposures to acetone can result from exposure to the ambient air and drinking water. Acetone is emitted into the atmosphere from both natural and anthropogenic sources. Acetone levels reported in the outdoor ambient air have ranged from 3 ppb (7.1
7
µg/m3) in rural areas to approximately 7 ppb (16.38 µg/m3) in urban areas (ATSDR, 1994). Indoor air levels are similar. Acetone is rarely detected in tap water, although it has been detected at levels ranging from 2 – 7 µg/L in residential well water. Exposures from these sources are negligible, with ambient air concentrations nearly 10,000 fold below the RfC of 29 ppm derived by Gentry et al. Drinking water annual average daily doses ranged from 3.0 E-05 mg/kg-day to 9.7 E-05 mg/kg-day, which indicated exposure at least 290,000 times lower than the RfD of 8.7 mg/kg-day.
Children’s exposures from dietary sources, the ambient environment and human milk have been aggregated. Doses range from 0.04 mg/kg-day for the 14-18 year old to 8 mg/kg-day for the nursing infant of an occupationally-exposed mother.
In addition to ambient exposures via the typical diet, air and water, children may be exposed to acetone from exposure to consumer products. A wide variety of consumer products contain acetone; however, the majority of those products contain acetone at less than 1% by weight and therefore are unlikely to be important sources of exposure. Thus, this assessment has focused on those consumer products with greater than 1% acetone by weight. Each of the products was then considered in the context of how and where they would be used and the likelihood of children being exposed during their use. Based on the acetone weight content and the likelihood of use by or in the presence of children, paint products, nail polish remover and pure solvent were evaluated for acetone exposure in the following four scenarios:
• residential pure solvent use as an acrylic nail tip remover;
• residential nail polish remover use,
• residential spray paint, and
• residential pure solvent use as a spot remover.
For the nail polish remover scenario, it was assumed that children as young as 6 years old might use the product. For all other scenarios, infants and children younger than 13 were assumed to be in the home while the product was used, but only the teenager and adult were assumed to be the product users. Typical and upper bound exposures have been defined by the typical and upper bound amount of the product likely to be used in each scenario.
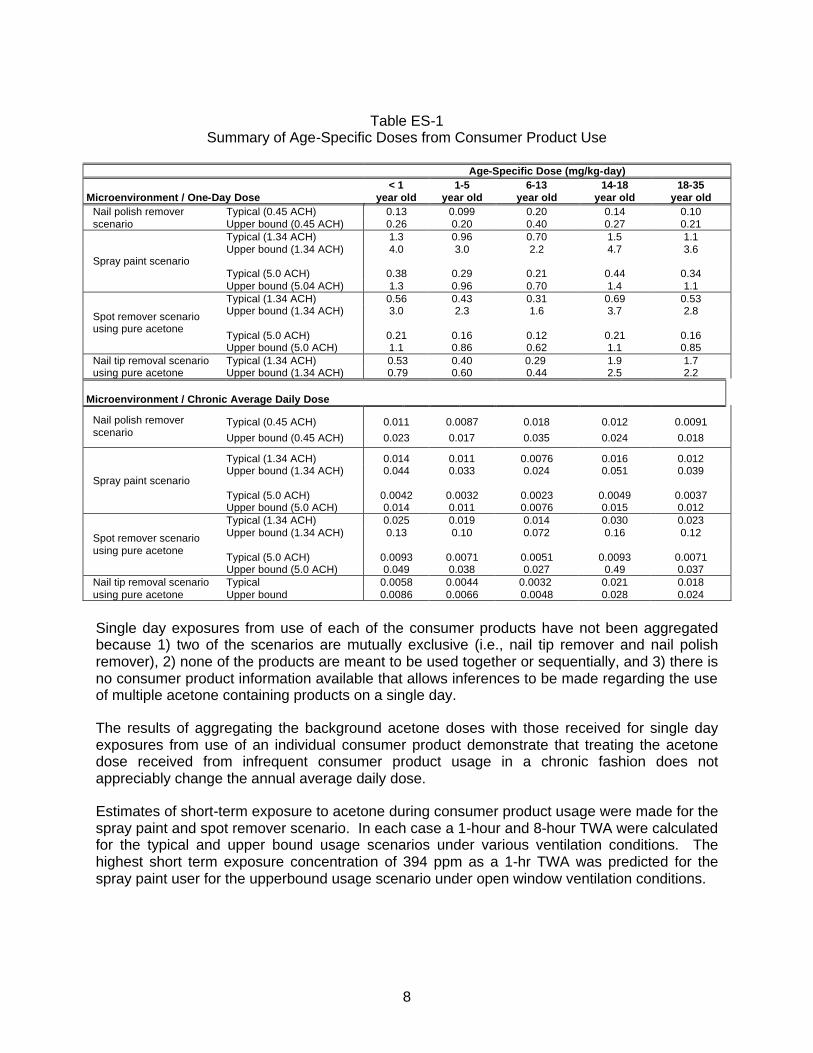
Age-specific one-day and annual average daily doses (ADD) have been quantified for children’s exposures to consumer products. In all scenarios, the teenage product user had the highest dose. The estimated doses are presented on Table ES-1 below:
8
Table ES-1
Summary of Age-Specific Doses from Consumer Product Use
Age-Specific Dose (mg/kg-day) Microenvironment / One-Day Dose
< 1 year old
1-5 year old
6-13 year old
14-18 year old
18-35 year old
Typical (0.45 ACH) 0.13 0.099 0.20 0.14 0.10 Nail polish remover scenario Upper bound (0.45 ACH) 0.26 0.20 0.40 0.27 0.21
Typical (1.34 ACH) 1.3 0.96 0.70 1.5 1.1 Upper bound (1.34 ACH)
4.0 3.0 2.2 4.7 3.6
Typical (5.0 ACH) 0.38 0.29 0.21 0.44 0.34 Spray paint scenario
Upper bound (5.04 ACH) 1.3 0.96 0.70 1.4 1.1 Typical (1.34 ACH) 0.56 0.43 0.31 0.69 0.53 Upper bound (1.34 ACH)
3.0 2.3 1.6 3.7 2.8
Typical (5.0 ACH) 0.21 0.16 0.12 0.21 0.16
Spot remover scenario using pure acetone
Upper bound (5.0 ACH) 1.1 0.86 0.62 1.1 0.85 Typical (1.34 ACH) 0.53 0.40 0.29 1.9 1.7 Nail tip removal scenario
using pure acetone Upper bound (1.34 ACH) 0.79 0.60 0.44 2.5 2.2 Microenvironment / Chronic Average Daily Dose
Typical (0.45 ACH) 0.011 0.0087 0.018 0.012 0.0091 Nail polish remover scenario Upper bound (0.45 ACH) 0.023 0.017 0.035 0.024 0.018
Typical (1.34 ACH) 0.014 0.011 0.0076 0.016 0.012 Upper bound (1.34 ACH)
0.044 0.033 0.024 0.051 0.039
Typical (5.0 ACH) 0.0042 0.0032 0.0023 0.0049 0.0037 Spray paint scenario
Upper bound (5.0 ACH) 0.014 0.011 0.0076 0.015 0.012 Typical (1.34 ACH) 0.025 0.019 0.014 0.030 0.023 Upper bound (1.34 ACH)
0.13 0.10 0.072 0.16 0.12
Typical (5.0 ACH) 0.0093 0.0071 0.0051 0.0093 0.0071
Spot remover scenario using pure acetone
Upper bound (5.0 ACH) 0.049 0.038 0.027 0.49 0.037 Typical 0.0058 0.0044 0.0032 0.021 0.018 Nail tip removal scenario
using pure acetone Upper bound 0.0086 0.0066 0.0048 0.028 0.024
Single day exposures from use of each of the consumer products have not been aggregated because 1) two of the scenarios are mutually exclusive (i.e., nail tip remover and nail polish remover), 2) none of the products are meant to be used together or sequentially, and 3) there is no consumer product information available that allows inferences to be made regarding the use of multiple acetone containing products on a single day.
The results of aggregating the background acetone doses with those received for single day exposures from use of an individual consumer product demonstrate that treating the acetone dose received from infrequent consumer product usage in a chronic fashion does not appreciably change the annual average daily dose.
Estimates of short-term exposure to acetone during consumer product usage were made for the spray paint and spot remover scenario. In each case a 1-hour and 8-hour TWA were calculated for the typical and upper bound usage scenarios under various ventilation conditions. The highest short term exposure concentration of 394 ppm as a 1-hr TWA was predicted for the spray paint user for the upperbound usage scenario under open window ventilation conditions.
9
Risk Assessment
Risk assessment involves the integration of the hazard assessment and the exposure assessment to provide numerical estimates of risk. Risks from both chronic exposures and one-day exogenous exposures have been characterized.
Chronic risks were characterized using EPA’s conventional hazard index approach for non-carcinogens. Using this risk paradigm, aggregated ambient environmental and dietary (i.e., background) annual average daily doses were compared to the RfD of 8.7 mg/kg-day derived by Gentry et al. Hazard indices ranged from 0.004 to 0.9, thus indicating no significant health risks are associated with the children’s exposures. Additionally, when exposures from the individual consumer product scenarios were aggregated with background doses, hazard indices were still less than 1 for all age ranges.
Health risks from one-day doses were evaluated by comparing them to daily endogenous production of acetone. The single day exposures received from typical exogenous acetone exposure from the use of consumer products in the home are 1 to 3 orders of magnitude lower than endogenous doses, and upper bound exogenous doses are 1 to 2 orders of magnitude lower than endogenous doses. Thus, single day exposure to exogenous acetone from ambient and/or microenvironment exposures will not substantially change the endogenous levels.
Short-term exposure concentrations to which children may be exposed during use of consumer products also were assessed by comparing time weighted air concentrations for two exposure durations (1-hour and 8-hours) to the Draft Acute Exposure Guideline Levels (AEGLs) for acetone, which are based on potential irritation. The only instances in which the AEGL for acetone may be exceeded are the 1-hr TWAs predicted for the upper bound exposure of the spray paint and spot remover users when mechanical ventilation is not employed. Thus, under typical exposure conditions and when using adequate ventilation under upper bound use conditions, acetone air concentrations are expected to be below levels at which slight irritation symptoms may occur, and well below levels at which more significant irritation would be expected.
The available data do not indicate that children are more susceptible to acetone exposures than adults. For example, a ketogenic diet – resulting in dramatically higher acetone blood concentrations than in untreated children – has been used effectively to treat children with refractory epilepsy with no apparent ill effects. Further, because of their higher energy requirements, children have higher endogenous acetone production than most adults – and the younger the child, the higher the expected endogenous production. These data indicate that children are not uniquely susceptible to acetone exposure. Moreover, potential exposures modeled in this assessment would have little or no impact on acetone blood levels in children, and all exogenous exposures are small by comparison to the exposures associated with the ketogenic diet.
In conclusion, the hazard and exposure assessments demonstrate the following:
• Endogenously produced acetone in children is the dominant source of acetone exposure, resulting in more than 90% of the total acetone exposure;
• Dietary exposure from acetone’s natural presence in many food items is likely the second largest source of acetone exposure for all children except those nursing from occupationally-exposed mothers. For the latter group, acetone from mother’s milk is the

10
second largest source of acetone exposure, although even that exposure represents only 10 percent of typical endogenous production, and only about 3 percent of the upper bound estimate of normal endogenous production in infants.
• Very low acetone exposures are received from the ambient sources of exposure, including ambient air and water, with aggregated doses far below the RfD.
• Inhalation doses from acetone-containing consumer products that are used in the presence of or by children do not result in exceedances of the RfD of 8.7 mg/kg-day derived by Gentry et al., including when combined with background ambient doses, and single day doses from use of these products are one to two orders of magnitude less than the daily endogenous levels.
• Short term air concentrations of acetone to which children may be exposed during use of various consumer products are not expected to exceed draft AEGL-1 values proposed by the USEPA except under conditions where adequate ventilation is not used; and
• The quantitative risk characterization indicates that reasonably anticipated children’s exposures to acetone from the ambient background environment and consumer products are unlikely to pose significant health risks.
Data Needs Assessment
Hazard Information. All Tier 1, Tier 2 and Tier 3 studies specified in the VCCEP announcement have been conducted for acetone or its metabolic precursor, isopropanol. The SIAR concludes that acetone has been “well-studied” and is a “low priority” for further work. The VCCEP sponsors of acetone agree.
Exposure Information. For a compound like acetone, additional exposure assessment work is always possible. The VCCEP sponsors believe, however, that the information presented in this document is adequate to demonstrate that reasonably anticipated exposures to acetone are not likely to present significant health risks to children. Accordingly, the VCCEP sponsors believe additional exposure assessment work also should be a low priority, and is not necessary to meet the objectives of the VCCEP program.
11
2. Basis for Inclusion of Acetone in VCCEP Pilot Program
2.1 Introduction
In selecting compounds for the VCCEP Pilot Program, EPA relied on biomonitoring and environmental monitoring databases that it considered relevant to assessing the potential for children’s exposure. See VCCEP Federal Register Notice (Dec. 26, 2000), at III.Q. Availability of hazard data was an additional factor that influenced chemical selection decisions; EPA stated that it wanted to select chemicals for which Tier I hazard data was available. Acetone was selected for three reasons: (1) an Organization for Economic Cooperation and Development (OECD) SIDS Screening Information Assessment Report (SIAR) is available; (2) acetone has been reported in human blood in the NHANES study; and (3) acetone has been detected in indoor air. See Pilot Announcement, Table 1. As described later in this document, the available toxicity data for acetone far exceeds Tier I VCCEP requirements, and in fact satisfies Tier 2 and Tier 3 requirements as well. The availability of extensive hazard information facilitates evaluation of acetone in the Pilot Program. As described in the following sections, however, the blood level data and indoor air monitoring data are unremarkable and should not be considered indicative of a likely concern.
2.2 NHANES Data
Acetone reportedly was detected in greater than 75 percent of 1062 blood samples at a median concentration of 1.8 ppm. See VCCEP Pilot Announcement, Table 2. The mean concentration reportedly was 3.1 ppm, and the 95th percentile was 6 ppm. Ashley et al. (1994). These findings are not surprising because acetone is naturally present in virtually all tissues of the human body.
As described in greater detail in section 6, acetone is produced naturally in the liver following the utilization of stored fats and lipids as a source of energy. Healthy adult humans have endogenous acetone concentrations up to 10 mg/L (10 ppm), while children and adolescents, because of their higher energy expenditure, typically have higher levels of acetone in their blood. Blood levels can vary substantially as a result of normal activities such as exercise and dieting. The blood level findings cited in NHANES are well within the range that is present in healthy humans.
EPA considered biomonitoring data as providing a strong rationale for identifying a chemical for this VCCEP Pilot Program. See VCCEP Pilot Announcement, section III.B. In the case of acetone, however, measurable blood levels are expected, and the levels reported do not provide a basis for concern.
2.3 Indoor Air Monitoring Data
EPA cited one study that reported an average acetone concentration of 8 ppb based on 4 indoor air samples (Shah and Singh, 1988). Another study included in EPA’s list of citations also reports concentrations of acetone (Brown et al., 1994). However, the latter report was a survey of other literature and the values reported for acetone are identical to the values reported in Shah and Singh, leading to the conclusion that this study merely summarized the results of the Shah and Singh analysis. When evaluating the indoor air data, one must keep in mind that humans exhale acetone with every breath. The SIAR concludes that acetone does not cause even transient central nervous system (CNS) effects in humans until exposures reach over 2,000 mg/m3 – or more than 5 orders of magnitude higher than the reported indoor air
12
concentrations. (p. 30) Further, the reported indoor air levels are more than a thousand-fold below the inhalation RfC derived by Gentry et al. (29 ppm) and the chronic inhalation MRL calculated by ATSDR (13 ppm), both of which are intended to represent a daily exposure that may be continued for a lifetime without appreciable risk of health effects (see sections 3.5 and 3.8). The acetone VCCEP sponsors are not aware of any data that would suggest that indoor air levels of acetone in the low ppb range present a health concern.
In summary, the available biomonitoring data and environmental monitoring data for acetone are not indicative of significant human exposures and do not provide a basis for concern for children’s health. Thus, while the robustness of the available hazard data facilitates evaluation of acetone in the VCCEP Pilot, the biomonitoring data and indoor air data should not be viewed as presumptively indicating a need for further testing or any risk management actions.

13
3. Previous Assessments
Acetone has been the subject of several recent assessments by government agencies and in peer-reviewed publications. While none focused exclusively on children, they nonetheless are relevant. This section provides a brief overview of some of the more comprehensive reviews, and provides electronic links where available.
3.1 OECD SIDS Dossier and SIAR
Acetone has been sponsored through the “Screening Information Data Set” (SIDS) process. The SIAR concludes that acetone has been “well-studied” and its “health hazards are slight.” Acetone was determined to be a “low priority” for further work. Copies of the SIDS Dossier and SIAR are included with this VCCEP submission in Appendix A. The Dossier and SIAR include summaries of key studies. (Expanded robust summaries of selected studies also are included in Appendix B.) The following paragraphs provide an overview of the OECD SIDS assessment process, and summarize key conclusions for acetone.
The SIDS process is part of an international program for collecting and sharing information on certain high production volume chemicals. The SIDS program is sponsored by the OECD. Once a chemical has been selected for SIDS, a sponsor country collects available data and determines if additional testing is needed to complete the SIDS data set. The SIDS data set includes information on chemical identity, physical characteristics, sources and levels of exposure, environmental fate and pathways, and ecotoxicological and toxicological data. Once a SIDS data set is completed, a SIDS Initial Assessment Report (SIAR) is prepared and discussed at an OECD meeting. The SIAR includes a detailed assessment of all relevant hazard and exposure information, not just the base SIDS data set. Based on the information in the SIAR, OECD makes a determination regarding the need for additional work. EPA represents the United States in the SIDS program.
The United States was the sponsor country for acetone. As part of the SIDS process, the American Chemistry Council Acetone Panel sponsored preparation of a SIDS Dossier summarizing the available human health and environmental toxicity data on acetone, as well as information on manufacturing, production and use, metabolism, and environmental fate and degradation. EPA reviewed and commented on this document, which then formed the basis for the acetone SIAR. The SIAR was approved by EPA, and EPA sponsored the SIAR to the OECD. As of July 1, 1999, the SIAR had been approved by the full OECD as well.
Overall, the EPA-approved SIAR concludes, “The human health and environmental effects of acetone have both been well studied.” (p. 31) The SIAR reports that the most significant health effects of acetone are eye irritation and “an acute effect on the central nervous system,” but notes that “high exposures are required and health hazards are slight,” making acetone “a low priority for further work.” (p. 2)
According to the SIAR, the “hallmark of animal studies with acetone is the extremely high vapor concentrations of long exposure duration needed to produce an adverse effect.” (p. 25) The SIAR describes acetone as an “extremely weak sensory irritant,” and notes that “[v]apor concentrations in excess of 24,000 mg/m3 are generally required to elicit any sign of acute acetone intoxication in laboratory animals.” (pp. 24, 25) For transient effects on the nervous system, the SIAR finds that “[c]linical case studies, controlled human volunteer studies, animal research and occupational field evaluations all indicate that the NOAEL for this effect is 2,375 mg/m3 [approximately 1000 ppm] or greater.” (p. 3) The SIAR finds that acetone has “low
14
potential for systemic toxicity” and that acetone “showed minimal reproductive and developmental effects in animals exposed either by inhalation or via drinking water.” (pp. 26-27) From lifetime dermal studies in mice and other relevant information, the SIAR concludes that acetone is not likely to be carcinogenic. (p. 28) Similarly, the SIAR reports, “Acetone has been repeatedly tested in a variety of prokaryotic and eukaryotic test systems without causing genotoxic effects.” (p. 28)
The SIAR also includes exposure information. As a preliminary matter, the SIAR concludes, “Vegetative releases, forest fires, and other natural events account for nearly half (47%) of the estimated annual emissions of acetone, with another 50% resulting from the tropospheric photooxidation of propane and other alkanes and alkenes.” (p. 9) The SIAR estimates that the releases of acetone by chemical manufacturers and end users account for only about 1% of total releases. (Id.)
The SIAR also evaluates a worst-case consumer exposure scenario – an assumed 45-minute exposure through unventilated indoor application of a spray contact adhesive that contained 21% acetone, resulting in a peak exposure during use of 907 mg/m3 in the “zone of release.” (pp. 21-22) The SIAR reports that although some consumer products (such as nail polish remover) contain a higher percentage of acetone, “the resulting air acetone concentrations are generally much lower . . . because of the small volumes of liquid typically applied.” (p. 21)
Health and exposure data were considered together in an “Initial Assessment for Human Health.” Evaluating the estimated NOAEL for central nervous system (CNS) effects (2,375 mg/m3) against worst case estimates of occupational and consumer exposures, the SIAR found that acetone has “a low potential for neurological risk to humans.” (p. 30) Similarly, evaluations of the NOAELs for renal toxicity (found to be the most sensitive target tissue) and developmental toxicity against worst case occupational and consumer exposures led to a finding that acetone has “a low potential for renal damage and developmental effects in humans.” (p. 30) Similarly, the SIAR concludes that “acetone does not pose a neurotoxic, carcinogenic, or reproductive health hazard at the concentrations found anywhere in the environment.” (p. 31) The SIAR states that the “ability of humans to naturally produce and dispose of acetone may to a large degree explain its relatively low toxicity following external exposure to moderate amounts of the vapor or liquid.” (p. 20)
3.2 World Health Organization Environmental Health Criteria Document
The WHO International Programme on Chemical Safety (IPCS) completed and published an Environmental Health Criteria (EHC) document for acetone in 1999. (WHO 1998). The document is available on-line at http://www.inchem.org/document/ehc/ehc207.htm. IPCS EHC documents are the product of a rigorous scientific review process (described in the publication). In the case of acetone, the first draft was prepared by D.J. Reisman of U.S. EPA’s Office of Research and Development. A panel of independent experts reviewed and commented on the draft report, and also attended a multi-day meeting to discuss the draft document. The final document (EHC No. 207) includes a chronic guidance value of 9.0 mg/kg-day. (p. 110)
3.3 EPA EPCRA Review
In 1995, EPA removed acetone from the list of “toxic chemicals” for which annual emissions reporting is required under Section 313 of the Emergency Planning and Community Right to Know Act (EPCRA). See 60 Fed. Reg. 31,643 (June 16, 1995). In making that decision, EPA
15
conducted an extensive review of the available toxicity data and made the following findings (among others):
1. Acetone can cause eye, nose and throat irritation at 500 to 1,000 ppm (1,188 to 2,376 mg/m3), and acute CNS depression at concentrations in excess of 10,000 ppm.
2. “There is currently no evidence to suggest a concern for carcinogenicity.”
3. “The weight of the evidence indicates that acetone is not mutagenic in several mutagenicity assay systems.”
4. “A NOAEL of 2,200 ppm [5,220 mg/m3] by inhalation has been reported for developmental toxicity of acetone in rats and mice.”
5. “There are no data sufficient to support a chronic concern for significant irreversible neurotoxicity.”
EPA concluded that: (1) “acetone exhibits acute toxicity only at levels that greatly exceed releases and resultant exposures”; (2) “acetone exhibits low toxicity in chronic studies”; and (3) “acetone causes adverse environmental effects only at relatively high dose levels.” 60 Fed. Reg at 49,889-49,890.
3.4 Patty’s Toxicology
The Acetone Chapter in Patty’s Toxicology was updated in 2001 and provides a comprehensive discussion of the available animal and human data on acetone’s potential health effects (Morgott 2001). The acetone chapter consists of 81 pages and includes 697 references. All toxicity endpoints of concern to the VCCEP are discussed at length. Extensive information also is presented concerning metabolism, toxicokinetics and normal endogenous production, among other relevant subjects. The acetone chapter contains a number of excellent tables that summarize relevant studies addressing particular toxicity endpoints, and several are reproduced here with permission. Further, with permission, a copy of the entire acetone chapter has been included with this submission as Appendix C.
3.5 PBPK Modeling
Information on the toxicokinetics of acetone and isopropanol, whose major metabolite is acetone (Nordmann et al., 1973), has been used to develop physiologically-based, pharmacokinetic (PBPK) models to compare the uptake, distribution and metabolism of the chemicals in rats and humans by different routes of exposure (Clewell et al., 2001; Gentry, et al., 2002; Kumagai and Matsunaga, 1995). The tissues described in the models include those associated with uptake (lungs and skin), metabolism (liver) and fat storage with slowly- and rapidly-perfused compartments. The models have been validated for human exposure for the inhalation pathway, but not the oral pathway. However, this PBPK model successfully described a large body of pharmacokinetic data for IPA and acetone from different species, administered by different routes of administration, including orally administered acetone in rats. The successful description of several data sets collected by several different investigators indicates that the model is a valid mathematical description of the pharmacokinetics of both IPA and acetone in mammals and can be used to accurately describe the fate of inhaled or orally

16
administered acetone to humans. See additional discussion in section 7.3 – Metabolism and Pharmacokinetics.
3.6 ATSDR Toxicological Profile
The Agency for Toxic Substances and Disease Registry (ATSDR) published a toxicological profile of acetone in 1994. (ATSDR 1994). Though somewhat dated, the toxicological profile includes information on potential exposures as well as an assessment of hazard data. The ATSDR document also includes minimal risk levels (MRLs) for acute, intermediate and chronic exposures. An MRL is defined as an estimate of daily exposure to a substance that is likely to be without an appreciable risk of adverse health effects (non-cancer) for the general population over a specified period of time. The ATSDR MRL values for acetone include: an acute inhalation MRL of 26 ppm for exposures up to 14 days; an intermediate duration inhalation MRL of 13 ppm for exposures from 15 to 364 days; the same inhalation MRL of 13 ppm for chronic-duration exposure of 365 days or more; and an intermediate oral MRL of 2 mg/kg-day for oral exposures from 15 to 364 days.
3.7 NTP Testing
The National Toxicology Program (NTP) conducted 13-week subchronic studies of acetone administered in the drinking water of male and female B6C3F1 mice and Fischer-344 rats (Dietz, 1990; Dietz et al., 1991). Acetone concentrations in the drinking water went up to 5.0 percent for male and female rats and female mice, and up to 2.0 percent for male mice. The high concentrations correspond to 50,000 ppm for male and female rats and female mice, and 20,000 ppm for male mice. Minimally toxic concentrations of acetone were estimated to be 20,000 ppm (1700 mg/kg-day) for male rats, 20,000 ppm (4858 mg/kg-day) for male mice, and 50,000 ppm (11,298 mg/kg-day) for female mice. No toxic effects were identified for female rats at the highest concentration of 50,000 ppm (3100 mg/kg-day).
After completing these subchronic drinking water studies, the NTP recommended against conducting chronic toxicity or carcinogenicity studies of acetone because “the prechronic studies only demonstrated a very mild toxic response at very high doses in rodents,” and because of “the absence of any evidence supporting the carcinogenic potential for acetone.” (NTP, 1989) (Appendix F). This recommendation was accepted by the Hazardous Waste Information Evaluation Subcommittee (HWIES) of the Public Health Service Committee to Coordinate Environmental Health and Related Programs. The recommendation of HWIES in turn was accepted by the Agency for Toxic Substances and Disease Registry (ATSDR), which had been considering proposing acetone for possible chronic toxicity testing. See 54 Fed. Reg. 42,042 (Oct. 13, 1989); 55 Fed. Reg. 34,966 (Aug. 27, 1990).1 In other words, no two-year cancer bioassay has been conducted for acetone because NTP determined chronic toxicity studies were not necessary, and ATSDR agreed.
3.8 IRIS Assessment
EPA’s National Center for Environmental Assessment (NCEA) recently completed updating the Integrated Risk Information System (IRIS) database entry for acetone. A “preliminary draft” IRIS
1 ATSDR is required under CERCLA to conduct health assessments of sites on EPA’s National
Priorities List. Where gaps in toxicological information exist, ATSDR may sponsor studies at the NTP to address the data gaps. ATSDR seeks advice and recommendations from HWIES on which hazardous substances should be studied and the types of studies to be performed by NTP.
17
summary (13 pages) and Toxicological Review (45 pages) were posted on NCEA’s website on August 16, 2001. Final documents were posted on July 31, 2003 and may be found at http://cfpub.epa.gov/ncea/. The final documents include an oral reference dose (RfD) of 0.9 mg/kg-day, based on a NOAEL of 900 mg/kg-day for male rats reported in the 90-day drinking water studies sponsored by NTP, and total uncertainty factors of 1000. NCEA had proposed an RfD of 0.3 mg/kg-day, based on the same study and NOAEL but using total UFs of 3000. No inhalation reference concentration was proposed or included in the final documents.
The American Chemistry Council Acetone Panel submitted scientific comments on the draft documentation and proposed RfD, explaining why a total uncertainty factor of 3000 was excessive in the case of acetone. The Panel explained why it believed that it was not scientifically reasonable to suggest that increasing the level of acetone in blood by less than 1 percent above normal endogenous levels might pose health risks. The Panel cited the inherent variability of acetone blood levels in healthy individuals, the fact that endogenous production can greatly increase during normal, healthy exercise and can more than double during fasting, and the fact that acetone is naturally present in many commonly consumed foods.2 The Panel further demonstrated that: (1) an uncertainty factor of 10 to extrapolate from subchronic to chronic exposures was not necessary for acetone; (2) an uncertainty factor of 10 for database insufficiency was excessive; and (3) an interspecies uncertainty factor of 3 was sufficient in light of similarities between the endogenous background levels of acetone in humans and rats and the pharmacokinetic similarities in the disposition of acetone by both species. In sum, the Panel demonstrated that combined uncertainty factors of 100, or at most 300, were ample in the case of acetone.
In the final IRIS documents, NCEA agreed that an UF of 10 for extrapolation from subchronic exposures was excessive, and reduced that UF to 3, resulting in the final RfD of 0.9 mg/kg-day. NCEA did not make any other changes to the RfD calculation. As a result, NCEA has released a final RfD that is still more than 10-fold below estimated normal endogenous production in healthy adults. Further, the final IRIS RfD is 100-fold below estimated average daily endogenous acetone production in children 1 to 5 years old (94 mg/kg-day, with an estimated maximum value of 135 mg/kg-day – see Table 8.4 in section 8), and more than 120-fold below estimated average daily endogenous production in infants less than a year old (121 mg/kg-day, with an estimated maximum value of 387 mg/kg-day). Still further, NCEA’s final RfD is below estimated daily exposures to acetone in mother’s milk, assuming no exogenous sources of exposure (1.5 mg/kg-day). See section 8.2.4 and Table 8-12. Hence the EPA’s RfD for acetone currently implies that the acetone exposure due to the ingestion of normal amounts of human mother’s breast milk through nursing represents some incremental increase in health risk to the infant. Additionally, as described in section 7.12, a ketogenic diet (KD) has been used in recent years to treat children with recalcitrant refractory epilepsy with no apparent ill effects, and KD-based infant formulas have been administered to newborns. Acetone concentrations in the breath of children on a ketogenic diet have been shown to be more than 100-fold greater than levels in the breath of untreated children, indicating that blood levels have been raised significantly without evidence of adverse consequences. In light of that experience, it is not plausible to believe that exogenous exposures in the range of the IRIS RfD, or approximately 1 percent of normal endogenous production for healthy children, might pose health hazards.
2 The acetone content of foods is described in sections 6 and 8 of this submission.

18
In sum, the Panel believes the IRIS RfD is the product of too many conservative choices which collectively produce a scientifically implausible result.
3.9 Derivation of Inhalation RfC and Oral RfD by Gentry et al.
Because inhalation is the most relevant route of exposure, yet EPA in its draft IRIS documents concluded that there was insufficient data to calculate an RfC for acetone, the American Chemistry Council Acetone Panel sponsored Drs. Harvey Clewell, Robinan Gentry and their colleagues to use a pharmacokinetic model to derive an oral reference dose (RfD) and inhalation reference concentration (RfC) for acetone. Their manuscript has been accepted for publication by the Journal of Toxicology and Environmental Health (Gentry et al., in press), and a copy is included with this submission in Appendix D.
Gentry et al. conducted a risk assessment for acetone based on the systemic toxicity observed in subchronic and developmental toxicity studies for acetone and its metabolic precursor isopropanol. Using a validated PBPK model for isopropanol that included a full submodel reflecting acetone pharmacokinetics, the researchers were able to evaluate numerous oral and inhalation studies on acetone and isopropanol, determining actual tissue dosages rather than simply external exposures. The approach enabled route-to-route extrapolation (derivation of an RfD from inhalation data, or an RfC from oral data), and also allowed for a reduction in the uncertainty factor for interspecies extrapolation based on the ability of the PBPK model to simulate both human and animal dosimetry. The Mast (1988) developmental toxicity study was determined to provide the lowest health benchmark for both oral and inhalation exposures. The RfD derived from this study by Gentry et al. is 8.7 mg/kg-day, which is comparable to the guidance value presented in the IPCS EHC document. The RfC derived by Gentry et al. is 29 ppm, which is similar to but somewhat higher than the intermediate and chronic inhalation MRL values derived by ATSDR. Gentry et al. also calculated a RfD based on the NOAEL of 900 mg/kg-day observed in NTP’s 90-day drinking water studies in rats and mice. That value is 16.0 mg/kg-day.
19
4. Regulatory Status
This section provides a brief overview of acetone’s current U.S. regulatory status. Acetone must be handled carefully because of its flammability and relatively high vapor pressure, and the associated dangers of fire or explosion. However, acetone generally is not regulated by the federal government based on toxicity concerns. The following table summarizes acetone’s status under several environmental, health and safety statutes and regulatory programs.
Acetone Regulatory Status
Regulation Acetone Status CERCLA Hazardous Substances Listed because it is a RCRA hazardous waste. RQ
= 5,000 lbs. (highest category) RCRA Listed Wastes Included in F003 wastes (spent solvents) and listed
as a “U” waste (U002) based solely on ignitability RCRA Toxic Constituents (App. VIII) Not listed. EPCRA Extremely Hazardous Substances Not listed. EPCRA Toxic Release Inventory Delisted in 1995. CAA Hazardous Air Pollutants Not listed. CAA Volatile Organic Compounds Exempted from regulation as a VOC in 1995. CWA Priority Pollutant List Not listed. OSHA Z-Tables (Air Contaminants Standard) Permissible Exposure Limit (PEL) is 1,000 ppm (8-
hour TWA). ACGIH TLVs (non-regulatory) Recommended exposure limits are 500 ppm (8-
hour TWA) and 750 ppm (15-minute STEL) California Air Resources Board Toxics List Removed in 1995. Acetone is also listed as a component in food additives and food packaging and rated as a GRAS (Generally Recognized as Safe) substance at concentrations ranging from 5 to 8 mg/L (Oser and Ford, 1973).
EPA has recognized that acetone can potentially play a significant role in pollution prevention. When excluding acetone from the federal definition of a volatile organic compound (VOC), EPA stated that this exemption would “contribute to the achievement of several important environmental goals and would support EPA’s pollution prevention efforts.” 60 Fed. Reg. 31,634 (June 16, 1995). EPA noted that because acetone is not a HAP, it “can be used as a substitute for several compounds that are listed as hazardous air pollutants (HAP) under section 112 of the [Clean Air] Act.” Id. Further, EPA stated, “Acetone can also be used as a substitute for ozone depleting substances (ODSs) which are active in depleting the stratospheric ozone layer.” Id. EPA has explicitly approved acetone as a substitute for ODSs in several use sectors, including: (1) polyurethane foam blowing; (2) metals, electronics, and precision cleaning; (3) adhesives, coatings, and inks; and (4) aerosol solvents. See 59 Fed. Reg. 13,044 (Mar. 18, 1994).
Other regulatory authorities have recognized that use of acetone may facilitate progress toward important environmental goals. The California South Coast Air Quality Management District (SCAQMD) has stated, “use of acetone as an available substitute for ODS and HAPs is important to the AQMD’s efforts to require manufacturers to use negligibly reactive substances
20
in lieu of the ODS and HAPs that are currently in use.”3 SCAQMD stated further that acetone’s VOC exempt status would assist that Agency’s efforts in “reducing ozone formation by providing an acceptable alternative,” which “could be very beneficial to the aerospace, foam blowing and electronics industries located in Southern California.” Id. Similarly, the Massachusetts Department of Environmental Protection (DEP) when exempting acetone from regulation as a VOC stated, “By adopting the proposed revision, Massachusetts will promote cleaner air and public health through [encouraging] the substitution of acetone for more hazardous compounds, or the continued use of acetone over more hazardous compounds. . . .”4
3 Letter from J.M. Lents, Executive Officer of SCAQMD, to EPA Docket (Nov. 21, 1994) (supporting
VOC-exempt status for acetone). 4 Background Document for the Proposed Exemption of Acetone from the List of VOCs, at p. 1
(Feb. 1996).

21
5. Product Overview
This section presents an overview of: (1) production processes; (2) production volume; (3) physical and chemical properties; (4) principal uses; and (5) releases to the environment.
5.1 Production Processes
Acetone can be manufactured by several routes: (a) as a co-product of phenol via cumene peroxidation, (b) via dehydrogenation of isopropyl alcohol, (c) as a byproduct of hydroquinone production, and (d) as a byproduct of propylene oxide production. The predominant route to production of acetone is the cumene peroxidation process. In this process, benzene is alkylated to cumene which is oxidized to cumene hydroperoxide, which in turn is cleaved to phenol and acetone. Distillation columns are employed to attain desired purity, which is typically greater than 99%. The processes and equipment for manufacture, transfer and storage are all continuous and enclosed. Equipment and tanks are customarily vented to water scrubbers or through conservation vents to prevent atmospheric loss via evaporation. These practices keep environmental acetone losses during production to a minimum.
5.2 Volume
In 2002, actual annual acetone production was approximately 4 billion pounds. (Chemical Data Inc., Monthly Petrochemical & Plastics Analysis, April 2003.)
5.3 Physical and Chemical Properties
A summary of selected chemical and physical properties of acetone is presented in Table 5.3.1. Additional information on chemical and physical properties is found in Patty’s Toxicology Acetone Chapter (Table 74.1) (Morgott 2001), the SIAR (p. 4), and a product brochure prepared by Dow (included in Appendix E).
22
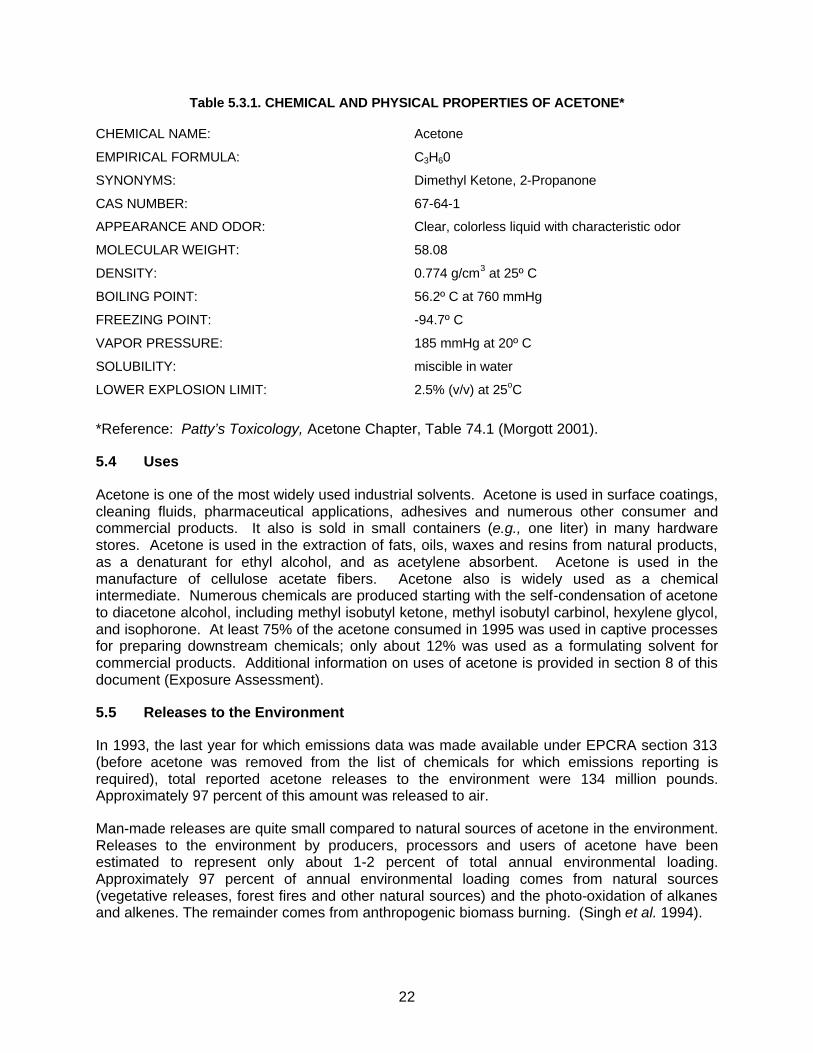
Table 5.3.1. CHEMICAL AND PHYSICAL PROPERTIES OF ACETONE* CHEMICAL NAME: Acetone
EMPIRICAL FORMULA: C3H60
SYNONYMS: Dimethyl Ketone, 2-Propanone
CAS NUMBER: 67-64-1
APPEARANCE AND ODOR: Clear, colorless liquid with characteristic odor
MOLECULAR WEIGHT: 58.08
DENSITY: 0.774 g/cm3 at 25º C
BOILING POINT: 56.2º C at 760 mmHg
FREEZING POINT: -94.7º C
VAPOR PRESSURE: 185 mmHg at 20º C
SOLUBILITY: miscible in water
LOWER EXPLOSION LIMIT: 2.5% (v/v) at 25oC
*Reference: Patty’s Toxicology, Acetone Chapter, Table 74.1 (Morgott 2001).
5.4 Uses
Acetone is one of the most widely used industrial solvents. Acetone is used in surface coatings, cleaning fluids, pharmaceutical applications, adhesives and numerous other consumer and commercial products. It also is sold in small containers (e.g., one liter) in many hardware stores. Acetone is used in the extraction of fats, oils, waxes and resins from natural products, as a denaturant for ethyl alcohol, and as acetylene absorbent. Acetone is used in the manufacture of cellulose acetate fibers. Acetone also is widely used as a chemical intermediate. Numerous chemicals are produced starting with the self-condensation of acetone to diacetone alcohol, including methyl isobutyl ketone, methyl isobutyl carbinol, hexylene glycol, and isophorone. At least 75% of the acetone consumed in 1995 was used in captive processes for preparing downstream chemicals; only about 12% was used as a formulating solvent for commercial products. Additional information on uses of acetone is provided in section 8 of this document (Exposure Assessment).
5.5 Releases to the Environment
In 1993, the last year for which emissions data was made available under EPCRA section 313 (before acetone was removed from the list of chemicals for which emissions reporting is required), total reported acetone releases to the environment were 134 million pounds. Approximately 97 percent of this amount was released to air.
Man-made releases are quite small compared to natural sources of acetone in the environment. Releases to the environment by producers, processors and users of acetone have been estimated to represent only about 1-2 percent of total annual environmental loading. Approximately 97 percent of annual environmental loading comes from natural sources (vegetative releases, forest fires and other natural sources) and the photo-oxidation of alkanes and alkenes. The remainder comes from anthropogenic biomass burning. (Singh et al. 1994).
23
Ambient concentrations in the environment typically are quite low. Additional discussion of man-made and natural sources of acetone in the environment and ambient concentrations is found in the SIAR at section 2 (General Information on Exposure) and section 3.1 (Environmental Exposure), and in Patty’s Toxicology Acetone Chapter (Morgott 2001) at section 1.3 (Exposure Assessment). This subject also is addressed further in section 8 of this VCCEP submission (Exposure Assessment).
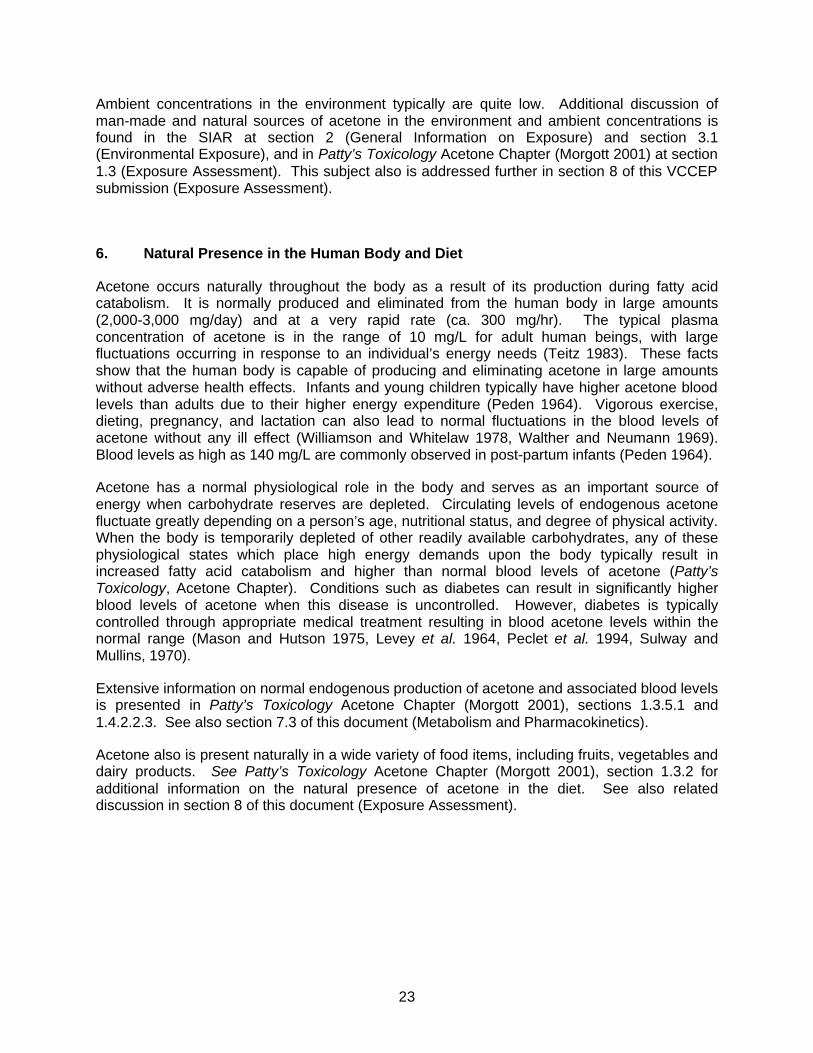
6. Natural Presence in the Human Body and Diet
Acetone occurs naturally throughout the body as a result of its production during fatty acid catabolism. It is normally produced and eliminated from the human body in large amounts (2,000-3,000 mg/day) and at a very rapid rate (ca. 300 mg/hr). The typical plasma concentration of acetone is in the range of 10 mg/L for adult human beings, with large fluctuations occurring in response to an individual’s energy needs (Teitz 1983). These facts show that the human body is capable of producing and eliminating acetone in large amounts without adverse health effects. Infants and young children typically have higher acetone blood levels than adults due to their higher energy expenditure (Peden 1964). Vigorous exercise, dieting, pregnancy, and lactation can also lead to normal fluctuations in the blood levels of acetone without any ill effect (Williamson and Whitelaw 1978, Walther and Neumann 1969). Blood levels as high as 140 mg/L are commonly observed in post-partum infants (Peden 1964).
Acetone has a normal physiological role in the body and serves as an important source of energy when carbohydrate reserves are depleted. Circulating levels of endogenous acetone fluctuate greatly depending on a person’s age, nutritional status, and degree of physical activity. When the body is temporarily depleted of other readily available carbohydrates, any of these physiological states which place high energy demands upon the body typically result in increased fatty acid catabolism and higher than normal blood levels of acetone (Patty’s Toxicology, Acetone Chapter). Conditions such as diabetes can result in significantly higher blood levels of acetone when this disease is uncontrolled. However, diabetes is typically controlled through appropriate medical treatment resulting in blood acetone levels within the normal range (Mason and Hutson 1975, Levey et al. 1964, Peclet et al. 1994, Sulway and Mullins, 1970).
Extensive information on normal endogenous production of acetone and associated blood levels is presented in Patty’s Toxicology Acetone Chapter (Morgott 2001), sections 1.3.5.1 and 1.4.2.2.3. See also section 7.3 of this document (Metabolism and Pharmacokinetics).
Acetone also is present naturally in a wide variety of food items, including fruits, vegetables and dairy products. See Patty’s Toxicology Acetone Chapter (Morgott 2001), section 1.3.2 for additional information on the natural presence of acetone in the diet. See also related discussion in section 8 of this document (Exposure Assessment).

24
7. Hazard Assessment
7.1 Introduction
There are literally hundreds of references on the potential health effects from exposure to acetone. The following text summarizes those studies deemed most pertinent to the VCCEP Pilot Program. Where appropriate, studies of isopropanol have been included to supplement the information available from studies of acetone. Because isopropanol is readily and quantitatively metabolized to acetone, studies of the former can be used as surrogates and to supplement the hazard assessment for acetone.
All toxicity tests listed in Tier 1, Tier 2 and Tier 3 of the Pilot Announcement have been conducted for acetone and/or isopropanol. In some cases, multiple studies are available to support an assessment of the toxicity endpoint identified. Further, repeated-dose studies provide supporting information for assessments of several toxicity endpoints, including potential reproductive toxicity, neurotoxicity and immunotoxicity.
The specific studies that correspond to each test listed in each tier of the Pilot Announcement are identified in Table 7.1. Individual studies are described further in separate sections of the hazard assessment organized by VCCEP category.
At the end of the hazard assessment, a summary table (Table 7.14.1) provides a listing of the key study(ies) for each VCCEP toxicity endpoint, with the following information: a description of the test species/sex; exposure concentration or dose; route of administration; duration of exposure; observed effects; journal reference; and robust summary number. Additional details concerning individual studies can be found in the OECD SIDS Dossier and SIAR (Appendix A) and in the robust summaries for key studies (Appendix B).
Table 7.1 Data Requirements for VCCEP Tiers 1-3 and Data Available for Acetone TIER TEST DATA/ RESULTS 1 Acute Oral or Acute Inhalation Toxicity. Oral LD50 in rats, rabbits and mice.
Inhalation LC50 in rats. Dermal LD50 in rabbit and guinea pig. i.p. LD50 in mice and rats. Numerous other acute toxicity studies in mice, rats, rabbits, guinea pigs, dogs, cats and monkeys. Data demonstrate low acute toxicity.
1 In Vitro Gene Mutation (bacterial reverse mutation assay).
Numerous In Vitro gene mutation assays, including mammalian cell mutagenesis studies. Generally demonstrating lack of mutagenic activity.
1 Reproductive Toxicity: Repeated-dose oral toxicity and one-generation reproductive toxicity.
Multiple oral, subchronic toxicity studies in rats and mice. One-generation reproduction study in rats. NOAEL for reproductive effects: 1,300 mg/kg in drinking water.
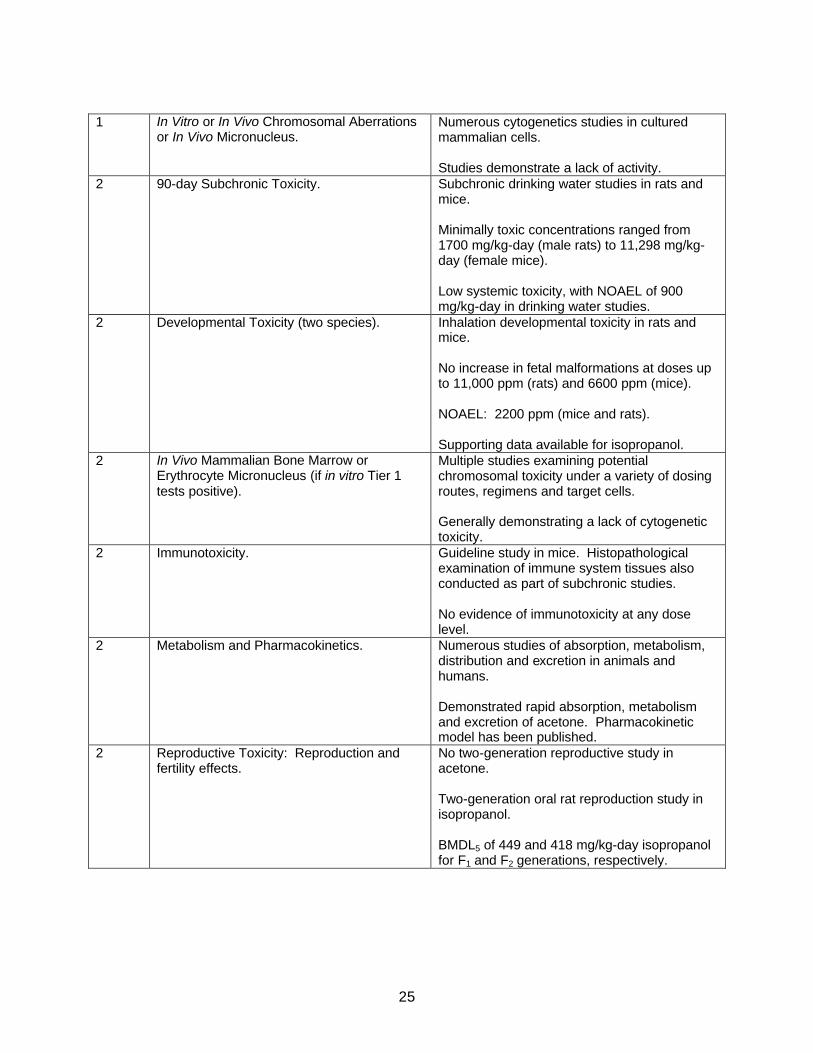
25
1 In Vitro or In Vivo Chromosomal Aberrations
or In Vivo Micronucleus. Numerous cytogenetics studies in cultured mammalian cells. Studies demonstrate a lack of activity.
2 90-day Subchronic Toxicity. Subchronic drinking water studies in rats and mice. Minimally toxic concentrations ranged from 1700 mg/kg-day (male rats) to 11,298 mg/kg-day (female mice). Low systemic toxicity, with NOAEL of 900 mg/kg-day in drinking water studies.
2 Developmental Toxicity (two species). Inhalation developmental toxicity in rats and mice. No increase in fetal malformations at doses up to 11,000 ppm (rats) and 6600 ppm (mice). NOAEL: 2200 ppm (mice and rats). Supporting data available for isopropanol.
2 In Vivo Mammalian Bone Marrow or Erythrocyte Micronucleus (if in vitro Tier 1 tests positive).
Multiple studies examining potential chromosomal toxicity under a variety of dosing routes, regimens and target cells. Generally demonstrating a lack of cytogenetic toxicity.
2 Immunotoxicity. Guideline study in mice. Histopathological examination of immune system tissues also conducted as part of subchronic studies. No evidence of immunotoxicity at any dose level.
2 Metabolism and Pharmacokinetics. Numerous studies of absorption, metabolism, distribution and excretion in animals and humans. Demonstrated rapid absorption, metabolism and excretion of acetone. Pharmacokinetic model has been published.
2 Reproductive Toxicity: Reproduction and fertility effects.
No two-generation reproductive study in acetone. Two-generation oral rat reproduction study in isopropanol. BMDL5 of 449 and 418 mg/kg-day isopropanol for F1 and F2 generations, respectively.
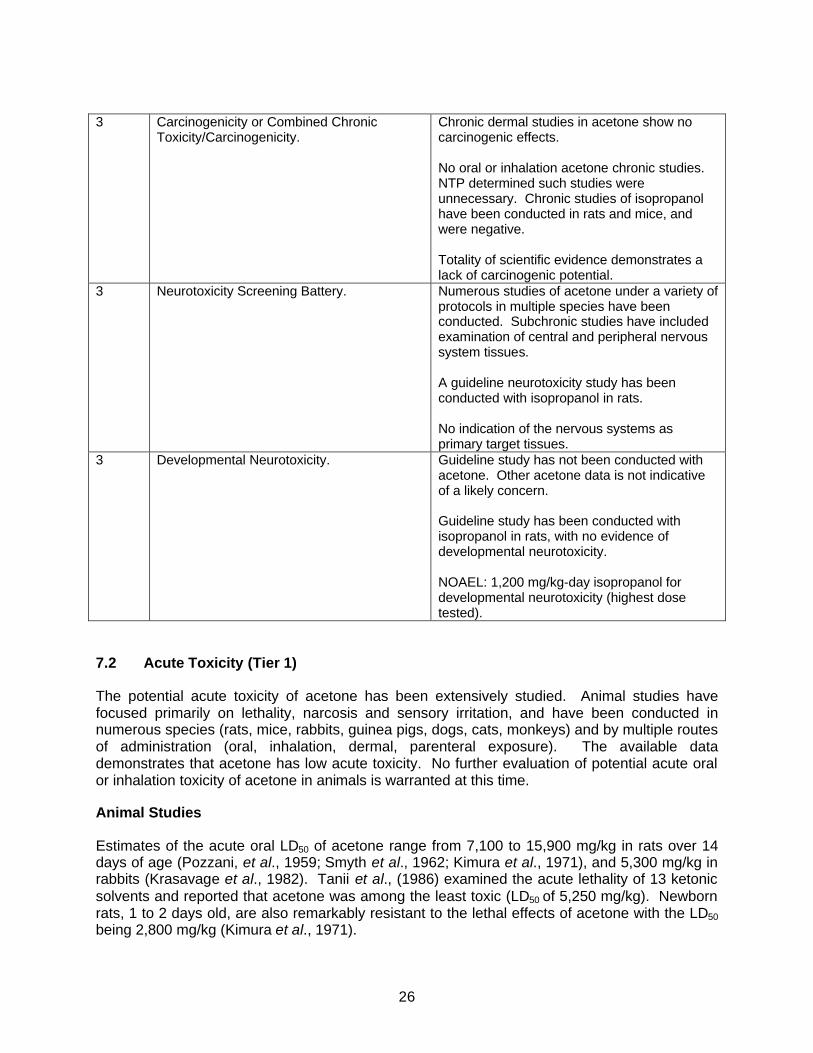
26
3 Carcinogenicity or Combined Chronic
Toxicity/Carcinogenicity. Chronic dermal studies in acetone show no carcinogenic effects. No oral or inhalation acetone chronic studies. NTP determined such studies were unnecessary. Chronic studies of isopropanol have been conducted in rats and mice, and were negative. Totality of scientific evidence demonstrates a lack of carcinogenic potential.
3 Neurotoxicity Screening Battery. Numerous studies of acetone under a variety of protocols in multiple species have been conducted. Subchronic studies have included examination of central and peripheral nervous system tissues. A guideline neurotoxicity study has been conducted with isopropanol in rats. No indication of the nervous systems as primary target tissues.
3 Developmental Neurotoxicity. Guideline study has not been conducted with acetone. Other acetone data is not indicative of a likely concern. Guideline study has been conducted with isopropanol in rats, with no evidence of developmental neurotoxicity. NOAEL: 1,200 mg/kg-day isopropanol for developmental neurotoxicity (highest dose tested).
7.2 Acute Toxicity (Tier 1)
The potential acute toxicity of acetone has been extensively studied. Animal studies have focused primarily on lethality, narcosis and sensory irritation, and have been conducted in numerous species (rats, mice, rabbits, guinea pigs, dogs, cats, monkeys) and by multiple routes of administration (oral, inhalation, dermal, parenteral exposure). The available data demonstrates that acetone has low acute toxicity. No further evaluation of potential acute oral or inhalation toxicity of acetone in animals is warranted at this time.
Animal Studies
Estimates of the acute oral LD50 of acetone range from 7,100 to 15,900 mg/kg in rats over 14 days of age (Pozzani, et al., 1959; Smyth et al., 1962; Kimura et al., 1971), and 5,300 mg/kg in rabbits (Krasavage et al., 1982). Tanii et al., (1986) examined the acute lethality of 13 ketonic solvents and reported that acetone was among the least toxic (LD50 of 5,250 mg/kg). Newborn rats, 1 to 2 days old, are also remarkably resistant to the lethal effects of acetone with the LD50 being 2,800 mg/kg (Kimura et al., 1971).
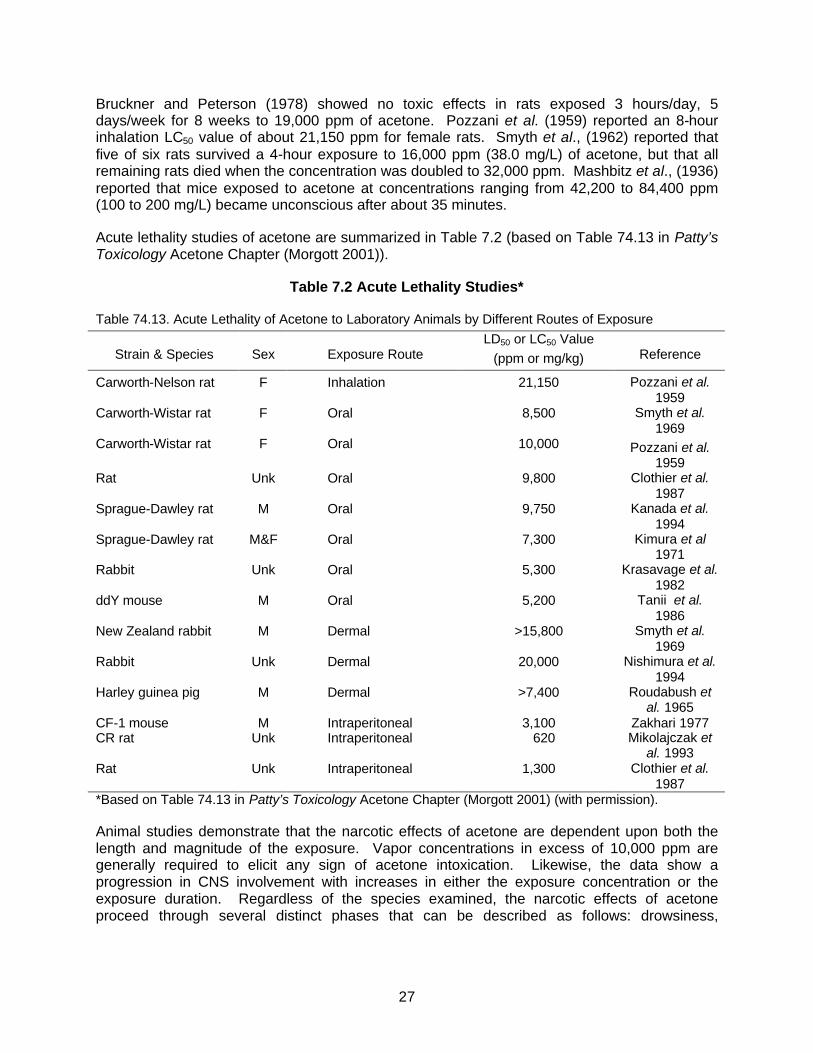
27
Bruckner and Peterson (1978) showed no toxic effects in rats exposed 3 hours/day, 5 days/week for 8 weeks to 19,000 ppm of acetone. Pozzani et al. (1959) reported an 8-hour inhalation LC50 value of about 21,150 ppm for female rats. Smyth et al., (1962) reported that five of six rats survived a 4-hour exposure to 16,000 ppm (38.0 mg/L) of acetone, but that all remaining rats died when the concentration was doubled to 32,000 ppm. Mashbitz et al., (1936) reported that mice exposed to acetone at concentrations ranging from 42,200 to 84,400 ppm (100 to 200 mg/L) became unconscious after about 35 minutes.
Acute lethality studies of acetone are summarized in Table 7.2 (based on Table 74.13 in Patty’s Toxicology Acetone Chapter (Morgott 2001)).
Table 7.2 Acute Lethality Studies*
Table 74.13. Acute Lethality of Acetone to Laboratory Animals by Different Routes of Exposure
Strain & Species
Sex
Exposure Route LD50 or LC50 Value
(ppm or mg/kg)
Reference
Carworth-Nelson rat F Inhalation 21,150 Pozzani et al. 1959
Carworth-Wistar rat F Oral 8,500 Smyth et al. 1969
Carworth-Wistar rat F Oral 10,000 Pozzani et al. 1959
Rat Unk Oral 9,800 Clothier et al. 1987
Sprague-Dawley rat M Oral 9,750 Kanada et al. 1994
Sprague-Dawley rat M&F Oral 7,300 Kimura et al 1971
Rabbit Unk Oral 5,300 Krasavage et al. 1982
ddY mouse M Oral 5,200 Tanii et al. 1986
New Zealand rabbit M Dermal >15,800 Smyth et al. 1969
Rabbit Unk Dermal 20,000 Nishimura et al. 1994
Harley guinea pig M Dermal >7,400 Roudabush et al. 1965
CF-1 mouse M Intraperitoneal 3,100 Zakhari 1977 CR rat Unk Intraperitoneal 620 Mikolajczak et
al. 1993 Rat Unk Intraperitoneal 1,300 Clothier et al.
1987 *Based on Table 74.13 in Patty’s Toxicology Acetone Chapter (Morgott 2001) (with permission). Animal studies demonstrate that the narcotic effects of acetone are dependent upon both the length and magnitude of the exposure. Vapor concentrations in excess of 10,000 ppm are generally required to elicit any sign of acetone intoxication. Likewise, the data show a progression in CNS involvement with increases in either the exposure concentration or the exposure duration. Regardless of the species examined, the narcotic effects of acetone proceed through several distinct phases that can be described as follows: drowsiness,

28
incoordination, loss of autonomic reflex, narcosis, respiratory failure, and death. (Haggard et al., 1944; Specht, 1939; Kagen, 1934; Flury and Wirth, 1934).
Some studies in laboratory animals have focused on the irritative properties of acetone following acute inhalation exposures. In a series of experiments described by Kane, et al., (1980), the RD50 value for eleven organic solvents ranged from about 600 to over 77,000 ppm. Of the compounds tested, acetone was shown to have the highest RD50 (over 77,000 ppm). The RD50 is the air concentration required to produce a 50 percent decrease in the initial respiration rate, which is a reflection of the degree of sensory irritation. Measurement of the RD50 value in mice has been shown to have predictive value in estimating the relative irritant effects of inhalation exposures in humans. Using very similar methods and criteria, De Ceaurriz et al., (1981) found that acetone was the least potent of 22 solvents evaluated in their version of the assay. These authors reported an RD50 value for acetone of 23,480 ppm.
Additional discussion of acute toxicity studies in animals is found in Patty’s Toxicology Acetone Chapter, section 1.4.1.1. Acute toxicity inhalation studies are summarized in Table 7.3 (based on Table 74.14 in Patty’s Toxicology Acetone Chapter).

29
Table 7.3 Acute Toxicity Studies – Inhalation*
Table 74.14. Acute Toxicity of Acetone to Laboratory Animals Following Inhalation Exposure
Species Exposure conc
(ppm)
Duration (h)
Observed effects
Reference
Mice 8,440 4.0-7.75 Loss righting reflex Browning 1953
8,440 7.75 Narcosis in some animals 20,256 1.5 Deep narcosis 20,256 1.0-1.2 Loss righting reflex 46,420 0.6-1.0 Deep narcosis 46,420 1.0 Lethal Rats 2,100 8.0 None Haggard et
al. 1944 4,220 8.0 None 10,550 1.7-4.2 Incoordination 21,100 2.2-2.7 Loss righting reflex 42,200 1.75-1.9 Loss corneal reflex 42,200 4.5-5.5 Respiratory failure 84,400 2.5-3.0 Respiratory failure 84,400 0.35-0.83 Loss corneal and righting reflex 126,600 1.75-2.25 Respiratory failure 126,600 0.17-0.42 Loss corneal and righting reflex Cats 16,880 3.75-4.0 Loss righting reflex Kagan 1924 45,108 1.5 Loss righting reflex 75,116 1.0-1.25 Deep narcosis Cats 3,375-4,220 5.0 Eye and nose irritation Flury & Wirth
1934 8,440-21,100 3.0-4.0 Drowsiness and stupor 33,760-42,200 4.0 Narcosis with convulsions 52,750 1.5 Narcosis with convulsions Guinea 10,000 47-48 Some lethality Specht et al.
1939 pigs 20,000 9.0 Narcosis 50,000 3.0-4.0 Lethal *Based on Table 74.13 in Patty’s Toxicology Acetone Chapter (Morgott 2001) (with permission). Additional acute animal studies are discussed in Patty’s Toxicology Acetone Chapter, section 1.4.1.1.
7.3 Metabolism and Pharmacokinetics (Tier 2)
The rates and routes of acetone formation and elimination have been extensively examined in both humans and laboratory animals. This topic is addressed at length in Patty’s Toxicology Acetone Chapter (Morgott 2001), section 1.4.2.2.3.
Acetone is a normal byproduct of mammalian metabolism, and virtually every organ and tissue within the body contains some acetone. Measurable amounts of acetone are continuously being excreted in the breath and urine of humans. Normal levels of acetone in the blood of healthy adult humans have a mean value of 10 mg/L or less (Trotter et al., 1971; Teitz, 1983;
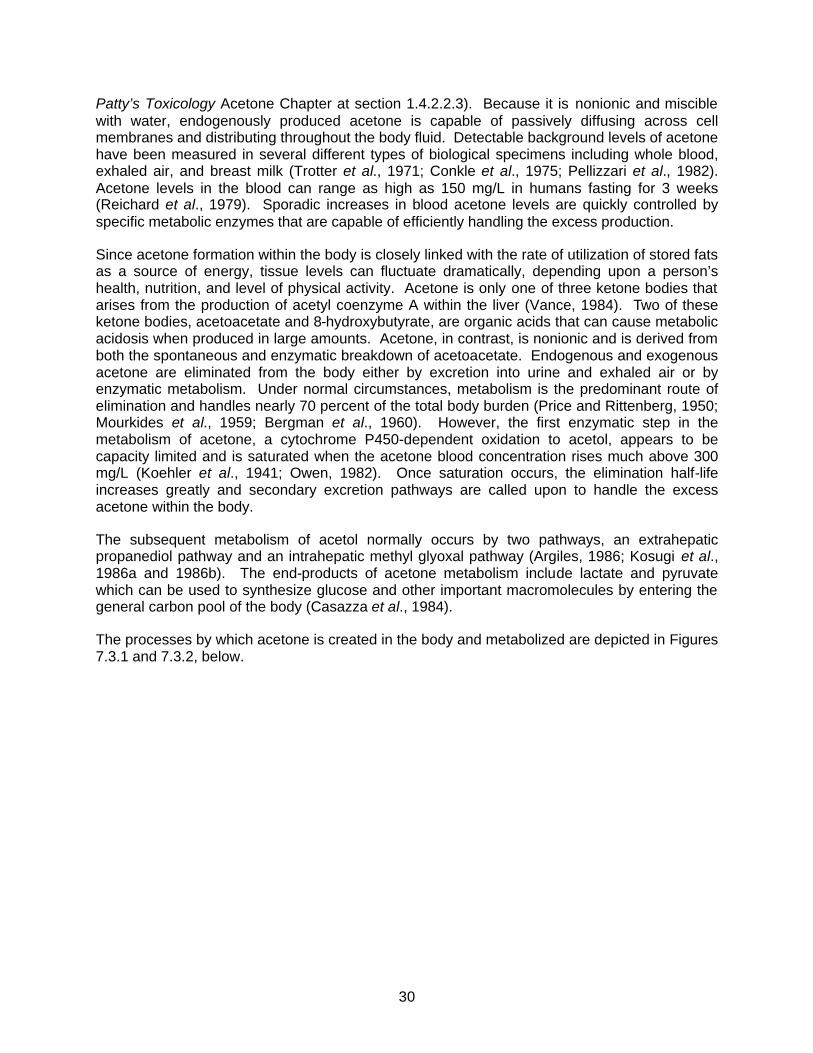
30
Patty’s Toxicology Acetone Chapter at section 1.4.2.2.3). Because it is nonionic and miscible with water, endogenously produced acetone is capable of passively diffusing across cell membranes and distributing throughout the body fluid. Detectable background levels of acetone have been measured in several different types of biological specimens including whole blood, exhaled air, and breast milk (Trotter et al., 1971; Conkle et al., 1975; Pellizzari et al., 1982). Acetone levels in the blood can range as high as 150 mg/L in humans fasting for 3 weeks (Reichard et al., 1979). Sporadic increases in blood acetone levels are quickly controlled by specific metabolic enzymes that are capable of efficiently handling the excess production.
Since acetone formation within the body is closely linked with the rate of utilization of stored fats as a source of energy, tissue levels can fluctuate dramatically, depending upon a person’s health, nutrition, and level of physical activity. Acetone is only one of three ketone bodies that arises from the production of acetyl coenzyme A within the liver (Vance, 1984). Two of these ketone bodies, acetoacetate and 8-hydroxybutyrate, are organic acids that can cause metabolic acidosis when produced in large amounts. Acetone, in contrast, is nonionic and is derived from both the spontaneous and enzymatic breakdown of acetoacetate. Endogenous and exogenous acetone are eliminated from the body either by excretion into urine and exhaled air or by enzymatic metabolism. Under normal circumstances, metabolism is the predominant route of elimination and handles nearly 70 percent of the total body burden (Price and Rittenberg, 1950; Mourkides et al., 1959; Bergman et al., 1960). However, the first enzymatic step in the metabolism of acetone, a cytochrome P450-dependent oxidation to acetol, appears to be capacity limited and is saturated when the acetone blood concentration rises much above 300 mg/L (Koehler et al., 1941; Owen, 1982). Once saturation occurs, the elimination half-life increases greatly and secondary excretion pathways are called upon to handle the excess acetone within the body.
The subsequent metabolism of acetol normally occurs by two pathways, an extrahepatic propanediol pathway and an intrahepatic methyl glyoxal pathway (Argiles, 1986; Kosugi et al., 1986a and 1986b). The end-products of acetone metabolism include lactate and pyruvate which can be used to synthesize glucose and other important macromolecules by entering the general carbon pool of the body (Casazza et al., 1984).
The processes by which acetone is created in the body and metabolized are depicted in Figures 7.3.1 and 7.3.2, below.
31
Figure 7.3.1: Endogenous Production of Acetone
Source: Patty’s Toxicology (Morgott 2001), Figure 74.1, p. 35.
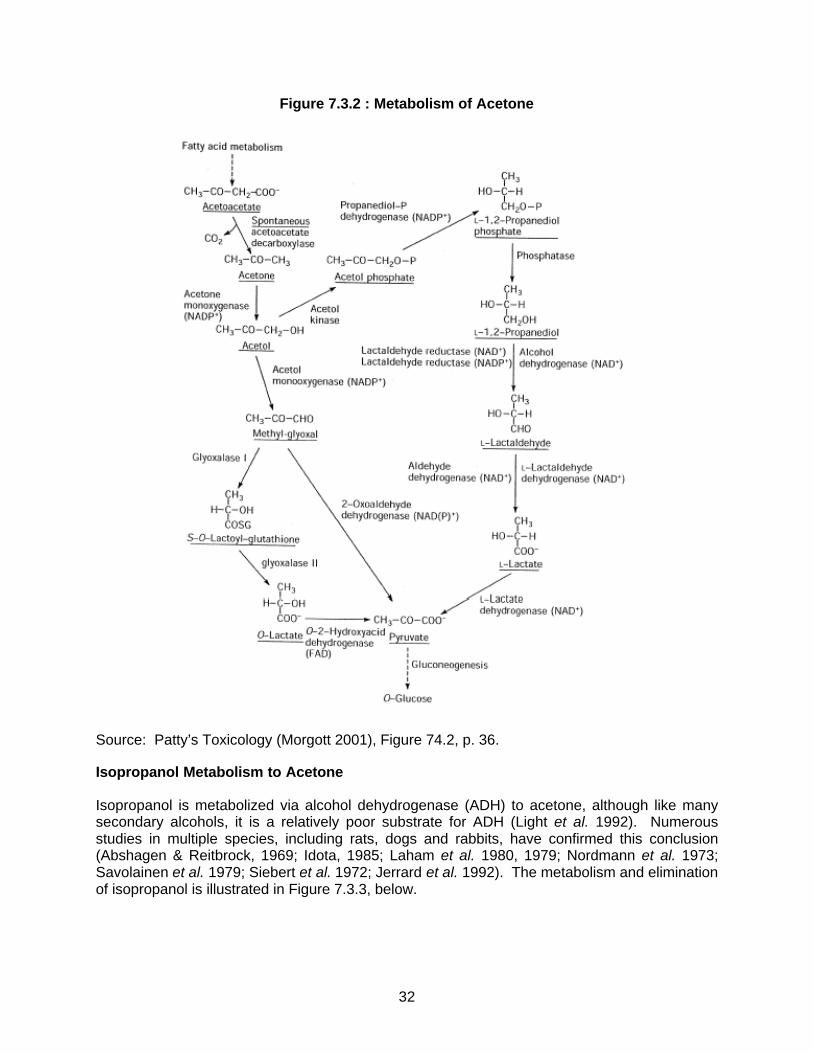
32
Figure 7.3.2 : Metabolism of Acetone
Source: Patty’s Toxicology (Morgott 2001), Figure 74.2, p. 36.
Isopropanol Metabolism to Acetone
Isopropanol is metabolized via alcohol dehydrogenase (ADH) to acetone, although like many secondary alcohols, it is a relatively poor substrate for ADH (Light et al. 1992). Numerous studies in multiple species, including rats, dogs and rabbits, have confirmed this conclusion (Abshagen & Reitbrock, 1969; Idota, 1985; Laham et al. 1980, 1979; Nordmann et al. 1973; Savolainen et al. 1979; Siebert et al. 1972; Jerrard et al. 1992). The metabolism and elimination of isopropanol is illustrated in Figure 7.3.3, below.
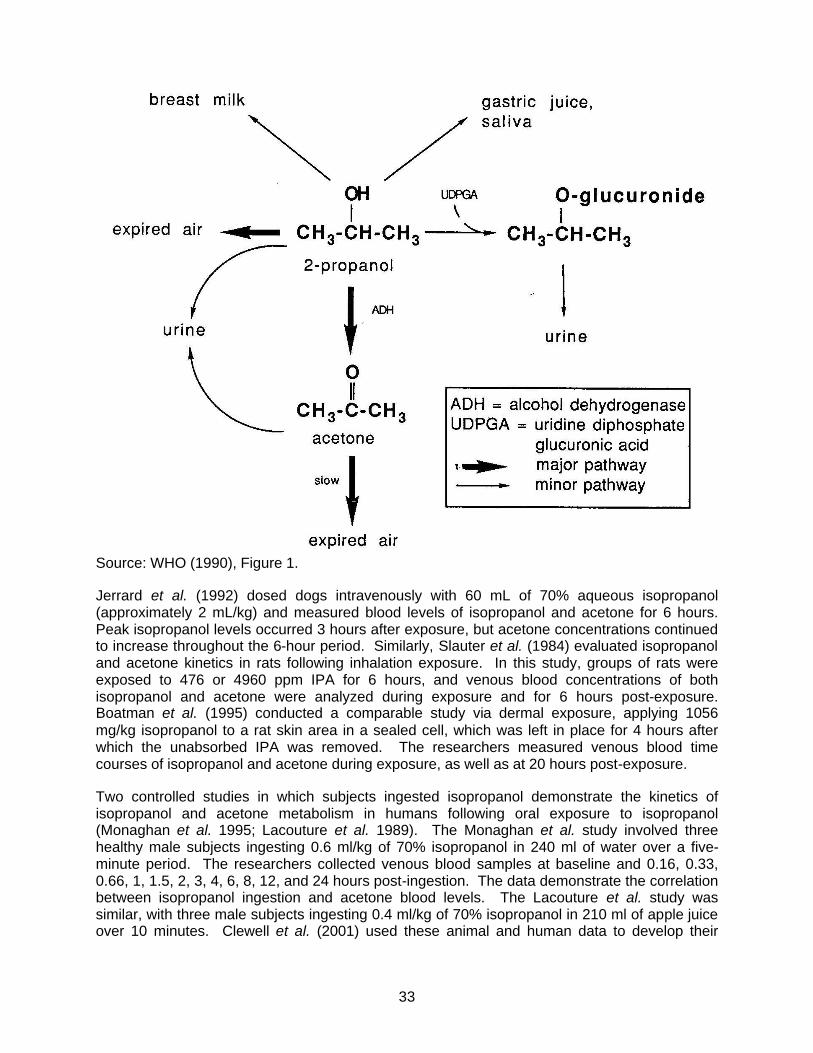
33
Source: WHO (1990), Figure 1.
Jerrard et al. (1992) dosed dogs intravenously with 60 mL of 70% aqueous isopropanol (approximately 2 mL/kg) and measured blood levels of isopropanol and acetone for 6 hours. Peak isopropanol levels occurred 3 hours after exposure, but acetone concentrations continued to increase throughout the 6-hour period. Similarly, Slauter et al. (1984) evaluated isopropanol and acetone kinetics in rats following inhalation exposure. In this study, groups of rats were exposed to 476 or 4960 ppm IPA for 6 hours, and venous blood concentrations of both isopropanol and acetone were analyzed during exposure and for 6 hours post-exposure. Boatman et al. (1995) conducted a comparable study via dermal exposure, applying 1056 mg/kg isopropanol to a rat skin area in a sealed cell, which was left in place for 4 hours after which the unabsorbed IPA was removed. The researchers measured venous blood time courses of isopropanol and acetone during exposure, as well as at 20 hours post-exposure.
Two controlled studies in which subjects ingested isopropanol demonstrate the kinetics of isopropanol and acetone metabolism in humans following oral exposure to isopropanol (Monaghan et al. 1995; Lacouture et al. 1989). The Monaghan et al. study involved three healthy male subjects ingesting 0.6 ml/kg of 70% isopropanol in 240 ml of water over a five-minute period. The researchers collected venous blood samples at baseline and 0.16, 0.33, 0.66, 1, 1.5, 2, 3, 4, 6, 8, 12, and 24 hours post-ingestion. The data demonstrate the correlation between isopropanol ingestion and acetone blood levels. The Lacouture et al. study was similar, with three male subjects ingesting 0.4 ml/kg of 70% isopropanol in 210 ml of apple juice over 10 minutes. Clewell et al. (2001) used these animal and human data to develop their
34
quantitative PBPK model of isopropanol and acetone, which models the conversion of isopropanol to acetone both in rats and in humans.
In sum, the available data demonstrate that the principal route of metabolism of isopropanol is to acetone via ADH. As such, data on isopropanol can be used to analyze the toxicological effects of acetone. The availability of the isopropanol/acetone PBPK model furthers allows for quantitative usage of the isopropanol data to estimate acetone effect levels.
7.4 Gene Mutation and Cytogenetics (Tiers 1 and 2)
The potential genotoxicity of acetone has been extensively studied in numerous in vitro and in vivo assays. Acetone has been shown to be negative in the Ames in vitro assay for gene mutation in Salmonella typhimurium strains TA98, TA100, TA1535, TA1537 and TA1538 (NTP, 1984; De Flora et al., 1984) and yeast, Schizosaccharomyces pombe (Abbondandolo et al., 1980). Acetone is similarly inactive as a mutagen in mammalian cells in culture such as V79 Chinese hamster cells (Tates and Kriek, 1981; Latt et al., 1981; NTP, 1989) and mouse lymphoma cells (Amacher et al., 1980; McGregor et al., 1988). Acetone has failed to cause an increase in sister chromatid exchanges in human lymphocyte cells in culture (Norppa, 1981). These studies indicate that acetone is not genotoxic. In fact, acetone has been shown to be compatible for use as a vehicle for testing water insoluble substances in in vitro mutagenicity assays, such as S. pombe, V79 Chinese hamster cells and the Ames assay both with and without metabolic activation. (Abbondandolo et al., 1980; McCann et al., 1975).
Additional studies are listed in Tables 7.4.1 and 7.4.2. These tables are based on Patty’s Toxicology Acetone Chapter, Table 74.23 (Genotoxicity Studies with Acetone Using Prokaryotic and Eukaryotic Organisms) and Table 74.24 (Genotoxicity Studies with Acetone in Mammalian Cell Systems) (used with permission). No further evaluation of acetone’s mutagenic potential or cytogenetic toxicity potential is warranted at this time.
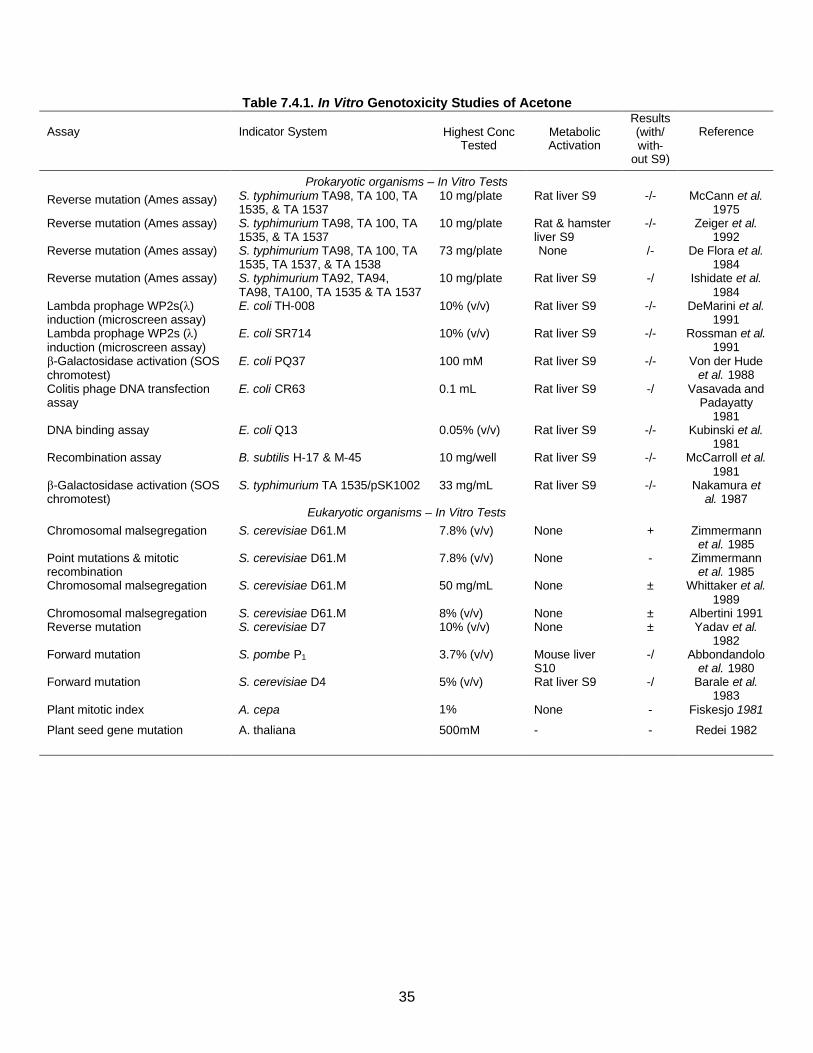
35
Table 7.4.1. In Vitro Genotoxicity Studies of Acetone Assay
Indicator System
Highest Conc
Tested
Metabolic Activation
Results (with/ with-
out S9)
Reference
Prokaryotic organisms – In Vitro Tests Reverse mutation (Ames assay) S. typhimurium TA98, TA 100, TA
1535, & TA 1537 10 mg/plate Rat liver S9 -/- McCann et al.
1975 Reverse mutation (Ames assay) S. typhimurium TA98, TA 100, TA
1535, & TA 1537 10 mg/plate Rat & hamster
liver S9 -/- Zeiger et al.
1992 Reverse mutation (Ames assay) S. typhimurium TA98, TA 100, TA
1535, TA 1537, & TA 1538 73 mg/plate None /- De Flora et al.
1984 Reverse mutation (Ames assay) S. typhimurium TA92, TA94,
TA98, TA100, TA 1535 & TA 1537 10 mg/plate Rat liver S9 -/ Ishidate et al.
1984 Lambda prophage WP2s(λ) induction (microscreen assay)
E. coli TH-008 10% (v/v) Rat liver S9 -/- DeMarini et al. 1991
Lambda prophage WP2s (λ) induction (microscreen assay)
E. coli SR714 10% (v/v) Rat liver S9 -/- Rossman et al. 1991
β-Galactosidase activation (SOS chromotest)
E. coli PQ37 100 mM Rat liver S9 -/- Von der Hude et al. 1988
Colitis phage DNA transfection assay
E. coli CR63 0.1 mL Rat liver S9 -/ Vasavada and Padayatty
1981 DNA binding assay E. coli Q13 0.05% (v/v) Rat liver S9 -/- Kubinski et al.
1981 Recombination assay B. subtilis H-17 & M-45 10 mg/well Rat liver S9 -/- McCarroll et al.
1981 β-Galactosidase activation (SOS chromotest)
S. typhimurium TA 1535/pSK1002 33 mg/mL Rat liver S9 -/- Nakamura et al. 1987
Eukaryotic organisms – In Vitro Tests Chromosomal malsegregation S. cerevisiae D61.M 7.8% (v/v) None + Zimmermann
et al. 1985 Point mutations & mitotic recombination
S. cerevisiae D61.M 7.8% (v/v) None - Zimmermann et al. 1985
Chromosomal malsegregation S. cerevisiae D61.M 50 mg/mL None ± Whittaker et al. 1989
Chromosomal malsegregation S. cerevisiae D61.M 8% (v/v) None ± Albertini 1991 Reverse mutation S. cerevisiae D7 10% (v/v) None ± Yadav et al.
1982 Forward mutation S. pombe P1 3.7% (v/v) Mouse liver
S10 -/ Abbondandolo
et al. 1980 Forward mutation S. cerevisiae D4 5% (v/v) Rat liver S9 -/ Barale et al.
1983 Plant mitotic index A. cepa 1% None - Fiskesjo 1981
Plant seed gene mutation A. thaliana 500mM - - Redei 1982
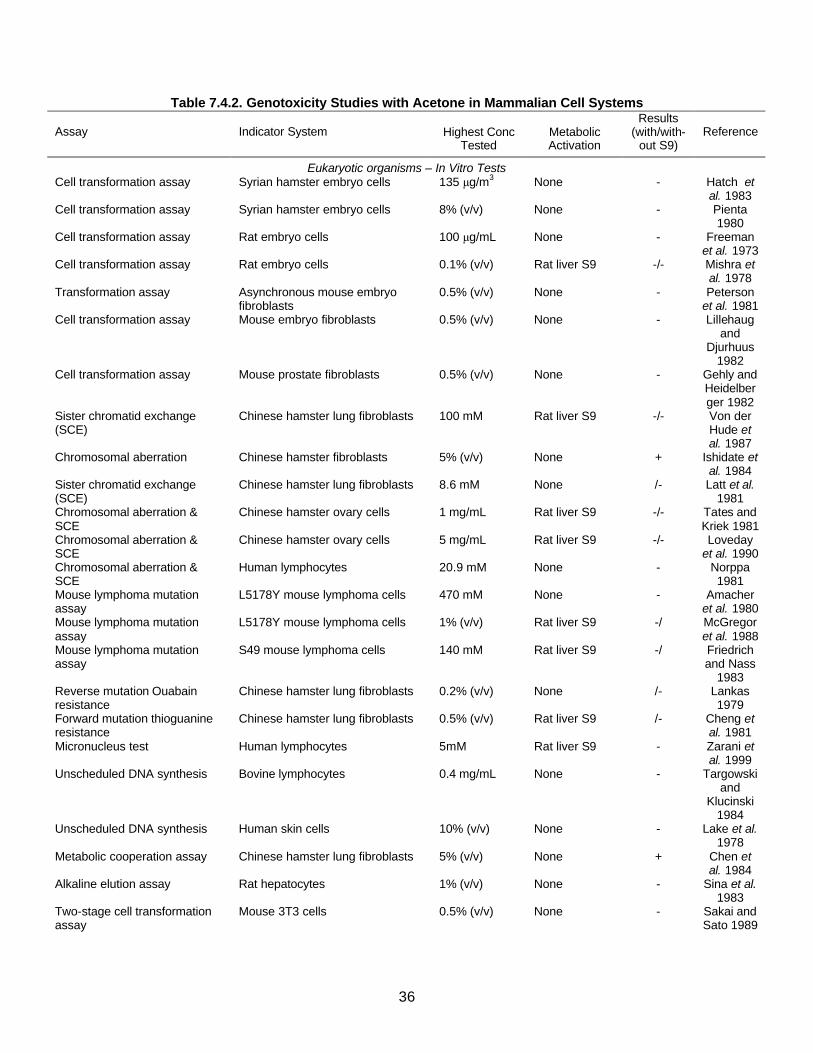
36
Table 7.4.2. Genotoxicity Studies with Acetone in Mammalian Cell Systems Assay
Indicator System
Highest Conc
Tested
Metabolic Activation
Results (with/with-
out S9)
Reference
Eukaryotic organisms – In Vitro Tests Cell transformation assay Syrian hamster embryo cells 135 Tg/m3 None - Hatch et
al. 1983 Cell transformation assay Syrian hamster embryo cells 8% (v/v) None - Pienta
1980 Cell transformation assay Rat embryo cells 100 Tg/mL None - Freeman
et al. 1973 Cell transformation assay Rat embryo cells 0.1% (v/v) Rat liver S9 -/- Mishra et
al. 1978 Transformation assay Asynchronous mouse embryo
fibroblasts 0.5% (v/v) None - Peterson
et al. 1981 Cell transformation assay Mouse embryo fibroblasts 0.5% (v/v) None - Lillehaug
and Djurhuus
1982 Cell transformation assay Mouse prostate fibroblasts 0.5% (v/v) None - Gehly and
Heidelberger 1982
Sister chromatid exchange (SCE)
Chinese hamster lung fibroblasts 100 mM Rat liver S9 -/- Von der Hude et al. 1987
Chromosomal aberration Chinese hamster fibroblasts 5% (v/v) None + Ishidate et al. 1984
Sister chromatid exchange (SCE)
Chinese hamster lung fibroblasts 8.6 mM None /- Latt et al. 1981
Chromosomal aberration & SCE
Chinese hamster ovary cells 1 mg/mL Rat liver S9 -/- Tates and Kriek 1981
Chromosomal aberration & SCE
Chinese hamster ovary cells 5 mg/mL Rat liver S9 -/- Loveday et al. 1990
Chromosomal aberration & SCE
Human lymphocytes 20.9 mM None - Norppa 1981
Mouse lymphoma mutation assay
L5178Y mouse lymphoma cells 470 mM None - Amacher et al. 1980
Mouse lymphoma mutation assay
L5178Y mouse lymphoma cells 1% (v/v) Rat liver S9 -/ McGregor et al. 1988
Mouse lymphoma mutation assay
S49 mouse lymphoma cells 140 mM Rat liver S9 -/ Friedrich and Nass
1983 Reverse mutation Ouabain resistance
Chinese hamster lung fibroblasts 0.2% (v/v) None /- Lankas 1979
Forward mutation thioguanine resistance
Chinese hamster lung fibroblasts 0.5% (v/v) Rat liver S9 /- Cheng et al. 1981
Micronucleus test Human lymphocytes 5mM Rat liver S9 - Zarani et al. 1999
Unscheduled DNA synthesis Bovine lymphocytes 0.4 mg/mL None - Targowski and
Klucinski 1984
Unscheduled DNA synthesis Human skin cells 10% (v/v) None - Lake et al. 1978
Metabolic cooperation assay Chinese hamster lung fibroblasts 5% (v/v) None + Chen et al. 1984
Alkaline elution assay Rat hepatocytes 1% (v/v) None - Sina et al. 1983
Two-stage cell transformation assay
Mouse 3T3 cells 0.5% (v/v) None - Sakai and Sato 1989
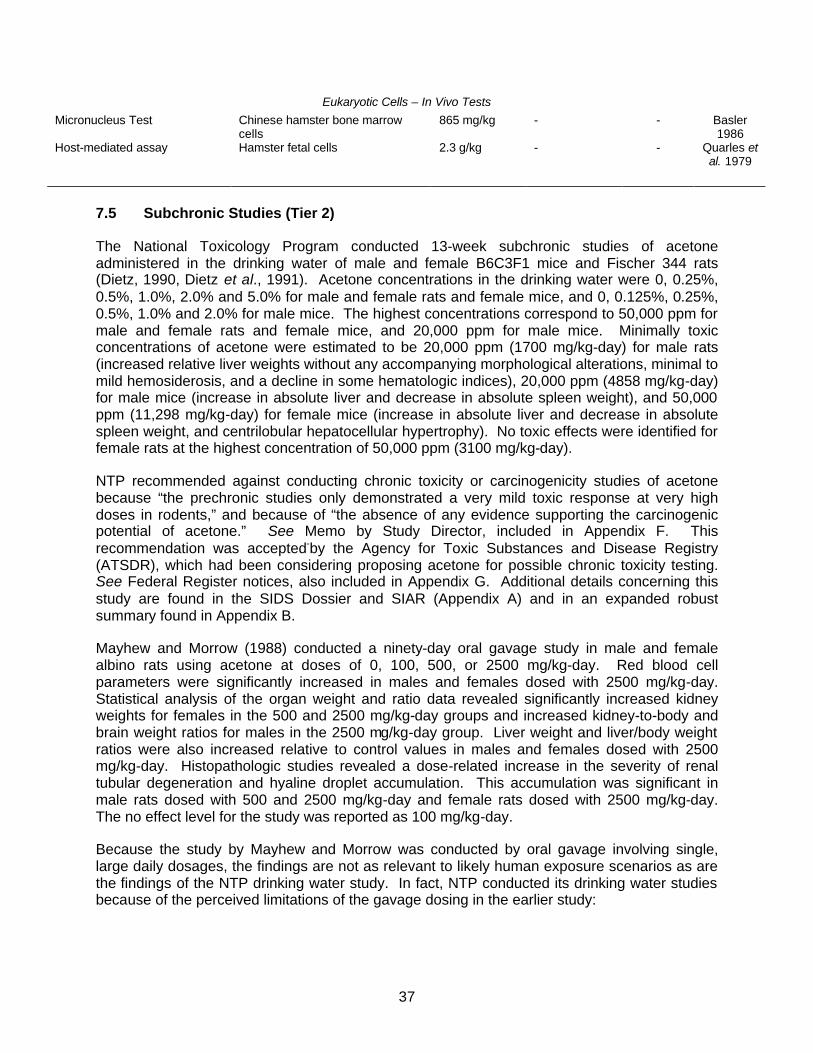
37
Eukaryotic Cells – In Vivo Tests Micronucleus Test Chinese hamster bone marrow
cells 865 mg/kg - - Basler
1986 Host-mediated assay Hamster fetal cells 2.3 g/kg - - Quarles et
al. 1979
7.5 Subchronic Studies (Tier 2)
The National Toxicology Program conducted 13-week subchronic studies of acetone administered in the drinking water of male and female B6C3F1 mice and Fischer 344 rats (Dietz, 1990, Dietz et al., 1991). Acetone concentrations in the drinking water were 0, 0.25%, 0.5%, 1.0%, 2.0% and 5.0% for male and female rats and female mice, and 0, 0.125%, 0.25%, 0.5%, 1.0% and 2.0% for male mice. The highest concentrations correspond to 50,000 ppm for male and female rats and female mice, and 20,000 ppm for male mice. Minimally toxic concentrations of acetone were estimated to be 20,000 ppm (1700 mg/kg-day) for male rats (increased relative liver weights without any accompanying morphological alterations, minimal to mild hemosiderosis, and a decline in some hematologic indices), 20,000 ppm (4858 mg/kg-day) for male mice (increase in absolute liver and decrease in absolute spleen weight), and 50,000 ppm (11,298 mg/kg-day) for female mice (increase in absolute liver and decrease in absolute spleen weight, and centrilobular hepatocellular hypertrophy). No toxic effects were identified for female rats at the highest concentration of 50,000 ppm (3100 mg/kg-day).
NTP recommended against conducting chronic toxicity or carcinogenicity studies of acetone because “the prechronic studies only demonstrated a very mild toxic response at very high doses in rodents,” and because of “the absence of any evidence supporting the carcinogenic potential of acetone.” See Memo by Study Director, included in Appendix F. This recommendation was accepted-by the Agency for Toxic Substances and Disease Registry (ATSDR), which had been considering proposing acetone for possible chronic toxicity testing. See Federal Register notices, also included in Appendix G. Additional details concerning this study are found in the SIDS Dossier and SIAR (Appendix A) and in an expanded robust summary found in Appendix B.
Mayhew and Morrow (1988) conducted a ninety-day oral gavage study in male and female albino rats using acetone at doses of 0, 100, 500, or 2500 mg/kg-day. Red blood cell parameters were significantly increased in males and females dosed with 2500 mg/kg-day. Statistical analysis of the organ weight and ratio data revealed significantly increased kidney weights for females in the 500 and 2500 mg/kg-day groups and increased kidney-to-body and brain weight ratios for males in the 2500 mg/kg-day group. Liver weight and liver/body weight ratios were also increased relative to control values in males and females dosed with 2500 mg/kg-day. Histopathologic studies revealed a dose-related increase in the severity of renal tubular degeneration and hyaline droplet accumulation. This accumulation was significant in male rats dosed with 500 and 2500 mg/kg-day and female rats dosed with 2500 mg/kg-day. The no effect level for the study was reported as 100 mg/kg-day.
Because the study by Mayhew and Morrow was conducted by oral gavage involving single, large daily dosages, the findings are not as relevant to likely human exposure scenarios as are the findings of the NTP drinking water study. In fact, NTP conducted its drinking water studies because of the perceived limitations of the gavage dosing in the earlier study:
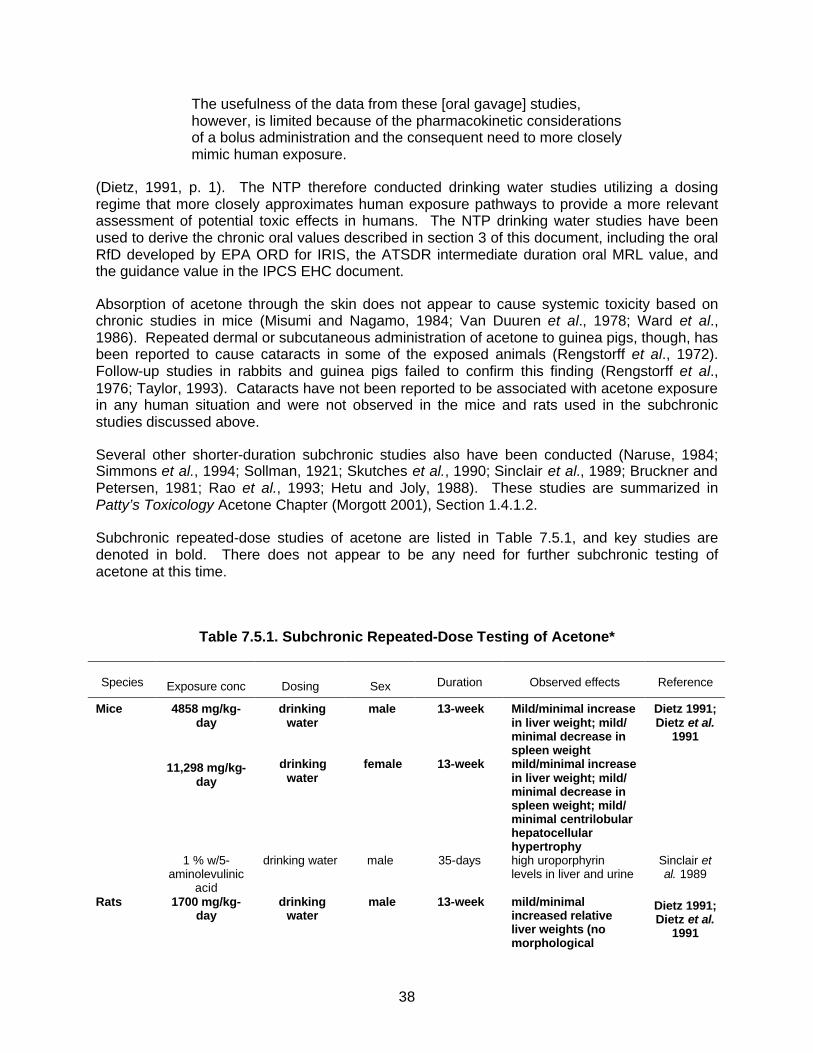
38
The usefulness of the data from these [oral gavage] studies, however, is limited because of the pharmacokinetic considerations of a bolus administration and the consequent need to more closely mimic human exposure.
(Dietz, 1991, p. 1). The NTP therefore conducted drinking water studies utilizing a dosing regime that more closely approximates human exposure pathways to provide a more relevant assessment of potential toxic effects in humans. The NTP drinking water studies have been used to derive the chronic oral values described in section 3 of this document, including the oral RfD developed by EPA ORD for IRIS, the ATSDR intermediate duration oral MRL value, and the guidance value in the IPCS EHC document.
Absorption of acetone through the skin does not appear to cause systemic toxicity based on chronic studies in mice (Misumi and Nagamo, 1984; Van Duuren et al., 1978; Ward et al., 1986). Repeated dermal or subcutaneous administration of acetone to guinea pigs, though, has been reported to cause cataracts in some of the exposed animals (Rengstorff et al., 1972). Follow-up studies in rabbits and guinea pigs failed to confirm this finding (Rengstorff et al., 1976; Taylor, 1993). Cataracts have not been reported to be associated with acetone exposure in any human situation and were not observed in the mice and rats used in the subchronic studies discussed above.
Several other shorter-duration subchronic studies also have been conducted (Naruse, 1984; Simmons et al., 1994; Sollman, 1921; Skutches et al., 1990; Sinclair et al., 1989; Bruckner and Petersen, 1981; Rao et al., 1993; Hetu and Joly, 1988). These studies are summarized in Patty’s Toxicology Acetone Chapter (Morgott 2001), Section 1.4.1.2.
Subchronic repeated-dose studies of acetone are listed in Table 7.5.1, and key studies are denoted in bold. There does not appear to be any need for further subchronic testing of acetone at this time.
Table 7.5.1. Subchronic Repeated-Dose Testing of Acetone*
Species
Exposure conc
Dosing
Sex
Duration
Observed effects
Reference
Mice 4858 mg/kg-day
drinking water
male 13-week Mild/minimal increase in liver weight; mild/ minimal decrease in spleen weight
Dietz 1991; Dietz et al.
1991
11,298 mg/kg-day
drinking water
female 13-week mild/minimal increase in liver weight; mild/ minimal decrease in spleen weight; mild/ minimal centrilobular hepatocellular hypertrophy
1 % w/5-aminolevulinic
acid
drinking water male 35-days high uroporphyrin levels in liver and urine
Sinclair et al. 1989
Rats 1700 mg/kg-day
drinking water
male 13-week mild/minimal increased relative liver weights (no morphological alternations);
Dietz 1991; Dietz et al.
1991

39
alternations); minimal/mild hemosiderosis; hematological indices
3100 mg/kg-day
drinking water
female 13-week none
2500 mg/kg-day
gavage male 90-day mild/minimal increased kidney-to-body, liver, liver-to-body & brain weight; red blood cell parameters
Mayhew & Morrow 1988
500 mg/kg-day gavage male 90-day mild/minimal renal tubular degeneration; hyaline droplet accumulation
2500 mg/kg-day
gavage female 90-day mild/minimal increased liver, liver-to-body weights; red blood cell parameters; renal tubular degeneration; hyaline droplet accumulation
500 mg/kg-day gavage female 90-day mild/minimal increased kidney weight
3.0% drinking water
male 7-day reversible lowering of rate of glucose oxidation
Skutches 1990
19,000 ppm inhalation both 3 hr/day, 8 weeks
slight, reversible decrease in brain & kidney weights
Bruckner & Petersen,
1981 2.5% drinking
water female 18-weeks decrease in water, food
consumption; decrease in weight gain
Sollman 1921
1% drinking water
female 2-weeks elevated cytochrome P-450 levels, increase in
p-nitrophenol hydroxylase, aniline hydroxylase, 7-ethoxycoumarin O-deethylase activity
Hetu & Joly, 1988
Guinea pigs
5% cutaneous, subcutaneous
both 3 days/week, 3-weeks
cataracts Rengstorff et al., 1972
1% dermal both twice daily, 5 days/week, 4 or 8 weeks
cataracts
0.5 mL dermal both 5 days/week, 6 weeks
cataracts Rengstorff et al., 1976
0.5 mL dermal both 5 days/week, 6 months
no cataracts, including during 2-year follow up
Taylor et al 1993
Rabbits 1 mL dermal both 3 days/week, 3 weeks
no cataracts, including during 6-month follow up
Rengstorff et al., 1976
*Key studies are denoted in bold. Robust summaries of the key studies are provided at Appendix B.
7.6 Reproductive Toxicity (Tiers 1 and 2)
Available acetone data are not indicative of a reproductive hazard. The data include a study showing no effect on the number of pregnancies, number of fetuses or testicular toxicity in which male rats were mated with untreated females after receiving 0.5% acetone in drinking water for six weeks (Larsen et al. 1991). A more recent study reported no reproductive effects
40
for male rats following doses up to 1000 mg acetone/kg body weight administered by gavage for nine weeks. Additionally, no male or female reproductive effects were observed following the administration of 0.5% acetone in drinking water to both sexes for nine weeks (dose equivalent to 1300 mg/kg) (Dalgaard et al. 1999). Subchronic studies also do not indicate reproductive organs are a target of acetone toxicity (Dietz 1990, Dietz et al. 1991). In addition, isopropanol has been shown to be extensively metabolized to acetone and the key study, a guideline 2-generation reproduction study for isopropanol, shows only minimal effects at very high doses (Bevan et al., 1995). Several supporting studies confirm this conclusion (Larsen et al. 1991, Dalgaard et al. 1999, BIBRA 1986a, Cox et al. 1975, Chapin et al. 1989, Heindel et al. 1991). A physiologically-based pharmacokinetic model for acetone and isopropanol also has recently been published, which supports the use of isopropanol data in this assessment (Clewell et al 2001).
Larsen et al. (1991) reported on a reproduction study in which male Wistar rats were administered 0.5% acetone in their drinking water for 6 weeks. The study was designed to examine the effects of acetone pre-treatment on 2,5-hexanedione-induced testicular damage and included both a water and an acetone control group. On the fifth week of the treatment regimen, the rats were allowed to mate with untreated females and the number of matings were recorded together with the number of pregnancies and the number of fetuses per pregnancy. The male rats were sacrificed after treatment and the absolute weight of the left testis was measured along with diameter of the seminiferous tubule. Semi-quantitative histopathological scoring was performed on the testis for the following possible effects: vacuoles, chromatic margination, epithelial disruption, multi-nucleated giant-cells, intertubular debris, and atrophy. A separate group of animals from each treatment category was allowed to complete a 10 week recovery period before being examined as described above. The authors reported that the acetone exposure did not produce any testicular toxicity when compared to the tap water control group. Acetone exposure also did not affect any measure of reproductive toxicity.
A recently published study showed no effect of acetone on male fertility or testes histopathology at doses up to 1% in the drinking water (Dalgaard, et al., 1999). The study was designed to evaluate the hypothesis the acetone might potentiate the testicular toxicity of di-(2-ethylhexyl)phthalate and included groups treated with acetone only for comparison to non-treated controls. Treatment with acetone at 1% in the drinking water for four weeks did not affect the body weight or organ weights including the seminal vesicle, testes, epididymides weights. In addition, acetone did not produce testicular atrophy or histopathological alterations in the testes nor did it significantly alter the number of males mating or number of females impregnated as compared to controls. A nine week study conducted prior to the four week study with treatment of males with 0.5% acetone in the drinking water produced no treatment-related changes in animals treated with acetone only.
Reproduction studies have also been performed with a mixture of acetone and 24 other contaminants commonly found in ground water. The mixture was administered via the drinking water at three levels by diluting a stock concentrate to obtain 1%, 5%, or 10% mixture. The concentration of acetone in the 10% mixture was amongst the highest of the 25 compounds tested (ca. 50 ppm). The three mixtures were used in two different reproduction studies. B6C3F1 mice were treated for 90 days to study the effects on gametogenesis (Chapin et al., 1989), and CD-1 mice were treated for about 18 weeks in a continuous breeding study (Heindel et al., 1991). The first study did not reveal any effects of the mixture on spermatogenesis and in the second study, only minimal effects were noted in the Fo and F1 generations. Details regarding the conduct of these experiments can be obtained from the original reports.
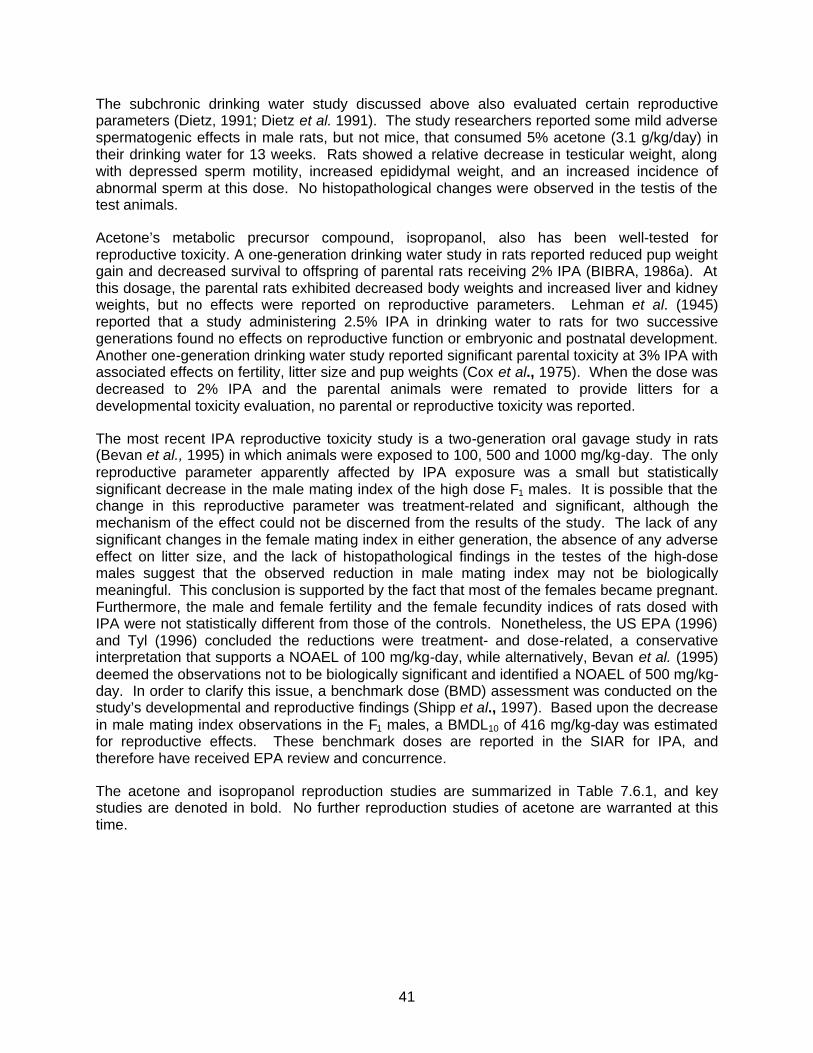
41
The subchronic drinking water study discussed above also evaluated certain reproductive parameters (Dietz, 1991; Dietz et al. 1991). The study researchers reported some mild adverse spermatogenic effects in male rats, but not mice, that consumed 5% acetone (3.1 g/kg/day) in their drinking water for 13 weeks. Rats showed a relative decrease in testicular weight, along with depressed sperm motility, increased epididymal weight, and an increased incidence of abnormal sperm at this dose. No histopathological changes were observed in the testis of the test animals.
Acetone’s metabolic precursor compound, isopropanol, also has been well-tested for reproductive toxicity. A one-generation drinking water study in rats reported reduced pup weight gain and decreased survival to offspring of parental rats receiving 2% IPA (BIBRA, 1986a). At this dosage, the parental rats exhibited decreased body weights and increased liver and kidney weights, but no effects were reported on reproductive parameters. Lehman et al. (1945) reported that a study administering 2.5% IPA in drinking water to rats for two successive generations found no effects on reproductive function or embryonic and postnatal development. Another one-generation drinking water study reported significant parental toxicity at 3% IPA with associated effects on fertility, litter size and pup weights (Cox et al., 1975). When the dose was decreased to 2% IPA and the parental animals were remated to provide litters for a developmental toxicity evaluation, no parental or reproductive toxicity was reported.
The most recent IPA reproductive toxicity study is a two-generation oral gavage study in rats (Bevan et al., 1995) in which animals were exposed to 100, 500 and 1000 mg/kg-day. The only reproductive parameter apparently affected by IPA exposure was a small but statistically significant decrease in the male mating index of the high dose F1 males. It is possible that the change in this reproductive parameter was treatment-related and significant, although the mechanism of the effect could not be discerned from the results of the study. The lack of any significant changes in the female mating index in either generation, the absence of any adverse effect on litter size, and the lack of histopathological findings in the testes of the high-dose males suggest that the observed reduction in male mating index may not be biologically meaningful. This conclusion is supported by the fact that most of the females became pregnant. Furthermore, the male and female fertility and the female fecundity indices of rats dosed with IPA were not statistically different from those of the controls. Nonetheless, the US EPA (1996) and Tyl (1996) concluded the reductions were treatment- and dose-related, a conservative interpretation that supports a NOAEL of 100 mg/kg-day, while alternatively, Bevan et al. (1995) deemed the observations not to be biologically significant and identified a NOAEL of 500 mg/kg-day. In order to clarify this issue, a benchmark dose (BMD) assessment was conducted on the study’s developmental and reproductive findings (Shipp et al., 1997). Based upon the decrease in male mating index observations in the F1 males, a BMDL10 of 416 mg/kg-day was estimated for reproductive effects. These benchmark doses are reported in the SIAR for IPA, and therefore have received EPA review and concurrence.
The acetone and isopropanol reproduction studies are summarized in Table 7.6.1, and key studies are denoted in bold. No further reproduction studies of acetone are warranted at this time.
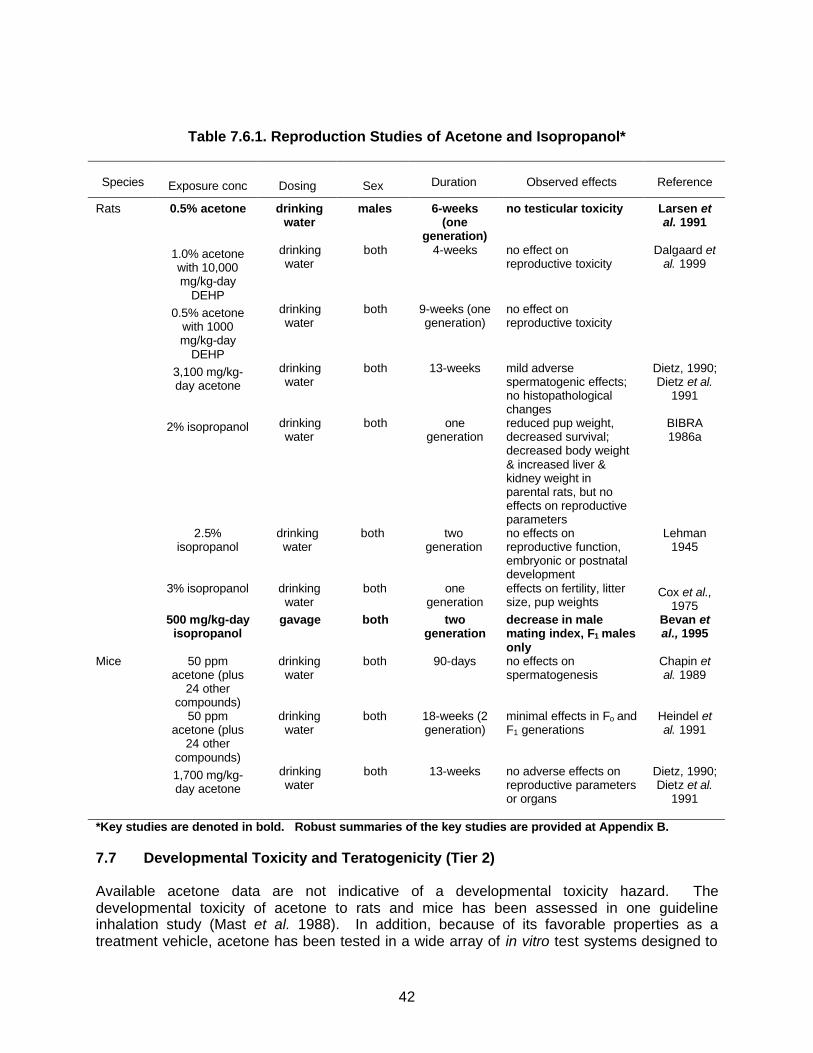
42
Table 7.6.1. Reproduction Studies of Acetone and Isopropanol*
Species
Exposure conc
Dosing
Sex
Duration
Observed effects
Reference
Rats 0.5% acetone drinking water
males 6-weeks (one
generation)
no testicular toxicity Larsen et al. 1991
1.0% acetone with 10,000 mg/kg-day
DEHP
drinking water
both 4-weeks no effect on reproductive toxicity
Dalgaard et al. 1999
0.5% acetone with 1000 mg/kg-day
DEHP
drinking water
both 9-weeks (one generation)
no effect on reproductive toxicity
3,100 mg/kg-day acetone
drinking water
both 13-weeks mild adverse spermatogenic effects; no histopathological changes
Dietz, 1990; Dietz et al.
1991
2% isopropanol drinking water
both one generation
reduced pup weight, decreased survival; decreased body weight & increased liver & kidney weight in parental rats, but no effects on reproductive parameters
BIBRA 1986a
2.5% isopropanol
drinking water
both two generation
no effects on reproductive function, embryonic or postnatal development
Lehman 1945
3% isopropanol drinking water
both one generation
effects on fertility, litter size, pup weights
Cox et al., 1975
500 mg/kg-day isopropanol
gavage both two generation
decrease in male mating index, F1 males only
Bevan et al., 1995
Mice 50 ppm acetone (plus
24 other compounds)
drinking water
both 90-days no effects on spermatogenesis
Chapin et al. 1989
50 ppm acetone (plus
24 other compounds)
drinking water
both 18-weeks (2 generation)
minimal effects in Fo and F1 generations
Heindel et al. 1991
1,700 mg/kg-day acetone
drinking water
both 13-weeks no adverse effects on reproductive parameters or organs
Dietz, 1990; Dietz et al.
1991 *Key studies are denoted in bold. Robust summaries of the key studies are provided at Appendix B.
7.7 Developmental Toxicity and Teratogenicity (Tier 2)
Available acetone data are not indicative of a developmental toxicity hazard. The developmental toxicity of acetone to rats and mice has been assessed in one guideline inhalation study (Mast et al. 1988). In addition, because of its favorable properties as a treatment vehicle, acetone has been tested in a wide array of in vitro test systems designed to
43
assess adverse effects on developing embryos. Furthermore, the developmental toxicity of acetone’s metabolic precursor, isopropanol, has been tested in several supporting oral and inhalation studies (Cox et al. 1975, BIBRA 1986b, Nelson et al. 1988, Tyl et al. 1994). As noted above, physiologically-based pharmacokinetic model for acetone and isopropanol also has recently been published, which supports the use of isopropanol data in this assessment (Clewell at al 2001).
Mast et al., (1988) studied the potential for acetone vapors to cause developmental toxicity in Sprague-Dawley rats and Swiss CD-1 mice. Groups of 32 positively mated rats were exposed by inhalation to 0, 440, 2200, or 11,000 ppm of acetone on days 6 through 19 of gestation. The groups of mice were exposed at concentrations of 0, 440, 2200 or 6600 ppm of acetone on days 6 through 17 of gestation. The exposure sessions lasted 6 hrs/day and were performed 7 days/week. Groups of ten virgin female mice and rats were included for comparison purposes. The rats were sacrificed on day 20 of gestation and the mice on day 18. The authors concluded that 2200 ppm of acetone was the no-observable-effect level (NOEL) for developmental toxicity in both rats and mice.
In the rats, the only clinical signs observed were a statistically significant reduction in maternal body weight gain starting at gestation day 14 and a decrease in the uterine and extra-gestational weight gain. In addition, the fetal weights were found to be significantly lower for the 11,000 ppm group relative to the 0 ppm group. Mean body weights of treated virgin females were also reduced, but not significantly. No effect was seen in the mean liver or kidney weights of pregnant dams, the organ to body weight ratios, the number of implantations, mean percent of live pups per litter, the mean percent of resorptions per litter, or the fetal sex ratio. The incidence of fetal malformations was not significantly increased by gestational exposure to acetone vapors, although the percent of litters with at least one pup exhibiting malformations was greater for the 11,000 ppm group than for the 0 ppm group, 11.5 and 3.8%, respectively.
In mice, no treatment-related effects were seen on maternal or virgin body weight, or maternal uterine weight. There was a treatment-related increase in liver to body weight ratio in pregnant dams. A statistically significant reduction in fetal weight, and a slight, but statistically significant increase in the percent incidence of late resorptions, was seen in mice of the 6600 ppm exposure group. The increase in the incidence of late resorptions did not affect the mean number of live fetuses per litter. The incidence of malformations in mice was not altered by gestational exposure at any of the exposure levels.
As noted by Gentry et al. (2003, in press), a higher NOAEL could very likely have been demonstrated by Mast et al. for both mice and rats, had additional doses or a higher mid-dose been used. This possibility is supported by the mild effects seen at the highest exposures of 6600 ppm in mice and 11,000 ppm in rats.
Because of its favorable properties as a treatment vehicle, acetone has been tested in a wide array of in vitro test systems designed to detect any adverse effects on a developing embryo. These tests have generally focused on the chick and hamster embryos as a target system for measuring adverse effects of a chemical on growth or structural development. In many cases, acetone was used as a treatment vehicle for administering water insoluble compounds, and was therefore examined in a vehicle-treated control group. In all cases, adverse effects from acetone were observed only at very high concentrations. (McLaughlin et al., 1963, 1964; Swartz, 1981; Quarles et al., 1979; Strange et al., 1976; Kitchin and Ebron, 1984a, 1984b).
44
The two-generation IPA reproductive toxicity study in rats (Bevan et al., 1995) also evaluated developmental parameters. As noted above, animals were exposed to 100, 500 and 1000 mg/kg-day. Offspring body weight was reduced during the early postnatal period in the 1000 mg/kg-day F1 males and the 1000 mg/kg-day F2 pups of both sexes. Exposure to 1000 mg/kg-day and, to a lesser extent, 500 mg/kg-day resulted in a reduction in postnatal survival in both F1 and F2 litters. The biological significance of the postnatal effects in the 500 mg/kg treatment group is uncertain, but the US EPA (1996) and Tyl (1996) concluded the reductions were treatment- and dose-related, a conservative interpretation that supports a NOAEL of 100 mg/kg-day, while Bevan et al. (1995) deemed the observations not to be biologically significant and identified a NOAEL of 500 mg/kg-day. In order to clarify this issue, a benchmark dose (BMD) assessment was conducted on the study’s developmental and reproductive findings (Shipp et al., 1997). For the offspring developmental effects, BMD dosages (BMDL5) of 449 and 418 mg/kg-day were estimated for the F1, and F2 generations, respectively. These benchmark doses are reported in the SIAR for IPA, and therefore have received EPA review and concurrence.
Acetone developmental toxicity studies and additional isopropanol studies are summarized in Table 7.7.1, and key studies are denoted in bold. Further developmental toxicity testing for acetone appears unnecessary at this time.
Table 7.7.1. Developmental Toxicity Studies*
Species
Exposure conc
Dosing
Duration
Observed effects
Reference
Rats 11,000 ppm acetone inhalation gd 6-19 reduction in maternal body weight gain; reduction in fetal weight
Mast et al. 1988
449 mg/kg-day isopropanol (F1 BMDL5); 418 mg/kg-
day (F2 BMDL5)
drinking water
two generation
postnatal survival Shipp et al. 1996
Mice 6600 ppm acetone inhalation gd 6-17 increase in maternal liver to body weight ratio; reduction in fetal weight; slight increase in incidence of late resorptions
Mast et al. 1988
*Key studies are denoted in bold. Robust summaries of the key studies are provided at Appendix B.
7.8 Immuntoxicity (Tier 2)
An immunotoxicity study of acetone has recently been conducted using the test guideline specified in the VCCEP Pilot Announcement. This study exposed CD-1 mice to 0, 600, 3000 or 6000 ppm acetone via drinking water for 28 days (equating to approximately 0, 100, 500 and 1000 mg/kg-day). The study evaluated anti-SRBC antibody response (including spleen weights and spleen cell counts), as well as hematology parameters and thymus weights. Acetone produced no immunotoxic effects in this study. A robust summary of this study is provided in Appendix B. (A full copy of the study will be provided upon request.)
No further immunotoxicity testing for acetone is needed at this time.
7.9 Carcinogenicity (Tier 3)
A two-year chronic bioassay of acetone via the oral or inhalation routes of exposure has not been performed to date. As previously described, NTP decided against conducting chronic studies because of the minimal toxicity seen at high doses in the subchronic studies, and because of “the absence of any evidence supporting the carcinogenic potential for acetone.”
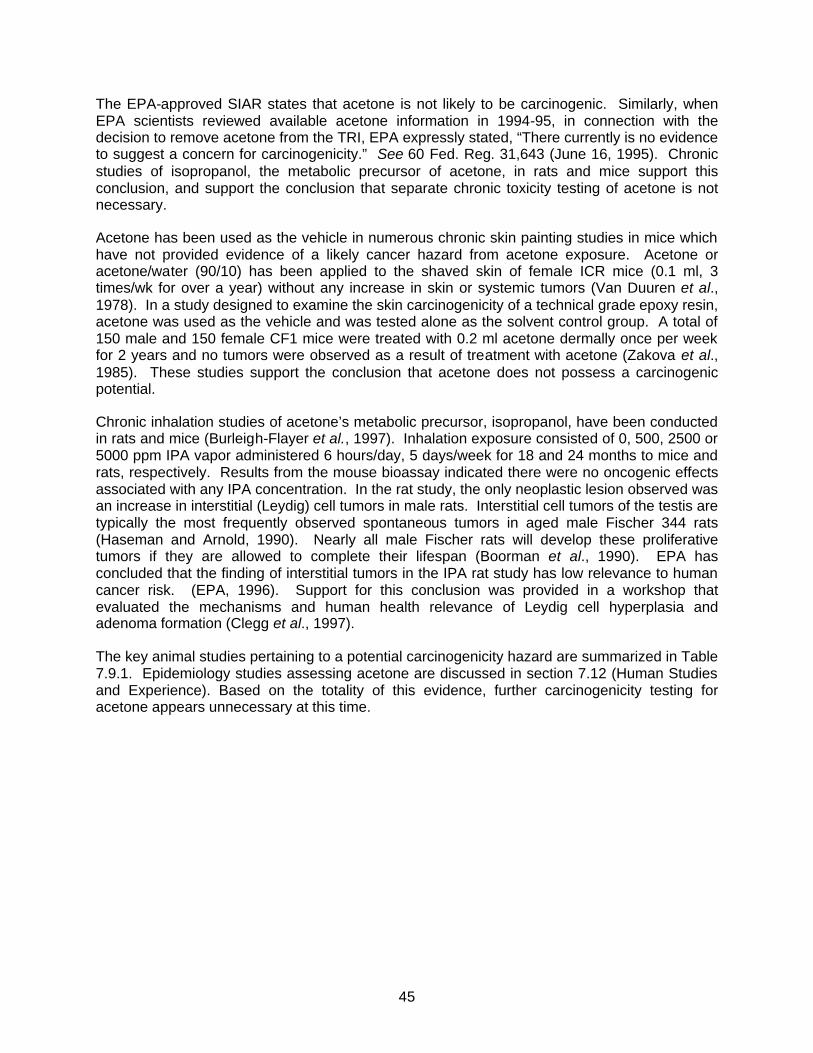
45
The EPA-approved SIAR states that acetone is not likely to be carcinogenic. Similarly, when EPA scientists reviewed available acetone information in 1994-95, in connection with the decision to remove acetone from the TRI, EPA expressly stated, “There currently is no evidence to suggest a concern for carcinogenicity.” See 60 Fed. Reg. 31,643 (June 16, 1995). Chronic studies of isopropanol, the metabolic precursor of acetone, in rats and mice support this conclusion, and support the conclusion that separate chronic toxicity testing of acetone is not necessary.
Acetone has been used as the vehicle in numerous chronic skin painting studies in mice which have not provided evidence of a likely cancer hazard from acetone exposure. Acetone or acetone/water (90/10) has been applied to the shaved skin of female ICR mice (0.1 ml, 3 times/wk for over a year) without any increase in skin or systemic tumors (Van Duuren et al., 1978). In a study designed to examine the skin carcinogenicity of a technical grade epoxy resin, acetone was used as the vehicle and was tested alone as the solvent control group. A total of 150 male and 150 female CF1 mice were treated with 0.2 ml acetone dermally once per week for 2 years and no tumors were observed as a result of treatment with acetone (Zakova et al., 1985). These studies support the conclusion that acetone does not possess a carcinogenic potential.
Chronic inhalation studies of acetone’s metabolic precursor, isopropanol, have been conducted in rats and mice (Burleigh-Flayer et al., 1997). Inhalation exposure consisted of 0, 500, 2500 or 5000 ppm IPA vapor administered 6 hours/day, 5 days/week for 18 and 24 months to mice and rats, respectively. Results from the mouse bioassay indicated there were no oncogenic effects associated with any IPA concentration. In the rat study, the only neoplastic lesion observed was an increase in interstitial (Leydig) cell tumors in male rats. Interstitial cell tumors of the testis are typically the most frequently observed spontaneous tumors in aged male Fischer 344 rats (Haseman and Arnold, 1990). Nearly all male Fischer rats will develop these proliferative tumors if they are allowed to complete their lifespan (Boorman et al., 1990). EPA has concluded that the finding of interstitial tumors in the IPA rat study has low relevance to human cancer risk. (EPA, 1996). Support for this conclusion was provided in a workshop that evaluated the mechanisms and human health relevance of Leydig cell hyperplasia and adenoma formation (Clegg et al., 1997).
The key animal studies pertaining to a potential carcinogenicity hazard are summarized in Table 7.9.1. Epidemiology studies assessing acetone are discussed in section 7.12 (Human Studies and Experience). Based on the totality of this evidence, further carcinogenicity testing for acetone appears unnecessary at this time.
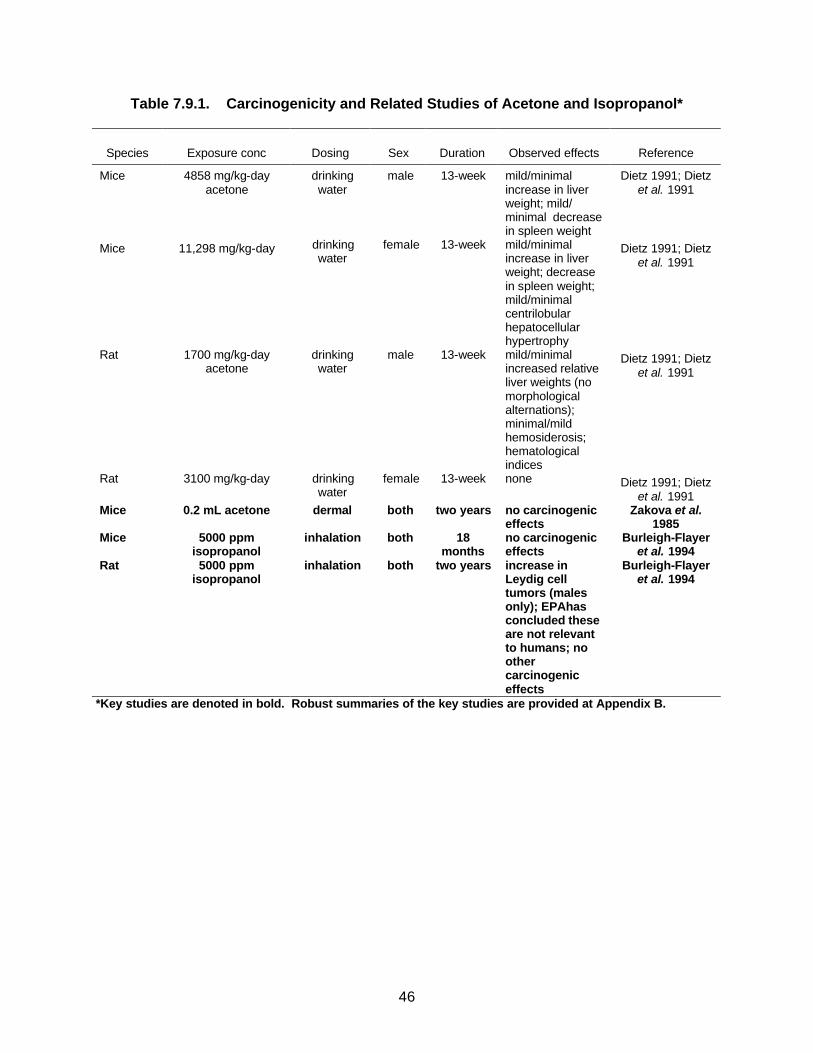
46
Table 7.9.1. Carcinogenicity and Related Studies of Acetone and Isopropanol*
Species
Exposure conc
Dosing
Sex
Duration
Observed effects
Reference
Mice 4858 mg/kg-day acetone
drinking water
male 13-week mild/minimal increase in liver weight; mild/ minimal decrease in spleen weight
Dietz 1991; Dietz et al. 1991
Mice 11,298 mg/kg-day drinking water
female 13-week mild/minimal increase in liver weight; decrease in spleen weight; mild/minimal centrilobular hepatocellular hypertrophy
Dietz 1991; Dietz et al. 1991
Rat 1700 mg/kg-day acetone
drinking water
male 13-week mild/minimal increased relative liver weights (no morphological alternations); minimal/mild hemosiderosis; hematological indices
Dietz 1991; Dietz et al. 1991
Rat 3100 mg/kg-day drinking water
female 13-week none Dietz 1991; Dietz et al. 1991
Mice 0.2 mL acetone dermal both two years no carcinogenic effects
Zakova et al. 1985
Mice 5000 ppm isopropanol
inhalation both 18 months
no carcinogenic effects
Burleigh-Flayer et al. 1994
Rat 5000 ppm isopropanol
inhalation both two years increase in Leydig cell tumors (males only); EPAhas concluded these are not relevant to humans; no other carcinogenic effects
Burleigh-Flayer et al. 1994
*Key studies are denoted in bold. Robust summaries of the key studies are provided at Appendix B.

47
7.10 Neurotoxicity (Tier 3)
It is well-known that high acute exposures to acetone can cause transient effects on the central nervous system. See discussion in section 7.2. Available data demonstrate a low potential for effects on the nervous system for repeated exposures at lower doses. As noted previously, in 1995 EPA concluded, “There are no data sufficient to support a chronic concern for significant irreversible neurotoxicity.” (See section 3.3). Similarly, the EPA-approved SIAR concludes that acetone has “a low potential for neurological risk to humans.” (p. 30) These conclusions are supported by a substantial body of information, including several guideline studies conducted with isopropanol, the metabolic precursor of acetone. Additional neurotoxicity testing of acetone therefore is not warranted at this time.
The subchronic studies (discussed in section 7.5) provide important information on the neurotoxic potential of acetone (Mayhew and Morrow, 1988; Dietz, 1990, Dietz et al., 1991). Both studies required daily clinical observation of the animals, including close examination for signs of physical and neurological decrements. The Mayhew and Morrow study in rats also included a histological analysis of spinal cord (mid-thoracic), sciatic nerve, and brain (cerebrum, cerebellum, and brainstem) in all dead, moribund, and high-dose rats. In the NTP study in rats and mice, the brain and spinal cord were examined histologically in the control and high dose groups, and the sciatic nerves from animals where neurological signs were observed also were examined. A review of the results from both of these studies showed no evidence of adverse neurological effects from acetone exposure.
Goldberg et al. (1964) recorded mild neurobehavioral changes in female Carworth rats exposed for two weeks (5 days/wk, 4 hr/day) to 3000, 6000, 12,000 or 16,000 ppm of acetone. Repeated exposures to 6000 ppm acetone inhibited avoidance behavior but did not produce any signs of motor imbalance. Acetone concentrations of 12,000 or 16,000 ppm produced ataxia in several animals on the first exposure date. However, rapid tolerance developed, and ataxia was not seen on subsequent days. Kurnayeva et al. (1986) studied the combined effect of vapors and noise on the immune, cardiovascular, endocrine and nervous systems of Wistar rats exposed for 1.5 to 2.0 months. The animals were exposed (5 days/wk, 4 hr/day) to 2000 mg/m3 (843 ppm) of acetone and 85 Db of noise. The combined exposure was reportedly without effect on the various measures of physiological function.
In addition to the studies cited above, Spencer et al. (1978) performed a structure-activity study with ten ketone, dione, or diol-type solvents to determine the molecular structure necessary to cause central-peripheral distal axonopathy, also known as dying-back neuropathy. A small group of rats received 5000 ppm of acetone in their drinking water for over eight weeks; the concentration was then increased to 10,000 ppm for another four weeks. Upon termination of treatment, tissue from the central and peripheral nervous system was removed and examined histologically for pathological changes. Unlike several of the solvents used in this study, acetone was not found to cause any evidence of dying-back neuropathy in rats.
Misumi and Nagano (1984) performed a neurophysiological study of mice treated subcutaneously with acetone. Male mice treated for 15 weeks (5 days/wk) with a 400 mg/kg-day dose of acetone showed no evidence of neurological dysfunction relative to control animals. The acetone treatment did not cause any difficulty in walking or dullness in movement, and there were no significant changes in motor or sensory nerve conduction velocities. The authors concluded that acetone was not neurotoxic to the peripheral nervous system.

48
Since the SIAR was prepared, a scheduled control operant behavior (SCOB) study was conducted under an enforceable consent agreement and submitted to EPA. The study showed no adverse neurological effects at the highest dose tested, 1,500 ppm (3,560 mg/m3) (Christoph, 1997).
Dick et al. (1988, 1989) performed a series of neurobehavioral studies on groups of about 20 male and female volunteers who were exposed to either 250 ppm of acetone for 4 hours or to a combination of 125 ppm acetone and 200 ppm methyl ethyl ketone (MEK) for 4 hours. Four psychomotor tests, one sensorimotor test, and one psychological test were performed on the subjects before, during and after the exposure session. The acetone-exposed subjects had statistically significantly different responses in a dual auditory tone discrimination compensatory tracking test and a profile of mood states (POMS) test. Relative to pre-exposure control values, 250 ppm acetone exposure caused an increase in both the response time and the percentage of incorrect responses in the auditory tone portion of the dual discrimination task when the stimuli were presented in series. The response measurements were not affected by the exposure when both portions of the dual task were presented simultaneously. Male subjects who took the POMS test showed an increase in the anger-hostility score. Except for a small change in the percentage of incorrect responses in the dual auditory discrimination test, none of these effects were noted when the subjects were exposed to the acetone-MEK mixture. The authors noted that the results of their study needed careful interpretation and that additional research was needed to detect more distinct declines in human performance.
Stewart et al. (1975) examined the neurotoxic effects of repetitive exposures to acetone vapors in male and female volunteers using a variety of treatment regimens. Two series of experiments were performed. In the first series, two small groups of male subjects were exposed to each of four vapor concentrations (0, 200, 1000 or 1250 ppm) for either 3.0 or 7.5 hours per day for 4 days/week (the first day of each week was a control exposure at 0 ppm). The groups were exposed to progressively higher vapor levels of acetone in each succeeding week of treatment. Following the fourth week of exposure at 1250 ppm of acetone, the two groups were given a fifth week of exposure at 0 ppm, and then a final week where the vapor concentration was allowed to fluctuate between 750 and 1250 ppm (1000 ppm, average) on each of four exposure days. The second series of studies was performed on groups of female subjects who were exposed to 1000 ppm of acetone for either 1.0, 3.0 or 7.5 hours per day for 4 days/week. A battery of neurophysiological and neurobehavioral tests were performed at various times throughout the exposures. The neurophysiological tests included spontaneous electroencephalograms, visually evoked response using a strobe light, and a Romberg heel-to-toe equilibrium examination. Cognitive neurobehavioral testing included an arithmetic test, a coordination test, and a visual inspection test. Male subjects exposed to 1250 ppm acetone for 7.5 hours/day showed a statistically significant increase in the amplitude of the visually evoked response compared to background values. However, these results do not implicate an effect at concentrations below 1000 ppm.
The neurotoxic potential of acetone’s metabolic precursor, IPA, also has been assessed in several studies, including guideline studies conducted under a TSCA test rule. Burleigh-Flayer et al. (1994a) conducted a subchronic neurotoxicity study with rats exposed to 0, 100, 500, 1500 or 5000 ppm IPA vapor for 6 hours per day, 5 days per week for 13 weeks. Narcosis was reported during exposure for some of the high dose rats but no changes were observed in any of the parameters of the functional observational battery (FOB) or in the neuropathological examination for any treatment level. An increase in motor activity was detected at 5000 ppm, but only for the females on weeks 9 and 13. Evidence of hyperexcitability was not present
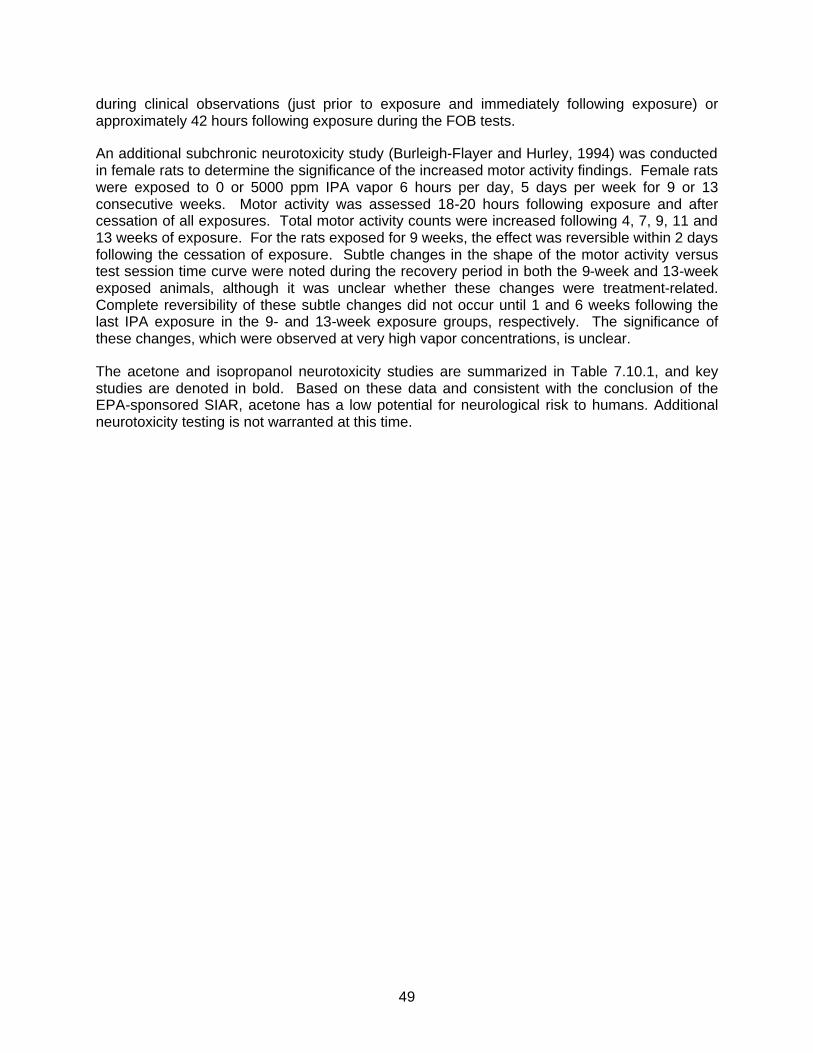
49
during clinical observations (just prior to exposure and immediately following exposure) or approximately 42 hours following exposure during the FOB tests.
An additional subchronic neurotoxicity study (Burleigh-Flayer and Hurley, 1994) was conducted in female rats to determine the significance of the increased motor activity findings. Female rats were exposed to 0 or 5000 ppm IPA vapor 6 hours per day, 5 days per week for 9 or 13 consecutive weeks. Motor activity was assessed 18-20 hours following exposure and after cessation of all exposures. Total motor activity counts were increased following 4, 7, 9, 11 and 13 weeks of exposure. For the rats exposed for 9 weeks, the effect was reversible within 2 days following the cessation of exposure. Subtle changes in the shape of the motor activity versus test session time curve were noted during the recovery period in both the 9-week and 13-week exposed animals, although it was unclear whether these changes were treatment-related. Complete reversibility of these subtle changes did not occur until 1 and 6 weeks following the last IPA exposure in the 9- and 13-week exposure groups, respectively. The significance of these changes, which were observed at very high vapor concentrations, is unclear.
The acetone and isopropanol neurotoxicity studies are summarized in Table 7.10.1, and key studies are denoted in bold. Based on these data and consistent with the conclusion of the EPA-sponsored SIAR, acetone has a low potential for neurological risk to humans. Additional neurotoxicity testing is not warranted at this time.
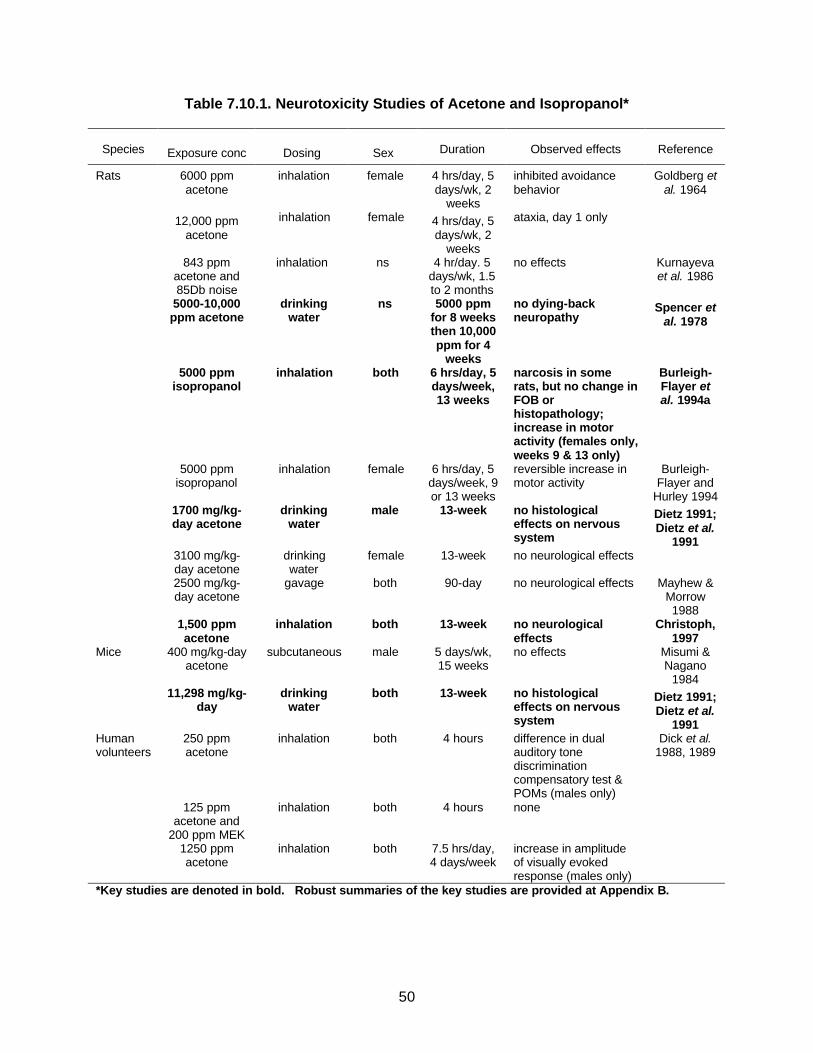
50
Table 7.10.1. Neurotoxicity Studies of Acetone and Isopropanol*
Species
Exposure conc
Dosing
Sex
Duration
Observed effects
Reference
Rats 6000 ppm acetone
inhalation female 4 hrs/day, 5 days/wk, 2
weeks
inhibited avoidance behavior
Goldberg et al. 1964
12,000 ppm acetone
inhalation female 4 hrs/day, 5 days/wk, 2
weeks
ataxia, day 1 only
843 ppm acetone and 85Db noise
inhalation ns 4 hr/day. 5 days/wk, 1.5 to 2 months
no effects Kurnayeva et al. 1986
5000-10,000 ppm acetone
drinking water
ns 5000 ppm for 8 weeks then 10,000 ppm for 4
weeks
no dying-back neuropathy
Spencer et al. 1978
5000 ppm isopropanol
inhalation both 6 hrs/day, 5 days/week, 13 weeks
narcosis in some rats, but no change in FOB or histopathology; increase in motor activity (females only, weeks 9 & 13 only)
Burleigh-Flayer et al. 1994a
5000 ppm isopropanol
inhalation female 6 hrs/day, 5 days/week, 9 or 13 weeks
reversible increase in motor activity
Burleigh-Flayer and
Hurley 1994 1700 mg/kg-
day acetone drinking
water male 13-week no histological
effects on nervous system
Dietz 1991; Dietz et al.
1991 3100 mg/kg-
day acetone drinking water
female 13-week no neurological effects
2500 mg/kg-day acetone
gavage both 90-day no neurological effects Mayhew & Morrow 1988
1,500 ppm acetone
inhalation both 13-week no neurological effects
Christoph, 1997
Mice 400 mg/kg-day acetone
subcutaneous male 5 days/wk, 15 weeks
no effects Misumi & Nagano
1984 11,298 mg/kg-
day drinking
water both 13-week no histological
effects on nervous system
Dietz 1991; Dietz et al.
1991 Human volunteers
250 ppm acetone
inhalation both 4 hours difference in dual auditory tone discrimination compensatory test & POMs (males only)
Dick et al. 1988, 1989
125 ppm acetone and
200 ppm MEK
inhalation both 4 hours none
1250 ppm acetone
inhalation both 7.5 hrs/day, 4 days/week
increase in amplitude of visually evoked response (males only)
*Key studies are denoted in bold. Robust summaries of the key studies are provided at Appendix B.

51
7.11 Developmental Neurotoxicity (Tier 3)
Acetone has not been the subject of a separate developmental neurotoxicity study. The totality of scientific evidence available for acetone is not suggestive of a likely developmental neurotoxicity hazard. This conclusion is supported by a negative developmental neurotoxicity study of isopropanol in rats.
The potential of IPA, the metabolic precursor of acetone, to induce neurotoxicity was evaluated in developing rats in a guideline study conducted under a TSCA test rule. 64 timed pregnant CD (Sprague-Dawley) rats per dose were given IPA by gavage on gestation day 6 through postnatal day (pnd) 21. The dose levels were 0, 200, 700 and 1200 mg/kg-day. Dams were sacrificed pnd 22. One male and one female pup from each litter were assigned to each of 3 behavioral tests: motor activity pnd 13-58, auditory startle response pnd 22 and 60, and learning and memory pnd 60-64. There was one maternal death in the 1200 mg/kg-day group. The only effect noted, mean food consumption, was seen in females in the 700 mg/kg-day group and was significantly increased only for pnd 0-3. There were no exposure-related clinical signs apparent in maternal animals and the length of gestation was equivalent across all the groups. There was no evidence of developmental neurotoxicity. The NOAEL was 700 mg/kg for maternal toxicity and 1200 mg/kg for developmental neurotoxicity. In conclusion, there was no developmental neurotoxicity even at maternity toxic doses. (Bates, 1991). Based on the PBPK model for IPA of Clewell et al., (2001) this dose of 1200 mg/kg-day would deliver an AUC for acetone blood concentrations approximately equivalent that of an oral dose of 800 mg/kg-day dose of acetone alone.
The key developmental neurotoxicity study is summarized in Table 7.11.1. The results of that study, coupled with the extensive neurotoxicity data on acetone and IPA, demonstrate that acetone is unlikely to be a developmental neurotoxicant. Additional developmental neurotoxicity testing on acetone appears not to be warranted at this time.
Table 7.11.1 Developmental Neurotoxicity*
Species
Exposure conc
Dosing
Sex
Duration
Observed effects
Reference
Rat 1200 mg/kg-day isopropanol
gavage both gd 6 – pnd 21
no developmental neurotoxic effects
Bates, 1991
*Key study is denoted in bold. Robust summaries of the key studies are provided at Appendix B.
7.12 Human Studies and Experience
The human data show that acetone is a low toxicity chemical and that the human body can readily assimilate external acetone exposures, in addition to its own endogenous production. The principal adverse acute human health effects associated with exposure to high concentrations of acetone vapor are sensory irritation of the eyes, nose, throat and central nervous system. If the exposure involves an extremely large amount of the chemical, such as in an accidental ingestion scenario, an individual may experience temporary fatigue, irritability, dizziness, breathing irregularities, gastrointestinal disturbances and a temporary loss of consciousness. Available data and human experience does not indicate greater sensitivity to acetone among children.
52
Gamis and Wasserman (1988) presented a case report describing the accidental ingestion of acetone by a young child. A 2.5-year-old child consumed nearly all of a six-ounce bottle of fingernail polish remover that contained 65% acetone and 10% isopropanol. The child was unconscious when found in his home and began having a seizure while being taken to a hospital. Phenobarbital was used to control the seizure, but the patient was still unresponsive when examined at the hospital approximately 45 minutes after being discovered. Notable clinical findings during the first 24 hours included acetonuria, acetonemia, metabolic acidosis, respiratory depression, hypothermia, and hyperglycemia. The patient gradually regained consciousness by the second day; however, evidence of acetonuria, hyperglycemia, and an acid-base imbalance were still detected. These conditions returned to normal three days after arrival, and the patient was discharged on the fourth day after a neurological examination showed no abnormalities. Acetone blood levels at 1, 18, 48, and 72 hours after the onset of symptoms were 4450, 2650, 420, and 40 mg/L, respectively. These initial blood levels are among the highest ever found in any human, and their decline tended to closely follow the course of recovery. A six-month follow-up examination showed no signs of neurodevelopmental complications.
Recently, the medical community has begun to investigate the use of ketogenic diets (KD) as a mechanism to reduce the frequency and severity of epileptic attacks in infants and children with recalcitrant refractory epilepsy. The KD is a high protein/high fat - low carbohydrate diet and KD based infant formulas have been administered to newborns. Researchers have shown that epileptic children on KD had no negative health impacts other than transient digestive system effects, and that they continued to develop normally even while on the diet for several years (Kossoff, et al., 2002).
During the administration of KD, measurements of acetone in blood, urine and exhaled breath are made to confirm that the diets have placed the infants and children into a ketogenic state (Kossoff et al., 2002; DiMario and Holland, 2002, Musa-Veloso et al., 2002). Muso-Veloso et al. measured fasting breath acetone levels in epileptic children on the KD, epileptic children not on the KD and healthy controls. The average breath acetone levels were 2530 +/- 600 nmol/L (146 µg/L +/- 35 µg/L), 19 +/- 9 nmol/L (1.1 µg/L, +/- 0.52 µg/L), and 21+/- 4 nmol/L (1.2 µg/L +/- 0.23 µg/L), for each group respectively. The levels of acetone in the healthy controls and the untreated epileptic children are similar to those reported in other studies (Nelson et al., 1998). In contrast, the levels in the children on the KD were 125 fold higher (Musa-Veloso, et al., 2002).
These data support the conclusion that children are not more sensitive to acetone. Rather, acetone production occurs in all children and adults, and the endogenous levels of acetone in the body vary from child to child and over time. Elevated production rates of acetone are associated with normal physiologic conditions and therapeutic diets intended to induce high levels of acetone production are not associated with adverse effects.
Epidemiology Studies
Ott et al., (1983a, 1983b, and 1983c) conducted two occupational studies that are relevant to acetone. In the first study, the causes of mortality were determined for workers from a fibers plant. The study was designed to examine the health of employees occupationally exposed to methylene chloride, but population comparison groups were used that were exposed to acetone. Comparative mortality between the acetone exposed workers and the general U.S. population is shown in Table 7.12.1. These data indicate a lower than expected mortality from all causes and a lower than expected mortality from cancer and cardiovascular disease.
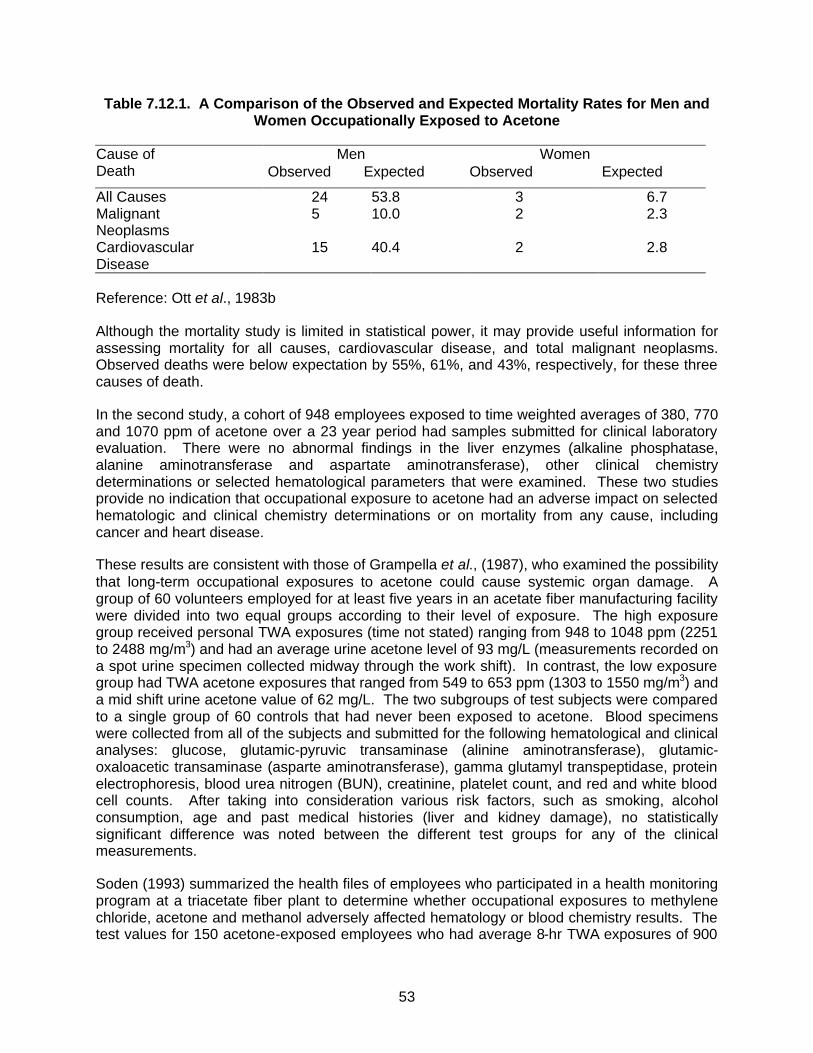
53
Table 7.12.1. A Comparison of the Observed and Expected Mortality Rates for Men and Women Occupationally Exposed to Acetone
Men Women Cause of Death Observed Expected Observed Expected
All Causes 24 53.8 3 6.7 Malignant Neoplasms
5 10.0 2 2.3
Cardiovascular Disease
15 40.4 2 2.8
Reference: Ott et al., 1983b
Although the mortality study is limited in statistical power, it may provide useful information for assessing mortality for all causes, cardiovascular disease, and total malignant neoplasms. Observed deaths were below expectation by 55%, 61%, and 43%, respectively, for these three causes of death.
In the second study, a cohort of 948 employees exposed to time weighted averages of 380, 770 and 1070 ppm of acetone over a 23 year period had samples submitted for clinical laboratory evaluation. There were no abnormal findings in the liver enzymes (alkaline phosphatase, alanine aminotransferase and aspartate aminotransferase), other clinical chemistry determinations or selected hematological parameters that were examined. These two studies provide no indication that occupational exposure to acetone had an adverse impact on selected hematologic and clinical chemistry determinations or on mortality from any cause, including cancer and heart disease.
These results are consistent with those of Grampella et al., (1987), who examined the possibility that long-term occupational exposures to acetone could cause systemic organ damage. A group of 60 volunteers employed for at least five years in an acetate fiber manufacturing facility were divided into two equal groups according to their level of exposure. The high exposure group received personal TWA exposures (time not stated) ranging from 948 to 1048 ppm (2251 to 2488 mg/m3) and had an average urine acetone level of 93 mg/L (measurements recorded on a spot urine specimen collected midway through the work shift). In contrast, the low exposure group had TWA acetone exposures that ranged from 549 to 653 ppm (1303 to 1550 mg/m3) and a mid shift urine acetone value of 62 mg/L. The two subgroups of test subjects were compared to a single group of 60 controls that had never been exposed to acetone. Blood specimens were collected from all of the subjects and submitted for the following hematological and clinical analyses: glucose, glutamic-pyruvic transaminase (alinine aminotransferase), glutamic-oxaloacetic transaminase (asparte aminotransferase), gamma glutamyl transpeptidase, protein electrophoresis, blood urea nitrogen (BUN), creatinine, platelet count, and red and white blood cell counts. After taking into consideration various risk factors, such as smoking, alcohol consumption, age and past medical histories (liver and kidney damage), no statistically significant difference was noted between the different test groups for any of the clinical measurements.
Soden (1993) summarized the health files of employees who participated in a health monitoring program at a triacetate fiber plant to determine whether occupational exposures to methylene chloride, acetone and methanol adversely affected hematology or blood chemistry results. The test values for 150 acetone-exposed employees who had average 8-hr TWA exposures of 900
54
ppm were compared with the results from a group of 260 non-exposed controls. A comparison of the frequency distributions for the exposed and nonexposed populations failed to show any significant difference in ALT, AST, total bilirubin, or hematocrit in the two groups. Likewise, no differences were found in the response rate for symptoms such as loss of memory, headache or dizziness.
7.13 Other Information – Potentiation of Toxicity of Other Compounds
High acute exposures to acetone have been shown potentiate the toxicity of several classes of compounds in mice and rats. Several studies have demonstrated a threshold effect. These mixed exposure scenarios are beyond the scope of this assessment. Additional information about potentiation of the toxicity of other compounds is provided in Patty’s Toxicology Acetone Chapter, section 1.4.1.1 (Morgott 2001).
7.14 Hazard Summary
The toxicological effects of acetone have been extremely well-studied. All of the toxicity tests listed in Tier 1, Tier 2 and Tier 3 of the Pilot Announcement have been conducted for acetone or its metabolic precursor isopropanol, and no endpoints raise specific toxicological concerns that warrant further investigation at this time. The following paragraphs address in summary fashion each toxicity endpoint covered by the VCCEP. Following the narrative summary, Table 7.14.1 identifies the key study for each endpoint and provides the following information: species/sex of test animals; route of administration, dose and duration of exposure; observed effects; reference; and robust summary number.
Acute Toxicity
Animal and human data demonstrate that acetone has low acute toxicity. This assessment is consistent with previous reviews cited in this document (see Section 3.0).
Metabolism
The rates and routes of acetone formation and elimination have been extensively examined in both humans and laboratory animals. This topic is addressed at length in Patty’s Toxicology Acetone Chapter (Morgott 2001), section 1.4.2.2.3.
In addition, Clewell et al. (2001) have published a PBPK model that documents quantitatively the uptake and metabolism of isopropanol and acetone in rats and humans. The SIAR notes that the “ability of humans to naturally produce and dispose of acetone may to a large degree explain its relatively low toxicity following external exposure to moderate amounts of the vapor or liquid.” Metabolism studies show that increases in blood acetone levels are quickly controlled by specific metabolic enzymes that are capable of efficiently handling the excess production; this fact pertains to exogenous exposures as well as fluctuations in endogenous production.
Repeated Dose (Systemic) Toxicity
The extensive data available for acetone demonstrates “low potential for systemic toxicity.” (SIAR, p. 26). The key studies are the 90-day drinking water studies in rats and mice sponsored by NTP which “only demonstrated a very mild toxic response at very high doses.” (Memo by NTP Study Director, Appendix F.) Minimally toxic concentrations and associated effects are presented at Table 7.14.1. Based on the minimal effects seen at doses of 1700
55
mg/kg-day and higher, 900 mg/kg-day was determined to be the NOAEL for male rats in the NTP studies. NOAELs for female rats, male mice and female mice were considerably higher: >3100 mg/kg-day, 2300 mg/kg-day, and 5900 mg/kg-day, respectively. These very high NOAELs, and the very mild responses seen at even higher doses, provide strong evidence of acetone’s low potential to cause systemic toxicity.
Genotoxicity
Acetone has been tested in more than two dozen in vitro and in vivo assays. These studies indicate that acetone is not genotoxic. In fact, acetone has been used as a vehicle for testing water insoluble substances in various mutagenicity assays.
Carcinogenicity
The SIAR concludes that “acetone is not likely to be carcinogenic.” (SIAR, p. 28). EPA in 1995 concluded, “There is currently no evidence to suggest a concern for carcinogenicity.” (EPCRA Review, described in Section 3.6). NTP scientists have recommended against chronic toxicity/carcinogenicity testing of acetone because “the prechronic studies only demonstrated a very mild toxic response at very high doses in rodents,” and because of “the absence of any evidence supporting the carcinogenic potential of acetone.” (See Appendix F.) These previous assessments are supported by: (1) numerous assays demonstrating a lack of mutagenic activity or cytogenetic toxicity; (2) negative chronic dermal studies using acetone; and (3) negative chronic toxicity/oncogenicity studies of isopropanol in rats and mice. Thus, the scientific evidence does not support a concern for carcinogenicity for acetone.
Neurotoxicity and Developmental Neurotoxicity
High acute exposure to acetone can cause reversible pharmacologic effects, but available studies do not provide any evidence of injury to the nervous system following repeated exposures. The available studies include numerous acetone studies using a variety of test protocols in multiple species, as well as TSCA guideline studies with isopropanol in rats. A guideline developmental neurotoxicity study also has been conducted with isopropanol in rats, and no evidence of developmental neurotoxicity was seen at the highest dose (1200 mg/kg-day). Thus, the nervous system does not appear to be a target organ following repeated exposures to acetone.
Immunotoxicity
No evidence of potential immunotoxicity was observed in a recent guideline study of acetone in mice. Available subchronic studies of acetone also are not indicative of a likely concern for potential immunotoxic effects.
Developmental and Reproductive Toxicity
Inhalation developmental toxicity studies in rats and mice have shown either no effects or slight effects following exposure to the highest concentrations of acetone studied (Mast et al.1988). In the rat study, acetone had no effect on the number of implantations, the mean percent live pups/litter or the mean percent of resorptions/litter. The number of live fetuses/litter and the percent intrauterine deaths/litter for all groups were within the range of controls. Fetal body weights were reduced approximately 15% at the highest exposure (11,000 ppm) as compared to the controls but at 440 or 2,200 ppm were not different from controls. Neither fetal sex ratios

56
nor the incidences of fetal malformations were altered in the acetone-exposed groups as compared to the controls. The percent of litters with at least one pup with malformations was greater at 11,000 ppm than for control (11.5 vs. 3.8%) with this index at 5% in controls in other contemporary studies at the same laboratory. However, at 11,000 ppm 366 fetus were examined and only nine minor malformations were observed in four fetuses. Of these, four malformations were found in a single fetus and two other fetuses each had two malformations. Hence, these data provided no compelling evidence that acetone acts as a teratogen in vivo.
In the mouse study, there were no maternal deaths and no overt signs of toxicity evident in any of the groups after the highest exposure level was reduced to 6,600 ppm. There were no effects on maternal body weight although absolute and relative liver weights in the high exposure group were significantly greater than control. A slight but significant increase in the percent of late resorptions occurred at 6,600 ppm. Acetone exposure had no effect on the number of implantations/litter, the mean percent live pups/litter or the mean percent of total intrauterine deaths. Both male and female fetal weights were significantly reduced (approximately 8%) at 6,600 ppm compared to control. Fetal weights at 440 and 2,200 ppm were unremarkable. Fetal sex ratios were not affected by gestational exposure to acetone. The incidence of fetal malformations was not significantly increased in the acetone-exposed groups compared to control. No fetal malformations were observed that had not previously been found in control fetuses.
In conclusion, a well conducted developmental toxicity study in rats and mice established a NOAEL of 2200 ppm and produced no compelling evidence to indicate that acetone is a teratogen. As noted by Gentry, et al. (2003, in press) a higher NOAEL could very likely have been demonstrated given the mild effects reported at the highest exposures of 6600 ppm in mice and 11,000 ppm in rats.
Reproductive studies on acetone on include an oral (drinking water) one-generation study in rats (only males exposed), which showed no testicular toxicity or effects on reproduction at 0.5 percent acetone in the drinking water. In another one-generation study, male rats were exposed to acetone (0.5 and 1.0 percent in the drinking water) along with DEHP, with no evidence of toxicity to the testes or adverse effect on reproduction.
The reproductive toxicity studies of isopropanol (IPA) also support that acetone does not represent a reproductive toxicity hazard since a major metabolite of IPA is acetone. A guideline two-generation study has been conducted for isopropanol by gavage at doses of 100, 500 or 1000 mg/kg-day. Increased mortality was observed in the F1 and F2 offspring from postnatal days 0-4 receiving the highest dose of IPA as compared to controls. This result was likely due to lag in the ontogeny of the enzymes responsible for metabolism of IPA to acetone and hence a direct effect of IPA. In addition, high dose male F1 body weights were statistically lower than control on postnatal days 0 and 1 and F2 high dose male and female body weights were statistically significantly lower than control on postnatal Days 0, 1 and 4 compared with control. Several F1 weanlings died or were euthanized prior to P2 selection, one each in the low and mid-dose groups and 18 in the high dose group. No treatment related post-mortem findings were observed in the offspring of either generation. In addition, no treatment related microscopic changes in reproductive tissues or biologically meaningful differences in other reproductive parameters were observed in adults of either generation.
The existing data support that the exogenous exposure to acetone does not pose a developmental or reproductive hazard. This is not surprising considering that the endogenous production of acetone is so much greater than typical exogenous exposures (see discussion in
57
Section 9.3). Normal activities (e.g., exercise, diet) can cause endogenous production of acetone to increase significantly in healthy individuals; and pregnant women, nursing mothers and children all have higher blood levels of acetone naturally due to their higher energy requirements. As described in Section 7.12, the medical community has begun using a ketogenic diet as a means to reduce the frequency and severity of epileptic attacks in infants and children with recalcitrant refractory epilepsy. The SIAR notes that the “ability of humans to naturally produce and dispose of acetone may to a large degree explain its relatively low toxicity following external exposure to moderate amounts of the vapor or liquid.” (p. 20). Studies described in Section 7.3 also show that increases in blood acetone levels are quickly controlled by specific metabolic enzymes that are capable of efficiently handling the excess production; this fact pertains to exogenous exposures as well as fluctuations in endogenous production. The draft IRIS Toxicological Review of Acetone describes three processes by which the human body tends to “buffer” acetone blood levels.5
Taken as a whole, the scientific evidence is not indicative of a likely reproductive or developmental toxicity hazard from acetone exposure.
5 EPA, Toxicological Review of Acetone in Support of Summary Information on the Integrated Risk
Information System (IRIS). (CAS No. 67-64-1) External Review Draft (August 2001), pp. 28-29.
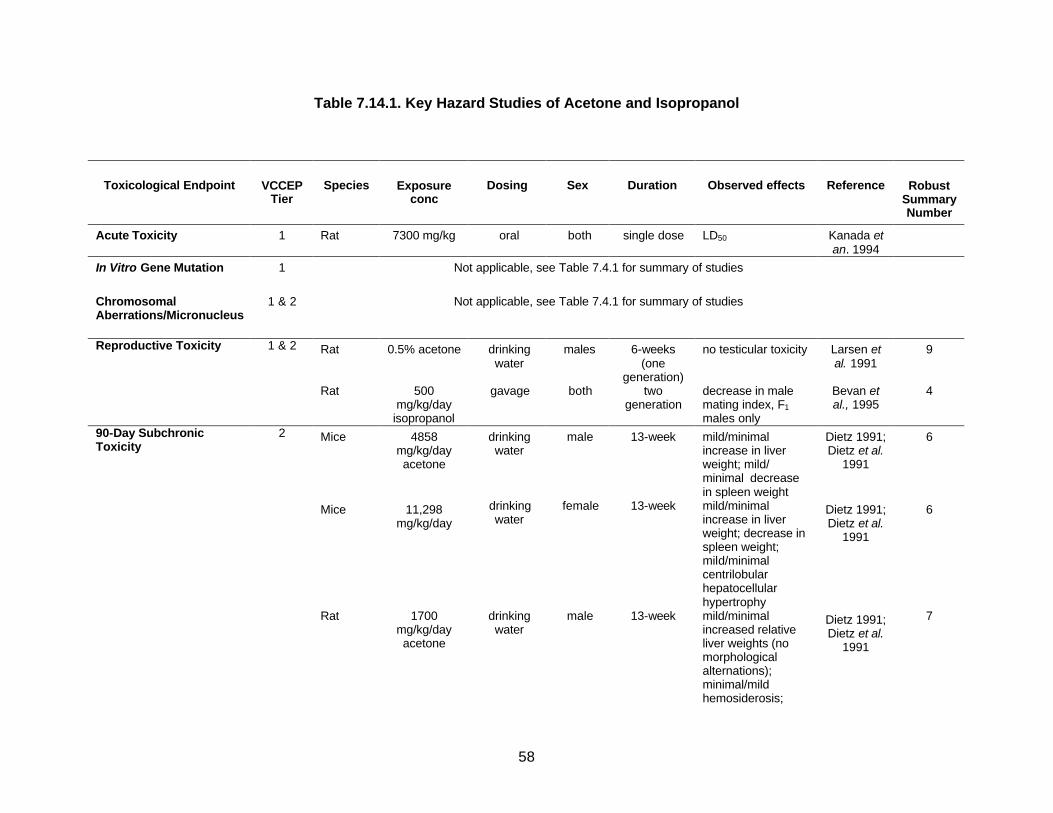
58
Table 7.14.1. Key Hazard Studies of Acetone and Isopropanol
Toxicological Endpoint
VCCEP
Tier
Species
Exposure
conc
Dosing
Sex
Duration
Observed effects
Reference
Robust
Summary Number
Acute Toxicity 1 Rat 7300 mg/kg oral both single dose LD50 Kanada et an. 1994
In Vitro Gene Mutation 1 Not applicable, see Table 7.4.1 for summary of studies
Chromosomal Aberrations/Micronucleus
1 & 2 Not applicable, see Table 7.4.1 for summary of studies
Reproductive Toxicity 1 & 2 Rat 0.5% acetone drinking water
males 6-weeks (one
generation)
no testicular toxicity Larsen et al. 1991
9
Rat 500 mg/kg/day
isopropanol
gavage both two generation
decrease in male mating index, F1 males only
Bevan et al., 1995
4
90-Day Subchronic Toxicity
2 Mice 4858 mg/kg/day acetone
drinking water
male 13-week mild/minimal increase in liver weight; mild/ minimal decrease in spleen weight
Dietz 1991; Dietz et al.
1991
6
Mice 11,298 mg/kg/day
drinking water
female 13-week mild/minimal increase in liver weight; decrease in spleen weight; mild/minimal centrilobular hepatocellular hypertrophy
Dietz 1991; Dietz et al.
1991
6
Rat 1700 mg/kg/day acetone
drinking water
male 13-week mild/minimal increased relative liver weights (no morphological alternations); minimal/mild hemosiderosis;
Dietz 1991; Dietz et al.
1991
7
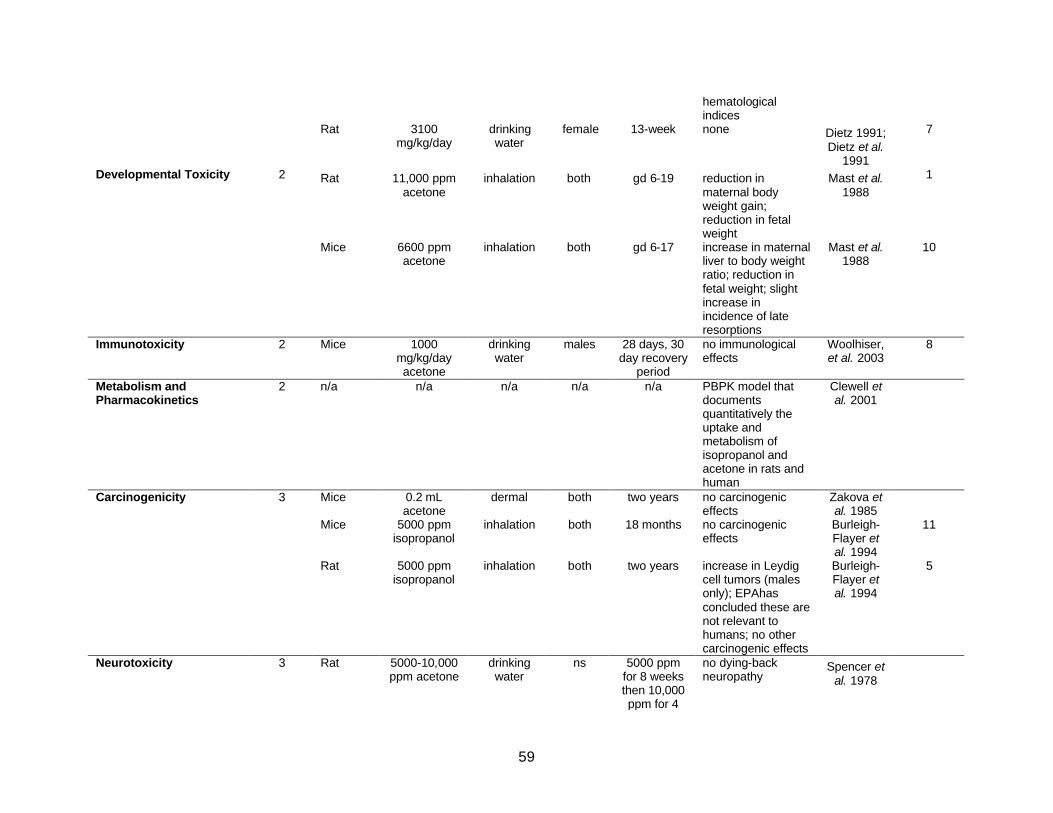
59
hematological indices
Rat 3100 mg/kg/day
drinking water
female 13-week none Dietz 1991; Dietz et al.
1991
7
Developmental Toxicity 2 Rat 11,000 ppm acetone
inhalation both gd 6-19 reduction in maternal body weight gain; reduction in fetal weight
Mast et al. 1988
1
Mice 6600 ppm acetone
inhalation both gd 6-17 increase in maternal liver to body weight ratio; reduction in fetal weight; slight increase in incidence of late resorptions
Mast et al. 1988
10
Immunotoxicity 2 Mice 1000 mg/kg/day acetone
drinking water
males 28 days, 30 day recovery
period
no immunological effects
Woolhiser, et al. 2003
8
Metabolism and Pharmacokinetics
2 n/a n/a n/a n/a n/a PBPK model that documents quantitatively the uptake and metabolism of isopropanol and acetone in rats and human
Clewell et al. 2001
Carcinogenicity 3 Mice 0.2 mL acetone
dermal both two years no carcinogenic effects
Zakova et al. 1985
Mice 5000 ppm isopropanol
inhalation both 18 months no carcinogenic effects
Burleigh-Flayer et al. 1994
11
Rat 5000 ppm isopropanol
inhalation both two years increase in Leydig cell tumors (males only); EPAhas concluded these are not relevant to humans; no other carcinogenic effects
Burleigh-Flayer et al. 1994
5
Neurotoxicity 3 Rat 5000-10,000 ppm acetone
drinking water
ns 5000 ppm for 8 weeks then 10,000 ppm for 4
no dying-back neuropathy
Spencer et al. 1978
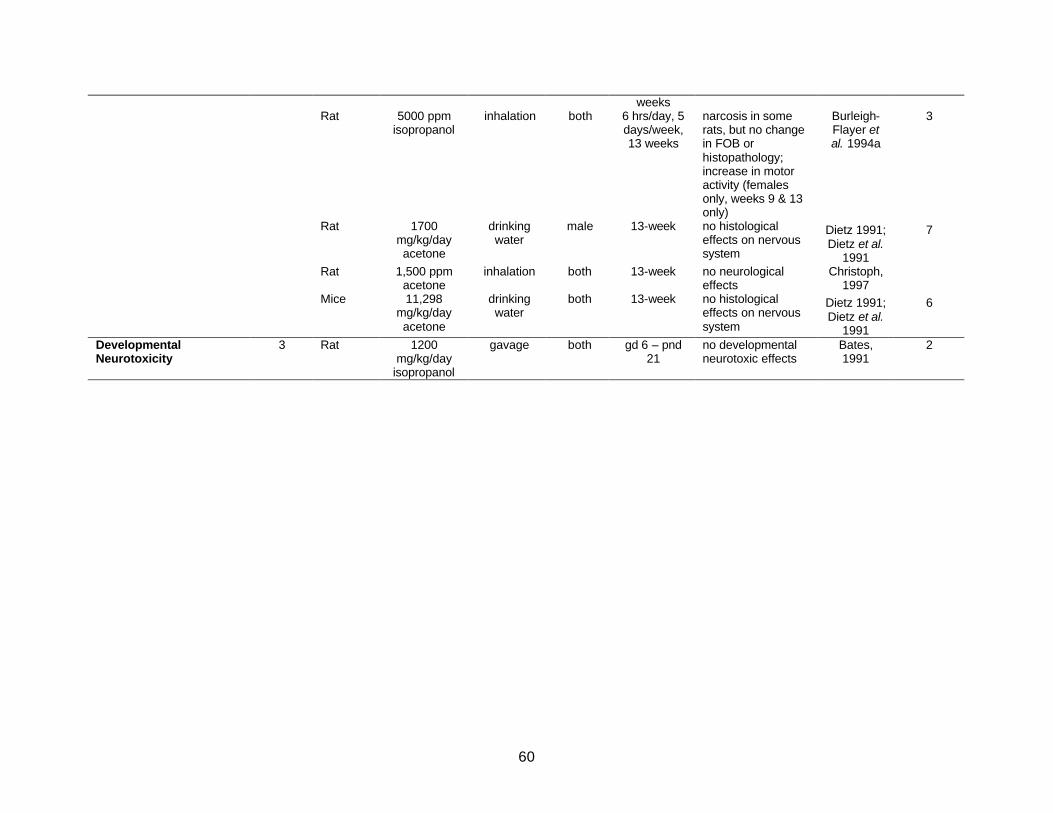
60
weeks Rat 5000 ppm
isopropanol inhalation both 6 hrs/day, 5
days/week, 13 weeks
narcosis in some rats, but no change in FOB or histopathology; increase in motor activity (females only, weeks 9 & 13 only)
Burleigh-Flayer et al. 1994a
3
Rat 1700 mg/kg/day acetone
drinking water
male 13-week no histological effects on nervous system
Dietz 1991; Dietz et al.
1991
7
Rat 1,500 ppm acetone
inhalation both 13-week no neurological effects
Christoph, 1997
Mice 11,298 mg/kg/day acetone
drinking water
both 13-week no histological effects on nervous system
Dietz 1991; Dietz et al.
1991
6
Developmental Neurotoxicity
3 Rat 1200 mg/kg/day
isopropanol
gavage both gd 6 – pnd 21
no developmental neurotoxic effects
Bates, 1991
2

61
7.15 Robust Summaries of Toxicology Studies
The OECD SIDS Dossier and SIAR (Appendix A) contain summaries of most of the key toxicological studies on acetone. Expanded robust summaries for eleven studies are found in Appendix B.
7.16 Selection of Health Benchmarks
Historically, the evaluation of chronic exposures of noncarcinogens has been based on the RfD. The RfD is a product of science and science policy. The goal of the RfD is:
... an estimate (with an uncertainty spanning perhaps an order of magnitude) of a daily exposure to the human population (including sensitive subgroups) that is likely to be without appreciable risk of deleterious effects during a lifetime. (EPA, 1988)
Swartout et al. (1998) demonstrated that the approach used to set most RfDs (use of animals models and safety factors) results in estimates that are overly conservative for the vast majority of chemicals and that the RfD is best viewed as the lower bound of the true but unknown “safe level”. They further demonstrated that the true threshold for adverse effects for the “typical” chemical could be 10 to 100 times higher then the RfD. This finding does not prevent the use of the RfD in screening assessments. Since the RfD is a conservative measure of the “safe level”, a comparison to the RfD is still a valid tool for screening out chemical exposures that are of low concern. In the case of acetone, the oral RfD of 0.9 mg/kg/day derived by EPA is more than 10-fold below the normal endogenous production in healthy adults and children and is below the levels of exposure nursing infants receive from the presence of acetone in non-occupationally exposed mother’s milk. Thus, all children exceed this RfD as a result of endogenous exposures. This finding clearly shows that the methodology used by EPA to set the RfD has underestimated the doses of acetone that can be tolerated without adverse effects in adults and children. As such, comparisons of doses from total acetone exposure (exogenous and endogenous) to the RfD do not provide any guidance or insight on the risks posed by the chemical. Therefore, the Task Force has not compared the total acetone doses to the EPA-derived RfD. The toxicity assessment presented in Section 7 demonstrates that acetone has low acute and repeated dose toxicity. The key health benchmarks for this risk assessment are the RfD and RfC derived by Gentry, et al. (2003, in press). Like RfCs and RfDs derived by EPA, these values are intended to represent exposures that can be repeated daily for a lifetime without appreciable risk to the general population, including sensitive subgroups.
Gentry et al. used a PBPK model to derive two RfD values for acetone. See discussion in Section 3.9. The first value was derived from the NOAEL of 900 mg/kg-day for male rats in the NTP subchronic drinking water studies. Gentry et al. applied a composite uncertainty factor of 60 to this NOAEL (6 for database insufficiency and a factor of 10 for human variability). The RfD derived from the NTP subchronic studies is 16.0 mg/kg-day. This value is similar to but slightly higher than the chronic value recommended in the WHO IPCS Environmental Health Criteria document (9.0 mg/kg-day).
62
Gentry et al. also derived an oral RfD of 8.7 mg/kg-day based on inhalation developmental toxicity studies in rats and mice. In this case, the NOAEL was 2200 ppm, and a composite UF of 30 was applied. As noted by Gentry et al., it is likely that a higher NOAEL would have been defined if an intermediate dose had been added between 2200 ppm and 11,000 ppm in rats, and between 2200 and 6600 in mice, given the minimal effects seen at the high doses in each species. This artifact of dosing caused the RfD derived from the developmental toxicity studies to be slightly lower than the value derived from the subchronic drinking water studies. The lower RfD is essentially identical to the value recommended by WHO (9.0 mg/kg-day - see previous paragraph).
The lower RfD value derived by Gentry, et al. will be used as the chronic oral health benchmark for this risk assessment, even though acetone is not believed to pose a developmental toxicity hazard in humans.
Gentry et al. also used the PBPK model to derive an RfC of 29 ppm. This value is based on the NOAEL of 2200 ppm in the mouse and rat inhalation developmental toxicity studies, applying the same composite UF of 30. This value is similar to the chronic inhalation MRL of 13 ppm derived by ATSDR.
Use of a PBPK model to derive the RfD and RfC values improved the interspecies extrapolation, allowed maximum use of acetone data (via route-to-route extrapolation), and facilitated use of relevant isopropanol data. It is important to recognize that the values derived by Gentry et al. are still very conservative (i.e., health protective). They are based on extensive toxicity information, are derived from relatively high NOAELs (that in turn are based on very mild responses reported at even higher doses) and are still below normal endogenous production of acetone in healthy individuals, and much lower than endogenous production in pregnant women, nursing mothers and children.
In deriving its acetone RfD of 0.9 mg/kg-day, EPA discounted the use of the existing PBPK model for acetone (Gentry et al., 2002) on the basis that: “The models have been validated for human exposure for the inhalation pathway, but not the oral pathway.” However, this PBPK model successfully described a large body of pharmacokinetic data for IPA and acetone from different species, administered by different routes of administration, including orally administered acetone in rats. The successful description of several data sets collected by several different investigators indicates that the model is a valid mathematical description of the pharmacokinetics of both IPA and acetone in mammals and can be used to accurately describe the fate of inhaled or orally administered acetone to humans. Merely because it was not directly used to describe human pharmacokinetic data on orally administered acetone does not mean it could not or has not provided such a description accurately. In fact, the parameterization of the model for this purpose is trivial and does not alter or invalidate its use by Gentry et al., for the purpose of determining an appropriate RfD and RfC for acetone. 6
In addition to using 8.7 mg/kg-day to characterize children’s risk from chronic exogenous acetone exposures, single day exposures, such as result from a single use of a consumer product, will be compared to normal endogenous production.
6 See discussion in sections 3.8 and 3.9 for additional discussion of the VCCEP sponsors’ reasons
for concluding that the RfD value derived by EPA is overly conservative and the values derived by Gentry et al. provide a more scientifically sound basis for assessing potential health risks from exposure to acetone.

63
Because acetone is not believed to present a developmental or reproductive toxicity hazard, the focus of the risk assessment will be on exposure to children.

64
8. Exposure Assessment
This section summarizes the methodology, results and conclusions of the exposure assessment for acetone under VCCEP. As part of this pilot program, EPA has requested that exposure information be submitted to determine the extent of children's exposure to acetone. The types of exposure information needed for the assessment includes the identification and characterization of the population groups exposed, sources of the exposure, as well as frequencies, levels, and routes of exposure.
The methodology employed in this assessment provides a comprehensive analysis of childhood exposures to acetone and uses the available data to focus on those sources of exposure that are likely to have the most significant impact on children’s total acetone exposures.
8.1 Methodology/ Scope of Assessment
As suggested by EPA, exposure assessments for both children and prospective parents were conducted. As indicated in Figure 8-1, sources of exposure to acetone in the ambient environment can come from both chain-of-commerce and non-chain-of-commerce sources. In accordance with the notice of the program published in the Federal Register (2000), exposures for the chains of commerce sources were quantified. Exposures to acetone from non-chain of commerce sources such as wood burning stoves and other sources of combustion, landfills, and tobacco smoke have been assessed qualitatively. Additionally, the exposure assessments did not include exposures from accidents or intentional misuse of acetone containing products.
A child-centered approach was used to define realistic exposure scenarios for children’s interaction with acetone sources including endogenous levels, environmental (ambient) sources, and use of consumer products. Figure 8-1 is a flowchart depicting the child-centered approach that was followed for acetone.
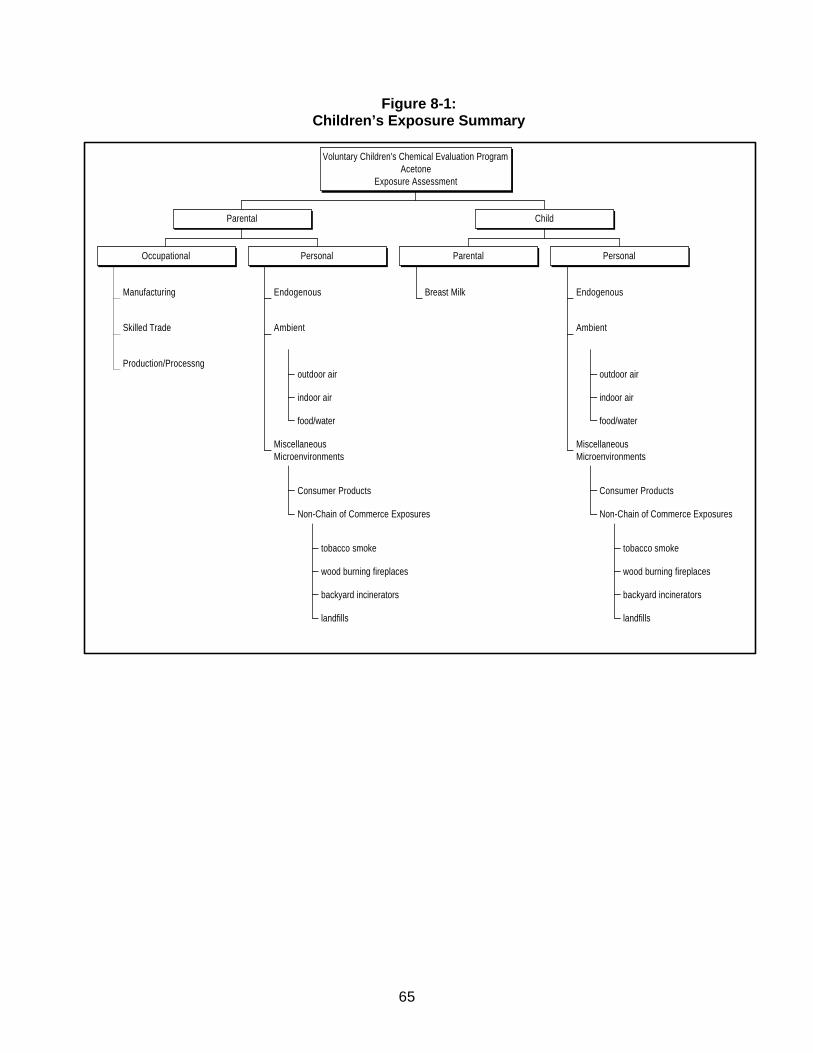
65
Figure 8-1: Children’s Exposure Summary
Manufacturing
Skilled Trade
Production/Processng
Occupational
Endogenous
outdoor air
indoor air
food/water
Ambient
Consumer Products
tobacco smoke
wood burning fireplaces
backyard incinerators
landfills
Non-Chain of Commerce Exposures
MiscellaneousMicroenvironments
Personal
Parental
Breast Milk
Parental
Endogenous
outdoor air
indoor air
food/water
Ambient
Consumer Products
tobacco smoke
wood burning fireplaces
backyard incinerators
landfills
Non-Chain of Commerce Exposures
MiscellaneousMicroenvironments
Personal
Child
Voluntary Children's Chemical Evaluation ProgramAcetone
Exposure Assessment
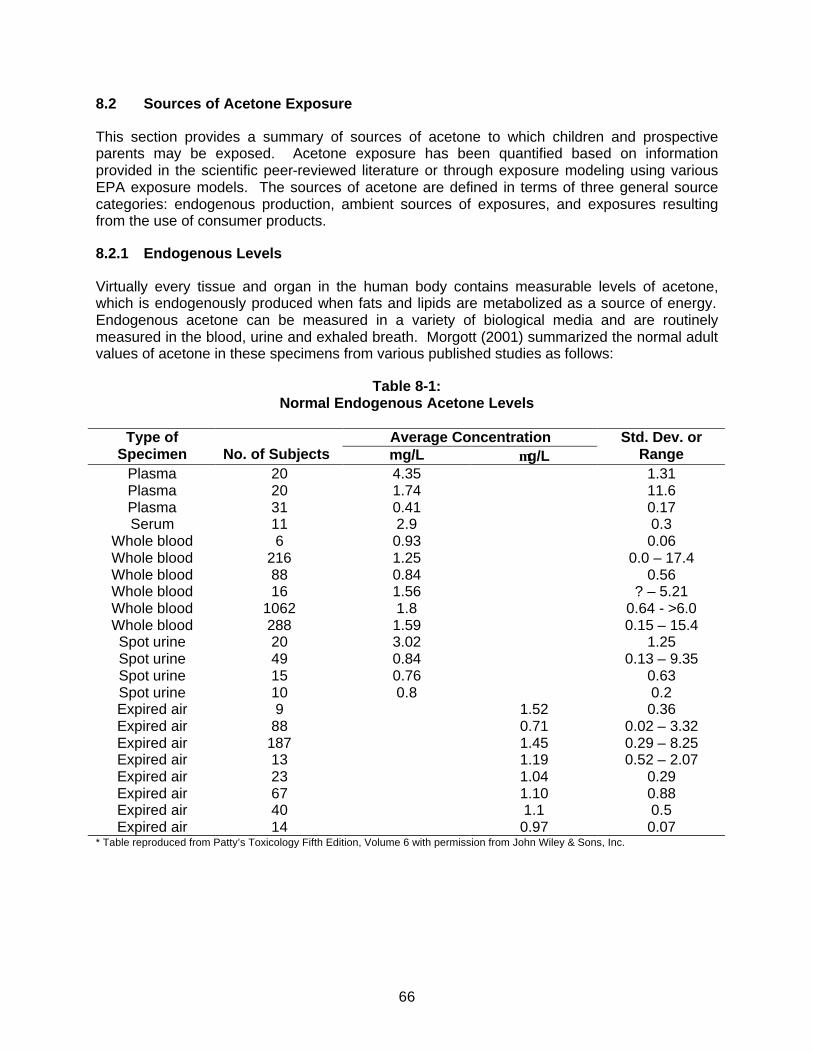
66
8.2 Sources of Acetone Exposure
This section provides a summary of sources of acetone to which children and prospective parents may be exposed. Acetone exposure has been quantified based on information provided in the scientific peer-reviewed literature or through exposure modeling using various EPA exposure models. The sources of acetone are defined in terms of three general source categories: endogenous production, ambient sources of exposures, and exposures resulting from the use of consumer products.
8.2.1 Endogenous Levels
Virtually every tissue and organ in the human body contains measurable levels of acetone, which is endogenously produced when fats and lipids are metabolized as a source of energy. Endogenous acetone can be measured in a variety of biological media and are routinely measured in the blood, urine and exhaled breath. Morgott (2001) summarized the normal adult values of acetone in these specimens from various published studies as follows:
Table 8-1: Normal Endogenous Acetone Levels
Average Concentration Type of
Specimen No. of Subjects mg/L µg/L
Std. Dev. or Range
Plasma 20 4.35 1.31 Plasma 20 1.74 11.6 Plasma 31 0.41 0.17 Serum 11 2.9 0.3
Whole blood 6 0.93 0.06 Whole blood 216 1.25 0.0 – 17.4 Whole blood 88 0.84 0.56 Whole blood 16 1.56 ? – 5.21 Whole blood 1062 1.8 0.64 - >6.0 Whole blood 288 1.59 0.15 – 15.4 Spot urine 20 3.02 1.25 Spot urine 49 0.84 0.13 – 9.35 Spot urine 15 0.76 0.63 Spot urine 10 0.8 0.2 Expired air 9 1.52 0.36 Expired air 88 0.71 0.02 – 3.32 Expired air 187 1.45 0.29 – 8.25 Expired air 13 1.19 0.52 – 2.07 Expired air 23 1.04 0.29 Expired air 67 1.10 0.88 Expired air 40 1.1 0.5 Expired air 14 0.97 0.07
* Table reproduced from Patty’s Toxicology Fifth Edition, Volume 6 with permission from John Wiley & Sons, Inc.
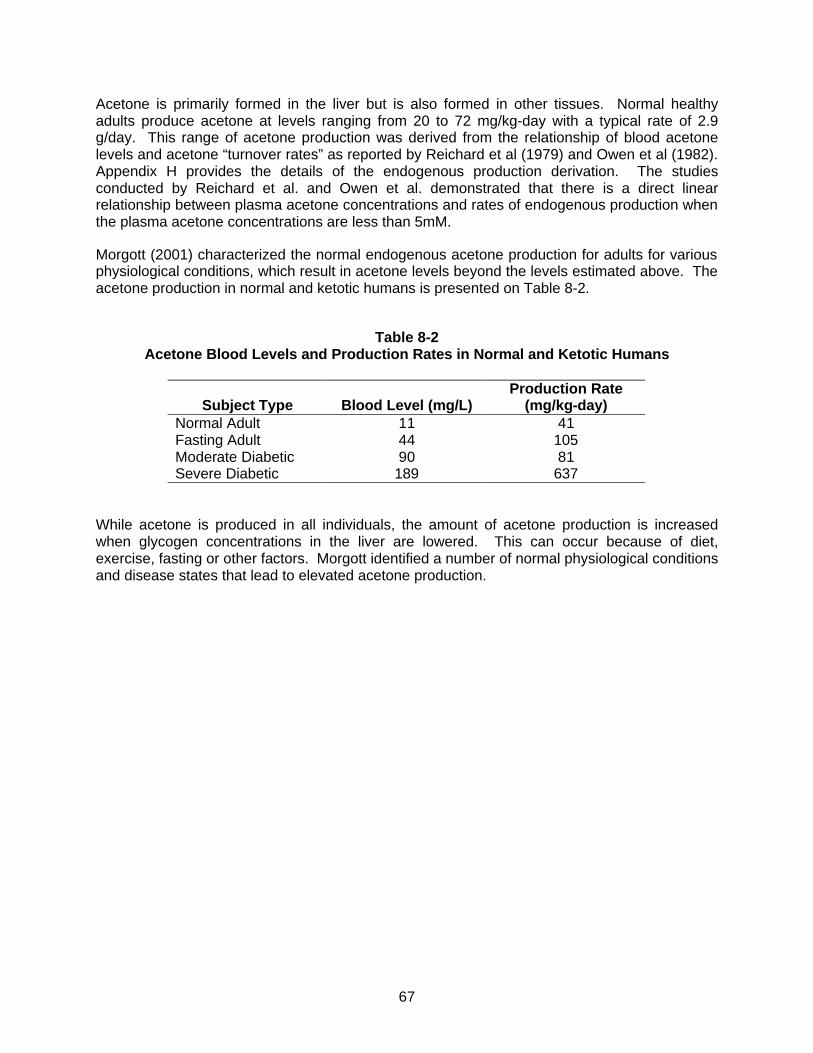
67
Acetone is primarily formed in the liver but is also formed in other tissues. Normal healthy adults produce acetone at levels ranging from 20 to 72 mg/kg-day with a typical rate of 2.9 g/day. This range of acetone production was derived from the relationship of blood acetone levels and acetone “turnover rates” as reported by Reichard et al (1979) and Owen et al (1982). Appendix H provides the details of the endogenous production derivation. The studies conducted by Reichard et al. and Owen et al. demonstrated that there is a direct linear relationship between plasma acetone concentrations and rates of endogenous production when the plasma acetone concentrations are less than 5mM.
Morgott (2001) characterized the normal endogenous acetone production for adults for various physiological conditions, which result in acetone levels beyond the levels estimated above. The acetone production in normal and ketotic humans is presented on Table 8-2.
Table 8-2
Acetone Blood Levels and Production Rates in Normal and Ketotic Humans
Subject Type
Blood Level (mg/L)
Production Rate (mg/kg-day)
Normal Adult 11 41 Fasting Adult 44 105 Moderate Diabetic 90 81 Severe Diabetic 189 637
While acetone is produced in all individuals, the amount of acetone production is increased when glycogen concentrations in the liver are lowered. This can occur because of diet, exercise, fasting or other factors. Morgott identified a number of normal physiological conditions and disease states that lead to elevated acetone production.
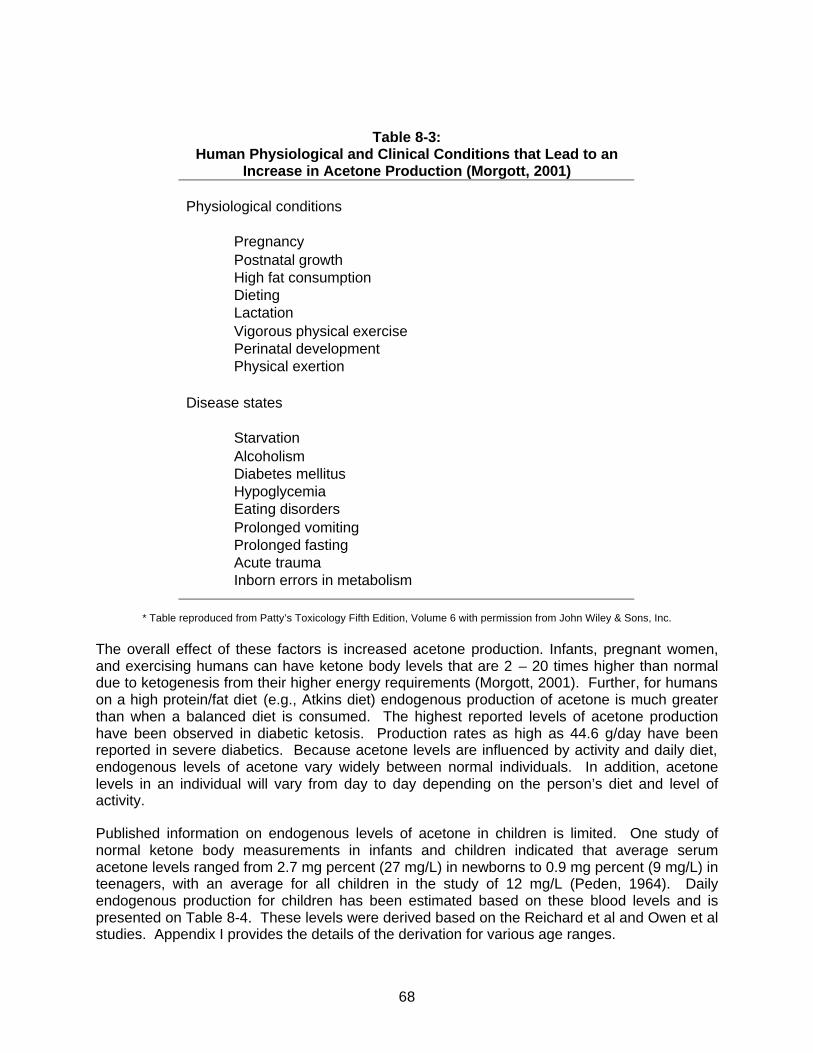
68
Table 8-3: Human Physiological and Clinical Conditions that Lead to an
Increase in Acetone Production (Morgott, 2001) Physiological conditions
Pregnancy Postnatal growth High fat consumption Dieting Lactation Vigorous physical exercise Perinatal development Physical exertion
Disease states
Starvation Alcoholism Diabetes mellitus Hypoglycemia Eating disorders Prolonged vomiting Prolonged fasting Acute trauma Inborn errors in metabolism
* Table reproduced from Patty’s Toxicology Fifth Edition, Volume 6 with permission from John Wiley & Sons, Inc.
The overall effect of these factors is increased acetone production. Infants, pregnant women, and exercising humans can have ketone body levels that are 2 – 20 times higher than normal due to ketogenesis from their higher energy requirements (Morgott, 2001). Further, for humans on a high protein/fat diet (e.g., Atkins diet) endogenous production of acetone is much greater than when a balanced diet is consumed. The highest reported levels of acetone production have been observed in diabetic ketosis. Production rates as high as 44.6 g/day have been reported in severe diabetics. Because acetone levels are influenced by activity and daily diet, endogenous levels of acetone vary widely between normal individuals. In addition, acetone levels in an individual will vary from day to day depending on the person’s diet and level of activity.
Published information on endogenous levels of acetone in children is limited. One study of normal ketone body measurements in infants and children indicated that average serum acetone levels ranged from 2.7 mg percent (27 mg/L) in newborns to 0.9 mg percent (9 mg/L) in teenagers, with an average for all children in the study of 12 mg/L (Peden, 1964). Daily endogenous production for children has been estimated based on these blood levels and is presented on Table 8-4. These levels were derived based on the Reichard et al and Owen et al studies. Appendix I provides the details of the derivation for various age ranges.
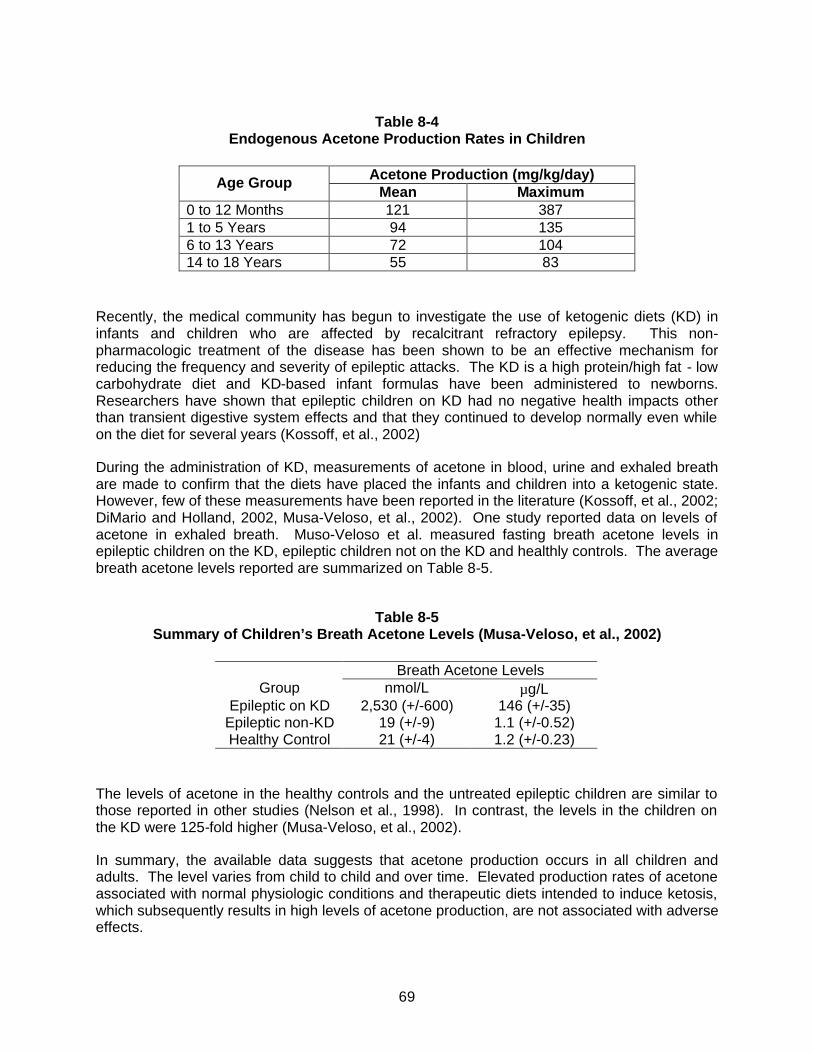
69
Table 8-4
Endogenous Acetone Production Rates in Children
Acetone Production (mg/kg/day) Age Group Mean Maximum
0 to 12 Months 121 387 1 to 5 Years 94 135 6 to 13 Years 72 104 14 to 18 Years 55 83
Recently, the medical community has begun to investigate the use of ketogenic diets (KD) in infants and children who are affected by recalcitrant refractory epilepsy. This non-pharmacologic treatment of the disease has been shown to be an effective mechanism for reducing the frequency and severity of epileptic attacks. The KD is a high protein/high fat - low carbohydrate diet and KD-based infant formulas have been administered to newborns. Researchers have shown that epileptic children on KD had no negative health impacts other than transient digestive system effects and that they continued to develop normally even while on the diet for several years (Kossoff, et al., 2002)
During the administration of KD, measurements of acetone in blood, urine and exhaled breath are made to confirm that the diets have placed the infants and children into a ketogenic state. However, few of these measurements have been reported in the literature (Kossoff, et al., 2002; DiMario and Holland, 2002, Musa-Veloso, et al., 2002). One study reported data on levels of acetone in exhaled breath. Muso-Veloso et al. measured fasting breath acetone levels in epileptic children on the KD, epileptic children not on the KD and healthly controls. The average breath acetone levels reported are summarized on Table 8-5.
Table 8-5
Summary of Children’s Breath Acetone Levels (Musa-Veloso, et al., 2002)
Breath Acetone Levels Group nmol/L µg/L
Epileptic on KD 2,530 (+/-600) 146 (+/-35) Epileptic non-KD 19 (+/-9) 1.1 (+/-0.52) Healthy Control 21 (+/-4) 1.2 (+/-0.23)
The levels of acetone in the healthy controls and the untreated epileptic children are similar to those reported in other studies (Nelson et al., 1998). In contrast, the levels in the children on the KD were 125-fold higher (Musa-Veloso, et al., 2002).
In summary, the available data suggests that acetone production occurs in all children and adults. The level varies from child to child and over time. Elevated production rates of acetone associated with normal physiologic conditions and therapeutic diets intended to induce ketosis, which subsequently results in high levels of acetone production, are not associated with adverse effects.
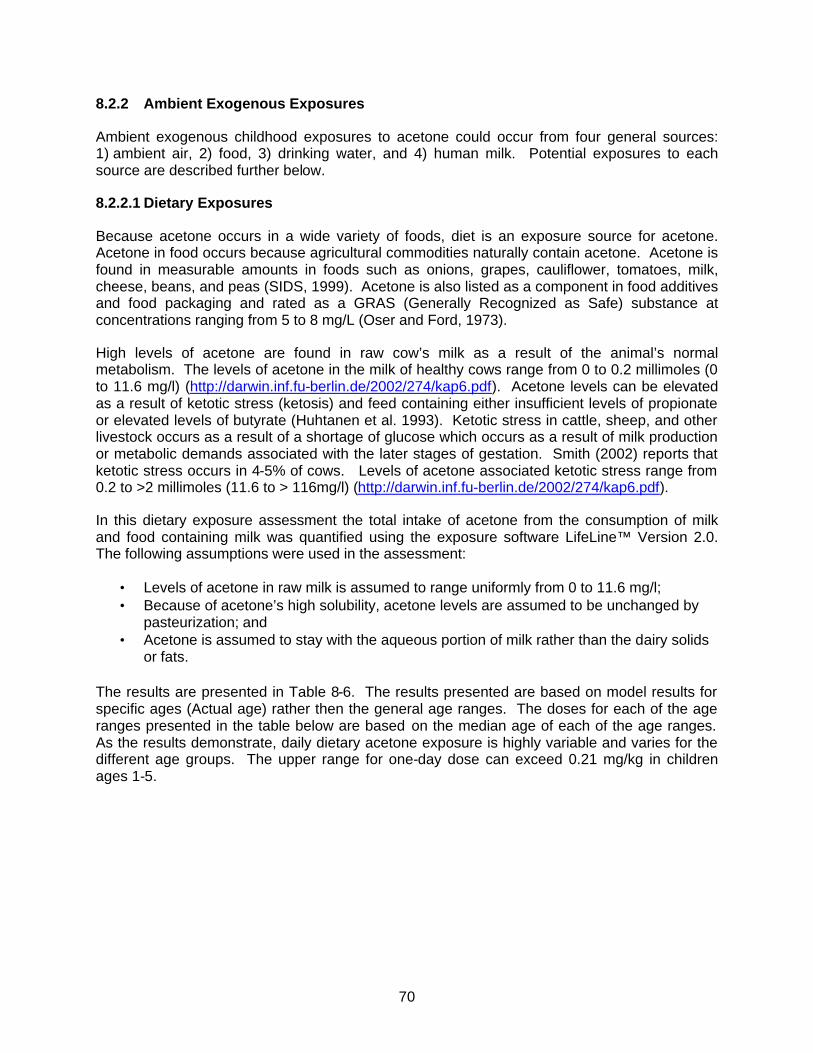
70
8.2.2 Ambient Exogenous Exposures
Ambient exogenous childhood exposures to acetone could occur from four general sources: 1) ambient air, 2) food, 3) drinking water, and 4) human milk. Potential exposures to each source are described further below.
8.2.2.1 Dietary Exposures
Because acetone occurs in a wide variety of foods, diet is an exposure source for acetone. Acetone in food occurs because agricultural commodities naturally contain acetone. Acetone is found in measurable amounts in foods such as onions, grapes, cauliflower, tomatoes, milk, cheese, beans, and peas (SIDS, 1999). Acetone is also listed as a component in food additives and food packaging and rated as a GRAS (Generally Recognized as Safe) substance at concentrations ranging from 5 to 8 mg/L (Oser and Ford, 1973).
High levels of acetone are found in raw cow’s milk as a result of the animal’s normal metabolism. The levels of acetone in the milk of healthy cows range from 0 to 0.2 millimoles (0 to 11.6 mg/l) (http://darwin.inf.fu-berlin.de/2002/274/kap6.pdf). Acetone levels can be elevated as a result of ketotic stress (ketosis) and feed containing either insufficient levels of propionate or elevated levels of butyrate (Huhtanen et al. 1993). Ketotic stress in cattle, sheep, and other livestock occurs as a result of a shortage of glucose which occurs as a result of milk production or metabolic demands associated with the later stages of gestation. Smith (2002) reports that ketotic stress occurs in 4-5% of cows. Levels of acetone associated ketotic stress range from 0.2 to >2 millimoles (11.6 to > 116mg/l) (http://darwin.inf.fu-berlin.de/2002/274/kap6.pdf).
In this dietary exposure assessment the total intake of acetone from the consumption of milk and food containing milk was quantified using the exposure software LifeLine™ Version 2.0. The following assumptions were used in the assessment:
• Levels of acetone in raw milk is assumed to range uniformly from 0 to 11.6 mg/l; • Because of acetone’s high solubility, acetone levels are assumed to be unchanged by
pasteurization; and • Acetone is assumed to stay with the aqueous portion of milk rather than the dairy solids
or fats. The results are presented in Table 8-6. The results presented are based on model results for specific ages (Actual age) rather then the general age ranges. The doses for each of the age ranges presented in the table below are based on the median age of each of the age ranges. As the results demonstrate, daily dietary acetone exposure is highly variable and varies for the different age groups. The upper range for one-day dose can exceed 0.21 mg/kg in children ages 1-5.
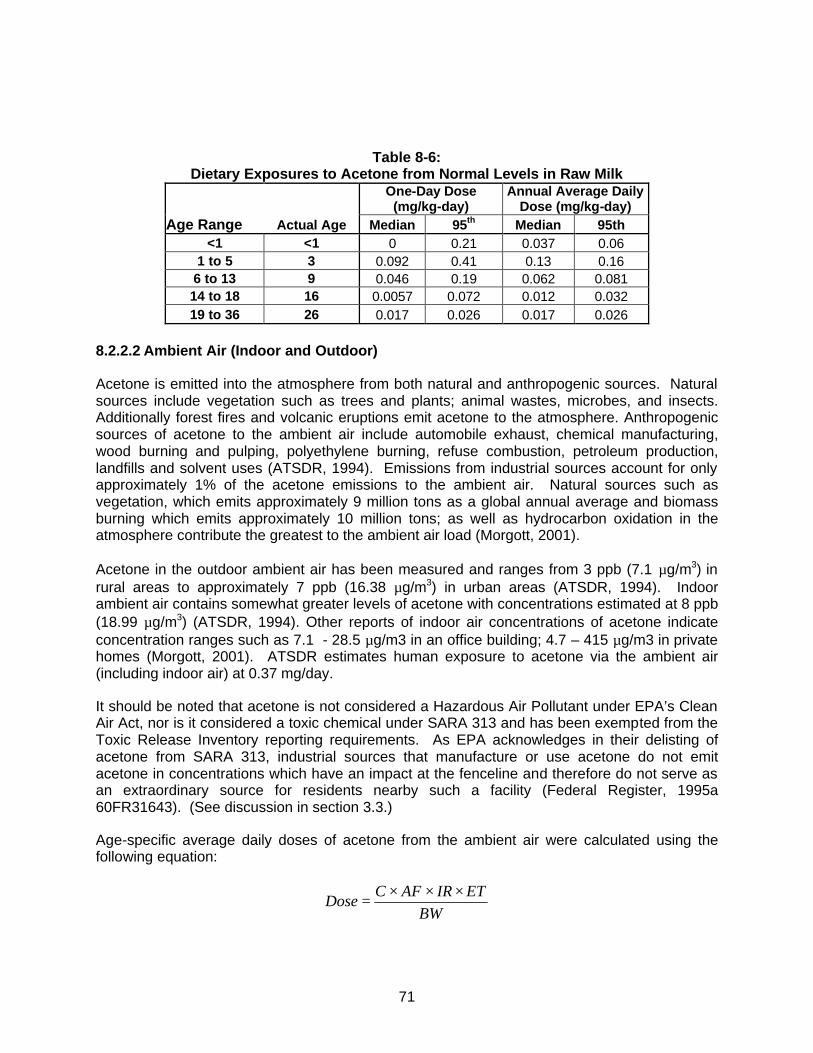
71
Table 8-6:
Dietary Exposures to Acetone from Normal Levels in Raw Milk
One-Day Dose
(mg/kg-day) Annual Average Daily
Dose (mg/kg-day) Age Range Actual Age Median 95th Median 95th
<1 <1 0 0.21 0.037 0.06 1 to 5 3 0.092 0.41 0.13 0.16
6 to 13 9 0.046 0.19 0.062 0.081 14 to 18 16 0.0057 0.072 0.012 0.032 19 to 36 26 0.017 0.026 0.017 0.026
8.2.2.2 Ambient Air (Indoor and Outdoor)
Acetone is emitted into the atmosphere from both natural and anthropogenic sources. Natural sources include vegetation such as trees and plants; animal wastes, microbes, and insects. Additionally forest fires and volcanic eruptions emit acetone to the atmosphere. Anthropogenic sources of acetone to the ambient air include automobile exhaust, chemical manufacturing, wood burning and pulping, polyethylene burning, refuse combustion, petroleum production, landfills and solvent uses (ATSDR, 1994). Emissions from industrial sources account for only approximately 1% of the acetone emissions to the ambient air. Natural sources such as vegetation, which emits approximately 9 million tons as a global annual average and biomass burning which emits approximately 10 million tons; as well as hydrocarbon oxidation in the atmosphere contribute the greatest to the ambient air load (Morgott, 2001).
Acetone in the outdoor ambient air has been measured and ranges from 3 ppb (7.1 µg/m3) in rural areas to approximately 7 ppb (16.38 µg/m3) in urban areas (ATSDR, 1994). Indoor ambient air contains somewhat greater levels of acetone with concentrations estimated at 8 ppb (18.99 µg/m3) (ATSDR, 1994). Other reports of indoor air concentrations of acetone indicate concentration ranges such as 7.1 - 28.5 µg/m3 in an office building; 4.7 – 415 µg/m3 in private homes (Morgott, 2001). ATSDR estimates human exposure to acetone via the ambient air (including indoor air) at 0.37 mg/day.
It should be noted that acetone is not considered a Hazardous Air Pollutant under EPA’s Clean Air Act, nor is it considered a toxic chemical under SARA 313 and has been exempted from the Toxic Release Inventory reporting requirements. As EPA acknowledges in their delisting of acetone from SARA 313, industrial sources that manufacture or use acetone do not emit acetone in concentrations which have an impact at the fenceline and therefore do not serve as an extraordinary source for residents nearby such a facility (Federal Register, 1995a 60FR31643). (See discussion in section 3.3.)
Age-specific average daily doses of acetone from the ambient air were calculated using the following equation:
BWETIRAFC
Dose×××
=

72
where, Dose = Average daily dose of acetone from inhalation exposure (mg/kg-day) C = Concentration of acetone in air (mg/m3) AF = Inhalation absorption factor (unitless) IR = Inhalation rate (m3/hr) ET = Exposure time (hr/day) BW = Body weight The exposure factors and age-specific doses for acetone from the ambient indoor and outdoor air are presented on Tables 8-7 and 8-8, respectively.
Table 8-7: Exposure factors for Age-Specific Chronic Doses for Acetone from Ambient Air
Exposure Parameter Units < 1
year old 1-5
year old 6-13
year old 14-18
year old 18-35
year old Concentration – indoor µg/m3 19.0 19.0 19.0 19.0 19.0
Concentration – outdoor urban µg/m3 16.4 16.4 16.4 16.4 16.4 Concentration – outdoor rural µg/m3 7.1 7.1 7.1 7.1 7.1 Inhalation absorption factora unitless 0.44 0.44 0.44 0.44 0.44
Exposure time – indoorb hours/day 21 21 21 21 21 Exposure time – outdoor & in-
vehicleb hours/day 3 3 3 3 3
Inhalation ratec m3/h 0.19 0.31 0.51 0.6 0.47 Body weightc kg 7.2 15.4 35 61 62.4
a Wigaeus et al., 1981. bThe amount of time spent in an indoor environment for all age groups is conservatively derived from the Exposure Factors Handbook (USEPA, 1997) recommended value for adults and is consistent with the value used in the EPA’s E-FAST exposure model. Time spent outdoors includes time in vehicle. cAll age groups represent boys and girls except the 18 - 35 age group, which represents women only. Body weights and inhalation rates are derived from Exposure Factors Handbook and Children’s Exposure Factor Handbook (USEPA, 2002).
Table 8-8: Age-Specific Dose Estimates for Acetone from Ambient Air
Acetone Dose (mg/kg-day) Environment
< 1 year old
1-5 year old
6-13 year old
14-18 year old
18-35 year old
Indoor Air 4.6E-03 3.5E-03 2.6E-03 1.7E-03 1.3E-03 Outdoor air – urban 5.7E-04 4.4E-04 3.2E-04 2.1E-04 1.6E-04 Outdoor air - rural 2.5E-04 1.9E-04 1.4E-04 9.2E-05 7.1E-05 Total ambient – urban 5.2E-03 4.0E-03 2.9E-03 1.9E-03 1.5E-03 Total ambient - rural 4.9E-03 3.7E-03 2.7E-03 1.8E-03 1.4E-03

73
8.2.2.3 Drinking Water
Available occurrence data indicate that acetone is rarely detected in tap water, although it has been detected at levels ranging from 2 – 7 µg/L in residential well water (Dewalle and Chian, 1981). ATSDR indicates that typically, the concentration is less than 1 ppb and concludes that the daily intake for acetone from this source would be negligible - approximately 0.002 µg/day (assuming 2 L/day intake rate, but children under the age of 14 generally consume 1 – 1.5 L/day). Additionally, acetone was proposed as a candidate chemical under EPA’s Safe Water Drinking Act, but subsequently removed (Federal Register, 1995b). Age-specific doses of acetone from drinking water were derived assuming an average concentration of 1 ppb and by using the following equation:
BWIRABSC
Dose××
=
where, Dose = Average daily dose of acetone from inhalation exposure (mg/kg-day) C = Concentration of acetone in water (mg/L) ABS = Absorption factor (unitless) IR = Ingestion rate (L/day) BW = Body weight
The results are presented in Table 8-9.
Table 8-9:
Age-Specific Doses of Acetone from Drinking Water
Units < 1
year old 1-5
year old 6-13
year old 14-18
year old 18-35
year old Concentration mg/L 0.001 0.001 0.001 0.001 0.001 Ingestion rate L/day 0.24 1.5 1.5 2 2.5 Body weight kg 7.2 15.4 35 61 62.4 Absorption factor unitless 1 1 1 1 1
Dose mg/kg-d 3.3E-05 9.7E-05 4.3E-05 3.3E-05 4.0E-05 8.2.3 Prospective Parent’s Exogenous Exposures
Parental exposure to acetone will be from an occupational exposure, a personal exposure in a non-occupational environment, or both. There are three primary industrial source classifications in terms of occupational exposure. These include exposure to the chemical during 1) production of the raw chemical, 2) manufacture of other products using acetone as a chemical intermediate (i.e., methyl methacrylate, methacrylic acid, methyl isobutyl ketone, and various pharmaceuticals) or as a solvent component for paints, varnishes and waxes, or 3) use of an end product such as in a skilled trade (i.e., painting, printing, or furniture refinishing).
Parental non-occupational exposures are likely to occur from the same sources (i.e., ambient air, food and water and consumer products) as children. As with the childhood exposures,
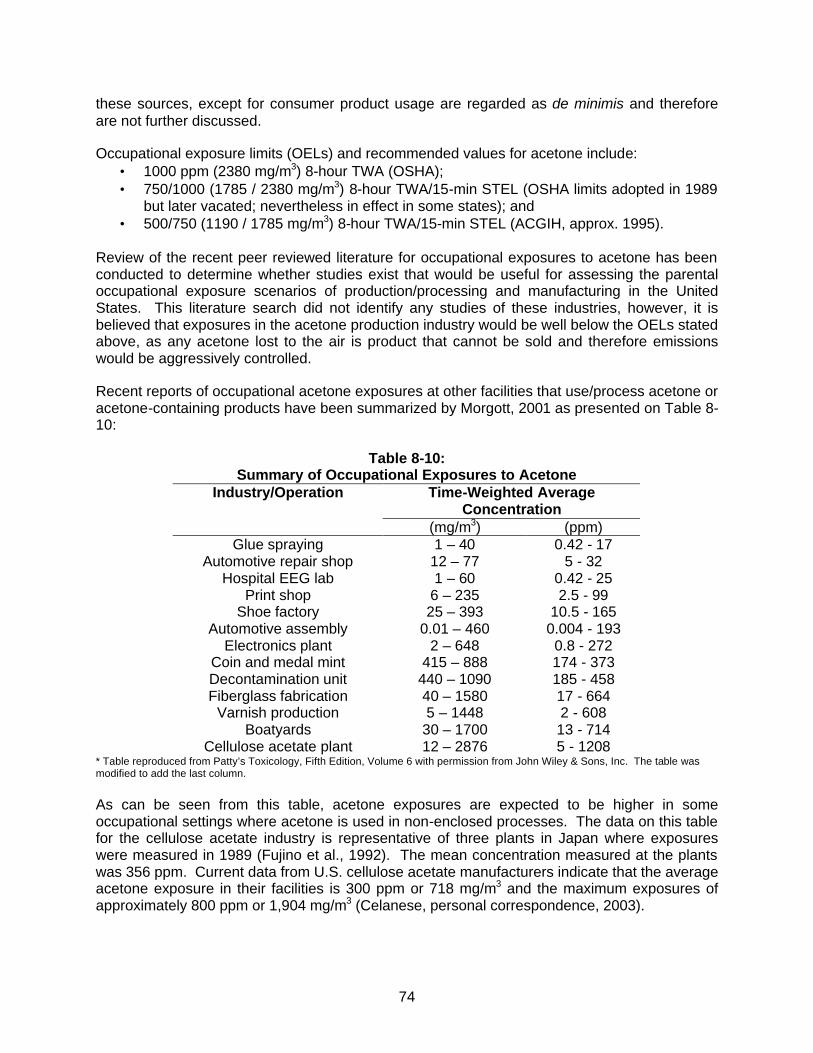
74
these sources, except for consumer product usage are regarded as de minimis and therefore are not further discussed.
Occupational exposure limits (OELs) and recommended values for acetone include: • 1000 ppm (2380 mg/m3) 8-hour TWA (OSHA); • 750/1000 (1785 / 2380 mg/m3) 8-hour TWA/15-min STEL (OSHA limits adopted in 1989
but later vacated; nevertheless in effect in some states); and • 500/750 (1190 / 1785 mg/m3) 8-hour TWA/15-min STEL (ACGIH, approx. 1995).
Review of the recent peer reviewed literature for occupational exposures to acetone has been conducted to determine whether studies exist that would be useful for assessing the parental occupational exposure scenarios of production/processing and manufacturing in the United States. This literature search did not identify any studies of these industries, however, it is believed that exposures in the acetone production industry would be well below the OELs stated above, as any acetone lost to the air is product that cannot be sold and therefore emissions would be aggressively controlled.
Recent reports of occupational acetone exposures at other facilities that use/process acetone or acetone-containing products have been summarized by Morgott, 2001 as presented on Table 8-10:
Table 8-10:
Summary of Occupational Exposures to Acetone Industry/Operation Time-Weighted Average
Concentration (mg/m3) (ppm)
Glue spraying 1 – 40 0.42 - 17 Automotive repair shop 12 – 77 5 - 32
Hospital EEG lab 1 – 60 0.42 - 25 Print shop 6 – 235 2.5 - 99
Shoe factory 25 – 393 10.5 - 165 Automotive assembly 0.01 – 460 0.004 - 193
Electronics plant 2 – 648 0.8 - 272 Coin and medal mint 415 – 888 174 - 373 Decontamination unit 440 – 1090 185 - 458 Fiberglass fabrication 40 – 1580 17 - 664
Varnish production 5 – 1448 2 - 608 Boatyards 30 – 1700 13 - 714
Cellulose acetate plant 12 – 2876 5 - 1208 * Table reproduced from Patty’s Toxicology, Fifth Edition, Volume 6 with permission from John Wiley & Sons, Inc. The table was modified to add the last column. As can be seen from this table, acetone exposures are expected to be higher in some occupational settings where acetone is used in non-enclosed processes. The data on this table for the cellulose acetate industry is representative of three plants in Japan where exposures were measured in 1989 (Fujino et al., 1992). The mean concentration measured at the plants was 356 ppm. Current data from U.S. cellulose acetate manufacturers indicate that the average acetone exposure in their facilities is 300 ppm or 718 mg/m3 and the maximum exposures of approximately 800 ppm or 1,904 mg/m3 (Celanese, personal correspondence, 2003).

75
In addition to the industries listed on Table 8-10, exposure to acetone occurs in nail salons. A search of occupational on-line databases produced two industrial hygiene surveys of nail salons in which acetone exposures were evaluated (NIOSH, 1991 and 1992). One salon was located in Springdale, OH and the other was located in Norman, OK. Both salons had the capacity for two nail technicians, and were served by mechanical ventilation systems with no provision for introduction of outside fresh air. The purpose of the survey in the Ohio salon was evaluation of an odor complaint from an adjacent business and the survey in Oklahoma was prompted by a request from the owner/operator concerned with chemical exposures while using nail products. In both salons, NIOSH evaluated exposures to a variety of chemicals including ethyl acrylate, methyl acrylate, benzene, formaldehyde, acetone, n-butyl acetate, ethyl acetate, toluene and 1,1,1-trichloroethane. The results from these two surveys indicated full-shift air concentrations of acetone ranging from 0.75 to 13 ppm. NIOSH concluded from these surveys that although odors are often observed emanating from nail salons, the levels of vapors measured do not constitute a health hazard to the workers or customers or to adjacent businesses. In each case, NIOSH recommended installation of an exhaust ventilation system and an outdoor air supply. Thus, although information related to acetone exposures in nail salons is limited to these studies, the ventilation conditions of these two salons likely represent a worst case scenario compared to larger salons located in shopping malls where ventilation rates are certain to be higher.
For the purposes of this assessment, occupational exposures are assumed to be in the range of the ACGIH TLV. The average daily dose from inhalation exposure at the TLV was calculated using the following equation:
yearday
BW
EFETIRAFCDose
365×
××××=
where, Dose = Average daily dose of acetone from inhalation exposure (mg/kg-day) C = Concentration of acetone in air (mg/m3) AF = Inhalation absorption factor (unitless) IR = Inhalation rate (m3/hr) EF = Exposure frequency (days/year) ET = Exposure time (hr/day) BW = Body weight The results are presented on Table 8-11.
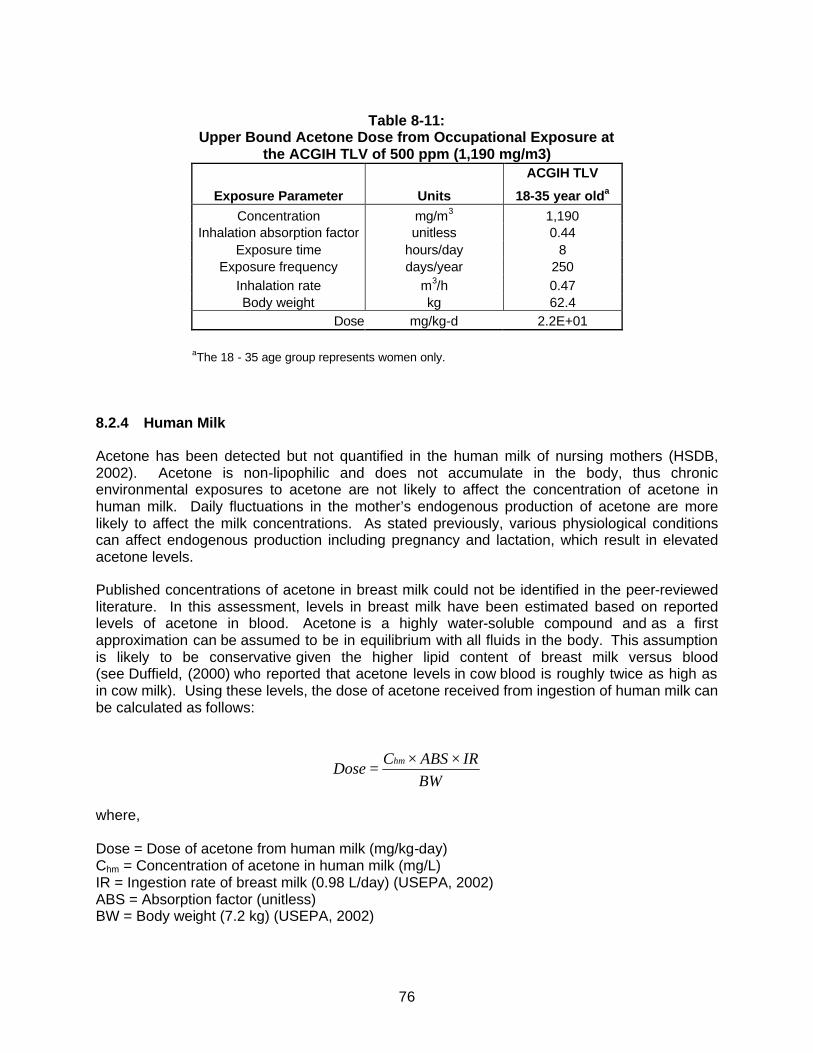
76
Table 8-11:
Upper Bound Acetone Dose from Occupational Exposure at the ACGIH TLV of 500 ppm (1,190 mg/m3)
ACGIH TLV
Exposure Parameter Units 18-35 year olda Concentration mg/m3 1,190
Inhalation absorption factor unitless 0.44 Exposure time hours/day 8
Exposure frequency days/year 250 Inhalation rate m3/h 0.47 Body weight kg 62.4
Dose mg/kg-d 2.2E+01
aThe 18 - 35 age group represents women only. 8.2.4 Human Milk
Acetone has been detected but not quantified in the human milk of nursing mothers (HSDB, 2002). Acetone is non-lipophilic and does not accumulate in the body, thus chronic environmental exposures to acetone are not likely to affect the concentration of acetone in human milk. Daily fluctuations in the mother’s endogenous production of acetone are more likely to affect the milk concentrations. As stated previously, various physiological conditions can affect endogenous production including pregnancy and lactation, which result in elevated acetone levels.
Published concentrations of acetone in breast milk could not be identified in the peer-reviewed literature. In this assessment, levels in breast milk have been estimated based on reported levels of acetone in blood. Acetone is a highly water-soluble compound and as a first approximation can be assumed to be in equilibrium with all fluids in the body. This assumption is likely to be conservative given the higher lipid content of breast milk versus blood (see Duffield, (2000) who reported that acetone levels in cow blood is roughly twice as high as in cow milk). Using these levels, the dose of acetone received from ingestion of human milk can be calculated as follows:
BWIRABSC
Dosehm ××
=
where, Dose = Dose of acetone from human milk (mg/kg-day) Chm = Concentration of acetone in human milk (mg/L) IR = Ingestion rate of breast milk (0.98 L/day) (USEPA, 2002) ABS = Absorption factor (unitless) BW = Body weight (7.2 kg) (USEPA, 2002)
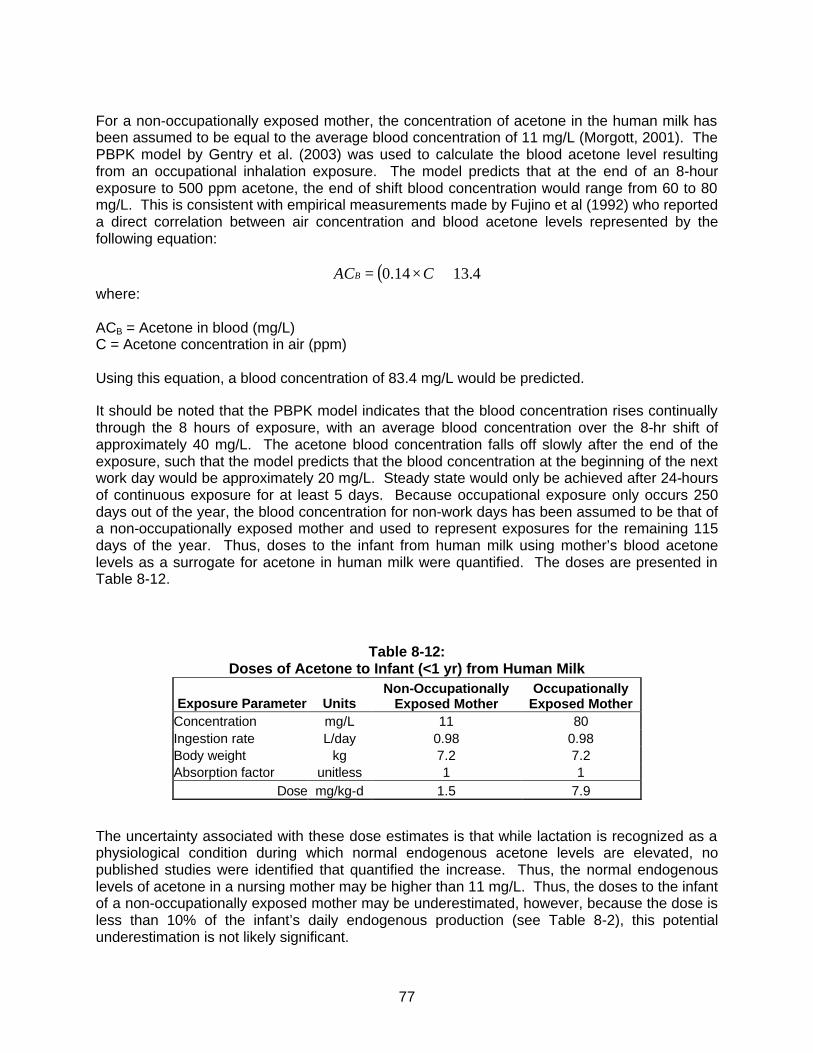
77
For a non-occupationally exposed mother, the concentration of acetone in the human milk has been assumed to be equal to the average blood concentration of 11 mg/L (Morgott, 2001). The PBPK model by Gentry et al. (2003) was used to calculate the blood acetone level resulting from an occupational inhalation exposure. The model predicts that at the end of an 8-hour exposure to 500 ppm acetone, the end of shift blood concentration would range from 60 to 80 mg/L. This is consistent with empirical measurements made by Fujino et al (1992) who reported a direct correlation between air concentration and blood acetone levels represented by the following equation:
( ) 4.1314.0 +×= CACB where: ACB = Acetone in blood (mg/L) C = Acetone concentration in air (ppm) Using this equation, a blood concentration of 83.4 mg/L would be predicted.
It should be noted that the PBPK model indicates that the blood concentration rises continually through the 8 hours of exposure, with an average blood concentration over the 8-hr shift of approximately 40 mg/L. The acetone blood concentration falls off slowly after the end of the exposure, such that the model predicts that the blood concentration at the beginning of the next work day would be approximately 20 mg/L. Steady state would only be achieved after 24-hours of continuous exposure for at least 5 days. Because occupational exposure only occurs 250 days out of the year, the blood concentration for non-work days has been assumed to be that of a non-occupationally exposed mother and used to represent exposures for the remaining 115 days of the year. Thus, doses to the infant from human milk using mother’s blood acetone levels as a surrogate for acetone in human milk were quantified. The doses are presented in Table 8-12.
Table 8-12: Doses of Acetone to Infant (<1 yr) from Human Milk
Exposure Parameter Units Non-Occupationally
Exposed Mother Occupationally
Exposed Mother Concentration mg/L 11 80 Ingestion rate L/day 0.98 0.98 Body weight kg 7.2 7.2 Absorption factor unitless 1 1
Dose mg/kg-d 1.5 7.9
The uncertainty associated with these dose estimates is that while lactation is recognized as a physiological condition during which normal endogenous acetone levels are elevated, no published studies were identified that quantified the increase. Thus, the normal endogenous levels of acetone in a nursing mother may be higher than 11 mg/L. Thus, the doses to the infant of a non-occupationally exposed mother may be underestimated, however, because the dose is less than 10% of the infant’s daily endogenous production (see Table 8-2), this potential underestimation is not likely significant.
78
8.2.5 Exogenous Exposures from Consumer Product Use
A large variety of consumer products contain at least a trace amount of acetone. As part of an EPA study, 1,159 consumer products from 65 product categories were analyzed for VOC content by GC/MS with a detection limit of 0.1% by weight (Sack et al., 1992). The Sack et al. study was reviewed to determine which product categories had products that contained greater than 0.1% by weight acetone. Based on this review, 37 product categories were identified for which at least one product contained acetone. Tables 8-13 and 8-14 show the product categories and representative products that Sack identified as containing greater than 0.1% by weight acetone.

79
Table 8-13:
Acetone content in consumer products based on Sack et al. (1992) study data
Less than 0.1% by weight (less than detection limit) • Adhesive removers • Door spray lubricant • Rug cleaner • Wallpaper remover/adhesive • Automotive sealant • Drain cleaner (non-acid) • Silicone lubricant • Water pump lubricant
• Bathroom cleaner • Electric shaver cleaner • Spray starch • Wax stripper • Caulking • Floor wax • Stain remover • Window cleaner • Chrome protector/wax • Furniture polish • Starting fluid spray • Windshield de-icer • Circuit board cleaner • Ignition wire dryers • Upholstery cleaner • Miscellaneous automobile
products • Deodorizer/disinfectant • Liquid exterior car cleaner • Vinyl top spray
0.1% to 1% by weighta • All-purpose liquid cleaner • Laundry presoak • Specialized cleaner • Water repellent • Automotive undercoat • Lubricant • Suede protector • Wood cleaner • Belt lubricants/dressings • Oven cleaner • Tape recorder cleaner • General purpose spray
cleaners • Correction fluid • Record cleaner • Tire puncture sealers • Dip metal cleaner • Record player cleaner • TV/computer screen cleaner • Fabric finisher (protectant) • Rust remover • VCR cleaner
1% to 10% by weighta • Paint thinner • Tire cleaner / tire paint
10% to 30% by weighta • Adhesive • Carburetor and choke cleaner • Transmission cleaner • Wood stains, varnishes,
finishes • Battery cleaners/protectors • Paint remover
30% to 50% by weighta • Brake quieters/cleaners • Primer and special primer • Spot remover • Spray paint • Engine cleaner
50% to 100% by weighta • Gasket adhesives/removers • Spray shoe polish • Glass frosting spray aProduct categories were placed in weight ranges based on the average of the test results for individual products. Weight percents were calculated by exluding those products where acetone was not detected.
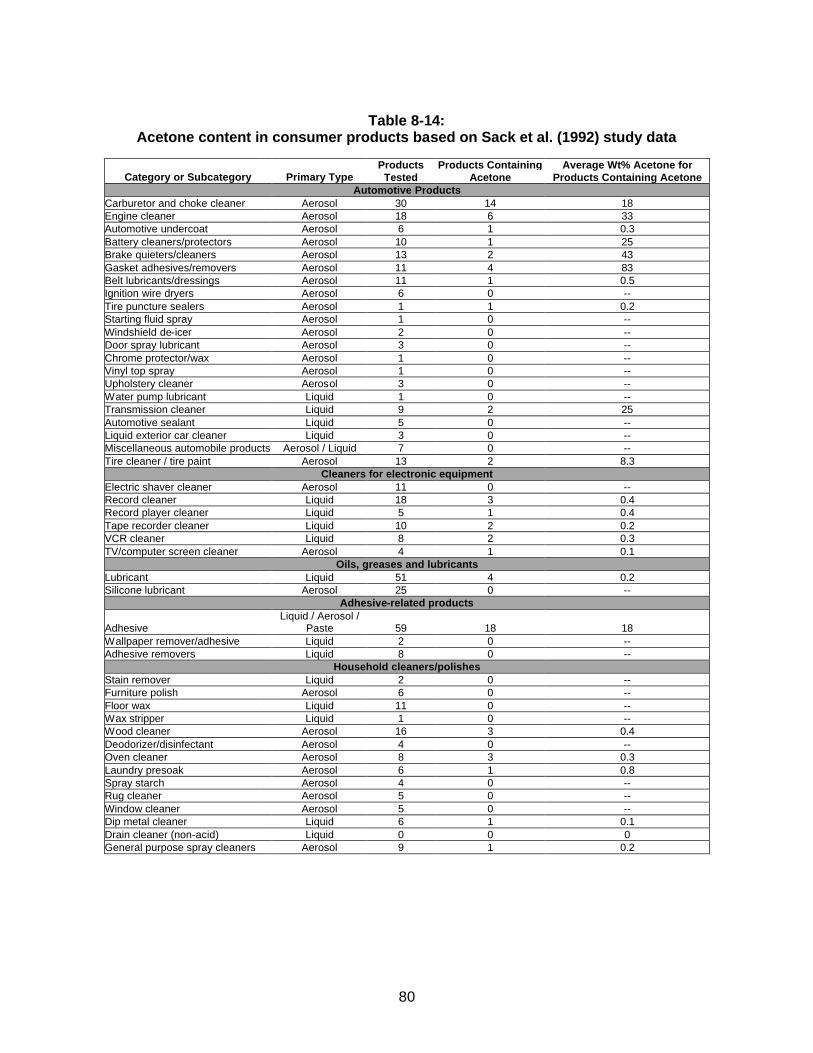
80
Table 8-14:
Acetone content in consumer products based on Sack et al. (1992) study data
Category or Subcategory Primary Type Products
Tested Products Containing
Acetone Average Wt% Acetone for
Products Containing Acetone Automotive Products
Carburetor and choke cleaner Aerosol 30 14 18 Engine cleaner Aerosol 18 6 33 Automotive undercoat Aerosol 6 1 0.3 Battery cleaners/protectors Aerosol 10 1 25 Brake quieters/cleaners Aerosol 13 2 43 Gasket adhesives/removers Aerosol 11 4 83 Belt lubricants/dressings Aerosol 11 1 0.5 Ignition wire dryers Aerosol 6 0 -- Tire puncture sealers Aerosol 1 1 0.2 Starting fluid spray Aerosol 1 0 -- Windshield de-icer Aerosol 2 0 -- Door spray lubricant Aerosol 3 0 -- Chrome protector/wax Aerosol 1 0 -- Vinyl top spray Aerosol 1 0 -- Upholstery cleaner Aerosol 3 0 -- Water pump lubricant Liquid 1 0 -- Transmission cleaner Liquid 9 2 25 Automotive sealant Liquid 5 0 -- Liquid exterior car cleaner Liquid 3 0 -- Miscellaneous automobile products Aerosol / Liquid 7 0 -- Tire cleaner / tire paint Aerosol 13 2 8.3
Cleaners for electronic equipment Electric shaver cleaner Aerosol 11 0 -- Record cleaner Liquid 18 3 0.4 Record player cleaner Liquid 5 1 0.4 Tape recorder cleaner Liquid 10 2 0.2 VCR cleaner Liquid 8 2 0.3 TV/computer screen cleaner Aerosol 4 1 0.1
Oils, greases and lubricants Lubricant Liquid 51 4 0.2 Silicone lubricant Aerosol 25 0 --
Adhesive-related products
Adhesive Liquid / Aerosol /
Paste 59 18 18 Wallpaper remover/adhesive Liquid 2 0 -- Adhesive removers Liquid 8 0 --
Household cleaners/polishes Stain remover Liquid 2 0 -- Furniture polish Aerosol 6 0 -- Floor wax Liquid 11 0 -- Wax stripper Liquid 1 0 -- Wood cleaner Aerosol 16 3 0.4 Deodorizer/disinfectant Aerosol 4 0 -- Oven cleaner Aerosol 8 3 0.3 Laundry presoak Aerosol 6 1 0.8 Spray starch Aerosol 4 0 -- Rug cleaner Aerosol 5 0 -- Window cleaner Aerosol 5 0 -- Dip metal cleaner Liquid 6 1 0.1 Drain cleaner (non-acid) Liquid 0 0 0 General purpose spray cleaners Aerosol 9 1 0.2
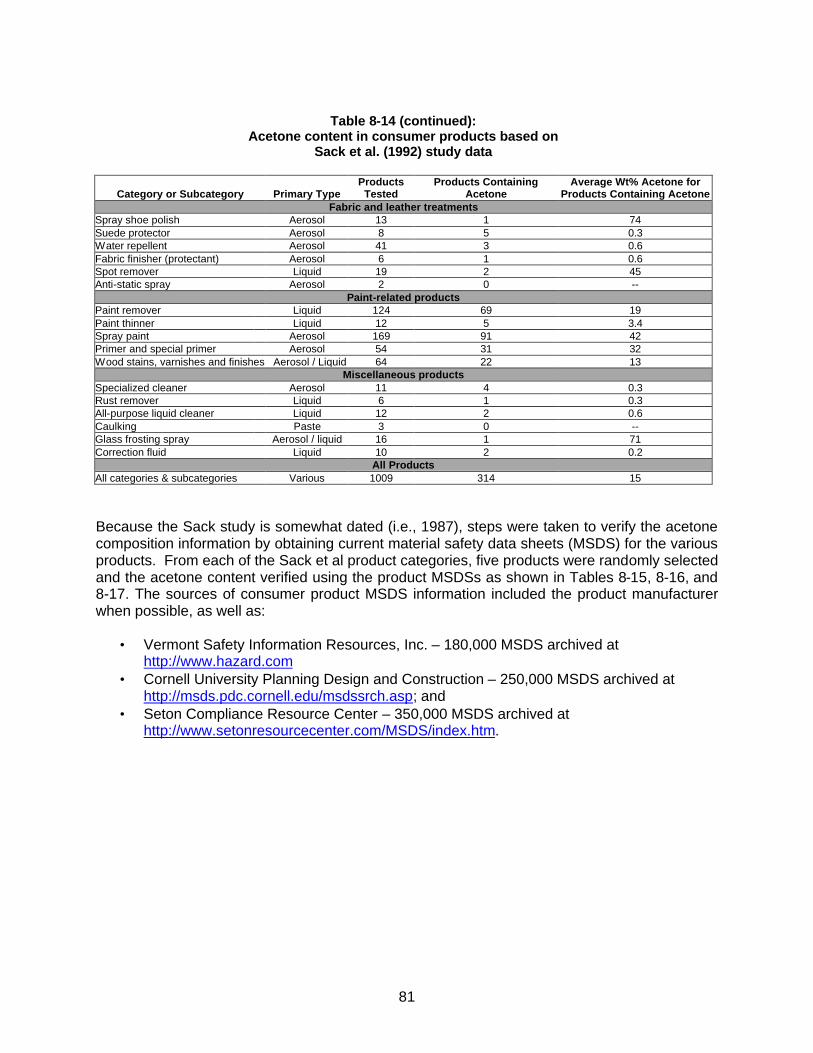
81
Table 8-14 (continued):
Acetone content in consumer products based on Sack et al. (1992) study data
Category or Subcategory Primary Type Products
Tested Products Containing
Acetone Average Wt% Acetone for
Products Containing Acetone Fabric and leather treatments
Spray shoe polish Aerosol 13 1 74 Suede protector Aerosol 8 5 0.3 Water repellent Aerosol 41 3 0.6 Fabric finisher (protectant) Aerosol 6 1 0.6 Spot remover Liquid 19 2 45 Anti-static spray Aerosol 2 0 --
Paint-related products Paint remover Liquid 124 69 19 Paint thinner Liquid 12 5 3.4 Spray paint Aerosol 169 91 42 Primer and special primer Aerosol 54 31 32 Wood stains, varnishes and finishes Aerosol / Liquid 64 22 13
Miscellaneous products Specialized cleaner Aerosol 11 4 0.3 Rust remover Liquid 6 1 0.3 All-purpose liquid cleaner Liquid 12 2 0.6 Caulking Paste 3 0 -- Glass frosting spray Aerosol / liquid 16 1 71 Correction fluid Liquid 10 2 0.2
All Products All categories & subcategories Various 1009 314 15
Because the Sack study is somewhat dated (i.e., 1987), steps were taken to verify the acetone composition information by obtaining current material safety data sheets (MSDS) for the various products. From each of the Sack et al product categories, five products were randomly selected and the acetone content verified using the product MSDSs as shown in Tables 8-15, 8-16, and 8-17. The sources of consumer product MSDS information included the product manufacturer when possible, as well as:
• Vermont Safety Information Resources, Inc. – 180,000 MSDS archived at http://www.hazard.com
• Cornell University Planning Design and Construction – 250,000 MSDS archived at http://msds.pdc.cornell.edu/msdssrch.asp; and
• Seton Compliance Resource Center – 350,000 MSDS archived at http://www.setonresourcecenter.com/MSDS/index.htm.
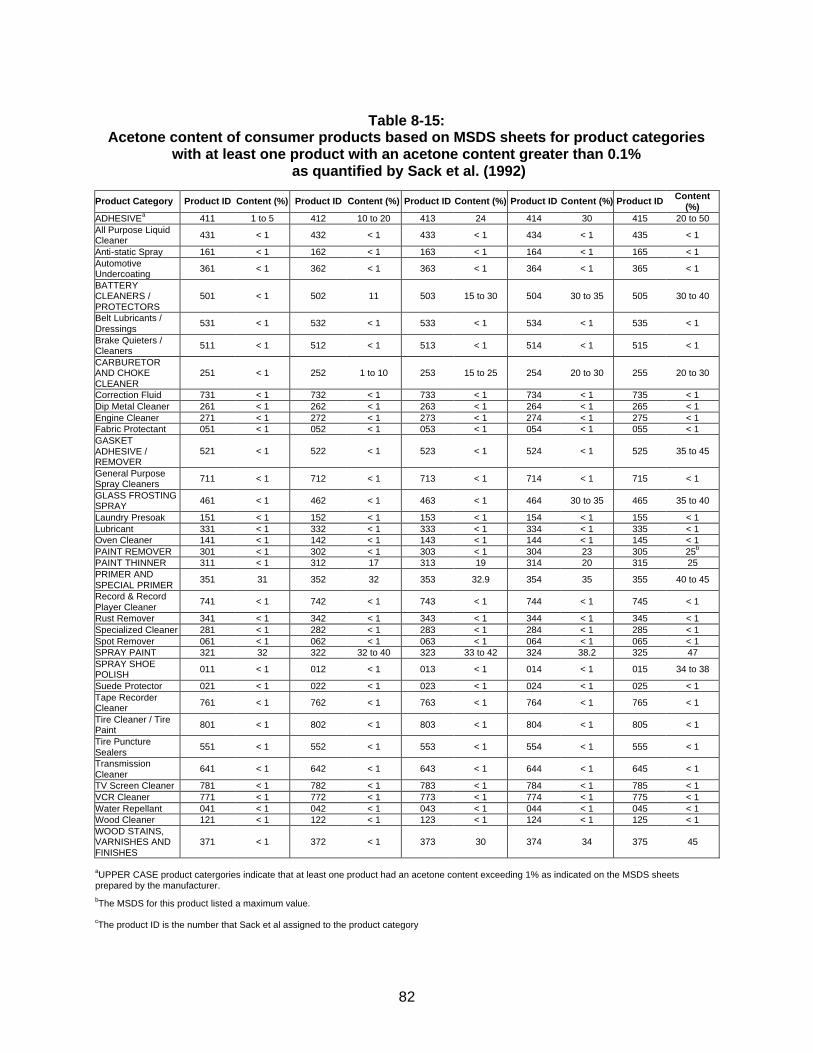
82
Table 8-15:
Acetone content of consumer products based on MSDS sheets for product categories with at least one product with an acetone content greater than 0.1%
as quantified by Sack et al. (1992)
Product Category Product ID Content (%) Product ID Content (%) Product ID Content (%) Product ID Content (%) Product ID Content (%)
ADHESIVEa 411 1 to 5 412 10 to 20 413 24 414 30 415 20 to 50 All Purpose Liquid Cleaner 431 < 1 432 < 1 433 < 1 434 < 1 435 < 1
Anti-static Spray 161 < 1 162 < 1 163 < 1 164 < 1 165 < 1 Automotive Undercoating 361 < 1 362 < 1 363 < 1 364 < 1 365 < 1
BATTERY CLEANERS / PROTECTORS
501 < 1 502 11 503 15 to 30 504 30 to 35 505 30 to 40
Belt Lubricants / Dressings
531 < 1 532 < 1 533 < 1 534 < 1 535 < 1
Brake Quieters / Cleaners 511 < 1 512 < 1 513 < 1 514 < 1 515 < 1
CARBURETOR AND CHOKE CLEANER
251 < 1 252 1 to 10 253 15 to 25 254 20 to 30 255 20 to 30
Correction Fluid 731 < 1 732 < 1 733 < 1 734 < 1 735 < 1 Dip Metal Cleaner 261 < 1 262 < 1 263 < 1 264 < 1 265 < 1 Engine Cleaner 271 < 1 272 < 1 273 < 1 274 < 1 275 < 1 Fabric Protectant 051 < 1 052 < 1 053 < 1 054 < 1 055 < 1 GASKET ADHESIVE / REMOVER
521 < 1 522 < 1 523 < 1 524 < 1 525 35 to 45
General Purpose Spray Cleaners 711 < 1 712 < 1 713 < 1 714 < 1 715 < 1
GLASS FROSTING SPRAY 461 < 1 462 < 1 463 < 1 464 30 to 35 465 35 to 40
Laundry Presoak 151 < 1 152 < 1 153 < 1 154 < 1 155 < 1 Lubricant 331 < 1 332 < 1 333 < 1 334 < 1 335 < 1 Oven Cleaner 141 < 1 142 < 1 143 < 1 144 < 1 145 < 1 PAINT REMOVER 301 < 1 302 < 1 303 < 1 304 23 305 25b PAINT THINNER 311 < 1 312 17 313 19 314 20 315 25 PRIMER AND SPECIAL PRIMER
351 31 352 32 353 32.9 354 35 355 40 to 45
Record & Record Player Cleaner
741 < 1 742 < 1 743 < 1 744 < 1 745 < 1
Rust Remover 341 < 1 342 < 1 343 < 1 344 < 1 345 < 1 Specialized Cleaner 281 < 1 282 < 1 283 < 1 284 < 1 285 < 1 Spot Remover 061 < 1 062 < 1 063 < 1 064 < 1 065 < 1 SPRAY PAINT 321 32 322 32 to 40 323 33 to 42 324 38.2 325 47 SPRAY SHOE POLISH 011 < 1 012 < 1 013 < 1 014 < 1 015 34 to 38
Suede Protector 021 < 1 022 < 1 023 < 1 024 < 1 025 < 1 Tape Recorder Cleaner 761 < 1 762 < 1 763 < 1 764 < 1 765 < 1
Tire Cleaner / Tire Paint 801 < 1 802 < 1 803 < 1 804 < 1 805 < 1
Tire Puncture Sealers
551 < 1 552 < 1 553 < 1 554 < 1 555 < 1
Transmission Cleaner
641 < 1 642 < 1 643 < 1 644 < 1 645 < 1
TV Screen Cleaner 781 < 1 782 < 1 783 < 1 784 < 1 785 < 1 VCR Cleaner 771 < 1 772 < 1 773 < 1 774 < 1 775 < 1 Water Repellant 041 < 1 042 < 1 043 < 1 044 < 1 045 < 1 Wood Cleaner 121 < 1 122 < 1 123 < 1 124 < 1 125 < 1 WOOD STAINS, VARNISHES AND FINISHES
371 < 1 372 < 1 373 30 374 34 375 45
aUPPER CASE product catergories indicate that at least one product had an acetone content exceeding 1% as indicated on the MSDS sheets prepared by the manufacturer. bThe MSDS for this product listed a maximum value.
cThe product ID is the number that Sack et al assigned to the product category
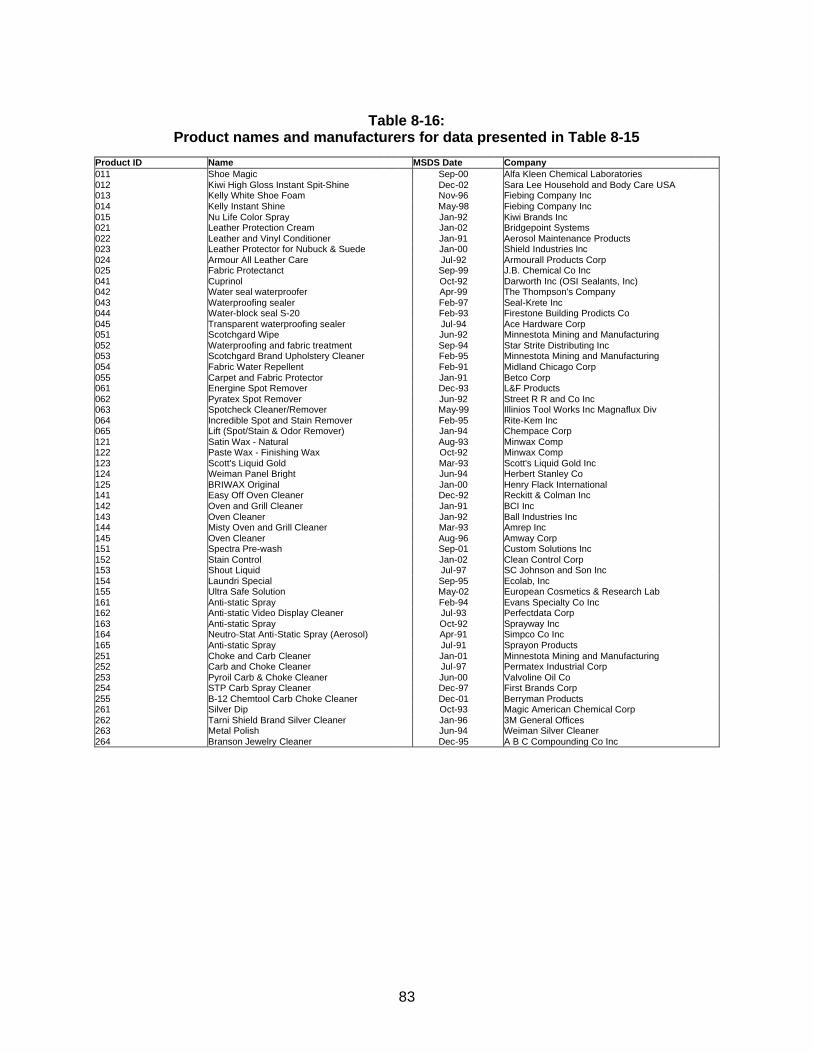
83
Table 8-16:
Product names and manufacturers for data presented in Table 8-15 Product ID Name MSDS Date Company 011 Shoe Magic Sep-00 Alfa Kleen Chemical Laboratories 012 Kiwi High Gloss Instant Spit-Shine Dec-02 Sara Lee Household and Body Care USA 013 Kelly White Shoe Foam Nov-96 Fiebing Company Inc 014 Kelly Instant Shine May-98 Fiebing Company Inc 015 Nu Life Color Spray Jan-92 Kiwi Brands Inc 021 Leather Protection Cream Jan-02 Bridgepoint Systems 022 Leather and Vinyl Conditioner Jan-91 Aerosol Maintenance Products 023 Leather Protector for Nubuck & Suede Jan-00 Shield Industries Inc 024 Armour All Leather Care Jul-92 Armourall Products Corp 025 Fabric Protectanct Sep-99 J.B. Chemical Co Inc 041 Cuprinol Oct-92 Darworth Inc (OSI Sealants, Inc) 042 Water seal waterproofer Apr-99 The Thompson's Company 043 Waterproofing sealer Feb-97 Seal-Krete Inc 044 Water-block seal S-20 Feb-93 Firestone Building Prodicts Co 045 Transparent waterproofing sealer Jul-94 Ace Hardware Corp 051 Scotchgard Wipe Jun-92 Minnestota Mining and Manufacturing 052 Waterproofing and fabric treatment Sep-94 Star Strite Distributing Inc 053 Scotchgard Brand Upholstery Cleaner Feb-95 Minnestota Mining and Manufacturing 054 Fabric Water Repellent Feb-91 Midland Chicago Corp 055 Carpet and Fabric Protector Jan-91 Betco Corp 061 Energine Spot Remover Dec-93 L&F Products 062 Pyratex Spot Remover Jun-92 Street R R and Co Inc 063 Spotcheck Cleaner/Remover May-99 Illinios Tool Works Inc Magnaflux Div 064 Incredible Spot and Stain Remover Feb-95 Rite-Kem Inc 065 Lift (Spot/Stain & Odor Remover) Jan-94 Chempace Corp 121 Satin Wax - Natural Aug-93 Minwax Comp 122 Paste Wax - Finishing Wax Oct-92 Minwax Comp 123 Scott's Liquid Gold Mar-93 Scott's Liquid Gold Inc 124 Weiman Panel Bright Jun-94 Herbert Stanley Co 125 BRIWAX Original Jan-00 Henry Flack International 141 Easy Off Oven Cleaner Dec-92 Reckitt & Colman Inc 142 Oven and Grill Cleaner Jan-91 BCI Inc 143 Oven Cleaner Jan-92 Ball Industries Inc 144 Misty Oven and Grill Cleaner Mar-93 Amrep Inc 145 Oven Cleaner Aug-96 Amway Corp 151 Spectra Pre-wash Sep-01 Custom Solutions Inc 152 Stain Control Jan-02 Clean Control Corp 153 Shout Liquid Jul-97 SC Johnson and Son Inc 154 Laundri Special Sep-95 Ecolab, Inc 155 Ultra Safe Solution May-02 European Cosmetics & Research Lab 161 Anti-static Spray Feb-94 Evans Specialty Co Inc 162 Anti-static Video Display Cleaner Jul-93 Perfectdata Corp 163 Anti-static Spray Oct-92 Sprayway Inc 164 Neutro-Stat Anti-Static Spray (Aerosol) Apr-91 Simpco Co Inc 165 Anti-static Spray Jul-91 Sprayon Products 251 Choke and Carb Cleaner Jan-01 Minnestota Mining and Manufacturing 252 Carb and Choke Cleaner Jul-97 Permatex Industrial Corp 253 Pyroil Carb & Choke Cleaner Jun-00 Valvoline Oil Co 254 STP Carb Spray Cleaner Dec-97 First Brands Corp 255 B-12 Chemtool Carb Choke Cleaner Dec-01 Berryman Products 261 Silver Dip Oct-93 Magic American Chemical Corp 262 Tarni Shield Brand Silver Cleaner Jan-96 3M General Offices 263 Metal Polish Jun-94 Weiman Silver Cleaner 264 Branson Jewelry Cleaner Dec-95 A B C Compounding Co Inc
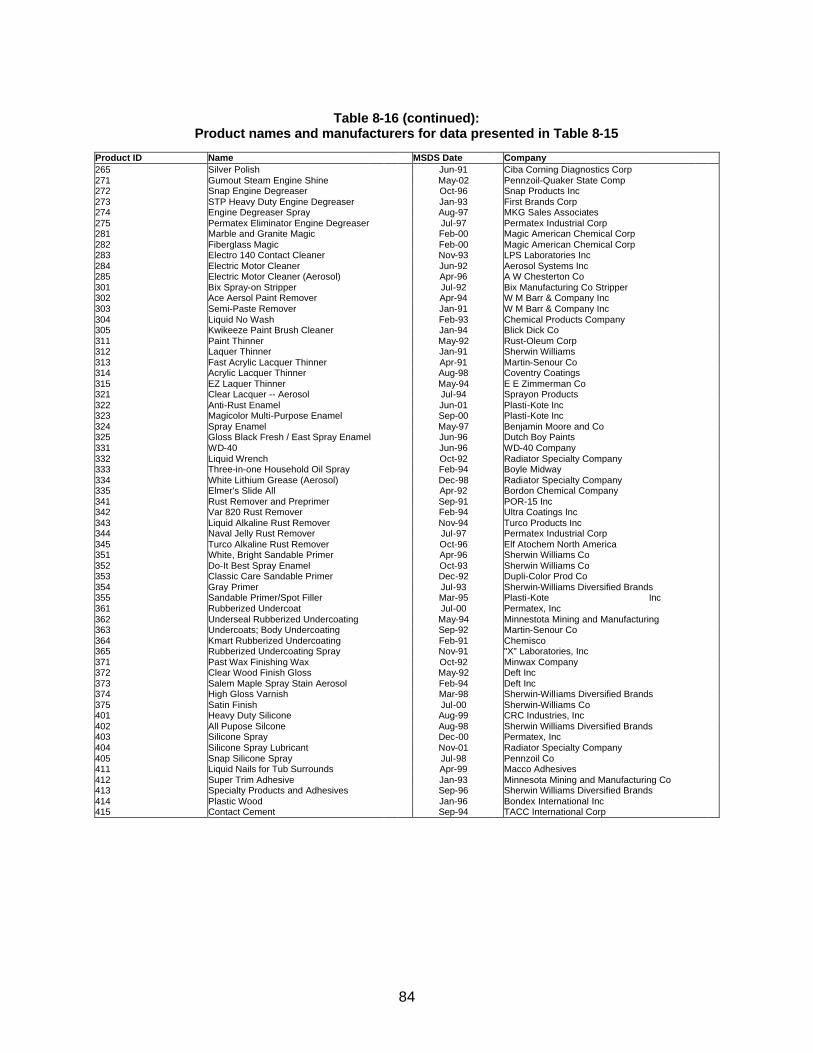
84
Table 8-16 (continued):
Product names and manufacturers for data presented in Table 8-15 Product ID Name MSDS Date Company 265 Silver Polish Jun-91 Ciba Corning Diagnostics Corp 271 Gumout Steam Engine Shine May-02 Pennzoil-Quaker State Comp 272 Snap Engine Degreaser Oct-96 Snap Products Inc 273 STP Heavy Duty Engine Degreaser Jan-93 First Brands Corp 274 Engine Degreaser Spray Aug-97 MKG Sales Associates 275 Permatex Eliminator Engine Degreaser Jul-97 Permatex Industrial Corp 281 Marble and Granite Magic Feb-00 Magic American Chemical Corp 282 Fiberglass Magic Feb-00 Magic American Chemical Corp 283 Electro 140 Contact Cleaner Nov-93 LPS Laboratories Inc 284 Electric Motor Cleaner Jun-92 Aerosol Systems Inc 285 Electric Motor Cleaner (Aerosol) Apr-96 A W Chesterton Co 301 Bix Spray-on Stripper Jul-92 Bix Manufacturing Co Stripper 302 Ace Aersol Paint Remover Apr-94 W M Barr & Company Inc 303 Semi-Paste Remover Jan-91 W M Barr & Company Inc 304 Liquid No Wash Feb-93 Chemical Products Company 305 Kwikeeze Paint Brush Cleaner Jan-94 Blick Dick Co 311 Paint Thinner May-92 Rust-Oleum Corp 312 Laquer Thinner Jan-91 Sherwin Williams 313 Fast Acrylic Lacquer Thinner Apr-91 Martin-Senour Co 314 Acrylic Lacquer Thinner Aug-98 Coventry Coatings 315 EZ Laquer Thinner May-94 E E Zimmerman Co 321 Clear Lacquer -- Aerosol Jul-94 Sprayon Products 322 Anti-Rust Enamel Jun-01 Plasti-Kote Inc 323 Magicolor Multi-Purpose Enamel Sep-00 Plasti-Kote Inc 324 Spray Enamel May-97 Benjamin Moore and Co 325 Gloss Black Fresh / East Spray Enamel Jun-96 Dutch Boy Paints 331 WD-40 Jun-96 WD-40 Company 332 Liquid Wrench Oct-92 Radiator Specialty Company 333 Three-in-one Household Oil Spray Feb-94 Boyle Midway 334 White Lithium Grease (Aerosol) Dec-98 Radiator Specialty Company 335 Elmer's Slide All Apr-92 Bordon Chemical Company 341 Rust Remover and Preprimer Sep-91 POR-15 Inc 342 Var 820 Rust Remover Feb-94 Ultra Coatings Inc 343 Liquid Alkaline Rust Remover Nov-94 Turco Products Inc 344 Naval Jelly Rust Remover Jul-97 Permatex Industrial Corp 345 Turco Alkaline Rust Remover Oct-96 Elf Atochem North America 351 White, Bright Sandable Primer Apr-96 Sherwin Williams Co 352 Do-It Best Spray Enamel Oct-93 Sherwin Williams Co 353 Classic Care Sandable Primer Dec-92 Dupli-Color Prod Co 354 Gray Primer Jul-93 Sherwin-Williams Diversified Brands 355 Sandable Primer/Spot Filler Mar-95 Plasti-Kote Inc 361 Rubberized Undercoat Jul-00 Permatex, Inc 362 Underseal Rubberized Undercoating May-94 Minnestota Mining and Manufacturing 363 Undercoats; Body Undercoating Sep-92 Martin-Senour Co 364 Kmart Rubberized Undercoating Feb-91 Chemisco 365 Rubberized Undercoating Spray Nov-91 "X" Laboratories, Inc 371 Past Wax Finishing Wax Oct-92 Minwax Company 372 Clear Wood Finish Gloss May-92 Deft Inc 373 Salem Maple Spray Stain Aerosol Feb-94 Deft Inc 374 High Gloss Varnish Mar-98 Sherwin-Williams Diversified Brands 375 Satin Finish Jul-00 Sherwin-Williams Co 401 Heavy Duty Silicone Aug-99 CRC Industries, Inc 402 All Pupose Silcone Aug-98 Sherwin Williams Diversified Brands 403 Silicone Spray Dec-00 Permatex, Inc 404 Silicone Spray Lubricant Nov-01 Radiator Specialty Company 405 Snap Silicone Spray Jul-98 Pennzoil Co 411 Liquid Nails for Tub Surrounds Apr-99 Macco Adhesives 412 Super Trim Adhesive Jan-93 Minnesota Mining and Manufacturing Co 413 Specialty Products and Adhesives Sep-96 Sherwin Williams Diversified Brands 414 Plastic Wood Jan-96 Bondex International Inc 415 Contact Cement Sep-94 TACC International Corp
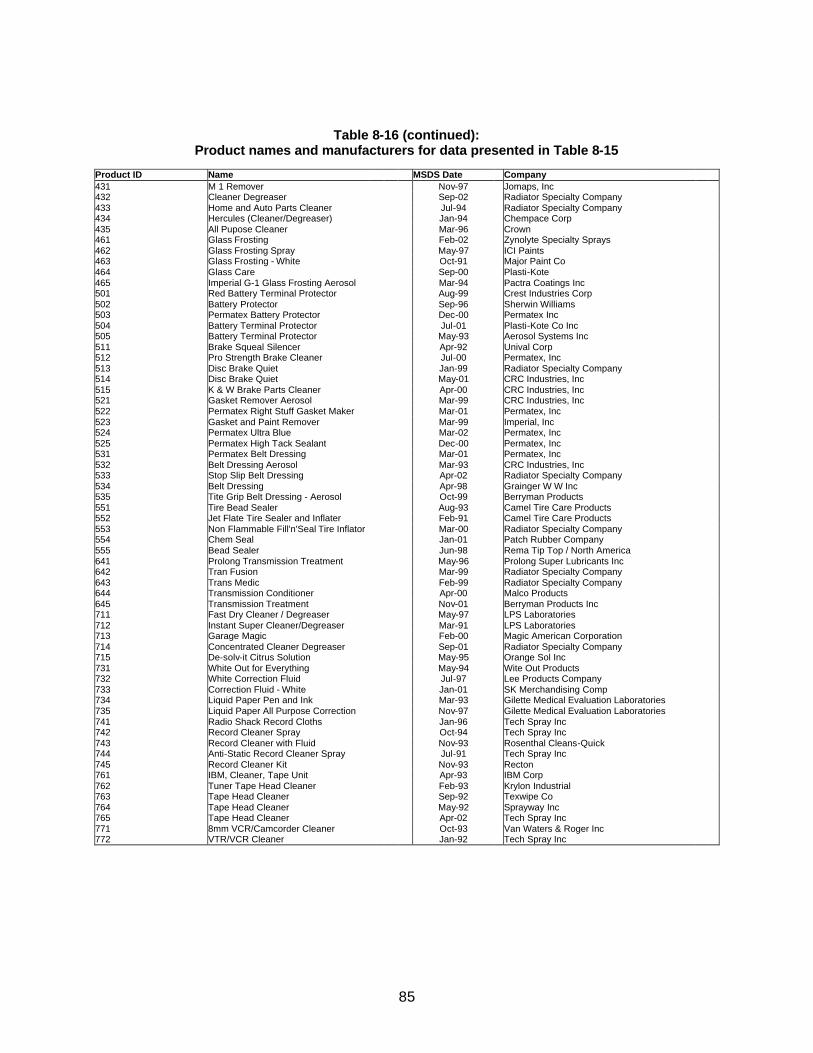
85
Table 8-16 (continued): Product names and manufacturers for data presented in Table 8-15
Product ID Name MSDS Date Company 431 M 1 Remover Nov-97 Jomaps, Inc 432 Cleaner Degreaser Sep-02 Radiator Specialty Company 433 Home and Auto Parts Cleaner Jul-94 Radiator Specialty Company 434 Hercules (Cleaner/Degreaser) Jan-94 Chempace Corp 435 All Pupose Cleaner Mar-96 Crown 461 Glass Frosting Feb-02 Zynolyte Specialty Sprays 462 Glass Frosting Spray May-97 ICI Paints 463 Glass Frosting - White Oct-91 Major Paint Co 464 Glass Care Sep-00 Plasti-Kote 465 Imperial G-1 Glass Frosting Aerosol Mar-94 Pactra Coatings Inc 501 Red Battery Terminal Protector Aug-99 Crest Industries Corp 502 Battery Protector Sep-96 Sherwin Williams 503 Permatex Battery Protector Dec-00 Permatex Inc 504 Battery Terminal Protector Jul-01 Plasti-Kote Co Inc 505 Battery Terminal Protector May-93 Aerosol Systems Inc 511 Brake Squeal Silencer Apr-92 Unival Corp 512 Pro Strength Brake Cleaner Jul-00 Permatex, Inc 513 Disc Brake Quiet Jan-99 Radiator Specialty Company 514 Disc Brake Quiet May-01 CRC Industries, Inc 515 K & W Brake Parts Cleaner Apr-00 CRC Industries, Inc 521 Gasket Remover Aerosol Mar-99 CRC Industries, Inc 522 Permatex Right Stuff Gasket Maker Mar-01 Permatex, Inc 523 Gasket and Paint Remover Mar-99 Imperial, Inc 524 Permatex Ultra Blue Mar-02 Permatex, Inc 525 Permatex High Tack Sealant Dec-00 Permatex, Inc 531 Permatex Belt Dressing Mar-01 Permatex, Inc 532 Belt Dressing Aerosol Mar-93 CRC Industries, Inc 533 Stop Slip Belt Dressing Apr-02 Radiator Specialty Company 534 Belt Dressing Apr-98 Grainger W W Inc 535 Tite Grip Belt Dressing - Aerosol Oct-99 Berryman Products 551 Tire Bead Sealer Aug-93 Camel Tire Care Products 552 Jet Flate Tire Sealer and Inflater Feb-91 Camel Tire Care Products 553 Non Flammable Fill'n'Seal Tire Inflator Mar-00 Radiator Specialty Company 554 Chem Seal Jan-01 Patch Rubber Company 555 Bead Sealer Jun-98 Rema Tip Top / North America 641 Prolong Transmission Treatment May-96 Prolong Super Lubricants Inc 642 Tran Fusion Mar-99 Radiator Specialty Company 643 Trans Medic Feb-99 Radiator Specialty Company 644 Transmission Conditioner Apr-00 Malco Products 645 Transmission Treatment Nov-01 Berryman Products Inc 711 Fast Dry Cleaner / Degreaser May-97 LPS Laboratories 712 Instant Super Cleaner/Degreaser Mar-91 LPS Laboratories 713 Garage Magic Feb-00 Magic American Corporation 714 Concentrated Cleaner Degreaser Sep-01 Radiator Specialty Company 715 De-solv-it Citrus Solution May-95 Orange Sol Inc 731 White Out for Everything May-94 Wite Out Products 732 White Correction Fluid Jul-97 Lee Products Company 733 Correction Fluid - White Jan-01 SK Merchandising Comp 734 Liquid Paper Pen and Ink Mar-93 Gilette Medical Evaluation Laboratories 735 Liquid Paper All Purpose Correction Nov-97 Gilette Medical Evaluation Laboratories 741 Radio Shack Record Cloths Jan-96 Tech Spray Inc 742 Record Cleaner Spray Oct-94 Tech Spray Inc 743 Record Cleaner with Fluid Nov-93 Rosenthal Cleans-Quick 744 Anti-Static Record Cleaner Spray Jul-91 Tech Spray Inc 745 Record Cleaner Kit Nov-93 Recton 761 IBM, Cleaner, Tape Unit Apr-93 IBM Corp 762 Tuner Tape Head Cleaner Feb-93 Krylon Industrial 763 Tape Head Cleaner Sep-92 Texwipe Co 764 Tape Head Cleaner May-92 Sprayway Inc 765 Tape Head Cleaner Apr-02 Tech Spray Inc 771 8mm VCR/Camcorder Cleaner Oct-93 Van Waters & Roger Inc 772 VTR/VCR Cleaner Jan-92 Tech Spray Inc
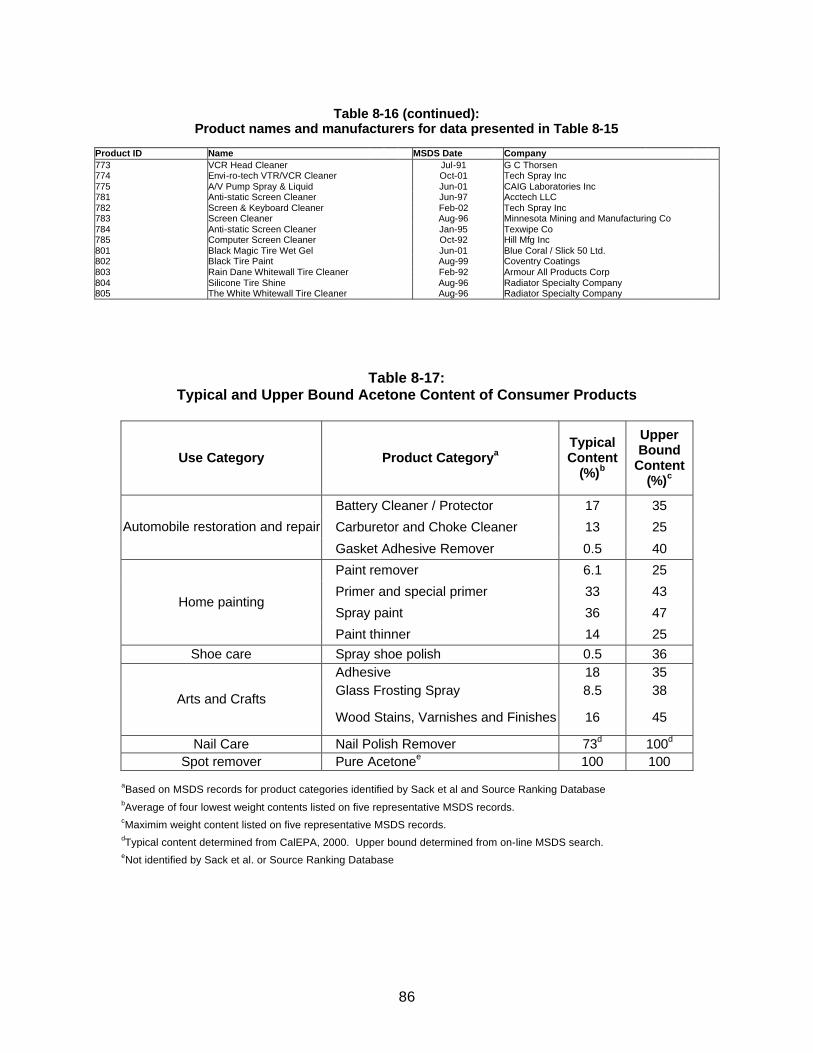
86
Table 8-16 (continued): Product names and manufacturers for data presented in Table 8-15
Product ID Name MSDS Date Company 773 VCR Head Cleaner Jul-91 G C Thorsen 774 Envi-ro-tech VTR/VCR Cleaner Oct-01 Tech Spray Inc 775 A/V Pump Spray & Liquid Jun-01 CAIG Laboratories Inc 781 Anti-static Screen Cleaner Jun-97 Acctech LLC 782 Screen & Keyboard Cleaner Feb-02 Tech Spray Inc 783 Screen Cleaner Aug-96 Minnesota Mining and Manufacturing Co 784 Anti-static Screen Cleaner Jan-95 Texwipe Co 785 Computer Screen Cleaner Oct-92 Hill Mfg Inc 801 Black Magic Tire Wet Gel Jun-01 Blue Coral / Slick 50 Ltd. 802 Black Tire Paint Aug-99 Coventry Coatings 803 Rain Dane Whitewall Tire Cleaner Feb-92 Armour All Products Corp 804 Silicone Tire Shine Aug-96 Radiator Specialty Company 805 The White Whitewall Tire Cleaner Aug-96 Radiator Specialty Company
Table 8-17: Typical and Upper Bound Acetone Content of Consumer Products
Use Category Product Categorya Typical Content
(%)b
Upper Bound
Content (%)c
Battery Cleaner / Protector 17 35
Carburetor and Choke Cleaner 13 25 Automobile restoration and repair
Gasket Adhesive Remover 0.5 40
Paint remover 6.1 25
Primer and special primer 33 43
Spray paint 36 47 Home painting
Paint thinner 14 25 Shoe care Spray shoe polish 0.5 36
Adhesive 18 35 Glass Frosting Spray 8.5 38
Arts and Crafts Wood Stains, Varnishes and Finishes 16 45
Nail Care Nail Polish Remover 73d 100d Spot remover Pure Acetonee 100 100
aBased on MSDS records for product categories identified by Sack et al and Source Ranking Database bAverage of four lowest weight contents listed on five representative MSDS records. cMaximim weight content listed on five representative MSDS records. dTypical content determined from CalEPA, 2000. Upper bound determined from on-line MSDS search. eNot identified by Sack et al. or Source Ranking Database

87
Two product categories listed on Table 8-17, which were not identified by Sack et al., include nail polish remover and acetone as the pure solvent. The nail polish remover category was identified from EPA’s Source Ranking Database (SRD) (USEPA, 2000), which was also reviewed to determine products that contain acetone. The SRD is a compilation of product composition information from a variety of sources. While the SRD has the same limitation that Sack does in that the information is dated, it contains information from a variety of sources and is not limited to just those products that may have contained chlorinated VOCs. The SRD was developed to rank consumer products for screening a large number of indoor air pollution sources and prioritizing them for future evaluation. Because the EPA used the Sack et al. study, much of the same information from Sack is included in the SRD. When comparing the two consumer product data sources, it was found that the same product categories that contained acetone were identified in Sack and SRD and that the percent acetone composition was similar. Because the SRD was not limited to products only potentially containing chlorinated solvents (as Sack was), an additional product category that includes nail polish remover was identified. The average acetone weight percent identified in the SRD for nail polish remover is similar to that found in the California Air Resources Board (CARB) Consumer and Commercial Products Survey, which indicates that the average acetone content among all nail polish removers is about 73%. Acetone as a pure solvent was not identified in either the Sack study or SRD. However, pure acetone is sold in gallon-sized or smaller containers at various hardware/home improvement and personal beauty supply stores, and therefore it was included in the exposure assessment.
Selection of Consumer Products for Quantitative Exposure Assessment From Tables 8-15 and 8-16, it can be seen that a wide variety of consumer products contain acetone, however, the majority of those products contain less than 1% by weight or no acetone and therefore are unlikely to be important sources of exposure. Thus, this assessment has focused on those consumer products that have the greatest potential for resulting in significant exposures to children. Those consumer products, which contain acetone greater than 1% by weight, are listed on Table 8-17. Each of these products was then considered in the context of how they would be used and the likelihood of children being exposed during their use.
It is believed that all of the products listed on Table 8-17 could be used in the home. However, it is also recognized that the frequency of use of these products is greater for some than others. For instance, although the specific automotive and arts and crafts related products listed on Table 8-17 might be used at home such that children could be exposed, it is believed that the paint related products are more commonly used. Further the paint related products have in general a higher average acetone content. For these reasons, the paint related products were selected for a quantitative exposure assessment. Additionally, due to the high acetone content in some nail polish remover and its common use by children, nail polish remover was selected for a quantitative exposure assessment. And lastly, pure acetone as a solvent is sold in home improvement/hardware and beauty supply stores. The use of the pure solvent was investigated and it has been determined that its typical use is as a spot remover for paint or adhesives, or as an acrylic nail tip remover.
Based on the acetone weight content and the likelihood of use by or in the presence of children, the paint products, nail polish remover and pure solvent were evaluated for acetone exposure in the four scenarios. These scenarios include:
• residential pure solvent use as an acrylic nail tip remover • residential nail polish remover use, • residential spray painting, and
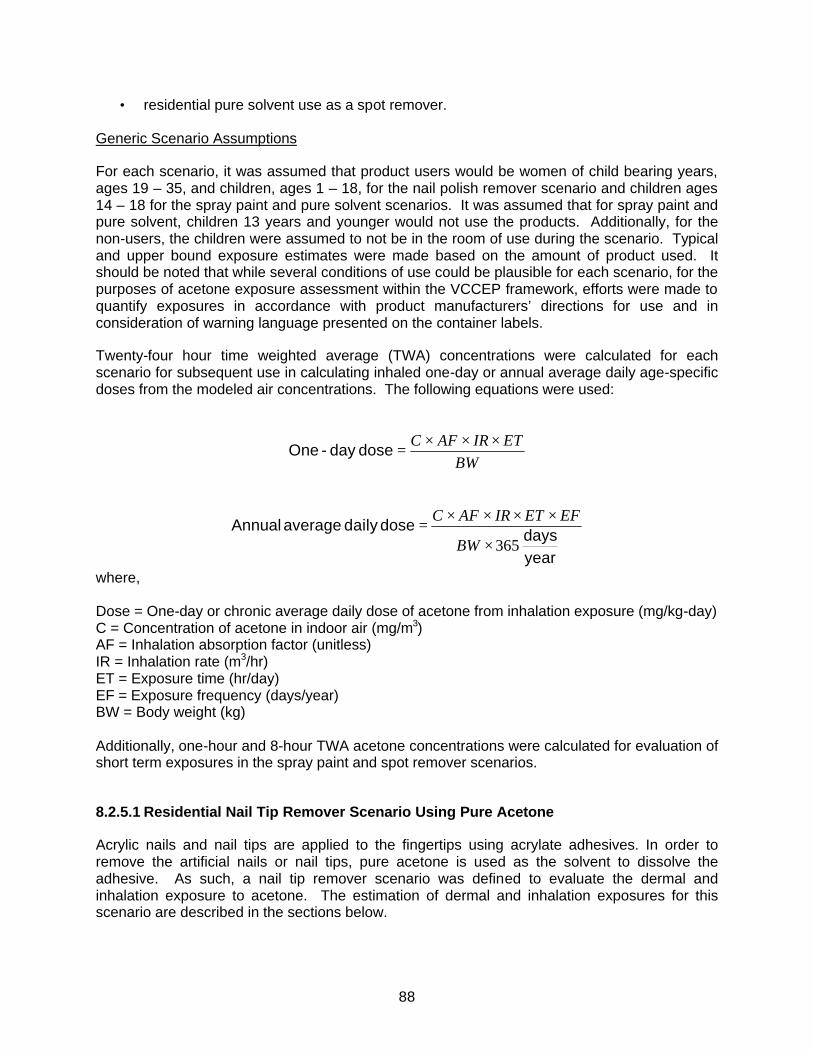
88
• residential pure solvent use as a spot remover. Generic Scenario Assumptions
For each scenario, it was assumed that product users would be women of child bearing years, ages 19 – 35, and children, ages 1 – 18, for the nail polish remover scenario and children ages 14 – 18 for the spray paint and pure solvent scenarios. It was assumed that for spray paint and pure solvent, children 13 years and younger would not use the products. Additionally, for the non-users, the children were assumed to not be in the room of use during the scenario. Typical and upper bound exposure estimates were made based on the amount of product used. It should be noted that while several conditions of use could be plausible for each scenario, for the purposes of acetone exposure assessment within the VCCEP framework, efforts were made to quantify exposures in accordance with product manufacturers’ directions for use and in consideration of warning language presented on the container labels.
Twenty-four hour time weighted average (TWA) concentrations were calculated for each scenario for subsequent use in calculating inhaled one-day or annual average daily age-specific doses from the modeled air concentrations. The following equations were used:
BWETIRAFC ×××
=dose day-One
yeardays
dose daily average Annual
365×
××××=
BW
EFETIRAFC
where, Dose = One-day or chronic average daily dose of acetone from inhalation exposure (mg/kg-day) C = Concentration of acetone in indoor air (mg/m3) AF = Inhalation absorption factor (unitless) IR = Inhalation rate (m3/hr) ET = Exposure time (hr/day) EF = Exposure frequency (days/year) BW = Body weight (kg) Additionally, one-hour and 8-hour TWA acetone concentrations were calculated for evaluation of short term exposures in the spray paint and spot remover scenarios.
8.2.5.1 Residential Nail Tip Remover Scenario Using Pure Acetone
Acrylic nails and nail tips are applied to the fingertips using acrylate adhesives. In order to remove the artificial nails or nail tips, pure acetone is used as the solvent to dissolve the adhesive. As such, a nail tip remover scenario was defined to evaluate the dermal and inhalation exposure to acetone. The estimation of dermal and inhalation exposures for this scenario are described in the sections below.
89
Dermal Exposure
To remove the nail tips, professional nail care product manufacturers recommend soaking of the fingertips in a bowl of acetone, with the amount of soaking time required varying from 15 to 45 minutes. In doing so, it is estimated that approximately 1/6 of the surface area of each hand is immersed in the acetone.
Very few quantitative in vivo human studies of dermal exposure to pure solvents have been published (Kezic et al., 2001). Therefore, dermal acetone doses were estimated using the model described in Section 4.6 of the EPA’s “Dermal Exposure Assessment: Principles and Applications” (USEPA, 1992) and draft supplemental guidance from EPA’s Risk Assessment Guidance for Superfund (USEPA, 2001). These documents, as well as most other published guidance on dermal exposure focus on two pathways: direct contact with water and direct contact with soil. The methodology used to calculate dermal absorption of a chemical during immersion in water (e.g. during swimming) can be adapted to quantify dermal absorption during immersion in pure solvents (USEPA, 1992). Therefore, the EPA guidance can be used to estimate the absorbed dose for cases where consumers immerse their hands in bowls of pure acetone for the purpose of nail-tip removal.
The basic model for calculating the dose resulting from dermal contact with a substance is that the stratum corneum is the major barrier to absorption of hydrophilic or moderately lipophilic chemicals into the blood stream and that the viable epidermis limits penetration of lipophilic chemicals. Acetone penetration is therefore limited entirely by the stratus corneum.
For cases where skin is immersed in a liquid, the most important characteristic of the chemical is the permeability coefficient (Kp), or the rate at which a chemical penetrates the outer layer of the epidermis normalized by concentration at steady state. The rate of penetration is dependent on the rate of diffusion of the chemical within the skin, the thickness of the skin layer and the relative partitioning between the liquid vehicle and skin membrane. It is important to note that the permeability coefficient is carrier vehicle dependent. Therefore, the permeability coefficient of a VOC in aqueous solution must be converted to the proper form to predict absorption from the neat state. It is also important to note that absorption occurs more rapidly prior to achieving steady state conditions within the stratum corneum than at steady state. The equations used by the EPA dermal absorption model account for the additional absorption that occurs during the non-steady period.
An experimental permeability coefficient was not identified for acetone. Therefore, a permeability coefficient for acetone in water was calculated using the EPA’s Estimation Program Interface (EPI) Suite Version 3.1, which was developed by the Syracuse Research Corporation (SRC). The DERMIN module from the EPI Suite estimated a water
pK of 0.000569 cm/hr. This
permeability coefficient for water was converted to a permeability coefficient for neat acetone using an equation provided by the USEPA (1992):
neat
waterp
neatp
SKK
ρ=

90
where S (mg/L) is the solubility of the chemical in water and ρneat (g/mL) is the density of the pure chemical. This conversion is appropriate if it can be assumed that the vehicle (pure acetone) does not alter the barrier properties of the skin (USEPA, 1992). The physical constants required by the EPA model to calculate dermal absorption of acetone are listed in Table 8-18.
Table 8-18:
Physical Constants Required to Calculate Dermal Absorption of Neat Acetone Variable Value Reference Acetone log Kow -0.24 Database value from EPA EPI
Suite Version 3.1 2000 (WSKOWWIN Module)
Acetone solubility 1 x 10⁶ mg/L Database value from EPA EPI Suite Version 3.1 2000 (WSKOWWIN Module)
Acetone water permeability (Kp
water) 0.000569 cm/hr Calculated value from EPA EPI
Version 3.1 2000. (DERMIN Module)
Acetone density 0.78 g/mL @ 25 oC ATSDR, 1994 To model the nail tip removal scenario, it was assumed that the user was a female aged 14 to 18. To remove the nail tips, the female simultaneously soaks about 1/6 of the surface area of each hand in a tray of acetone. The amount of soaking time required varies from 15 minutes to 45 minutes. The exposure factors used to calculate dermal absorption for this scenario are summarized in Table 8-19.
Table 8-19:
Exposure Factors Required to Calculate Dermal Absorption of Acetone Variable Value Reference
Exposure frequency (EF) 4 events per year Professional judgment (AMEC)
Surface area of both hands, female
857 cm2 (14 to 18 years) 862 cm2
(18 to 35 years) USEPA Exposure Factors
Handbook, 1997
Fraction of hand immersed in acetone (F) 1/6 Professional judgement (AMEC)
Surface area of both hands immersed in acetone (SAexposed)
143 cm2 (14 to 18 years) 144 cm2
(18 to 35 years) SAexposed = SAtotal X F
Body weight, female (BW) 57.3 kg (14 to 18 years) 62.4 kg (14 to 18 years)
USEPA Exposure Factors Handbook, 1997
Length of time is immersed in acetone 15 to 45 minutes Professional judgment (AMEC)
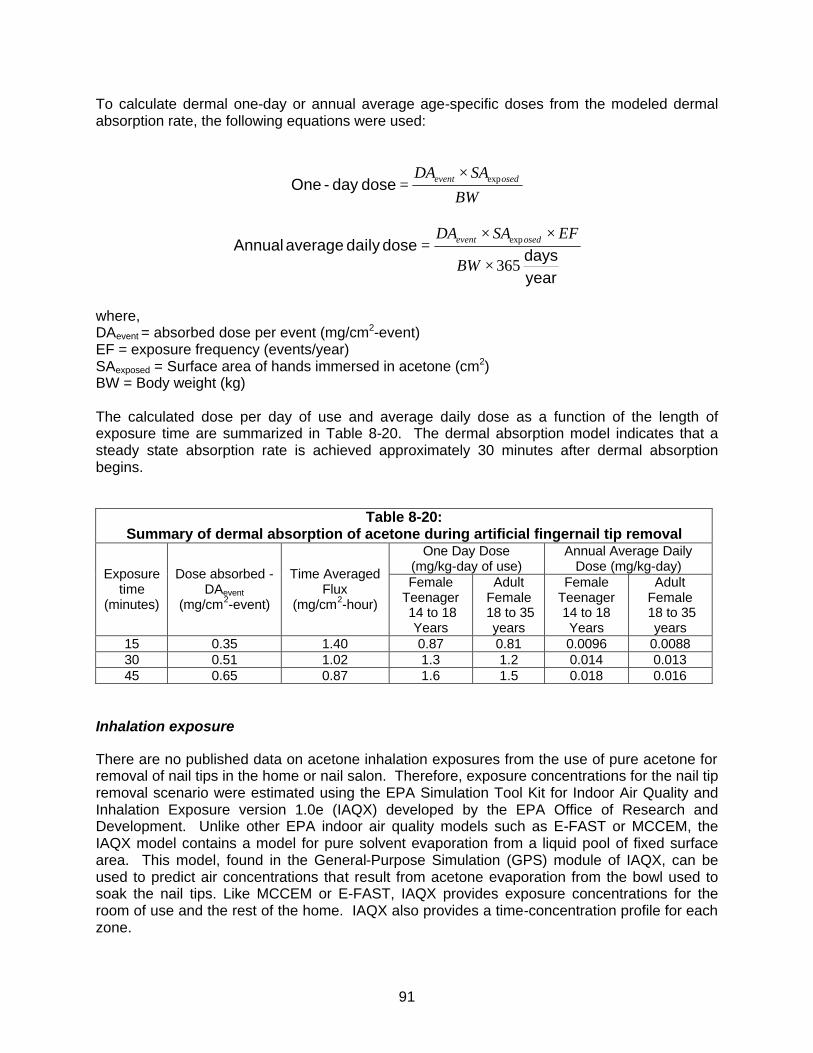
91
To calculate dermal one-day or annual average age-specific doses from the modeled dermal absorption rate, the following equations were used:
BW
SADA osedevent exp×=dose day-One
yeardays
dose daily average Annual
365
exp
×
××=
BW
EFSADA osedevent
where, DAevent = absorbed dose per event (mg/cm2-event) EF = exposure frequency (events/year) SAexposed = Surface area of hands immersed in acetone (cm2) BW = Body weight (kg) The calculated dose per day of use and average daily dose as a function of the length of exposure time are summarized in Table 8-20. The dermal absorption model indicates that a steady state absorption rate is achieved approximately 30 minutes after dermal absorption begins.
Table 8-20:
Summary of dermal absorption of acetone during artificial fingernail tip removal One Day Dose
(mg/kg-day of use) Annual Average Daily
Dose (mg/kg-day) Exposure time
(minutes)
Dose absorbed - DAevent
(mg/cm2-event)
Time Averaged Flux
(mg/cm2-hour)
Female Teenager 14 to 18
Years
Adult Female
18 to 35 years
Female Teenager 14 to 18 Years
Adult Female 18 to 35
years 15 0.35 1.40 0.87 0.81 0.0096 0.0088 30 0.51 1.02 1.3 1.2 0.014 0.013 45 0.65 0.87 1.6 1.5 0.018 0.016
Inhalation exposure
There are no published data on acetone inhalation exposures from the use of pure acetone for removal of nail tips in the home or nail salon. Therefore, exposure concentrations for the nail tip removal scenario were estimated using the EPA Simulation Tool Kit for Indoor Air Quality and Inhalation Exposure version 1.0e (IAQX) developed by the EPA Office of Research and Development. Unlike other EPA indoor air quality models such as E-FAST or MCCEM, the IAQX model contains a model for pure solvent evaporation from a liquid pool of fixed surface area. This model, found in the General-Purpose Simulation (GPS) module of IAQX, can be used to predict air concentrations that result from acetone evaporation from the bowl used to soak the nail tips. Like MCCEM or E-FAST, IAQX provides exposure concentrations for the room of use and the rest of the home. IAQX also provides a time-concentration profile for each zone.

92
Table 8-21 summarizes the parameter values used to calculate one-day time-weighted average exposure concentrations. The parameter values for this model were based on data from the Exposure Factors Handbook (USEPA, 1997), and on AMEC’s professional judgment.
As indicated in Table 8-21, a hypothetical house was created where the air exchange rate was set to 1.34 air changes per hour (ACH) and the volume of the residence was set at the default value of 369 m3 (USEPA, 1997). The value of the ACH is based on the assumption that additional ventilation would be used in accordance with the product labeling instructions. For example, the label on the bottle of pure acetone distributed by Brentwood Beauty Labs International, Inc. provides the following information:
Excerpts from Beauty Secrets Pure Acetone Manicurist Solvent (Brentwood Beauty Labs International, Inc. 2002) Label Section Text
DANGER: EXTREMELY FLAMMABLE. “Do not use or store near heat, sparks, and open flame. Eliminate all ignition sources. Do not smoke while using. Vapors may accumulate and travel to ignition source distant from handling site. Flash fire may result. Use with adequate ventilation. Keep bottle tightly capped when not in use.”
Recently, the EPA has used the results of a residential ventilation study of carbon monoxide in which whole house air exchange rates were determined under various ventilation conditions of windows and doors open (Johnson et al., 1998; Johnson et al., 1999). This study indicated that median air exchange rate for a house with at least one window open was 1.34 ACH, and an upper bound air exchange rate was 3.0. Higher air exchange rates are achievable by using a window fan or whole house fan. Thus, for the residential nail tip remover scenario, it has been assumed that the acetone solvent user would attempt to “use with adequate ventilation” and thus, at least one window would be open.
The activity patterns for the product user and non-user were based on those found in EPA’s screening level EFAST model. Since activity patterns are not accounted for in IAQX, an excel spreadsheet was used to manually calculate the one-day time weighted average concentration.
It was assumed that the time the hand is immersed in acetone could range from 15 minutes to 45 minutes and that the room of use was the kitchen (since a table is required to perform nail tip removal by soaking). Non-users (infants and young children) were assumed to not enter the room of use during the usage period.
A mass transfer coefficient is necessary to evaluate evaporation from films of pure solvent or solvent spills. As indicated in Table 8-21, the default IAQX mass transfer coefficient for a single-component system was used. This mass transfer coefficient is based on Penetration Theory (Mackay and Matsugu Method) and requires that an airflow velocity over the liquid film be specified. Indoor airflow is characterized by a typical velocity of 0 to 0.25 m/s (Zhao et al., 1999). The default IAQX of 0.1 m/s was used. This default airflow velocity may overestimate the rate of evaporation because the walls of the tray used in nail tip removal extend above the liquid tray and impede airflow over the liquid. Alternatively, inadvertent agitation of the liquid pool by the user during soaking may enhance evaporation.
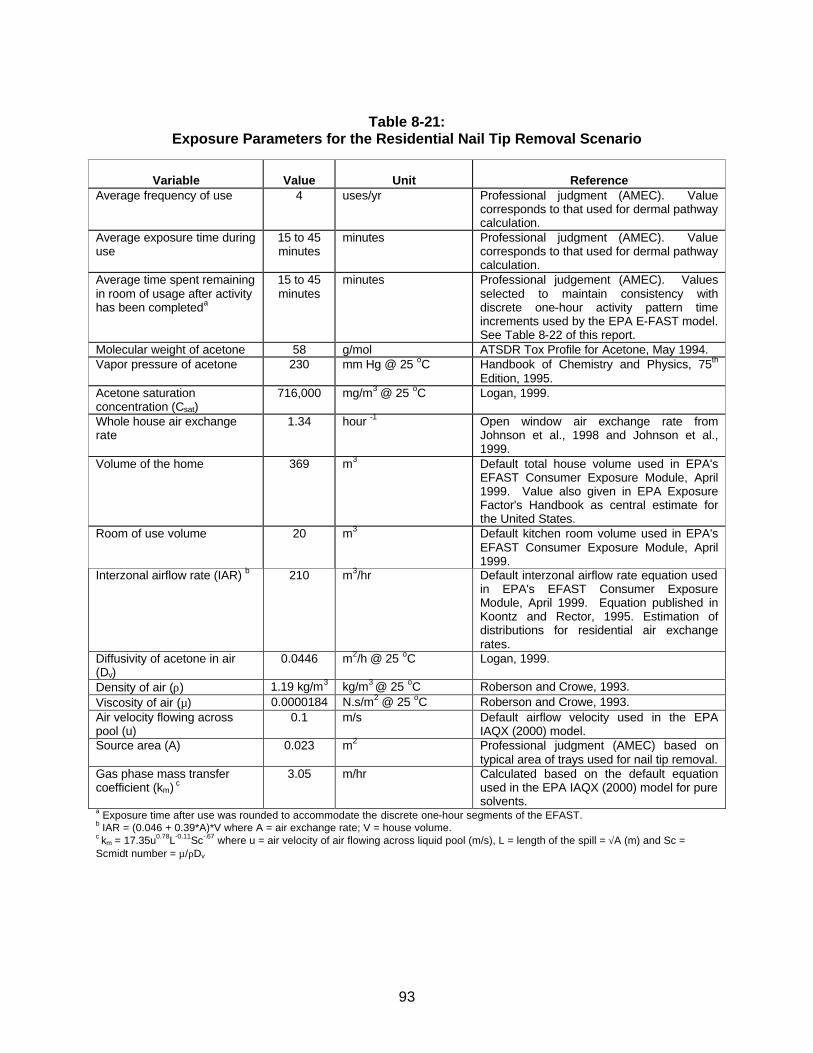
93
Table 8-21:
Exposure Parameters for the Residential Nail Tip Removal Scenario
Variable
Value
Unit
Reference
Average frequency of use 4 uses/yr Professional judgment (AMEC). Value corresponds to that used for dermal pathway calculation.
Average exposure time during use
15 to 45 minutes
minutes Professional judgment (AMEC). Value corresponds to that used for dermal pathway calculation.
Average time spent remaining in room of usage after activity has been completeda
15 to 45 minutes
minutes Professional judgement (AMEC). Values selected to maintain consistency with discrete one-hour activity pattern time increments used by the EPA E-FAST model. See Table 8-22 of this report.
Molecular weight of acetone 58 g/mol ATSDR Tox Profile for Acetone, May 1994. Vapor pressure of acetone 230 mm Hg @ 25 oC Handbook of Chemistry and Physics, 75th
Edition, 1995. Acetone saturation concentration (Csat)
716,000 mg/m3 @ 25 oC Logan, 1999.
Whole house air exchange rate
1.34 hour -1 Open window air exchange rate from Johnson et al., 1998 and Johnson et al., 1999.
Volume of the home 369 m3 Default total house volume used in EPA's EFAST Consumer Exposure Module, April 1999. Value also given in EPA Exposure Factor's Handbook as central estimate for the United States.
Room of use volume
20
m3 Default kitchen room volume used in EPA's EFAST Consumer Exposure Module, April 1999.
Interzonal airflow rate (IAR) b 210 m3/hr Default interzonal airflow rate equation used in EPA's EFAST Consumer Exposure Module, April 1999. Equation published in Koontz and Rector, 1995. Estimation of distributions for residential air exchange rates.
Diffusivity of acetone in air (Dv)
0.0446 m2/h @ 25 oC Logan, 1999.
Density of air (ρ) 1.19 kg/m3 kg/m3 @ 25 oC Roberson and Crowe, 1993. Viscosity of air (µ) 0.0000184 N.s/m2 @ 25 oC Roberson and Crowe, 1993. Air velocity flowing across pool (u)
0.1 m/s Default airflow velocity used in the EPA IAQX (2000) model.
Source area (A) 0.023 m2 Professional judgment (AMEC) based on typical area of trays used for nail tip removal.
Gas phase mass transfer coefficient (km) c
3.05 m/hr Calculated based on the default equation used in the EPA IAQX (2000) model for pure solvents.
a Exposure time after use was rounded to accommodate the discrete one-hour segments of the EFAST. b IAR = (0.046 + 0.39*A)*V where A = air exchange rate; V = house volume. c km = 17.35u0.78L-0.11Sc-.67 where u = air velocity of air flowing across liquid pool (m/s), L = length of the spill = √A (m) and Sc = Scmidt number = µ/ρDv
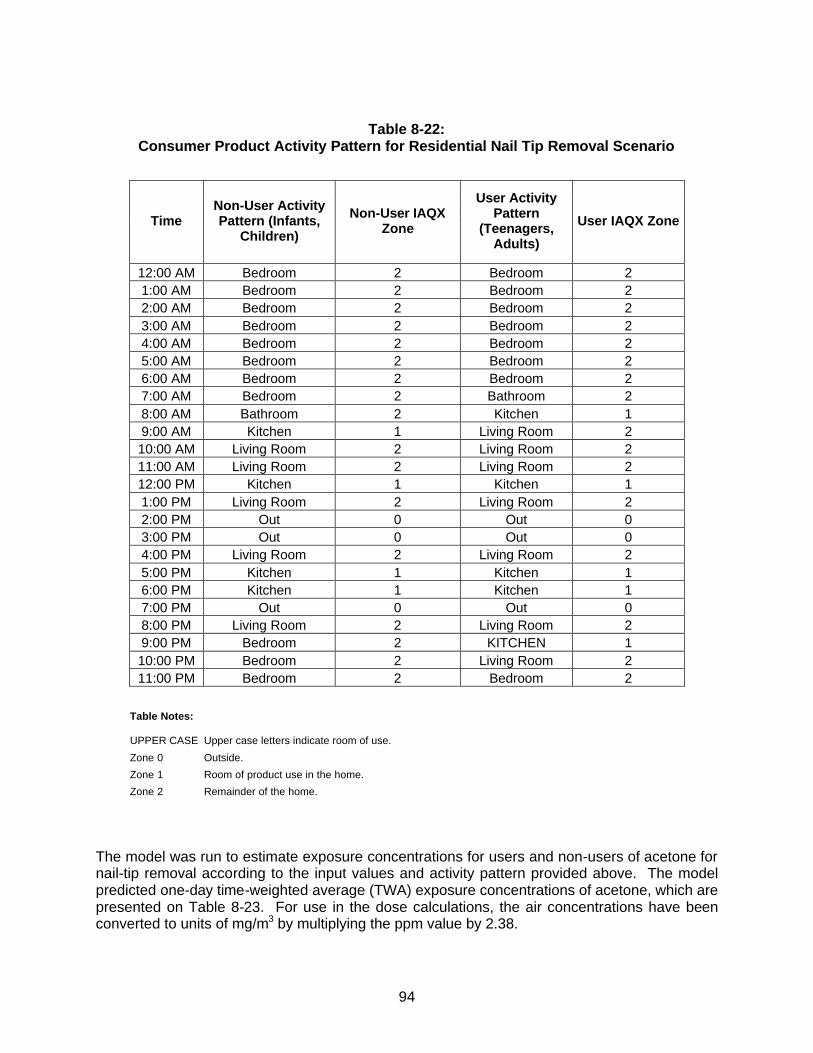
94
Table 8-22:
Consumer Product Activity Pattern for Residential Nail Tip Removal Scenario
Time Non-User Activity Pattern (Infants,
Children)
Non-User IAQX Zone
User Activity Pattern
(Teenagers, Adults)
User IAQX Zone
12:00 AM Bedroom 2 Bedroom 2 1:00 AM Bedroom 2 Bedroom 2 2:00 AM Bedroom 2 Bedroom 2 3:00 AM Bedroom 2 Bedroom 2 4:00 AM Bedroom 2 Bedroom 2 5:00 AM Bedroom 2 Bedroom 2 6:00 AM Bedroom 2 Bedroom 2 7:00 AM Bedroom 2 Bathroom 2 8:00 AM Bathroom 2 Kitchen 1 9:00 AM Kitchen 1 Living Room 2 10:00 AM Living Room 2 Living Room 2 11:00 AM Living Room 2 Living Room 2 12:00 PM Kitchen 1 Kitchen 1 1:00 PM Living Room 2 Living Room 2 2:00 PM Out 0 Out 0 3:00 PM Out 0 Out 0 4:00 PM Living Room 2 Living Room 2 5:00 PM Kitchen 1 Kitchen 1 6:00 PM Kitchen 1 Kitchen 1 7:00 PM Out 0 Out 0 8:00 PM Living Room 2 Living Room 2 9:00 PM Bedroom 2 KITCHEN 1 10:00 PM Bedroom 2 Living Room 2 11:00 PM Bedroom 2 Bedroom 2
Table Notes: UPPER CASE Upper case letters indicate room of use.
Zone 0 Outside.
Zone 1 Room of product use in the home.
Zone 2 Remainder of the home.
The model was run to estimate exposure concentrations for users and non-users of acetone for nail-tip removal according to the input values and activity pattern provided above. The model predicted one-day time-weighted average (TWA) exposure concentrations of acetone, which are presented on Table 8-23. For use in the dose calculations, the air concentrations have been converted to units of mg/m3 by multiplying the ppm value by 2.38.

95
Table 8-23:
Predicted Acetone Air Concentrations for Residential Nail Tip Removal Scenario TWA (1-Day) Concentration
Usage time (minutes) Child Non-User Exposure Concentration (ppm)
Child and Adult User Exposure Concentration (ppm)
15 0.396 1.23 30 0.793 2.56 45 1.19 3.77
These air concentrations were converted into age-specific one-day doses and average daily doses, and are presented on Table 8-24. As shown on Table 8-24, the infant has the highest one-day dose for the non-users of 0.53 mg/kg-day of use and the teenager (ages 14-18) has the highest one-day dose for the users of 0.63 mg/kg-day of use when a typical usage time of 30 minutes is assumed. Similarly, the infant has the highest annual average daily dose for the non-users of 0.0058 mg/kg-day and the teenager has the highest annual average daily dose for the users of 0.0069 mg/kg-day when a typical usage time of 30 minutes is assumed.
Table 8-24:
Age-Specific Doses Associated with Residential Nail Tip Removal Scenario
Nail Tip Removal
Non-User Nail Tip Removal
Female User
Exposure Parameter Units < 1
year old 1-5
year old 6-13
year old 14-18
year old 18-35
year old Concentration
15-minute soak mg/m3 0.942 0.942 0.942 2.93 2.93 30-minute soak mg/m3 1.89 1.89 1.89 6.09 6.09 45-minute soak mg/m3 2.83 2.83 2.83 8.97 8.97
Inhalation absorption factora unitless 0.44 0.44 0.44 0.44 0.44 Exposure time hours/day 24 24 24 24 24 Exposure frequency days/year 4 4 4 4 4 Inhalation rateb m3/h 0.19 0.31 0.51 0.6 0.47 Body weightb kg 7.2 15.4 35 61 62.4 One-day dose
15-minute soak mg/kg-day of use 2.6E-01 2.0E-01 1.5E-01 3.0E-01 2.3E-01 30-minute soak* mg/kg-day of use 5.3E-01 4.0E-01 2.9E-01 6.3E-01 4.8E-01 45-minute soak** mg/kg-day of use 7.9E-01 6.0E-01 4.4E-01 9.3E-01 7.1E-01
Annual average daily dose 15-minute soak mg/kg-day 2.9E-03 2.2E-03 1.6E-03 3.3E-03 2.6E-03 30-minute soak* mg/kg-day 5.8E-03 4.4E-03 3.2E-03 6.9E-03 5.3E-03 45-minute soak** mg/kg-day 8.6E-03 6.6E-03 4.8E-03 1.0E-02 7.8E-03
a Wigaeus et al., 1981. bAll age groups represent boys and girls except the 18 - 35 age group, which represents women only. Body weights and inhalation rates are derived from Exposure Factors Handbook (USEPA, 1997) and Children’s Exposure Factor Handbook (USEPA, 2002). *Assumed to be typical exposure. **Assumed to be upper bound exposure.

96
Summary of Dose for Nail Tip Removal Scenario
The doses for the nail tip removal scenario consisting of the combined dermal and inhalation exposure are summarized in Table 8-25 and 8-26 below. The 30-minute and 45-minute soaks were assumed to be typical and upper bound exposures, respectively. As shown on Table 8-25, the teenager (ages 14-18) has the highest total (inhalation + dermal) one-day and annual average daily dose of 2.5 mg/kg-day of use and 0.028 mg/kg-day, respectively assuming a 30-minute soak time. Infants and young children are assumed to not soak their fingernails in acetone for the purpose of nail tip removal and therefore their total dose is equal to the inhalation dose.
Table 8-25: Age-Specific One-Day Doses Associated with Residential Nail Tip Removal
Scenario
Nail Tip Removal
Non-User Nail Tip Removal
Female User
Route / Type* < 1
year old 1-5
year old 6-13
year old 14-18
year old 18-35
year old Dermal
Typical 1.3E+00 1.2E+00 Upper Bound 1.6E+00 1.5E+00
Inhalation Typical 5.3E-01 4.0E-01 2.9E-01 6.3E-01 4.8E-01
Upper Bound 7.9E-01 6.0E-01 4.4E-01 9.3E-01 7.1E-01 Total
Typical 5.3E-01 4.0E-01 2.9E-01 1.9E+00 1.7E+00 Upper Bound 7.9E-01 6.0E-01 4.4E-01 2.5E+00 2.2E+00
Shaded areas indicate dose calculation not applicable to the age range. *Typical dose is based on 30-minute soaking time and upper bound dose is based on 45-minute soaking time.
Table 8-26:
Age-Specific Annual Average Daily Doses Associated with Residential Nail Tip Removal Scenario
Nail Tip Removal
Non-User Nail Tip Removal
Female User
Route / Type* < 1
year old 1-5
year old 6-13
year old 14-18
year old 18-35
year old Dermal
Typical 1.4E-02 1.3E-02 Upper Bound 1.8E-02 1.6E-02
Inhalation Typical 5.8E-03 4.4E-03 3.2E-03 6.9E-03 5.3E-03
Upper Bound 8.6E-03 6.6E-03 4.8E-03 1.0E-02 7.8E-03 Total
Typical 5.8E-03 4.4E-03 3.2E-03 2.1E-02 1.8E-02 Upper Bound 8.6E-03 6.6E-03 4.8E-03 2.8E-02 2.4E-02
Shaded areas indicate dose calculation not applicable to the age range. *Typical dose is based on 30-minute soaking time and upper bound dose is based on 45-minute soaking time.
97
8.2.5.2 Residential Nail Polish Remover Use
There are no published data on acetone exposures from the use of nail polish removers in the home. Therefore, exposure concentrations for the nail polish scenario were estimated using the EPA Multi-Chamber Concentration and Exposure Model Version 1.2 (MCCEM) and the conceptual framework (i.e. base exposure scenario including activity pattern, emissions models and interzonal airflow equation) of the EPA Exposure, Fate Assessment Screening Tool Version 1.1 (EFAST) Consumer Exposure Module (CEM). MCCEM is an indoor air model developed by the EPA Office of Toxic Substances. EFAST is an exposure assessment program developed by the EPA Office of Toxic Substances.
Exposure concentrations were calculated using MCCEM rather than EFAST to take advantage of the more detailed output of MCCEM (e.g. concentration versus time) and the ability to save input files for future review. MCCEM and EFAST use the same computational engine for indoor air quality modeling.
The parameter values for this model were based on data from the Exposure Factors Handbook (USEPA, 1997), the Toxicological Profile for Acetone (ATSDR, 1994), and as well as AMEC’s professional judgment. Tables 8-27 and 8-28 summarize those parameter values:

98
Table 8-27: Exposure Parameters for the Residential Nail Polish Remover Scenario
Variable
Value
Unit
Reference Density of pure acetone 0.7844 g/ml @ 25 oC ATSDR Tox Profile for Acetone, May
1994. Average frequency of use 32 uses/yr EPA Exposure Factors Handbook
Table 16-34. August 1997. Average exposure time during use
10 Minutes Professional judgment (AMEC). Note: this could range from 2-10 minutes depending on a variety of factors including color of nail polish to be removed and number of coats to be removed.
Average time spent remaining in room of usage after activity has been completed
110 Minutes Professional judgment (AMEC) based on the Activity Pattern, see Table 8-28.
Molecular weight of acetone 58 g/mol ATSDR Tox Profile for Acetone, May 1994.
Vapor pressure of acetone 230 mm Hg @ 25 oC Handbook of Chemistry and Physics, 75th Edition, 1995.
Residential air exchange rate 0.45 air changes per hour Default air exchange rate used in EPA's EFAST Consumer Exposure Module, April 1999. Value also given in EPA Exposure Factor's Handbook as median value for the United States.
Volume of the home 369 m3 Default total house volume used in EPA's EFAST Consumer Exposure Module, April 1999. Value also given in EPA Exposure Factor's Handbook as central estimate for the United States.
Rooms of use volumes Living room
Kitchen Bathroom
40 20 9
m3
Default room volumes used in EPA's EFAST Consumer Exposure Module, April 1999.
Average acetone content in nail polish removers
73 % California Air Resources Board (CalEPA), 2000. The 1997 Consumer and Commercial Products Survey. Dated March 21, 2000.
Average amount of nail polish remover used
Typical Upper bound
3.06 6.12
g/application
Typical: EPA Exposure Factors Handbook Table 16-34. August 1997. Upper bound: Professional judgement. (AMEC)

99
Table 8-28:
Activity Pattern for Residential Nail Polish Remover Scenario
Time E-FAST Non-User Activity Pattern
(Infants, Children)
Non-User MCCEM
Zone
E-FAST Adult User Activity Pattern
(Children, Adults)
User MCCEM
Zone 12:00 AM Bedroom 2 Bedroom 2 1:00 AM Bedroom 2 Bedroom 2 2:00 AM Bedroom 2 Bedroom 2 3:00 AM Bedroom 2 Bedroom 2 4:00 AM Bedroom 2 Bedroom 2 5:00 AM Bedroom 2 Bedroom 2 6:00 AM Bedroom 2 Bedroom 2 7:00 AM Bedroom 2 Bathroom 2 8:00 AM Bathroom 2 Kitchen 2 9:00 AM Kitchen 2 Living Room 1
10:00 AM Living Room 1 Living Room 1 11:00 AM Living Room 1 Living Room 1 12:00 PM Kitchen 2 Kitchen 2 1:00 PM Living Room 1 Living Room 1 2:00 PM Out 0 Out 0 3:00 PM Out 0 Out 0 4:00 PM Living Room 1 Living Room 1 5:00 PM Kitchen 2 Kitchen 2 6:00 PM Kitchen 2 Kitchen 2 7:00 PM Out 0 Out 0 8:00 PM Living Room 1 Living Room 1 9:00 PM Bedroom 2 LIVING ROOM 1
10:00 PM Bedroom 2 Living Room 1 11:00 PM Bedroom 2 Bedroom 2
Table Notes: UPPER CASE Upper case letters indicate room of use. This table only shows living room as room of use, but exposures were calculated for 3 rooms of use. Zone 0 Outside. Zone 1 Room of product use in the home. Zone 2 Remainder of the home.
MCCEM accounts for the emission of acetone over discrete time periods and exposure of the individual based on their activity patterns. This takes into account the time the individual is in and out of the house and the air exchange rate and volume of the residence. A hypothetical house was created where the default values of 0.45 ACH for the air exchange rate and 369 m3 for the volume of the residence were used (USEPA, 1997). The value of the ACH is slightly less than the 50th percentile of whole house air exchange rates of 0.51 ACH published by Murray and Burmaster (1995). For this scenario, no additional ventilation was assumed, as it is not provided in the directions for use or on the warning labels of one national brand and one generic brand of acetone containing nail polish remover.
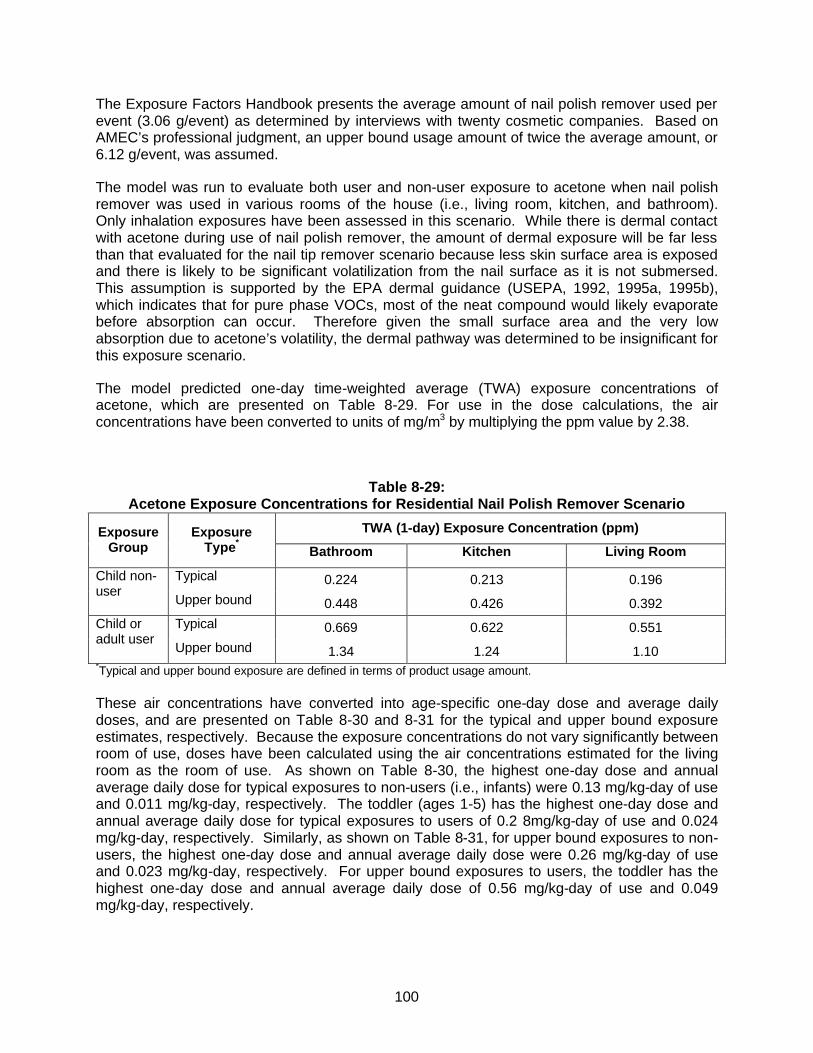
100
The Exposure Factors Handbook presents the average amount of nail polish remover used per event (3.06 g/event) as determined by interviews with twenty cosmetic companies. Based on AMEC’s professional judgment, an upper bound usage amount of twice the average amount, or 6.12 g/event, was assumed.
The model was run to evaluate both user and non-user exposure to acetone when nail polish remover was used in various rooms of the house (i.e., living room, kitchen, and bathroom). Only inhalation exposures have been assessed in this scenario. While there is dermal contact with acetone during use of nail polish remover, the amount of dermal exposure will be far less than that evaluated for the nail tip remover scenario because less skin surface area is exposed and there is likely to be significant volatilization from the nail surface as it is not submersed. This assumption is supported by the EPA dermal guidance (USEPA, 1992, 1995a, 1995b), which indicates that for pure phase VOCs, most of the neat compound would likely evaporate before absorption can occur. Therefore given the small surface area and the very low absorption due to acetone’s volatility, the dermal pathway was determined to be insignificant for this exposure scenario.
The model predicted one-day time-weighted average (TWA) exposure concentrations of acetone, which are presented on Table 8-29. For use in the dose calculations, the air concentrations have been converted to units of mg/m3 by multiplying the ppm value by 2.38.
Table 8-29: Acetone Exposure Concentrations for Residential Nail Polish Remover Scenario
TWA (1-day) Exposure Concentration (ppm) Exposure Group
Exposure Type*
Bathroom Kitchen Living Room
Typical 0.224 0.213 0.196 Child non-user
Upper bound 0.448 0.426 0.392 Typical 0.669 0.622 0.551 Child or
adult user Upper bound 1.34 1.24 1.10
*Typical and upper bound exposure are defined in terms of product usage amount. These air concentrations have converted into age-specific one-day dose and average daily doses, and are presented on Table 8-30 and 8-31 for the typical and upper bound exposure estimates, respectively. Because the exposure concentrations do not vary significantly between room of use, doses have been calculated using the air concentrations estimated for the living room as the room of use. As shown on Table 8-30, the highest one-day dose and annual average daily dose for typical exposures to non-users (i.e., infants) were 0.13 mg/kg-day of use and 0.011 mg/kg-day, respectively. The toddler (ages 1-5) has the highest one-day dose and annual average daily dose for typical exposures to users of 0.2 8mg/kg-day of use and 0.024 mg/kg-day, respectively. Similarly, as shown on Table 8-31, for upper bound exposures to non-users, the highest one-day dose and annual average daily dose were 0.26 mg/kg-day of use and 0.023 mg/kg-day, respectively. For upper bound exposures to users, the toddler has the highest one-day dose and annual average daily dose of 0.56 mg/kg-day of use and 0.049 mg/kg-day, respectively.
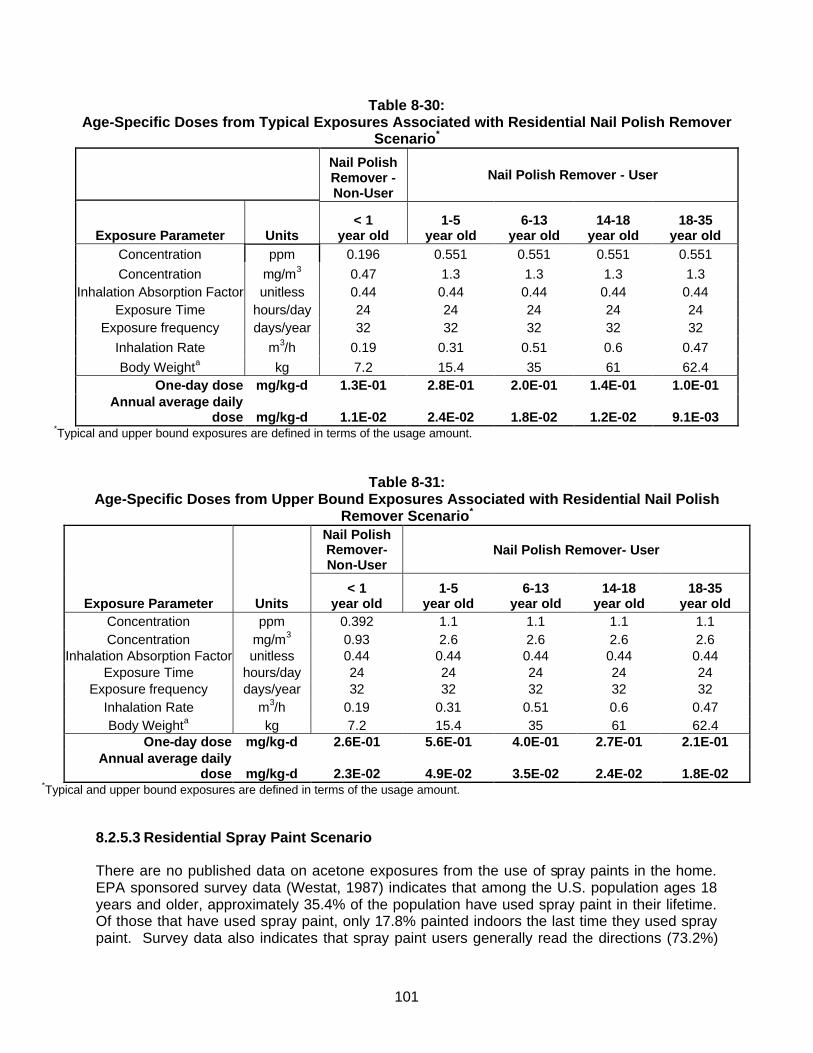
101
Table 8-30: Age-Specific Doses from Typical Exposures Associated with Residential Nail Polish Remover
Scenario*
Nail Polish Remover - Non-User
Nail Polish Remover - User
Exposure Parameter Units < 1
year old 1-5
year old 6-13
year old 14-18
year old 18-35
year old Concentration ppm 0.196 0.551 0.551 0.551 0.551 Concentration mg/m3 0.47 1.3 1.3 1.3 1.3
Inhalation Absorption Factor unitless 0.44 0.44 0.44 0.44 0.44 Exposure Time hours/day 24 24 24 24 24
Exposure frequency days/year 32 32 32 32 32 Inhalation Rate m3/h 0.19 0.31 0.51 0.6 0.47 Body Weighta kg 7.2 15.4 35 61 62.4
One-day dose mg/kg-d 1.3E-01 2.8E-01 2.0E-01 1.4E-01 1.0E-01 Annual average daily
dose mg/kg-d 1.1E-02 2.4E-02 1.8E-02 1.2E-02 9.1E-03 *Typical and upper bound exposures are defined in terms of the usage amount.
Table 8-31: Age-Specific Doses from Upper Bound Exposures Associated with Residential Nail Polish
Remover Scenario*
Nail Polish Remover- Non-User
Nail Polish Remover- User
Exposure Parameter Units < 1
year old 1-5
year old 6-13
year old 14-18
year old 18-35
year old Concentration ppm 0.392 1.1 1.1 1.1 1.1 Concentration mg/m3 0.93 2.6 2.6 2.6 2.6
Inhalation Absorption Factor unitless 0.44 0.44 0.44 0.44 0.44 Exposure Time hours/day 24 24 24 24 24
Exposure frequency days/year 32 32 32 32 32 Inhalation Rate m3/h 0.19 0.31 0.51 0.6 0.47 Body Weighta kg 7.2 15.4 35 61 62.4
One-day dose mg/kg-d 2.6E-01 5.6E-01 4.0E-01 2.7E-01 2.1E-01 Annual average daily
dose mg/kg-d 2.3E-02 4.9E-02 3.5E-02 2.4E-02 1.8E-02 *Typical and upper bound exposures are defined in terms of the usage amount.
8.2.5.3 Residential Spray Paint Scenario
There are no published data on acetone exposures from the use of spray paints in the home. EPA sponsored survey data (Westat, 1987) indicates that among the U.S. population ages 18 years and older, approximately 35.4% of the population have used spray paint in their lifetime. Of those that have used spray paint, only 17.8% painted indoors the last time they used spray paint. Survey data also indicates that spray paint users generally read the directions (73.2%)
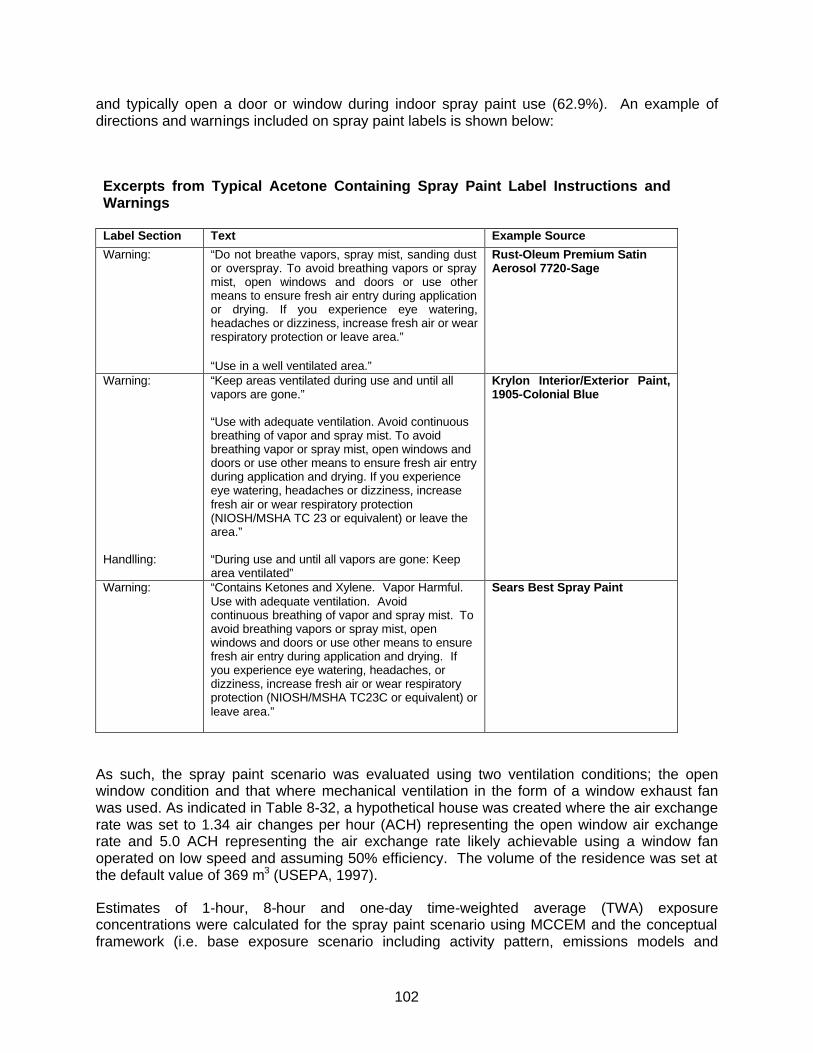
102
and typically open a door or window during indoor spray paint use (62.9%). An example of directions and warnings included on spray paint labels is shown below:
Excerpts from Typical Acetone Containing Spray Paint Label Instructions and Warnings Label Section Text Example Source
Warning: “Do not breathe vapors, spray mist, sanding dust or overspray. To avoid breathing vapors or spray mist, open windows and doors or use other means to ensure fresh air entry during application or drying. If you experience eye watering, headaches or dizziness, increase fresh air or wear respiratory protection or leave area.” “Use in a well ventilated area.”
Rust-Oleum Premium Satin Aerosol 7720-Sage
Warning: Handlling:
“Keep areas ventilated during use and until all vapors are gone.” “Use with adequate ventilation. Avoid continuous breathing of vapor and spray mist. To avoid breathing vapor or spray mist, open windows and doors or use other means to ensure fresh air entry during application and drying. If you experience eye watering, headaches or dizziness, increase fresh air or wear respiratory protection (NIOSH/MSHA TC 23 or equivalent) or leave the area.” “During use and until all vapors are gone: Keep area ventilated”
Krylon Interior/Exterior Paint, 1905-Colonial Blue
Warning: “Contains Ketones and Xylene. Vapor Harmful. Use with adequate ventilation. Avoid continuous breathing of vapor and spray mist. To avoid breathing vapors or spray mist, open windows and doors or use other means to ensure fresh air entry during application and drying. If you experience eye watering, headaches, or dizziness, increase fresh air or wear respiratory protection (NIOSH/MSHA TC23C or equivalent) or leave area.”
Sears Best Spray Paint
As such, the spray paint scenario was evaluated using two ventilation conditions; the open window condition and that where mechanical ventilation in the form of a window exhaust fan was used. As indicated in Table 8-32, a hypothetical house was created where the air exchange rate was set to 1.34 air changes per hour (ACH) representing the open window air exchange rate and 5.0 ACH representing the air exchange rate likely achievable using a window fan operated on low speed and assuming 50% efficiency. The volume of the residence was set at the default value of 369 m3 (USEPA, 1997).
Estimates of 1-hour, 8-hour and one-day time-weighted average (TWA) exposure concentrations were calculated for the spray paint scenario using MCCEM and the conceptual framework (i.e. base exposure scenario including activity pattern, emissions models and

103
interzonal airflow equation) of EFAST. Exposure concentrations were calculated using MCCEM rather than EFAST to take advantage of the more detailed output of MCCEM (e.g. concentration versus time) and the ability to save input files for future review. MCCEM and EFAST use the same computational engine for indoor air quality modeling. The parameter values used in the models were taken from the Exposure Factors Handbook (USEPA, 1997), the Toxicological Profile for Acetone (ATSDR, 1994), and AMEC’s professional judgment. These values are presented on Table 8-32 and 8-33.
Table 8-32:
Exposure Parameters for the Residential Spray Paint Scenario
Variable Value Unit Reference
Density of spray paint 0.78 g/ml @ 25 oC MSDS for Krylon 1602 Ultra Flat Black Spray Paint, January 29, 2003.
Average frequency of use 4 uses/yr EPA Exposure Factors Handbook Table 16-2. Aerosol Spray Paint, August 1997.
Average exposure time during use
40 minutes EPA Exposure Factors Handbook Table 16-3. Aerosol Spray Paint, August 1997.
Average time spent remaining in room of usage after activity has been completed
20 minutes See Table 8-33 of this report and EPA Exposure Factors Handbook Table 16-5. Aerosol Spray Paint, August 1997.
Molecular weight of acetone 58 g/mol ATSDR Tox Profile for Acetone, May 1994 Vapor pressure of acetone 230 mm Hg @ 25 oC Handbook of Chemistry and Physics, 75th
Edition, 1995. Whole house air exchange rate (ACH)
Typical use (windows open) Upper bound (window fan
during use) Upper bound (windows open after use)
1.34 5b
1.34
hour –1
hour –1
hour –1
Open window air exchange rate is median rate from Johnson et al., 1998 and Johnson et al., 1999. Air exchange rate while window fan is operating is based on listed flow of an Air King Brand window fan set on low speed and an assumption of 50% efficiency.
Volume of the home 369 m3 Default total house volume used in EPA's EFAST Consumer Exposure Module, April 1999. Value also given in EPA Exposure Factor's Handbook as central estimate for the United States.
Room of use volume
20
m3 Default utility room volume used in EPA's EFAST Consumer Exposure Module, April 1999.
Interzonal airflow rate (IAR) c
Typical use (open windows) Upper bound (fan during use)
Upper bound (after use)
210 737 210
m3/hr m3/hr m3/hr
Interzonal airflow rate equation used in EPA's EFAST Consumer Exposure Module, April 1999. Equation published in Koontz and Rector, 1995. Estimation of distributions for residential air exchange rates.
Time Fan remains in use after completion of project
20 minutes AMEC’s professional judgment.
Average acetone content in spray paint that contains acetone
36 % by weight Typical MSDS content based on MSDS survey presented in Table 8-17.
Amount of spray paint in a standard can
340 grams Product Label: Rust-oleum clean white metal primer #7780 or Rust-oleum gloss white protective enamel #7792.
a Exposure time after use was rounded to 20 minutes from 13 minutes to accommodate the discrete one-hour segments of the EFAST. b ACH = 2100 cfm [listed flow at low speed] * (1.699 m3/hr / cfm) / 369 m3 [home volume] * (50% efficiency/100) = 5 hr-1 cIAR = (0.046 + 0.39*A)*V where A = air exchange rate; V = house volume.
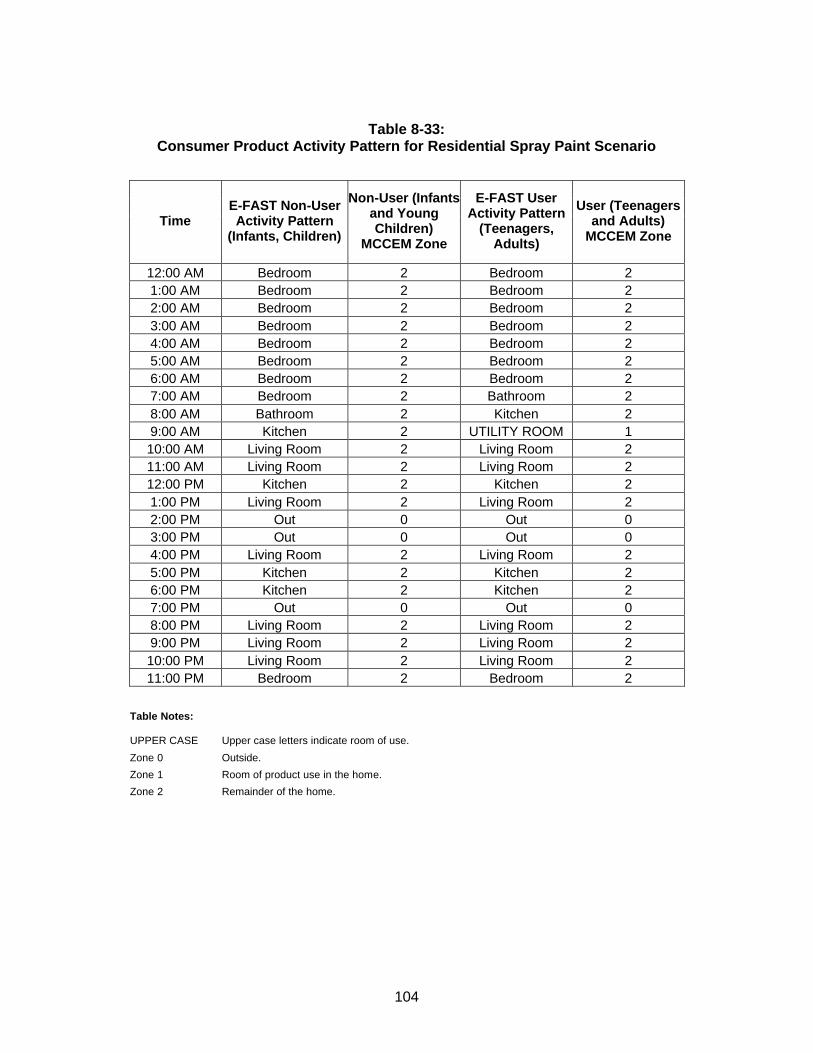
104
Table 8-33:
Consumer Product Activity Pattern for Residential Spray Paint Scenario
Time E-FAST Non-User Activity Pattern
(Infants, Children)
Non-User (Infants and Young Children)
MCCEM Zone
E-FAST User Activity Pattern
(Teenagers, Adults)
User (Teenagers and Adults)
MCCEM Zone
12:00 AM Bedroom 2 Bedroom 2 1:00 AM Bedroom 2 Bedroom 2 2:00 AM Bedroom 2 Bedroom 2 3:00 AM Bedroom 2 Bedroom 2 4:00 AM Bedroom 2 Bedroom 2 5:00 AM Bedroom 2 Bedroom 2 6:00 AM Bedroom 2 Bedroom 2 7:00 AM Bedroom 2 Bathroom 2 8:00 AM Bathroom 2 Kitchen 2 9:00 AM Kitchen 2 UTILITY ROOM 1 10:00 AM Living Room 2 Living Room 2 11:00 AM Living Room 2 Living Room 2 12:00 PM Kitchen 2 Kitchen 2 1:00 PM Living Room 2 Living Room 2 2:00 PM Out 0 Out 0 3:00 PM Out 0 Out 0 4:00 PM Living Room 2 Living Room 2 5:00 PM Kitchen 2 Kitchen 2 6:00 PM Kitchen 2 Kitchen 2 7:00 PM Out 0 Out 0 8:00 PM Living Room 2 Living Room 2 9:00 PM Living Room 2 Living Room 2 10:00 PM Living Room 2 Living Room 2 11:00 PM Bedroom 2 Bedroom 2
Table Notes: UPPER CASE Upper case letters indicate room of use.
Zone 0 Outside.
Zone 1 Room of product use in the home.
Zone 2 Remainder of the home.

105
The Westat (1987) survey of solvent product usage provides a distribution of the volume of spray paint used per painting event for the United States population (Table Q-18). However, it is important to note that the Westat usage distribution does not distinguish between indoor and outdoor uses. The Westat survey does indicate that most spray paint users (~80%) use the products outdoors. Therefore, it was assumed the 90th percentile of the Westat distribution (about 2 cans of spray paint) represents the upper bound of indoor paint use for projects where spray paint is used in accordance with the manufacturer’s product labeling.
In cases where a reasonable lower or upper bound can be determined for an input distribution, EPA recommends truncation, or the imposition a minimum or maximum value on a probability distribution. The purpose of truncation is to “constrain the sample space to a set of plausible values” (USEPA, 2001). A modified distribution for indoor use of spray paint was generated by truncating the Westat distribution at the 90th percentile and is presented on Table 8-34. This distribution was calculated by using linear interpolation between reported values of the Westat distribution to create an empirical distribution function (EDF), truncating the EDF at the 90th percentile and then normalizing the resulting probability density function (PDF) to integrate to unity.
Table 8-34: Distribution of Indoor Spray Paint Usage Among Users in the United States
Spray Paint
Percentile ounces/usea ml/use grams spray
paint/useb cans/usec 0 0.010 0.30 0.23 0.0007 5 0.73 22 17 0.05 10 1.4 40 32 0.09 25 3.2 94 73 0.2 50 7.1 210 164 0.5 75 14 402 314 0.9 90 20 591 461 1.4 95 23 680 530 1.6
100 26 769 600 1.8
aBased on distribution truncated at 90th percentile from U.S. EPA, Household Solvent Products: A national usage survey. July, 1987. Prepared by Westat. Table Q-18: Percentile rankings of ounces per use of Aerosol Spray. bgrams/use= ( ounces/use ) * ( 29.57 ml/ounce ) * ( 0.78 g/ml ) ccans/use = (grams/use) / (340 grams paint/can)
The model was run to estimate exposure concentrations for users and non-users of spray paint according to the usage distributions provided above. Only inhalation exposures have been assessed in this scenario. While there could be dermal contact with acetone during spray paint use, the amount of dermal exposure will be far less than that evaluated for the nail tip remover scenario because less skin surface area (i.e., finger tip) is exposed and there is likely to be significant volatilization from the skin surface as it is not submersed. The predicted acetone air concentrations are shown on Table 8-35. For use in dose calculations, the air concentrations have been converted to units of mg/m3 by multiplying the ppm value by 2.38.

106
Table 8-35:
Predicted Acetone Concentrations for Residential Spray Paint Scenario – Open Window Ventilation Conditions (1.34 ACH)
1-hr TWA Concentration Usage Distribution
Percentile Child Non-User Exposure
Concentration (ppm) Child and Adult User Exposure
Concentration (ppm) 0 0.040 0.17 5 2.9 13
10 5.4 23 25 13 54 50 28 122 75 54 233 90 79 343 95 91 394 100 103 445
8-hr TWA Concentration Child Non-User Exposure
Concentration (ppm) Child and Adult User Exposure
Concentration (ppm) 0 0.0080 0.025 5 0.57 1.8
10 1.1 3.5 25 2.5 8.0 50 5.6 18 75 11 34 90 16 51 95 18 58 100 20 66
1-day TWA Concentration Child Non-User Exposure
Concentration (ppm) Child and Adult User Exposure
Concentration (ppm) 0 0.0026 0.0084 5 0.19 0.62
10 0.36 1.2 25 0.83 2.7 50 1.9 6.0 75 3.6 11 90 5.2 17 95 6.0 19 100 6.8 22
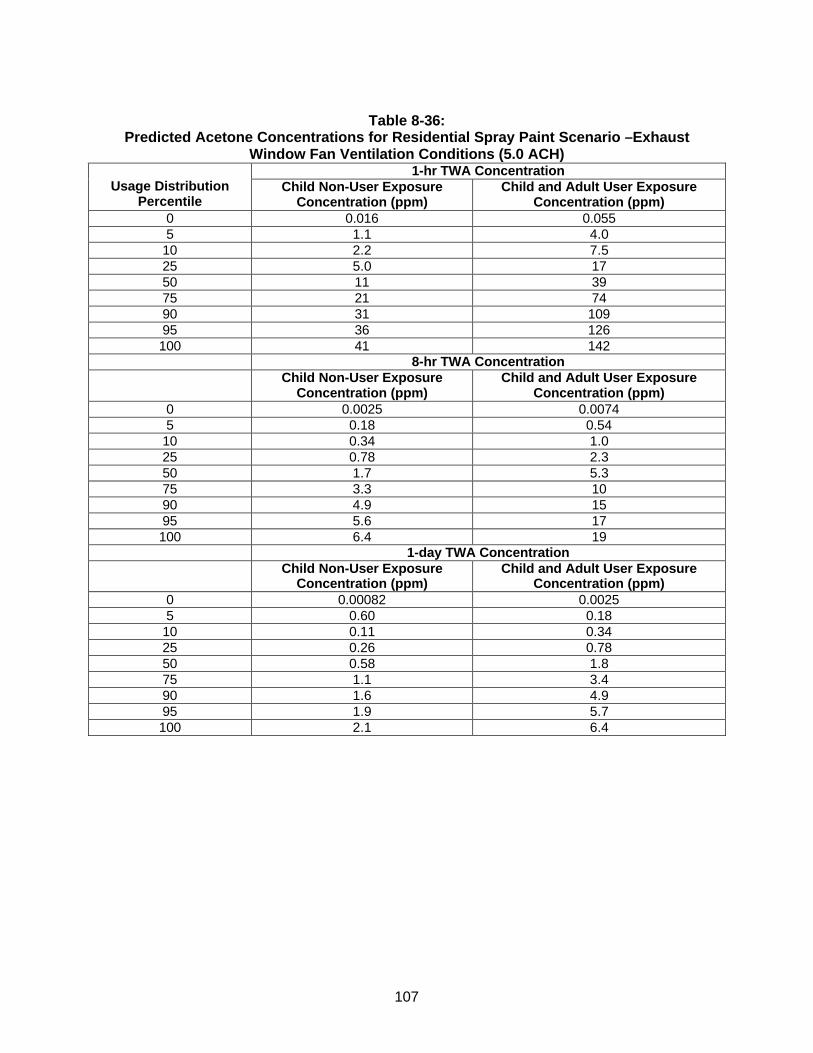
107
Table 8-36:
Predicted Acetone Concentrations for Residential Spray Paint Scenario –Exhaust Window Fan Ventilation Conditions (5.0 ACH)
1-hr TWA Concentration Usage Distribution
Percentile Child Non-User Exposure
Concentration (ppm) Child and Adult User Exposure
Concentration (ppm) 0 0.016 0.055 5 1.1 4.0
10 2.2 7.5 25 5.0 17 50 11 39 75 21 74 90 31 109 95 36 126 100 41 142
8-hr TWA Concentration Child Non-User Exposure
Concentration (ppm) Child and Adult User Exposure
Concentration (ppm) 0 0.0025 0.0074 5 0.18 0.54
10 0.34 1.0 25 0.78 2.3 50 1.7 5.3 75 3.3 10 90 4.9 15 95 5.6 17 100 6.4 19
1-day TWA Concentration Child Non-User Exposure
Concentration (ppm) Child and Adult User Exposure
Concentration (ppm) 0 0.00082 0.0025 5 0.60 0.18
10 0.11 0.34 25 0.26 0.78 50 0.58 1.8 75 1.1 3.4 90 1.6 4.9 95 1.9 5.7 100 2.1 6.4
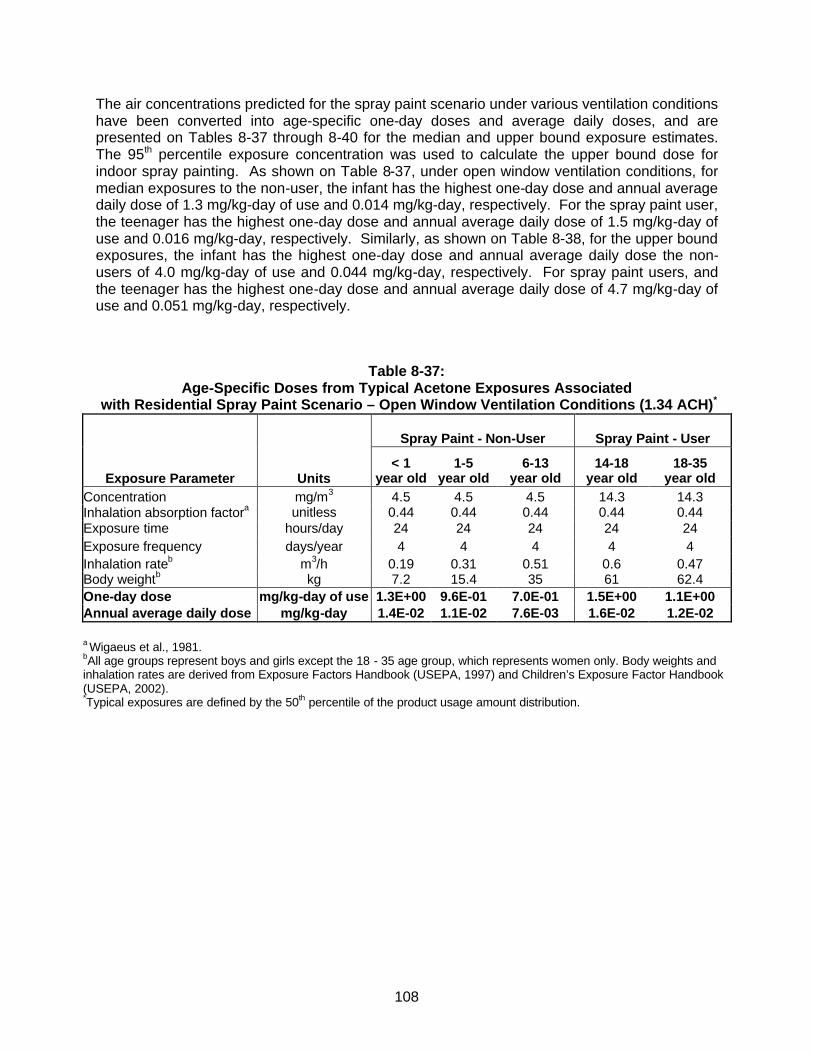
108
The air concentrations predicted for the spray paint scenario under various ventilation conditions have been converted into age-specific one-day doses and average daily doses, and are presented on Tables 8-37 through 8-40 for the median and upper bound exposure estimates. The 95th percentile exposure concentration was used to calculate the upper bound dose for indoor spray painting. As shown on Table 8-37, under open window ventilation conditions, for median exposures to the non-user, the infant has the highest one-day dose and annual average daily dose of 1.3 mg/kg-day of use and 0.014 mg/kg-day, respectively. For the spray paint user, the teenager has the highest one-day dose and annual average daily dose of 1.5 mg/kg-day of use and 0.016 mg/kg-day, respectively. Similarly, as shown on Table 8-38, for the upper bound exposures, the infant has the highest one-day dose and annual average daily dose the non-users of 4.0 mg/kg-day of use and 0.044 mg/kg-day, respectively. For spray paint users, and the teenager has the highest one-day dose and annual average daily dose of 4.7 mg/kg-day of use and 0.051 mg/kg-day, respectively.
Table 8-37: Age-Specific Doses from Typical Acetone Exposures Associated
with Residential Spray Paint Scenario – Open Window Ventilation Conditions (1.34 ACH)*
Spray Paint - Non-User Spray Paint - User
Exposure Parameter Units < 1
year old 1-5
year old 6-13
year old 14-18
year old 18-35
year old Concentration mg/m3 4.5 4.5 4.5 14.3 14.3 Inhalation absorption factora unitless 0.44 0.44 0.44 0.44 0.44 Exposure time hours/day 24 24 24 24 24 Exposure frequency days/year 4 4 4 4 4 Inhalation rateb m3/h 0.19 0.31 0.51 0.6 0.47 Body weightb kg 7.2 15.4 35 61 62.4 One-day dose mg/kg-day of use 1.3E+00 9.6E-01 7.0E-01 1.5E+00 1.1E+00 Annual average daily dose mg/kg-day 1.4E-02 1.1E-02 7.6E-03 1.6E-02 1.2E-02
a Wigaeus et al., 1981. bAll age groups represent boys and girls except the 18 - 35 age group, which represents women only. Body weights and inhalation rates are derived from Exposure Factors Handbook (USEPA, 1997) and Children’s Exposure Factor Handbook (USEPA, 2002). *Typical exposures are defined by the 50th percentile of the product usage amount distribution.
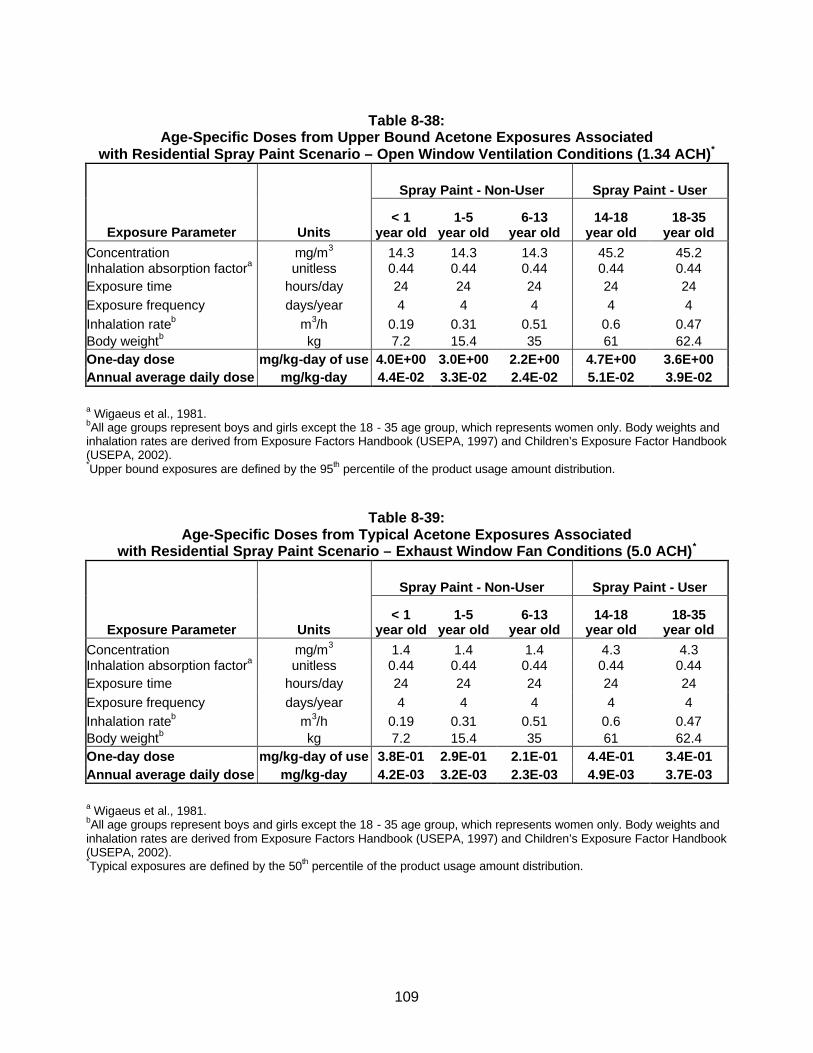
109
Table 8-38:
Age-Specific Doses from Upper Bound Acetone Exposures Associated with Residential Spray Paint Scenario – Open Window Ventilation Conditions (1.34 ACH)*
Spray Paint - Non-User Spray Paint - User
Exposure Parameter Units < 1
year old 1-5
year old 6-13
year old 14-18
year old 18-35
year old Concentration mg/m3 14.3 14.3 14.3 45.2 45.2 Inhalation absorption factora unitless 0.44 0.44 0.44 0.44 0.44 Exposure time hours/day 24 24 24 24 24 Exposure frequency days/year 4 4 4 4 4 Inhalation rateb m3/h 0.19 0.31 0.51 0.6 0.47 Body weightb kg 7.2 15.4 35 61 62.4 One-day dose mg/kg-day of use 4.0E+00 3.0E+00 2.2E+00 4.7E+00 3.6E+00 Annual average daily dose mg/kg-day 4.4E-02 3.3E-02 2.4E-02 5.1E-02 3.9E-02
a Wigaeus et al., 1981. bAll age groups represent boys and girls except the 18 - 35 age group, which represents women only. Body weights and inhalation rates are derived from Exposure Factors Handbook (USEPA, 1997) and Children’s Exposure Factor Handbook (USEPA, 2002). *Upper bound exposures are defined by the 95th percentile of the product usage amount distribution.
Table 8-39: Age-Specific Doses from Typical Acetone Exposures Associated
with Residential Spray Paint Scenario – Exhaust Window Fan Conditions (5.0 ACH)*
Spray Paint - Non-User Spray Paint - User
Exposure Parameter Units < 1
year old 1-5
year old 6-13
year old 14-18
year old 18-35
year old Concentration mg/m3 1.4 1.4 1.4 4.3 4.3 Inhalation absorption factora unitless 0.44 0.44 0.44 0.44 0.44 Exposure time hours/day 24 24 24 24 24 Exposure frequency days/year 4 4 4 4 4 Inhalation rateb m3/h 0.19 0.31 0.51 0.6 0.47 Body weightb kg 7.2 15.4 35 61 62.4 One-day dose mg/kg-day of use 3.8E-01 2.9E-01 2.1E-01 4.4E-01 3.4E-01 Annual average daily dose mg/kg-day 4.2E-03 3.2E-03 2.3E-03 4.9E-03 3.7E-03
a Wigaeus et al., 1981. bAll age groups represent boys and girls except the 18 - 35 age group, which represents women only. Body weights and inhalation rates are derived from Exposure Factors Handbook (USEPA, 1997) and Children’s Exposure Factor Handbook (USEPA, 2002). *Typical exposures are defined by the 50th percentile of the product usage amount distribution.
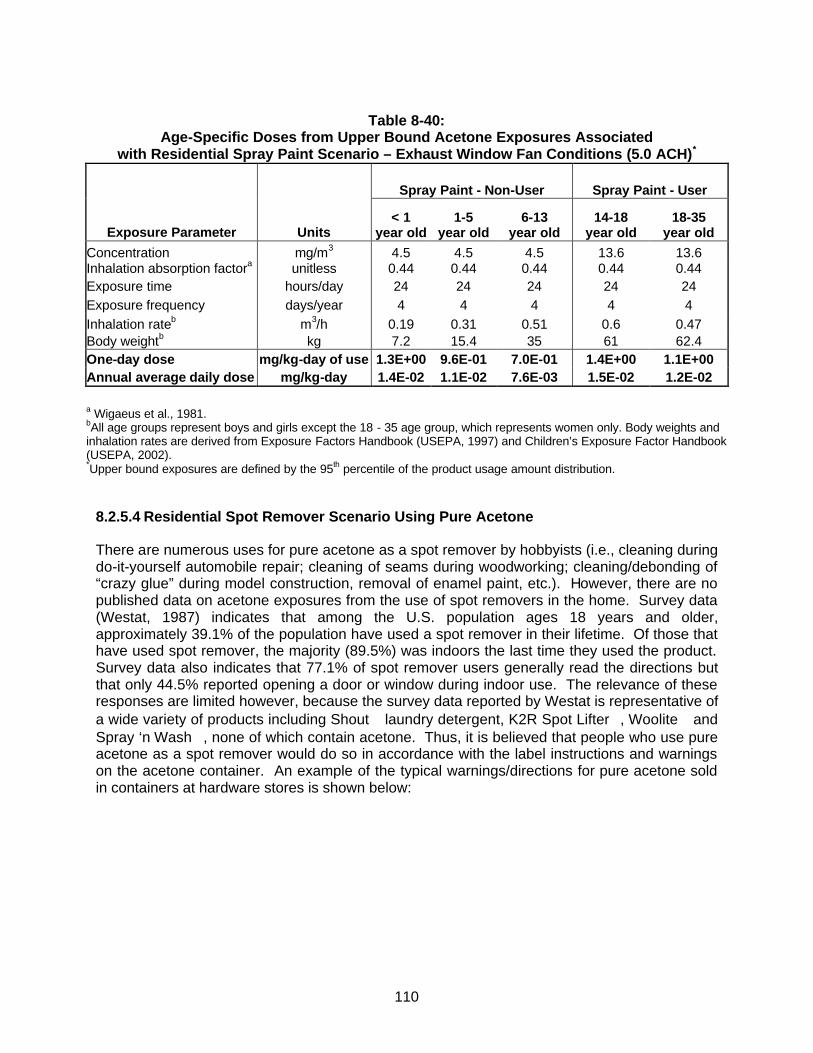
110
Table 8-40:
Age-Specific Doses from Upper Bound Acetone Exposures Associated with Residential Spray Paint Scenario – Exhaust Window Fan Conditions (5.0 ACH)*
Spray Paint - Non-User Spray Paint - User
Exposure Parameter Units < 1
year old 1-5
year old 6-13
year old 14-18
year old 18-35
year old Concentration mg/m3 4.5 4.5 4.5 13.6 13.6 Inhalation absorption factora unitless 0.44 0.44 0.44 0.44 0.44 Exposure time hours/day 24 24 24 24 24 Exposure frequency days/year 4 4 4 4 4 Inhalation rateb m3/h 0.19 0.31 0.51 0.6 0.47 Body weightb kg 7.2 15.4 35 61 62.4 One-day dose mg/kg-day of use 1.3E+00 9.6E-01 7.0E-01 1.4E+00 1.1E+00 Annual average daily dose mg/kg-day 1.4E-02 1.1E-02 7.6E-03 1.5E-02 1.2E-02
a Wigaeus et al., 1981. bAll age groups represent boys and girls except the 18 - 35 age group, which represents women only. Body weights and inhalation rates are derived from Exposure Factors Handbook (USEPA, 1997) and Children’s Exposure Factor Handbook (USEPA, 2002). *Upper bound exposures are defined by the 95th percentile of the product usage amount distribution.
8.2.5.4 Residential Spot Remover Scenario Using Pure Acetone
There are numerous uses for pure acetone as a spot remover by hobbyists (i.e., cleaning during do-it-yourself automobile repair; cleaning of seams during woodworking; cleaning/debonding of “crazy glue” during model construction, removal of enamel paint, etc.). However, there are no published data on acetone exposures from the use of spot removers in the home. Survey data (Westat, 1987) indicates that among the U.S. population ages 18 years and older, approximately 39.1% of the population have used a spot remover in their lifetime. Of those that have used spot remover, the majority (89.5%) was indoors the last time they used the product. Survey data also indicates that 77.1% of spot remover users generally read the directions but that only 44.5% reported opening a door or window during indoor use. The relevance of these responses are limited however, because the survey data reported by Westat is representative of a wide variety of products including Shout laundry detergent, K2R Spot Lifter, Woolite and Spray ‘n Wash, none of which contain acetone. Thus, it is believed that people who use pure acetone as a spot remover would do so in accordance with the label instructions and warnings on the acetone container. An example of the typical warnings/directions for pure acetone sold in containers at hardware stores is shown below:
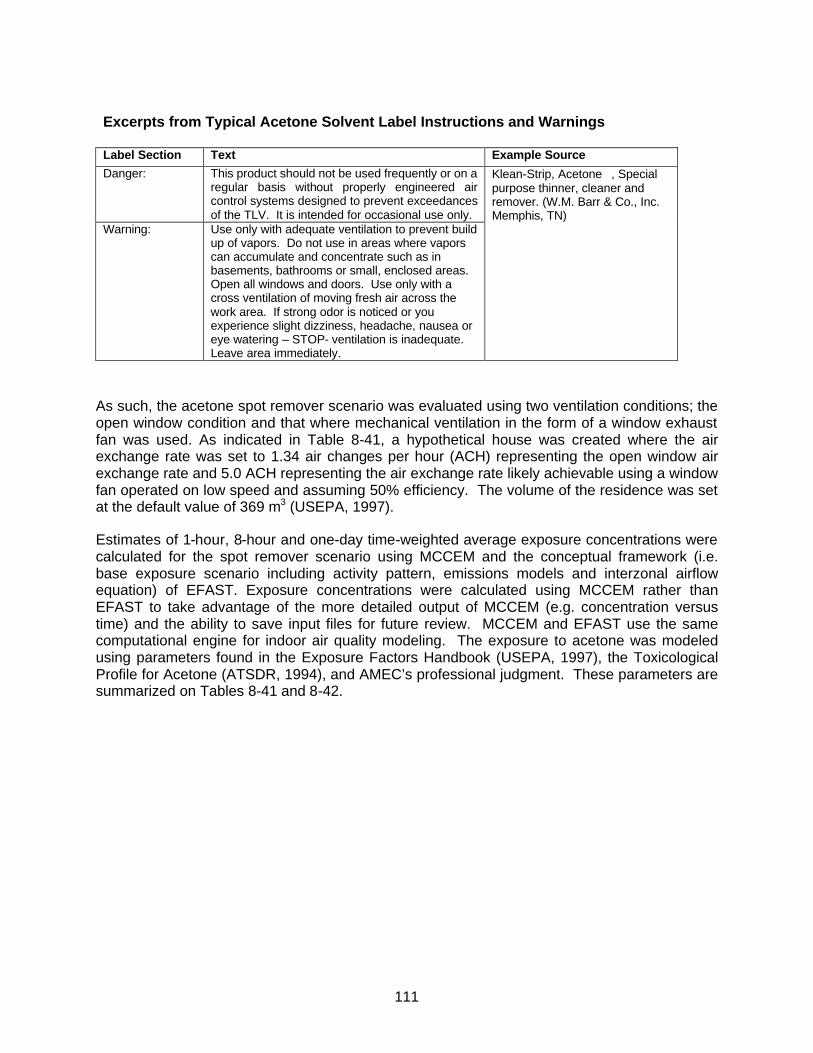
111
Excerpts from Typical Acetone Solvent Label Instructions and Warnings Label Section Text Example Source
Danger: This product should not be used frequently or on a regular basis without properly engineered air control systems designed to prevent exceedances of the TLV. It is intended for occasional use only.
Warning:
Use only with adequate ventilation to prevent build up of vapors. Do not use in areas where vapors can accumulate and concentrate such as in basements, bathrooms or small, enclosed areas. Open all windows and doors. Use only with a cross ventilation of moving fresh air across the work area. If strong odor is noticed or you experience slight dizziness, headache, nausea or eye watering – STOP- ventilation is inadequate. Leave area immediately.
Klean-Strip, Acetone, Special purpose thinner, cleaner and remover. (W.M. Barr & Co., Inc. Memphis, TN)
As such, the acetone spot remover scenario was evaluated using two ventilation conditions; the open window condition and that where mechanical ventilation in the form of a window exhaust fan was used. As indicated in Table 8-41, a hypothetical house was created where the air exchange rate was set to 1.34 air changes per hour (ACH) representing the open window air exchange rate and 5.0 ACH representing the air exchange rate likely achievable using a window fan operated on low speed and assuming 50% efficiency. The volume of the residence was set at the default value of 369 m3 (USEPA, 1997).
Estimates of 1-hour, 8-hour and one-day time-weighted average exposure concentrations were calculated for the spot remover scenario using MCCEM and the conceptual framework (i.e. base exposure scenario including activity pattern, emissions models and interzonal airflow equation) of EFAST. Exposure concentrations were calculated using MCCEM rather than EFAST to take advantage of the more detailed output of MCCEM (e.g. concentration versus time) and the ability to save input files for future review. MCCEM and EFAST use the same computational engine for indoor air quality modeling. The exposure to acetone was modeled using parameters found in the Exposure Factors Handbook (USEPA, 1997), the Toxicological Profile for Acetone (ATSDR, 1994), and AMEC’s professional judgment. These parameters are summarized on Tables 8-41 and 8-42.
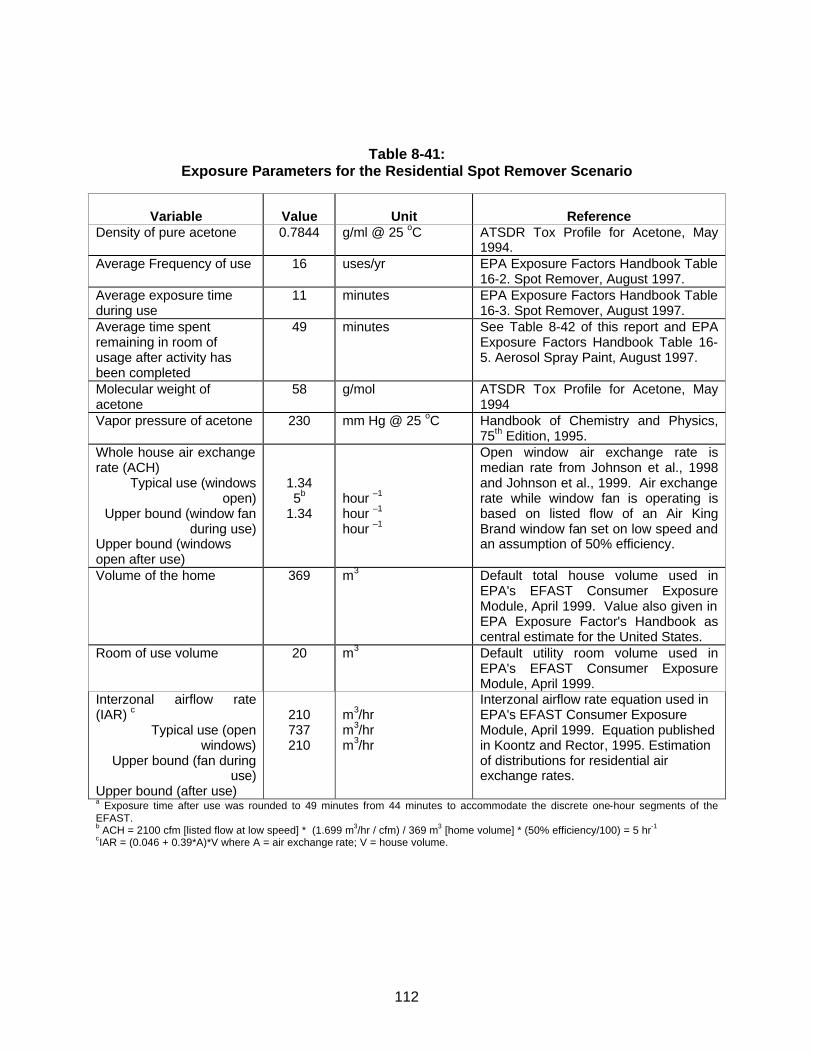
112
Table 8-41:
Exposure Parameters for the Residential Spot Remover Scenario
Variable
Value
Unit
Reference
Density of pure acetone 0.7844 g/ml @ 25 oC ATSDR Tox Profile for Acetone, May 1994.
Average Frequency of use 16 uses/yr EPA Exposure Factors Handbook Table 16-2. Spot Remover, August 1997.
Average exposure time during use
11 minutes EPA Exposure Factors Handbook Table 16-3. Spot Remover, August 1997.
Average time spent remaining in room of usage after activity has been completed
49 minutes See Table 8-42 of this report and EPA Exposure Factors Handbook Table 16-5. Aerosol Spray Paint, August 1997.
Molecular weight of acetone
58 g/mol ATSDR Tox Profile for Acetone, May 1994
Vapor pressure of acetone 230 mm Hg @ 25 oC Handbook of Chemistry and Physics, 75th Edition, 1995.
Whole house air exchange rate (ACH)
Typical use (windows open)
Upper bound (window fan during use)
Upper bound (windows open after use)
1.34 5b
1.34
hour –1
hour –1
hour –1
Open window air exchange rate is median rate from Johnson et al., 1998 and Johnson et al., 1999. Air exchange rate while window fan is operating is based on listed flow of an Air King Brand window fan set on low speed and an assumption of 50% efficiency.
Volume of the home 369 m3 Default total house volume used in EPA's EFAST Consumer Exposure Module, April 1999. Value also given in EPA Exposure Factor's Handbook as central estimate for the United States.
Room of use volume
20
m3 Default utility room volume used in EPA's EFAST Consumer Exposure Module, April 1999.
Interzonal airflow rate (IAR) c
Typical use (open windows)
Upper bound (fan during use)
Upper bound (after use)
210 737 210
m3/hr m3/hr m3/hr
Interzonal airflow rate equation used in EPA's EFAST Consumer Exposure Module, April 1999. Equation published in Koontz and Rector, 1995. Estimation of distributions for residential air exchange rates.
a Exposure time after use was rounded to 49 minutes from 44 minutes to accommodate the discrete one-hour segments of the EFAST. b ACH = 2100 cfm [listed flow at low speed] * (1.699 m3/hr / cfm) / 369 m3 [home volume] * (50% efficiency/100) = 5 hr-1 cIAR = (0.046 + 0.39*A)*V where A = air exchange rate; V = house volume.

113
Table 8-42:
Activity Pattern for Pure Acetone as Spot Remover
Time E-FAST Non-User Activity Pattern (Infants, Children)
Non-User (Infants & Young Children)
MCCEM Zone
E-FAST User Activity Pattern
(Teenagers, Adults)
User (Teenagers and Adults)
MCCEM Zone 12:00 AM Bedroom 2 Bedroom 2 1:00 AM Bedroom 2 Bedroom 2 2:00 AM Bedroom 2 Bedroom 2 3:00 AM Bedroom 2 Bedroom 2 4:00 AM Bedroom 2 Bedroom 2 5:00 AM Bedroom 2 Bedroom 2 6:00 AM Bedroom 2 Bedroom 2 7:00 AM Bedroom 2 Bathroom 2 8:00 AM Bathroom 2 Kitchen 2 9:00 AM Kitchen 2 UTILITY ROOM 1 10:00 AM Living Room 2 Living Room 2 11:00 AM Living Room 2 Living Room 2 12:00 PM Kitchen 2 Kitchen 2 1:00 PM Living Room 2 Living Room 2 2:00 PM Out 0 Out 0 3:00 PM Out 0 Out 0 4:00 PM Living Room 2 Living Room 2 5:00 PM Kitchen 2 Kitchen 2 6:00 PM Kitchen 2 Kitchen 2 7:00 PM Out 0 Out 0 8:00 PM Living Room 2 Living Room 2 9:00 PM Living Room 2 Living Room 2 10:00 PM Living Room 2 Living Room 2 11:00 PM Bedroom 2 Bedroom 2
Table Notes: UPPER CASE Upper case letters indicate room of use. Zone 0 Outside. Zone 1 Room of product use in the home. Zone 2 Remainder of the home.

114
As discussed previously, the Westat (1987) survey of solvent product usage provides a distribution of the volume of spot remover used per cleaning event for the United States population (Table C-18). However, the usage data reported by Westat is likely much greater than that which would be used for pure acetone because it is representative of a wide variety of products including Shout laundry detergent, K2R Spot Lifter, Woolite and Spray ‘n Wash, none of which contain acetone. Some survey respondents also mentioned brand name carpet cleaners (e.g. Bissell or Resolve), which do not contain acetone and are often used in relatively large volumes (i.e. 48 ounces per 600 square feet). Therefore, it was assumed the 90th percentile of the Westat distribution (about one cup) represents the reasonable upper bound usage quantity for pure acetone used as a spot remover.
In cases where a reasonable lower or upper bound can be determined for an input distribution, EPA recommends truncation, or the imposition a minimum or maximum value on a probability distribution. The purpose of truncation is to “constrain the sample space to a set of plausible values” (USEPA, 2001). A modified distribution for use of pure acetone as a spot remover was generated by truncating the Westat distribution at the 90th percentile and is presented on Table 8-43. This distribution was calculated by using linear interpolation between reported values of the Westat distribution to create an empirical distribution function (EDF), truncating the EDF at the 90th percentile and then normalizing the resulting probability density function (PDF) to integrate to unity.
Table 8-43: Distribution of Spot Remover Usage Among Users in the United States
Pure Acetone
Percentile ounces/usea ml/use grams/useb 0 0.010 0.29 0.23 5 0.16 4.8 3.8
10 0.23 6.8 5.4 25 0.48 14 11 50 1.2 34 27 75 2.5 74 58 90 4.8 141 111 95 6.2 181 143 100 7.5 221 174
aBased on distribution truncated at 90th percentile from U.S. EPA, Household Solvent Products: A national usage survey. July, 1987. Prepared by Westat. Table C-18: Percentile rankings of ounces per use of Spot Remover. bgrams/use= ( ounces/use ) * ( 29.57 ml/ounce ) * ( 0.7844 g/ml )
The model was run to estimate exposure concentrations for users and non-users of pure acetone spot remover according to the usage distributions provided above. Only inhalation exposures have been assessed in this scenario. While there may be dermal contact with acetone during its use as a spot remover, only a very small skin surface area would be in contact with the acetone and the high volatility of the chemical will minimize the potential for dermal absorption. This assumption is supported by the EPA dermal guidance (USEPA, 1992, 1995a, 1995b), which indicates that for pure phase VOCs, most of the neat compound would likely evaporate before absorption can occur. EPA Region III recommends an absorption factor of 0.05% for highly volatile chemicals. Therefore given the small surface area and the very low absorption due to acetone’s volatility, the dermal pathway for the spot remover scenario was
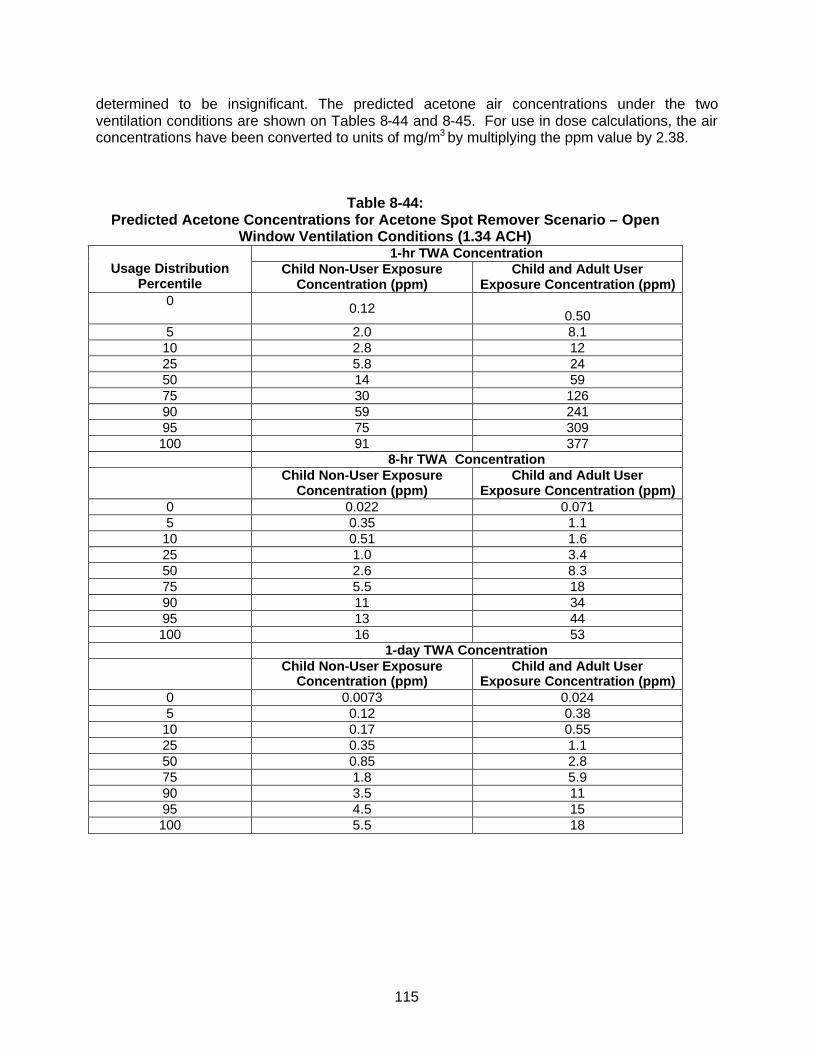
115
determined to be insignificant. The predicted acetone air concentrations under the two ventilation conditions are shown on Tables 8-44 and 8-45. For use in dose calculations, the air concentrations have been converted to units of mg/m3 by multiplying the ppm value by 2.38.
Table 8-44: Predicted Acetone Concentrations for Acetone Spot Remover Scenario – Open
Window Ventilation Conditions (1.34 ACH) 1-hr TWA Concentration
Usage Distribution Percentile
Child Non-User Exposure Concentration (ppm)
Child and Adult User Exposure Concentration (ppm)
0 0.12 0.50
5 2.0 8.1 10 2.8 12 25 5.8 24 50 14 59 75 30 126 90 59 241 95 75 309 100 91 377
8-hr TWA Concentration Child Non-User Exposure
Concentration (ppm) Child and Adult User
Exposure Concentration (ppm) 0 0.022 0.071 5 0.35 1.1
10 0.51 1.6 25 1.0 3.4 50 2.6 8.3 75 5.5 18 90 11 34 95 13 44 100 16 53
1-day TWA Concentration Child Non-User Exposure
Concentration (ppm) Child and Adult User
Exposure Concentration (ppm) 0 0.0073 0.024 5 0.12 0.38
10 0.17 0.55 25 0.35 1.1 50 0.85 2.8 75 1.8 5.9 90 3.5 11 95 4.5 15 100 5.5 18
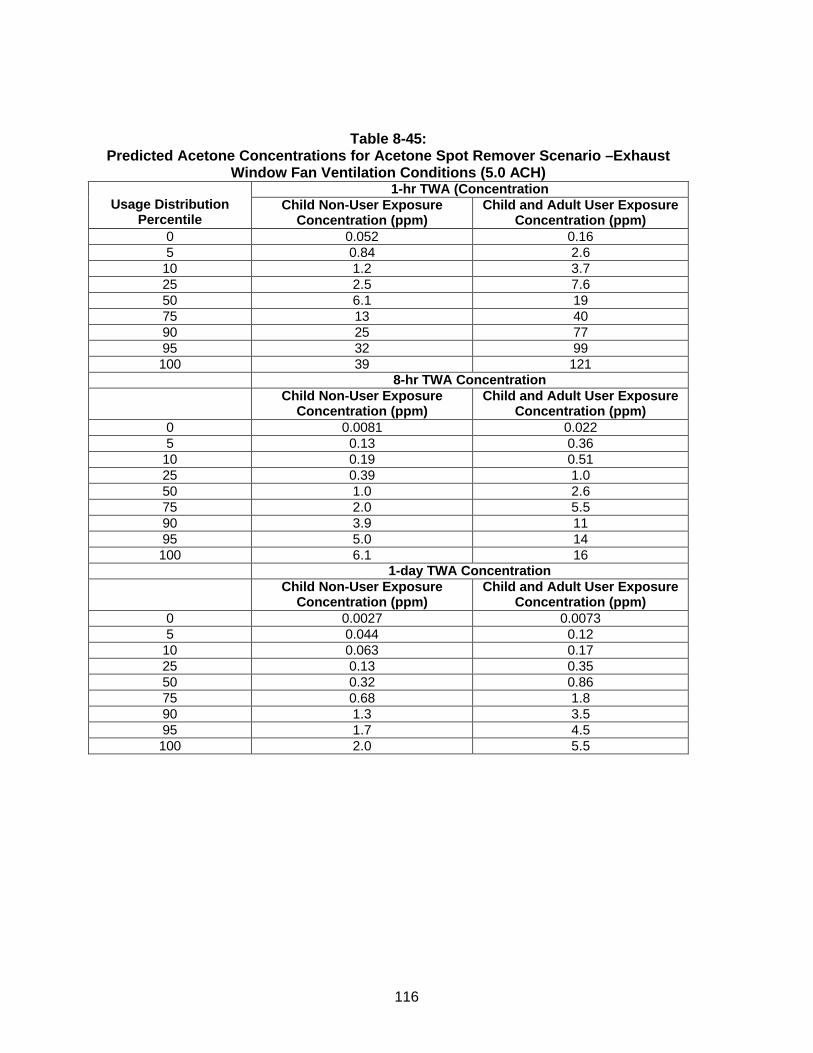
116
Table 8-45: Predicted Acetone Concentrations for Acetone Spot Remover Scenario –Exhaust
Window Fan Ventilation Conditions (5.0 ACH) 1-hr TWA (Concentration
Usage Distribution Percentile
Child Non-User Exposure Concentration (ppm)
Child and Adult User Exposure Concentration (ppm)
0 0.052 0.16 5 0.84 2.6
10 1.2 3.7 25 2.5 7.6 50 6.1 19 75 13 40 90 25 77 95 32 99 100 39 121
8-hr TWA Concentration Child Non-User Exposure
Concentration (ppm) Child and Adult User Exposure
Concentration (ppm) 0 0.0081 0.022 5 0.13 0.36
10 0.19 0.51 25 0.39 1.0 50 1.0 2.6 75 2.0 5.5 90 3.9 11 95 5.0 14 100 6.1 16
1-day TWA Concentration Child Non-User Exposure
Concentration (ppm) Child and Adult User Exposure
Concentration (ppm) 0 0.0027 0.0073 5 0.044 0.12
10 0.063 0.17 25 0.13 0.35 50 0.32 0.86 75 0.68 1.8 90 1.3 3.5 95 1.7 4.5 100 2.0 5.5
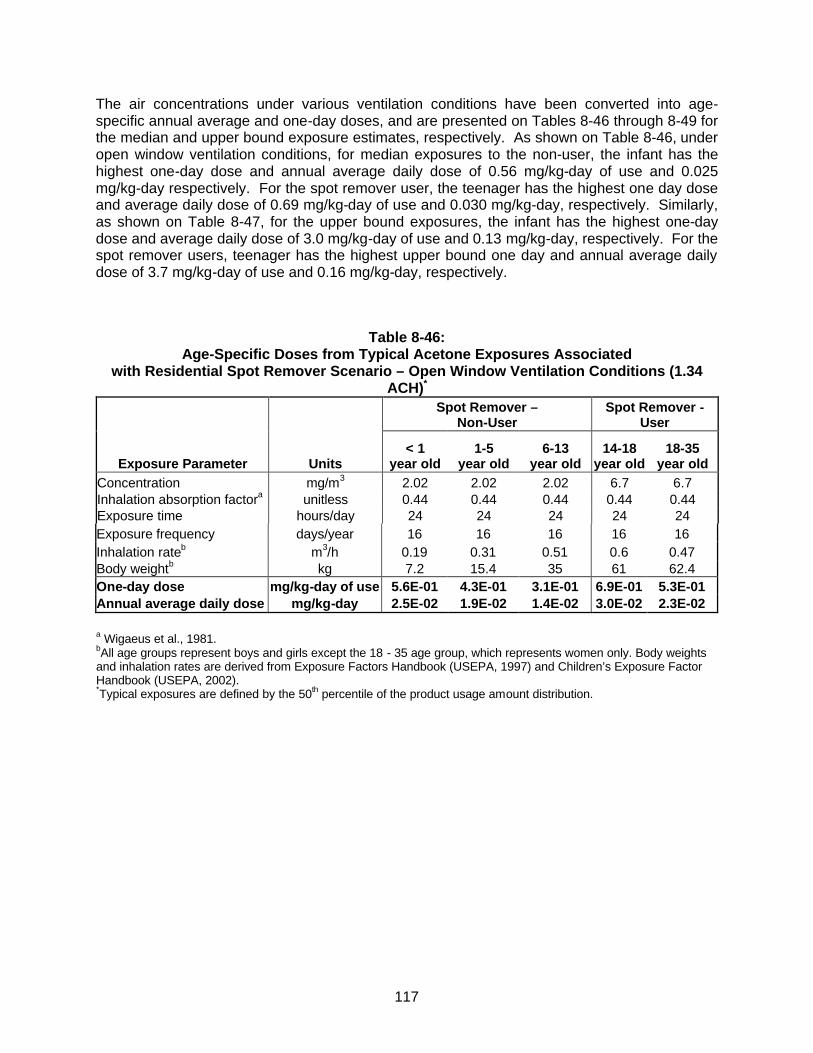
117
The air concentrations under various ventilation conditions have been converted into age-specific annual average and one-day doses, and are presented on Tables 8-46 through 8-49 for the median and upper bound exposure estimates, respectively. As shown on Table 8-46, under open window ventilation conditions, for median exposures to the non-user, the infant has the highest one-day dose and annual average daily dose of 0.56 mg/kg-day of use and 0.025 mg/kg-day respectively. For the spot remover user, the teenager has the highest one day dose and average daily dose of 0.69 mg/kg-day of use and 0.030 mg/kg-day, respectively. Similarly, as shown on Table 8-47, for the upper bound exposures, the infant has the highest one-day dose and average daily dose of 3.0 mg/kg-day of use and 0.13 mg/kg-day, respectively. For the spot remover users, teenager has the highest upper bound one day and annual average daily dose of 3.7 mg/kg-day of use and 0.16 mg/kg-day, respectively.
Table 8-46: Age-Specific Doses from Typical Acetone Exposures Associated
with Residential Spot Remover Scenario – Open Window Ventilation Conditions (1.34 ACH)*
Spot Remover –
Non-User Spot Remover -
User
Exposure Parameter Units < 1
year old 1-5
year old 6-13
year old 14-18
year old 18-35
year old Concentration mg/m3 2.02 2.02 2.02 6.7 6.7 Inhalation absorption factora unitless 0.44 0.44 0.44 0.44 0.44 Exposure time hours/day 24 24 24 24 24 Exposure frequency days/year 16 16 16 16 16 Inhalation rateb m3/h 0.19 0.31 0.51 0.6 0.47 Body weightb kg 7.2 15.4 35 61 62.4 One-day dose mg/kg-day of use 5.6E-01 4.3E-01 3.1E-01 6.9E-01 5.3E-01 Annual average daily dose mg/kg-day 2.5E-02 1.9E-02 1.4E-02 3.0E-02 2.3E-02
a Wigaeus et al., 1981. bAll age groups represent boys and girls except the 18 - 35 age group, which represents women only. Body weights and inhalation rates are derived from Exposure Factors Handbook (USEPA, 1997) and Children’s Exposure Factor Handbook (USEPA, 2002). *Typical exposures are defined by the 50th percentile of the product usage amount distribution.
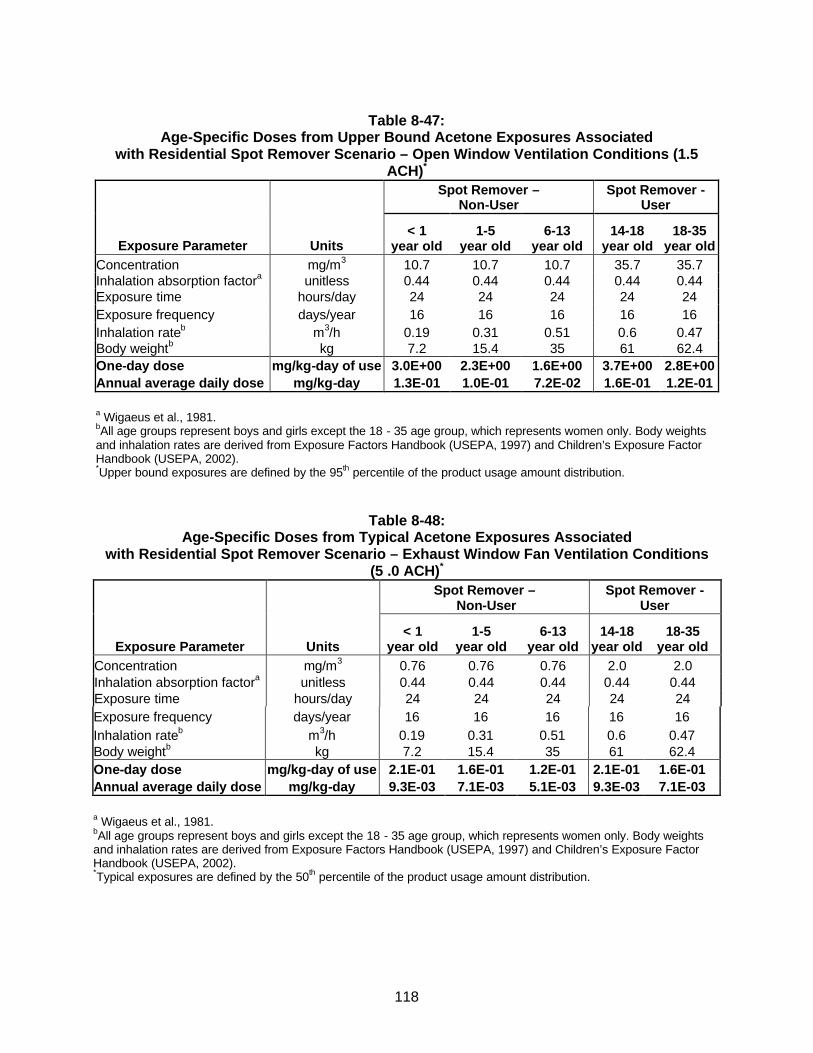
118
Table 8-47:
Age-Specific Doses from Upper Bound Acetone Exposures Associated with Residential Spot Remover Scenario – Open Window Ventilation Conditions (1.5
ACH)*
Spot Remover –
Non-User Spot Remover -
User
Exposure Parameter Units < 1
year old 1-5
year old 6-13
year old 14-18
year old 18-35
year old Concentration mg/m3 10.7 10.7 10.7 35.7 35.7 Inhalation absorption factora unitless 0.44 0.44 0.44 0.44 0.44 Exposure time hours/day 24 24 24 24 24 Exposure frequency days/year 16 16 16 16 16 Inhalation rateb m3/h 0.19 0.31 0.51 0.6 0.47 Body weightb kg 7.2 15.4 35 61 62.4 One-day dose mg/kg-day of use 3.0E+00 2.3E+00 1.6E+00 3.7E+00 2.8E+00 Annual average daily dose mg/kg-day 1.3E-01 1.0E-01 7.2E-02 1.6E-01 1.2E-01
a Wigaeus et al., 1981. bAll age groups represent boys and girls except the 18 - 35 age group, which represents women only. Body weights and inhalation rates are derived from Exposure Factors Handbook (USEPA, 1997) and Children’s Exposure Factor Handbook (USEPA, 2002). *Upper bound exposures are defined by the 95th percentile of the product usage amount distribution.
Table 8-48: Age-Specific Doses from Typical Acetone Exposures Associated
with Residential Spot Remover Scenario – Exhaust Window Fan Ventilation Conditions (5 .0 ACH)*
Spot Remover –
Non-User Spot Remover -
User
Exposure Parameter Units < 1
year old 1-5
year old 6-13
year old 14-18
year old 18-35
year old Concentration mg/m3 0.76 0.76 0.76 2.0 2.0 Inhalation absorption factora unitless 0.44 0.44 0.44 0.44 0.44 Exposure time hours/day 24 24 24 24 24 Exposure frequency days/year 16 16 16 16 16 Inhalation rateb m3/h 0.19 0.31 0.51 0.6 0.47 Body weightb kg 7.2 15.4 35 61 62.4 One-day dose mg/kg-day of use 2.1E-01 1.6E-01 1.2E-01 2.1E-01 1.6E-01 Annual average daily dose mg/kg-day 9.3E-03 7.1E-03 5.1E-03 9.3E-03 7.1E-03
a Wigaeus et al., 1981. bAll age groups represent boys and girls except the 18 - 35 age group, which represents women only. Body weights and inhalation rates are derived from Exposure Factors Handbook (USEPA, 1997) and Children’s Exposure Factor Handbook (USEPA, 2002). *Typical exposures are defined by the 50th percentile of the product usage amount distribution.
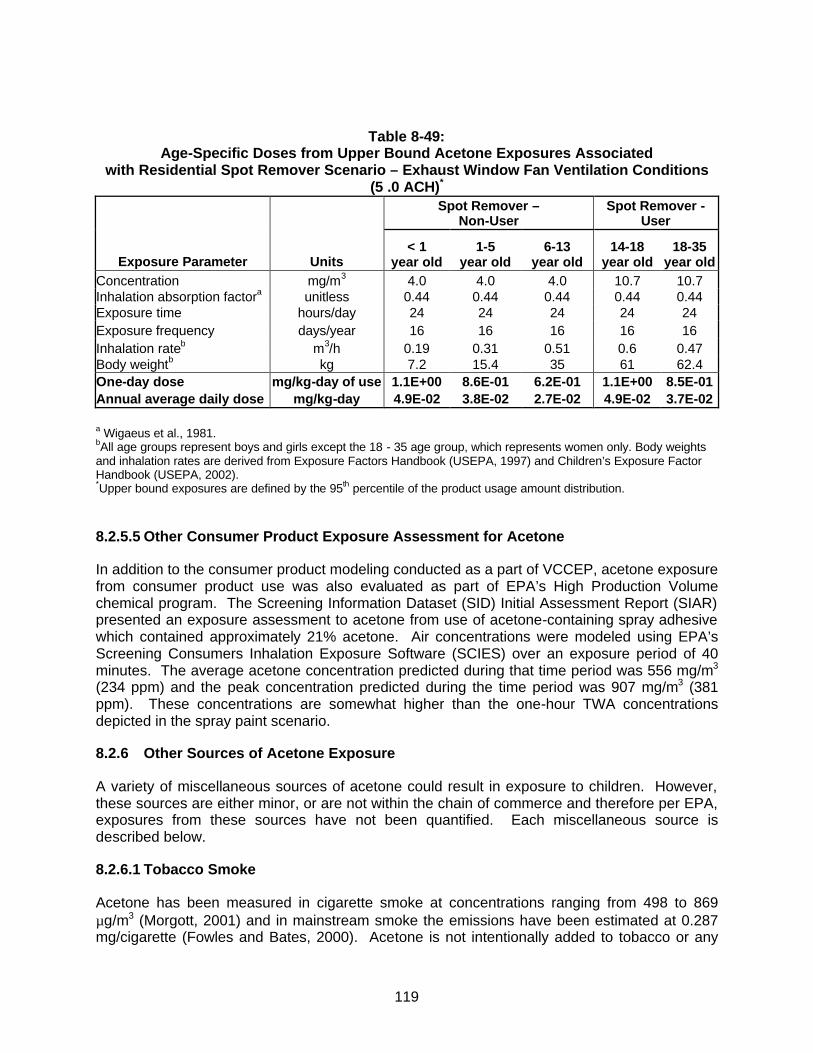
119
Table 8-49: Age-Specific Doses from Upper Bound Acetone Exposures Associated
with Residential Spot Remover Scenario – Exhaust Window Fan Ventilation Conditions (5 .0 ACH)*
Spot Remover –
Non-User Spot Remover -
User
Exposure Parameter Units < 1
year old 1-5
year old 6-13
year old 14-18
year old 18-35
year old Concentration mg/m3 4.0 4.0 4.0 10.7 10.7 Inhalation absorption factora unitless 0.44 0.44 0.44 0.44 0.44 Exposure time hours/day 24 24 24 24 24 Exposure frequency days/year 16 16 16 16 16 Inhalation rateb m3/h 0.19 0.31 0.51 0.6 0.47 Body weightb kg 7.2 15.4 35 61 62.4 One-day dose mg/kg-day of use 1.1E+00 8.6E-01 6.2E-01 1.1E+00 8.5E-01 Annual average daily dose mg/kg-day 4.9E-02 3.8E-02 2.7E-02 4.9E-02 3.7E-02
a Wigaeus et al., 1981. bAll age groups represent boys and girls except the 18 - 35 age group, which represents women only. Body weights and inhalation rates are derived from Exposure Factors Handbook (USEPA, 1997) and Children’s Exposure Factor Handbook (USEPA, 2002). *Upper bound exposures are defined by the 95th percentile of the product usage amount distribution.
8.2.5.5 Other Consumer Product Exposure Assessment for Acetone
In addition to the consumer product modeling conducted as a part of VCCEP, acetone exposure from consumer product use was also evaluated as part of EPA’s High Production Volume chemical program. The Screening Information Dataset (SID) Initial Assessment Report (SIAR) presented an exposure assessment to acetone from use of acetone-containing spray adhesive which contained approximately 21% acetone. Air concentrations were modeled using EPA’s Screening Consumers Inhalation Exposure Software (SCIES) over an exposure period of 40 minutes. The average acetone concentration predicted during that time period was 556 mg/m3 (234 ppm) and the peak concentration predicted during the time period was 907 mg/m3 (381 ppm). These concentrations are somewhat higher than the one-hour TWA concentrations depicted in the spray paint scenario.
8.2.6 Other Sources of Acetone Exposure
A variety of miscellaneous sources of acetone could result in exposure to children. However, these sources are either minor, or are not within the chain of commerce and therefore per EPA, exposures from these sources have not been quantified. Each miscellaneous source is described below.
8.2.6.1 Tobacco Smoke
Acetone has been measured in cigarette smoke at concentrations ranging from 498 to 869 µg/m3 (Morgott, 2001) and in mainstream smoke the emissions have been estimated at 0.287 mg/cigarette (Fowles and Bates, 2000). Acetone is not intentionally added to tobacco or any

120
other component of the cigarette, but forms during the process of combustion. This “process” is outside of the chain of commerce for acetone and thus has not been quantified, although it is predicted that the acetone exposure would be very low. Tobacco smoking has been long recognized as an unsafe activity because of its association with various health impacts including but not limited to lung cancer, emphysema, chronic bronchitis, heart disease and stroke, none of which are related to the health hazards identified for acetone.
Data provided by the American Lung Association indicates that smoking prevalence in the U.S. is on the decline and has been since 1963 (www.lungusa.org/data/smoke). Data also suggests that fewer pregnant women smoke and fewer children are becoming smokers as a result of strong anti-smoking media campaigns and new regulations prohibiting the marketing of tobacco products to children. As a result, it is likely that exposure to acetone from cigarette smoke will continue to decline.
8.2.6.2 Wood-burning Fireplaces, Stoves and other Combustion Sources
In addition to tobacco products, acetone has been detected in the emissions from numerous other combustion sources including wood burning stoves and backyard waste incinerators. Although wood-burning stoves are used indoors, if properly ventilated, it is unlikely to significantly increase the ambient indoor acetone concentrations in a house and as with ambient air would be a de minimis exposure. The back yard incinerator is unlikely to be a major source of exposure for the majority of the U.S. population, as incinerators of this nature are banned in most major urban and suburban areas. Further, as an outdoor source, the time a child could potentially spend near the incinerator is expected to be small if any, and therefore unlikely to impact the child’s overall outdoor ambient air exposure.
8.2.6.3 Landfills
Acetone has been measured in the gas emissions from landfills at concentrations ranging from 15.7 – 77.1 mg/m3. Although some acetone containing products could have been placed in landfills, the primary source of the acetone in the gaseous emissions is from biological decomposition of the waste material. If the landfill is viewed as a stationary air pollution source, it can be assumed that the acetone emissions from the landfill are unlikely to have an impact at the fenceline, as it was demonstrated in EPA’s SARA 313 delisting of acetone that industrial sources do not emit acetone in concentrations, which have an impact at the fenceline. Additionally, in terms of overall ambient air impacts, emissions from landfills are significantly less than natural (i.e., biogenic) emitters of acetone such as vegetation, which releases an estimated 9 million tons per year to the atmosphere. Thus, children’s exposures to landfill emissions are unlikely to be a significant source of ambient air acetone exposure.
8.2.6.4 Acetone from metabolic conversion of isopropanol
Isopropanol could contribute to children’s acetone exposure via metabolic conversion because exogenous exposure to isopropanol is metabolized in the body to acetone. Thus, exposure to isopropanol from medicinal uses or consumer products will result in the generation of an internal dose of acetone. Acetone exposures from this source have not been quantified because an isopropanol exposure assessment is beyond the scope of this assessment.

121
8.3 Uncertainties in the Exposure Assessment
Uncertainties are associated with any exposure assessment and for the acetone VCCEP assessment include: the use of published monitoring data to represent exposures for the U.S. population, derivation of children’s endogenous acetone production from a study of adults, and use of mathematical models to estimate human exposures, in the absence of monitoring data. Each of these is described further below.
8.3.1 Monitoring Data
Published monitoring data was used to characterize children’s and prospective mothers’ exposures from ambient air and water, as well as occupational exposures. Ambient air data was obtained from ATSDR. The dataset provided by ATSDR, while somewhat dated provides the most current measured ambient air data available. Because acetone is not regulated under the Clean Air Act, there are no current requirements for collection of ambient air samples for acetone measurement. Thus, given that the data indicates that acetone is only present in the ambient air at very low levels and there is no current regulatory concern regarding acetone in the atmosphere, the use of the monitoring data to represent average population exposures is not likely to affect the overall exposure assessment.
The monitoring data used to characterize exposures to acetone from drinking water was also obtained from ATSDR. Acetone is rarely if ever detected in drinking water and when it is, only at very low concentrations. Thus, the use of this data for representation of general population exposure is unlikely to result in significant over or underestimates of exposure.
The monitoring data used to characterize occupational exposures was collected relatively recently across a wide variety of industries. While a thorough knowledge of each industry and the potential variations in occupational exposures within each industry is not possible from use of the peer-reviewed literature, the data has been peer reviewed and deemed acceptable for publication. Thus, use of this monitoring data is appropriate to characterize occupational exposures.
8.3.2 Derivation of Endogenous Acetone Production
Several studies have been published which establish the direct linear correlation between blood acetone levels and endogenous production. However, because the regression equations relating the blood acetone levels and production rate were not published, the production rates had to be estimated by visual inspection of the published graphs which depicted the correlation. Because the low end of the normal blood concentrations fell outside of the range of data evaluated in the published studies, professional judgment was used to determine a corresponding lower bound value for normal endogenous production. The lowest plasma acetone concentrations reported by Reichard et al, (0.25 – 0.5mM) corresponded to an acetone turnover rate of approximately 20 µmol/m2/min. Therefore, lacking the regression equation, it was conservatively assumed that at the lower end of the normal adult blood level range (0.007-mM) corresponded to a production rate of 10 µmol/m2/min.
An additional uncertainty in estimating normal endogenous acetone levels for children is the use of acetone turnover rates measured in adults. This uncertainty, however, likely leads to an underestimation of endogenous production rates in children, as it is well understood that children’s metabolic demands are greater (personal communication Muso-Veloso, 2003).
122
8.3.3 Consumer Product Modeling
The uncertainties associated with any modeling exercise are typically those associated with the various model parameters. However, it is believed that in this exposure assessment most of the uncertainty errs on the conservative side. To address the uncertainties with the model, a sensitivity analysis was conducted to determine which of the parameters had the greatest affect on predicted air concentrations. The parameters most sensitive were 1) amount of product used, 2) whole house air exchange rate and 3) total home volume. A complete discussion of the sensitivity analysis is presented in Appendix J.
In addition to modeling parameter uncertainties, there are also scenario specific uncertainties. Each is briefly described below.
Residential Nail Tip Remover Scenario – The primary uncertainties associated with the dermal modeling of this scenario is that of the derived neat acetone permeability coefficient. This value is derived from the water permeability coefficient. This conversion is appropriate if it can be assumed that the vehicle (pure acetone) does not alter the barrier properties of the skin (USEPA, 1992). It is recognized that dermal contact with acetone can de-fat the skin. Also, ATSDR has indicated that significant damage to the epidermis can occur after 30 minutes or more of contact with acetone. Thus, if damage to the epidermis occurs during nail tip removal, the permeability coefficient of neat acetone may be underestimated, and therefore the dose of acetone received likewise underestimated.
In estimating acetone exposure due to inhalation that occurs during and after soaking, the uncertainties in the scenario include room of use, and the evaporation rate from the tray used for nail tip removal. The sensitivity analysis shows that the room of use is not a sensitive parameter for estimating exposures. However, the evaporation rate, which is primarily a function of surface area of the tray and the airflow velocity in the room, is a key parameter. Using a tray with a larger than average surface area would result in larger exposure concentrations. With respect to airflow, the top edge of the tray tends to decrease airflow around the evaporating liquid. However, random hand movements during soaking might tend to increase airflow over the liquid pool of acetone.
Nail Polish Remover Scenario – In estimating acetone exposure from use of nail polish remover, the uncertainties in the scenario include room of use, and potential differences in the amount used by a child versus an adult. The sensitivity analysis shows that the room of use is not a sensitive parameter for estimating exposures, however, the amount of product used is sensitive. It is unknown whether the amount of product used by a child would be different than that used by an adult. While the child has a smaller fingernail surface area, their application “technique” may not be as skillful as an adult, and therefore the quantity of the product used may not be much different than that of an adult. Also it is likely that with very young children, an adult would be assisting in the application and thus use a quantity representative of an adult. As such, the amount used has been assumed to be similar to the adult.
Residential Spray Paint Scenario – The uncertainties associated with this scenario are the amount of product used, the correlation of amount of product used to location of use (inside versus outside), and the steps taken to ventilate space (opening windows or exhaust fans). The Westat survey provides some useful information on these points. Some of the relevant details of the survey results include:
123
• Over 80% of the survey respondents indicated that the last time they used spray paint, it was used outside or in a garage. In the residential spray paint scenario presented in Section 8.2.5.2, the assumption was made that the activity would take place within a room integral to the house. However, according to the Westat survey, this is not a common practice for most spray paint users. Thus, the assumption of indoor use may overestimate the acetone exposure during spray painting for most users of spray paint.
• For those survey respondents that used products inside, 63% opened a window, 10% used an exhaust fan, and 61% left the inside door of the room open. In the uncertainty analysis, the whole house air exchange rate was determined to be a sensitive parameter, thus using a default value for the air exchange rate would not be representative of typical use conditions. Of the survey respondents, 73% indicated that they read the directions on the label. Most spray paint labels contain a warning to use the product outdoors or in a well-ventilated space. Thus, it is reasonable to assume that a majority of the product users will heed the warnings and that the additional ventilation will minimize typical exposures during spray painting.
Residential Spot Remover Scenario – The most important uncertainty with this scenario beyond the sensitive model parameters is the assumption that pure acetone sold in bulk to the general public is generally used as a spot remover with a similar usage amount distribution. Although there are numerous uses for pure acetone by various hobbyists (i.e., cleaning during do it yourself automobile repair; cleaning of seams during woodworking; cleaning/debonding cyanoacrylate glue (“crazy glue”) during model construction; removal of enamel paint, etc.) it has been assumed that the quantities used would be comparable to that of general spot removers. Thus, evaluation of the spot remover scenario would likely be representative of other uses of pure acetone in the home. The Westat, 1987 survey indicates that for spot remover:
• Most people (95%) used the spot remover inside. Thus, modeling the scenario in an indoor environment is appropriate and not overly conservative.
The majority of users (55%) did not open a door or window and 90% did not have on an exhaust fan. This would be reasonable for the majority of respondents who appear to have used spot removers such as Shout, Spray ‘n Wash and Woolite, where there would be no recommendation to use in a well ventilated space. However, given the low odor threshold for acetone and container label warnings to used adequate ventilation, it is likely that someone using nearly a cup of acetone as a spot remover would open windows or doors. Thus the air concentrations presented on Tables 8-44 and 8-45 are thought to be representative of exposures for acetone use as a spot remover.

124
8.4 Summary of Dose Estimates
Internal dose estimates from the various acetone exposures included in this assessment are presented on Table 8-50.
Table 8-50 Summary of Acetone Dose Estimates for Children and Prospective Mothers
Age-Specific Dose (mg/kg-day)
Source < 1
year old 1-5
year old 6-13
year old 14-18
year old 18-35
year old Ambient / Chronic Average Daily Dose
Indoor 0.0046 0.0035 0.0026 0.0017 0.0013 Outdoor rural 0.00025 0.00019 0.00014 0.000092 0.000071 Air Outdoor urban 0.00057 0.00044 0.00032 0.00021 0.00016
Water 0.000033 0.000097 0.000043 0.000033 0.000040 Food (i.e.,cow's milk) 0.060 0.16 0.081 0.032 0.026
Non-occupational 1.5 Human milk – exposed mother Occupational 7.9 Occupational - exposed mother 22
Endogenous / One-Day Dose
Typical 121 94 72 55 41 Endogenous production Upper bound 387 135 104 83 72
Microenvironment / One-Day Dose
Typical (0.45 ACH) 0.13 0.099 0.20 0.14 0.10 Nail polish remover scenario Upper bound (0.45 ACH) 0.26 0.20 0.40 0.27 0.21 Typical (1.34 ACH) 1.3 0.96 0.70 1.5 1.1 Upper bound (1.34 ACH)
4.0 3.0 2.2 4.7 3.6
Typical (5.0 ACH) 0.38 0.29 0.21 0.44 0.34 Spray paint scenario
Upper bound (5.0 ACH) 1.3 0.96 0.70 1.4 1.1 Typical (1.34 ACH) 0.56 0.43 0.31 0.69 0.53 Upper bound (1.34 ACH)
3.0 2.3 1.6 3.7 2.8
Typical (5.0 ACH) 0.21 0.16 0.12 0.21 0.16
Spot remover scenario using pure acetone
Upper bound (5.0 ACH) 1.1 0.86 0.62 1.1 0.85 Typical (1.34 ACH) 0.53 0.40 0.29 1.9 1.7 Nail tip removal scenario using
pure acetone Upper bound (1.34 ACH) 0.79 0.60 0.44 2.5 2.2 Microenvironment / Chronic Average Daily Dose
Typical (0.45 ACH) 0.011 0.0087 0.018 0.012 0.0091 Nail polish remover scenario Upper bound (0.45 ACH) 0.023 0.017 0.035 0.024 0.018
Typical (1.34 ACH) 0.014 0.011 0.0076 0.016 0.012 Upper bound (1.34 ACH)
0.044 0.033 0.024 0.051 0.039
Typical (5.0 ACH) 0.0042 0.0032 0.0023 0.0049 0.0037 Spray paint scenario
Upper bound (5.0 ACH) 0.014 0.011 0.0076 0.015 0.012 Typical (1.34 ACH) 0.025 0.019 0.014 0.030 0.023 Upper bound (1.34 ACH)
0.13 0.10 0.072 0.16 0.12
Typical (5.0 ACH) 0.0093 0.0071 0.0051 0.0093 0.0071
Spot remover scenario using pure acetone
Upper bound (5.0 ACH) 0.049 0.038 0.027 0.049 0.037 Typical (1.34 ACH) 0.0058 0.0044 0.0032 0.021 0.018 Nail tip removal scenario using
pure acetone Upper bound 1.34 ACH) 0.0086 0.0066 0.0048 0.028 0.024 Shaded areas indicate dose calculation not applicable to the age range.
125
9. Risk Assessment
Risk assessment is the integration of the hazard assessment and the exposure assessment to provide numerical estimates of risk. Risks from both chronic ambient environmental exposures and single event exogenous exposures have been characterized. This risk assessment includes: (1) a brief overview of hazard information and explanation of relevant health benchmarks; (2) chronic hazard evaluation; and (3) an evaluation of one-day exposure from selected use scenarios. Uncertainties are also discussed, and overall conclusions are presented concerning the potential for acetone exposure to pose health risks to children.
9.1 Summary of Hazard Information and Relevant Health Benchmarks
A complete hazard assessment is presented in Section 7. As described in that section, the toxicological effects of acetone have been well-studied, and all of the toxicity tests listed in Tier 1, Tier 2 and Tier 3 of the Pilot Announcement have been conducted for acetone or its metabolic precursor isopropanol. The following paragraphs address in summary fashion each toxicity endpoint covered by the VCCEP.
Acute Toxicity. Animal and human data demonstrate that acetone has low acute toxicity.
Repeated Dose (Systemic) Toxicity. The extensive data available for acetone demonstrates low systemic toxicity. The 90-day drinking water studies in rats and mice sponsored by NTP demonstrated a very mild toxic response at very high doses. Based on the minimal effects seen at doses of 1700 mg/kg/day and higher, 900 mg/kg/day was determined to be the NOAEL for the NTP studies.
Genotoxicity. Acetone has been tested in more than two dozen in vitro and in vivo assays. These studies indicate that acetone is not genotoxic. In fact, acetone has been used as a vehicle for testing water insoluble substances in various mutagenicity assays.
Carcinogenicity. From lifetime dermal studies in mice and other relevant information, the SIAR concludes that acetone is not likely to be carcinogenic. (SIAR, p. 28). EPA in 1995 concluded, “There is currently no evidence to suggest a concern for carcinogenicity.” (EPCRA Review, described in Section 3.3). NTP scientists have recommended against chronic toxicity/carcinogenicity testing of acetone because “the prechronic studies only demonstrated a very mild toxic response at very high doses in rodents,” and because of “the absence of any evidence supporting the carcinogenic potential of acetone.” (See Appendix F.) These previous assessments are supported by: (1) numerous assays demonstrating a lack of mutagenic activity or cytogenetic toxicity; (2) negative chronic dermal studies using acetone; and (3) negative chronic toxicity/oncogenicity studies of isopropanol in rats and mice.
Neurotoxicity and Developmental Neurotoxicity. High acute exposure to acetone can cause reversible pharmacologic effects, but available studies do not provide any evidence of injury to the nervous system following repeated exposures. A guideline developmental neurotoxicity study conducted with isopropanol in rats produced no evidence of developmental neurotoxicity at the highest dose (1200 mg/kg/day).
Immunotoxicity. No evidence of potential immunotoxicity was observed in a recent guideline study of acetone in mice.
126
Developmental and Reproductive Toxicity. Developmental toxicity studies in rats and mice established a NOAEL of 2200 ppm and produced no compelling evidence to indicate that acetone is a teratogen. As noted by Clewell, et al. (2003, in press) a higher NOAEL could very likely have been demonstrated given the mild effects reported at the highest exposures of 6600 ppm in mice and 11,000 ppm in rats.
Reproductive studies on acetone include an oral (drinking water) one-generation study in rats (only males exposed), which showed no testicular toxicity or effects on reproduction at 0.5 percent acetone in the drinking water. In another one-generation study, male rats were exposed to acetone (0.5 and 1.0 percent in the drinking water) along with DEHP, with no evidence of toxicity to the testes or adverse effect on reproduction. The reproductive toxicity studies of isopropanol (IPA) also support that acetone does not represent a reproductive toxicity hazard.
That the exogenous exposure to acetone does not pose a developmental or reproductive hazard is not surprising, considering that endogenous production of acetone is so much greater than typical exogenous exposures, and normal activities (e.g., exercise, diet) can cause endogenous production of acetone to increase significantly in healthy individuals. Also, pregnant women, nursing mothers and children all have higher blood levels of acetone naturally due to their higher energy requirements. Further, as described in Section 7.12, the medical community has begun using a ketogenic diet as a means to reduce the frequency and severity of epileptic attacks in infants and children with recalcitrant refractory epilepsy.
Selection of Health Benchmarks. The key health benchmarks for this risk assessment are the RfD and RfC derived by Gentry, et al. (2003, in press), described in section 7.16. Like RfCs and RfDs derived by EPA, these values are intended to represent exposures that can be repeated daily for a lifetime without appreciable risk to the general population, including sensitive subgroups.
Gentry et al. derived an RfD value of 16.0 mg/kg/day from the NOAEL of 900 mg/kg/day in the NTP subchronic drinking water studies, and an oral RfD of 8.7 mg/kg/day based on a NOAEL of 2200 ppm in the inhalation developmental toxicity studies in rats and mice. The latter value is essentially identical to the chronic value recommended in the WHO IPCS Environmental Health Criteria document (9.0 mg/kg/day) and will be used as the chronic oral health benchmark for this risk assessment, even though acetone is not believed to pose a developmental toxicity hazard in humans.
Gentry et al. also derived an RfC of 29 ppm, based on the NOAEL of 2200 ppm in the mouse and rat inhalation developmental toxicity studies. This value is similar to the chronic inhalation MRL of 13 ppm derived by ATSDR, and provides a basis for assessing the potential health significance of chronic exposures to acetone in indoor and outdoor air.
Single day exposures, such as result from a single use of a consumer product, are compared to normal endogenous production. As a further analysis of short-term exposures, exposure concentrations are compared to a range of acute irritation-based exposure levels.
Because acetone is not believed to present a developmental or reproductive toxicity hazard, the focus of this risk assessment is on exposure to children.
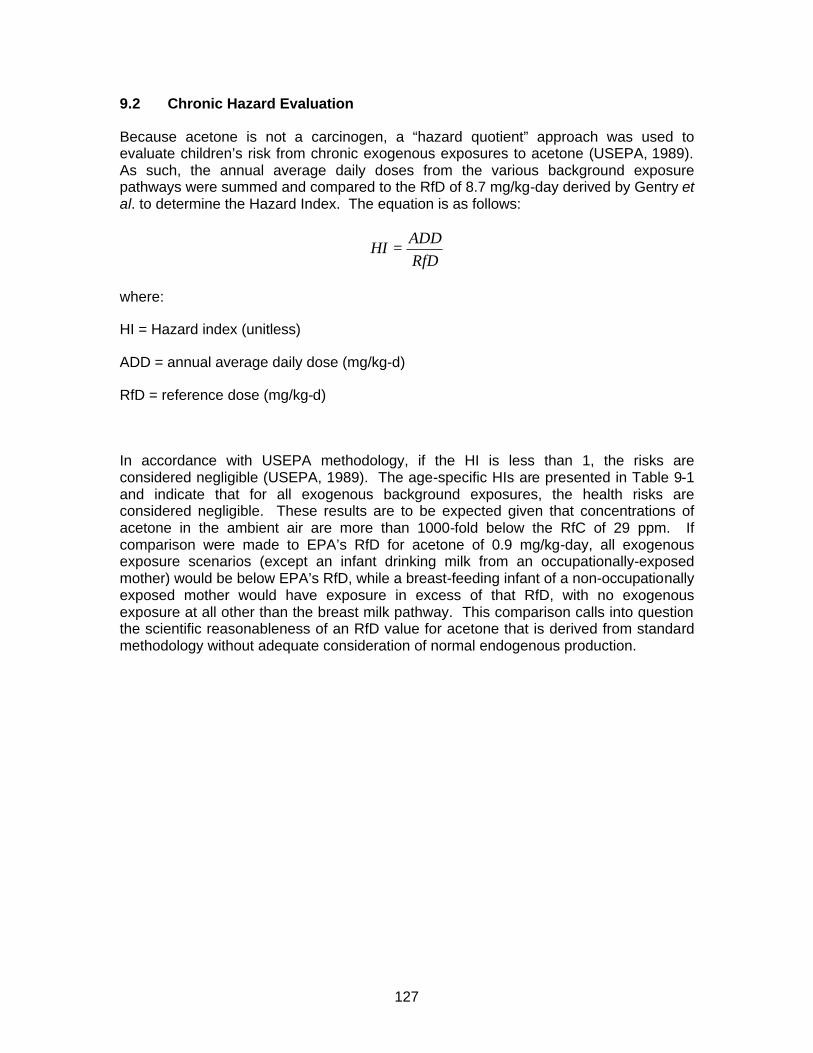
127
9.2 Chronic Hazard Evaluation
Because acetone is not a carcinogen, a “hazard quotient” approach was used to evaluate children’s risk from chronic exogenous exposures to acetone (USEPA, 1989). As such, the annual average daily doses from the various background exposure pathways were summed and compared to the RfD of 8.7 mg/kg-day derived by Gentry et al. to determine the Hazard Index. The equation is as follows:
RfDADD
HI =
where:
HI = Hazard index (unitless)
ADD = annual average daily dose (mg/kg-d)
RfD = reference dose (mg/kg-d)
In accordance with USEPA methodology, if the HI is less than 1, the risks are considered negligible (USEPA, 1989). The age-specific HIs are presented in Table 9-1 and indicate that for all exogenous background exposures, the health risks are considered negligible. These results are to be expected given that concentrations of acetone in the ambient air are more than 1000-fold below the RfC of 29 ppm. If comparison were made to EPA’s RfD for acetone of 0.9 mg/kg-day, all exogenous exposure scenarios (except an infant drinking milk from an occupationally-exposed mother) would be below EPA’s RfD, while a breast-feeding infant of a non-occupationally exposed mother would have exposure in excess of that RfD, with no exogenous exposure at all other than the breast milk pathway. This comparison calls into question the scientific reasonableness of an RfD value for acetone that is derived from standard methodology without adequate consideration of normal endogenous production.
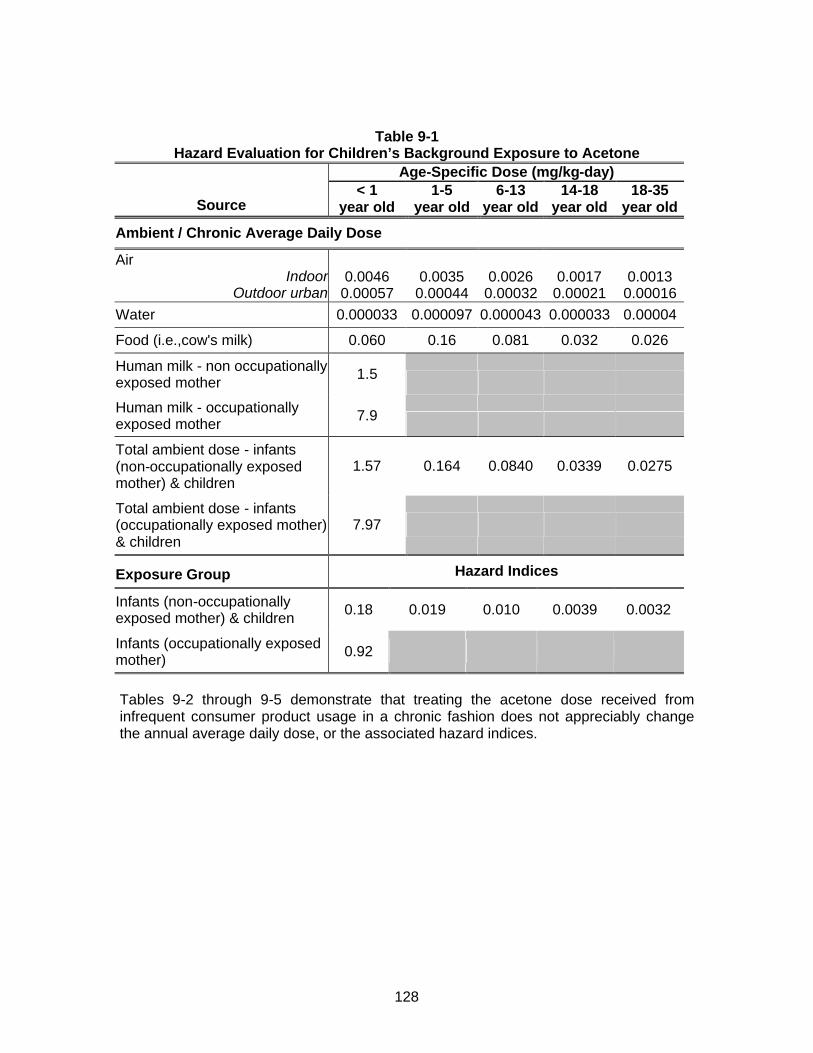
128
Table 9-1 Hazard Evaluation for Children’s Background Exposure to Acetone
Age-Specific Dose (mg/kg-day) < 1 1-5 6-13 14-18 18-35
Source year old year old year old year old year old
Ambient / Chronic Average Daily Dose
Air Indoor 0.0046 0.0035 0.0026 0.0017 0.0013
Outdoor urban 0.00057 0.00044 0.00032 0.00021 0.00016 Water 0.000033 0.000097 0.000043 0.000033 0.00004
Food (i.e.,cow's milk) 0.060 0.16 0.081 0.032 0.026
Human milk - non occupationally exposed mother 1.5
Human milk - occupationally exposed mother 7.9
Total ambient dose - infants (non-occupationally exposed mother) & children
1.57 0.164 0.0840 0.0339 0.0275
Total ambient dose - infants (occupationally exposed mother) & children
7.97
Exposure Group Hazard Indices
Infants (non-occupationally exposed mother) & children 0.18 0.019 0.010 0.0039 0.0032
Infants (occupationally exposed mother) 0.92
Tables 9-2 through 9-5 demonstrate that treating the acetone dose received from infrequent consumer product usage in a chronic fashion does not appreciably change the annual average daily dose, or the associated hazard indices.
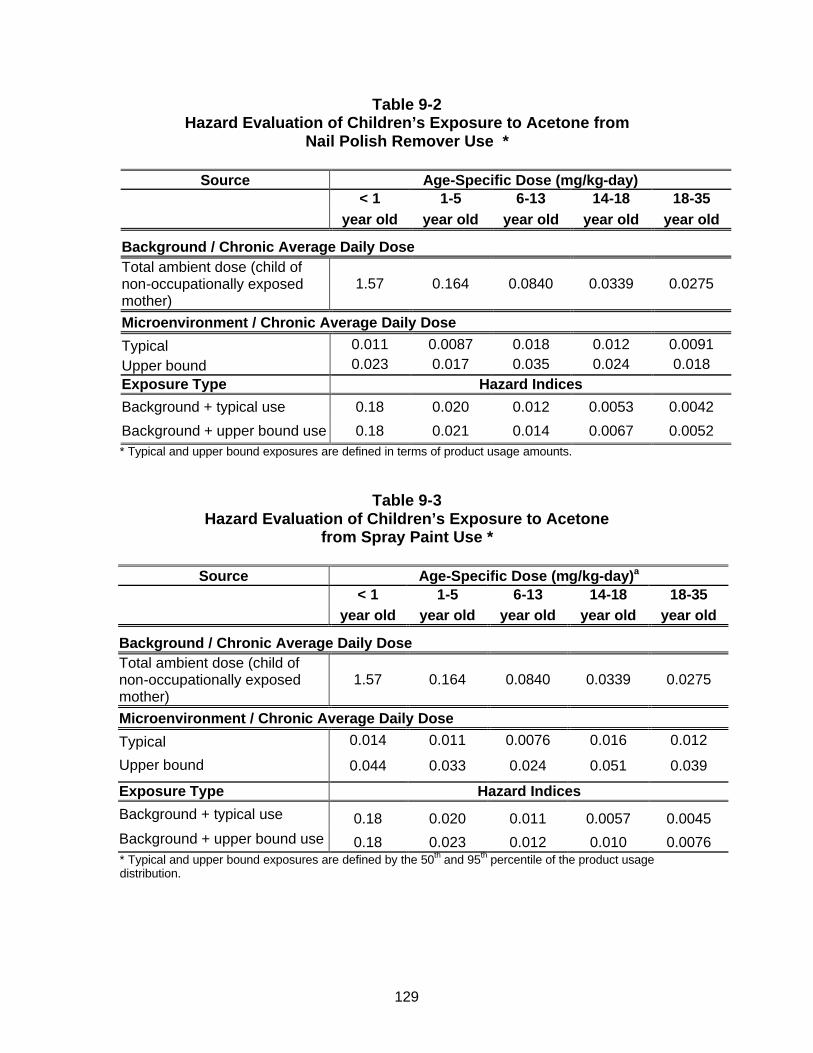
129
Table 9-2 Hazard Evaluation of Children’s Exposure to Acetone from
Nail Polish Remover Use *
Source Age-Specific Dose (mg/kg-day) < 1 1-5 6-13 14-18 18-35
year old year old year old year old year old
Background / Chronic Average Daily Dose Total ambient dose (child of non-occupationally exposed mother)
1.57 0.164 0.0840 0.0339 0.0275
Microenvironment / Chronic Average Daily Dose
Typical 0.011 0.0087 0.018 0.012 0.0091 Upper bound 0.023 0.017 0.035 0.024 0.018 Exposure Type Hazard Indices
Background + typical use 0.18 0.020 0.012 0.0053 0.0042
Background + upper bound use 0.18 0.021 0.014 0.0067 0.0052 * Typical and upper bound exposures are defined in terms of product usage amounts.
Table 9-3 Hazard Evaluation of Children’s Exposure to Acetone
from Spray Paint Use *
Source Age-Specific Dose (mg/kg-day)a < 1 1-5 6-13 14-18 18-35
year old year old year old year old year old
Background / Chronic Average Daily Dose Total ambient dose (child of non-occupationally exposed mother)
1.57 0.164 0.0840 0.0339 0.0275
Microenvironment / Chronic Average Daily Dose
Typical 0.014 0.011 0.0076 0.016 0.012
Upper bound 0.044 0.033 0.024 0.051 0.039
Exposure Type Hazard Indices
Background + typical use 0.18 0.020 0.011 0.0057 0.0045 Background + upper bound use 0.18 0.023 0.012 0.010 0.0076 * Typical and upper bound exposures are defined by the 50th and 95th percentile of the product usage distribution.
130
Table 9-4 Hazard Evaluation of Children’s Exposure to Acetone from Spot Remover Use *
Source Age-Specific Dose (mg/kg-day)a
< 1 1-5 6-13 14-18 18-35 year old year old year old year old year old
Background / Chronic Average Daily Dose Total ambient dose (non-occupationally exposed mother) 1.57 0.164 0.0840 0.0339 0.0275
Microenvironment / Chronic Average Daily Dose
Typical 0.025 0.019 0.014 0.030 0.023
Upper bound 0.13 0.10 0.072 0.16 0.12
Exposure Type Hazard Indices
Background + typical use 0.18 0.021 0.011 0.0073 0.0058
Background + upper bound use 0.19 0.030 0.018 0.022 0.017 * Typical and upper bound exposures are defined by the 50th and 95th percentiles of the product usage distribution.
Table 9-5 Hazard Evaluation of Children’s Exposure to Acetone from Removal of Nail Tips *
Source Age-Specific Dose (mg/kg-day)a
< 1 1-5 6-13 14-18 18-35 year old year old year old year old year old
Background / Chronic Average Daily Dose Total ambient dose non-occupationally exposed mother 1.57 0.164 0.0840 0.0339 0.0275
Microenvironment / Chronic Average Daily Dose
Typical 0.0058 0.0044 0.0032 0.021 0.018
Upper bound 0.0086 0.0066 0.0048 0.028 0.024
Exposure Type Hazard Indices
Background + typical use 0.18 0.019 0.010 0.0063 0.0052
Background + upper bound use 0.18 0.020 0.010 0.0071 0.0059 * Typical and upper bound exposures are defined in terms of time spent performing the nail tip removal. Single day exposures from use of each of the consumer products have not been aggregated for the following reasons:
• Two of the scenarios – nail polish remover and nail tip removal are mutually exclusive in that they would not be conducted on the same day. The reason for this is that the nail polish is not removed before the nail tip. In fact, the nail tip is removed all at once eliminating the need to remove the polish first.
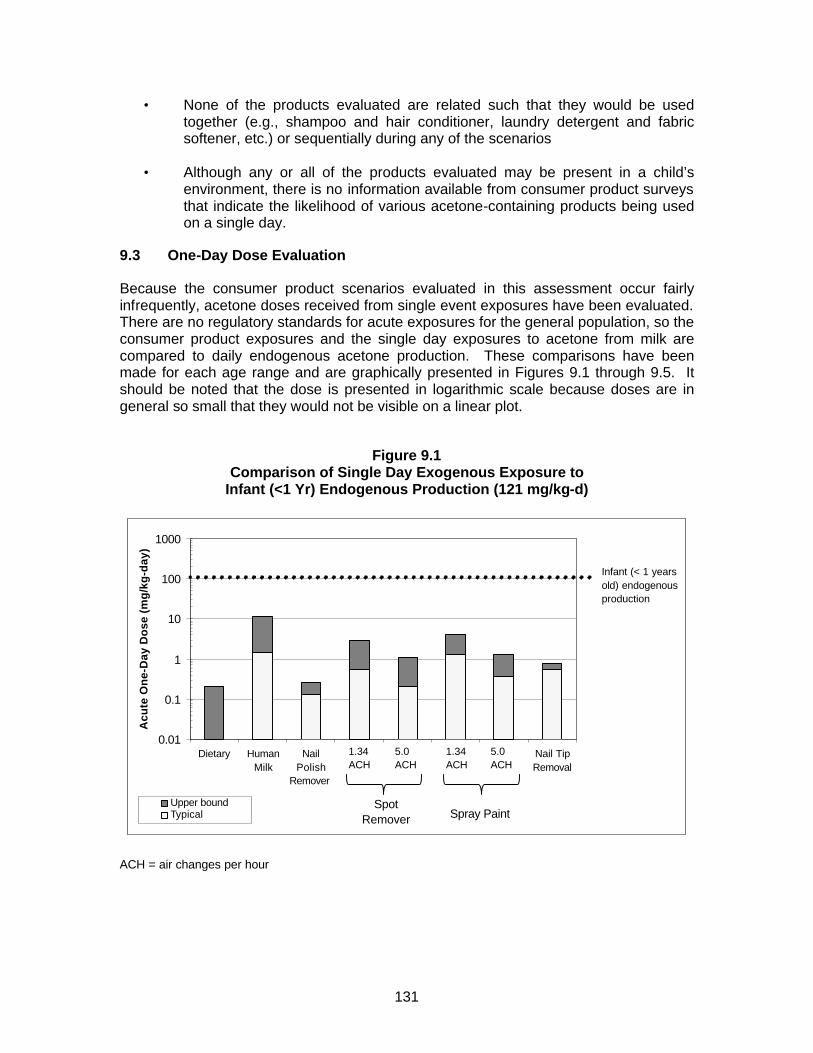
131
• None of the products evaluated are related such that they would be used together (e.g., shampoo and hair conditioner, laundry detergent and fabric softener, etc.) or sequentially during any of the scenarios
• Although any or all of the products evaluated may be present in a child’s environment, there is no information available from consumer product surveys that indicate the likelihood of various acetone-containing products being used on a single day.
9.3 One-Day Dose Evaluation
Because the consumer product scenarios evaluated in this assessment occur fairly infrequently, acetone doses received from single event exposures have been evaluated. There are no regulatory standards for acute exposures for the general population, so the consumer product exposures and the single day exposures to acetone from milk are compared to daily endogenous acetone production. These comparisons have been made for each age range and are graphically presented in Figures 9.1 through 9.5. It should be noted that the dose is presented in logarithmic scale because doses are in general so small that they would not be visible on a linear plot.
Figure 9.1
Comparison of Single Day Exogenous Exposure to Infant (<1 Yr) Endogenous Production (121 mg/kg-d)
0.01
0.1
1
10
100
1000
Dietary HumanMilk
NailPolish
Remover
SpotRemover
(1.34)
SpotRemover
(5.0)
SprayPaint(1.34)
SprayPaint(5.0)
Nail TipRemoval
Acu
te O
ne-
Day
Do
se (
mg
/kg
-day
)
Upper bound Typical
Infant (< 1 years old) endogenous production
SpotRemover Spray Paint
1.34 ACH
5.0 ACH
1.34 ACH
5.0 ACH
ACH = air changes per hour

132
Figure 9.2 Comparison of Single Day Exogenous Exposure to 1-5 Year old Endogenous Production (94 mg/kg-d)
0.001
0.01
0.1
1
10
100
Dietary NailPolish
Remover
SpotRemover
(1.34)
SpotRemover
(5.0)
SprayPaint(1.34)
SprayPaint(5.0)
Nail TipRemoval
Acu
te O
ne-
Day
Do
se (
mg
/kg
-day
)
Upper boundTypical
Child (1 - 5 years old) endogenous production
SpotRemover
1.34 ACH
5.0ACH
Spray Paint
1.34 ACH
5.0 ACH
ACH = air changes per hour
Figure 9.3 Comparison of Single Day Exogenous Exposure to 6-13 Year old Endogenous Production (72 mg/kg-d)
0.001
0.01
0.1
1
10
100
Dietary Nail PolishRemover
SpotRemover
(1.34)
SpotRemover
(5.0)
SprayPaint(1.34)
SprayPaint (5.0)
Nail TipRemoval
Acu
te O
ne-
Day
Do
se (
mg
/kg
-day
)
Upper boundTypical
Child (6 - 13 years old) endogenous production
SpotRemover
1.34ACH
5.0 ACH
Spray Paint
1.34 ACH
5.0 ACH
ACH = air changes per hour
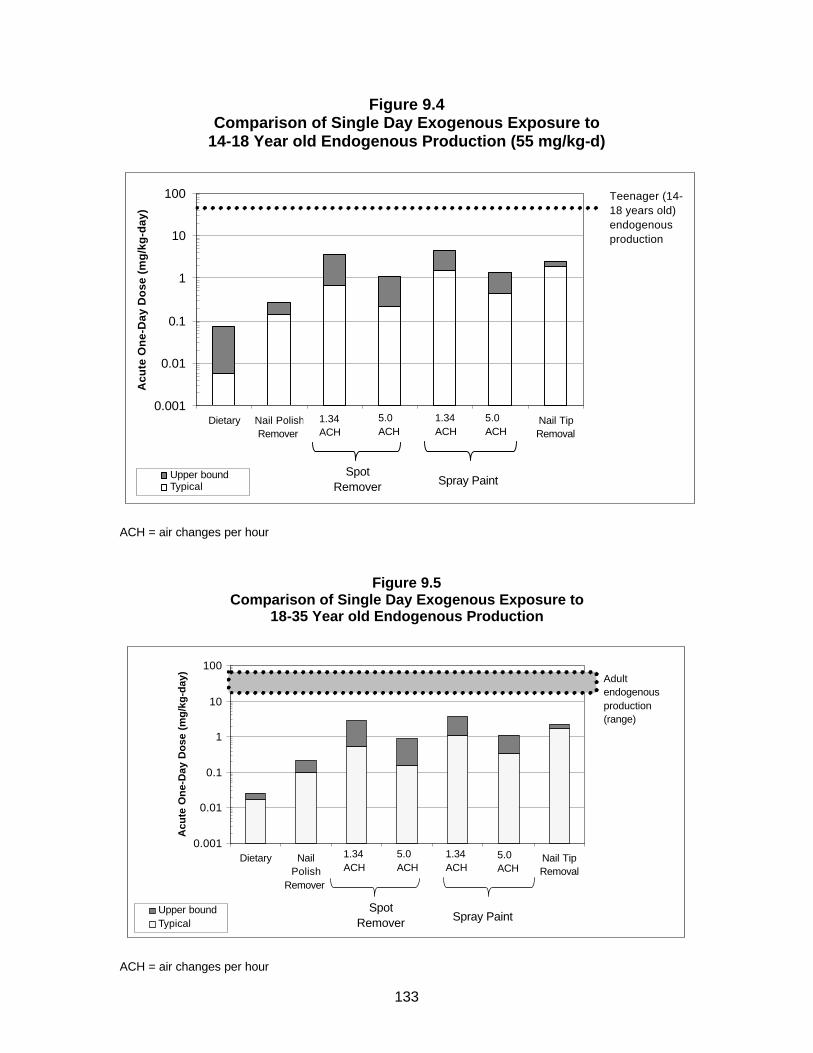
133
Figure 9.4 Comparison of Single Day Exogenous Exposure to
14-18 Year old Endogenous Production (55 mg/kg-d)
0.001
0.01
0.1
1
10
100
Dietary Nail PolishRemover
SpotRemover
(1.34)
SpotRemover
(5.0)
SprayPaint(1.34)
SprayPaint (5.0)
Nail TipRemoval
Acu
te O
ne-
Day
Do
se (
mg
/kg
-day
)
Upper boundTypical
Teenager (14-18 years old) endogenous production
SpotRemover
1.34 ACH
5.0 ACH
Spray Paint
1.34 ACH
5.0 ACH
ACH = air changes per hour
Figure 9.5 Comparison of Single Day Exogenous Exposure to
18-35 Year old Endogenous Production
0.001
0.01
0.1
1
10
100
Dietary NailPolish
Remover
SpotRemover
(1.34)
SpotRemover
(5.0)
SprayPaint(1.34)
SprayPaint(5.0)
Nail TipRemoval
Acu
te O
ne-
Day
Do
se (
mg
/kg
-day
)
Upper boundTypical
Adult endogenous production (range)
SpotRemover
1.34 ACH
5.0 ACH
Spray Paint
1.34 ACH
5.0 ACH
ACH = air changes per hour
134
As can be seen from these figures, the single day exposures received from typical exogenous acetone exposure in the diet or from the use of consumer products in the home are 1 to 3 orders of magnitude lower than endogenous doses, and upper bound exogenous doses are 1 to 2 orders of magnitude lower than endogenous doses. Thus, single day exposure to exogenous acetone from ambient and or microenvironment exposures will not substantially change the endogenous levels.
9.4 Short Term Exposure Concentrations
In addition to single day dose analysis, short-term exposure concentrations to which children may be exposed during use of consumer products can be assessed. To do so, time weighted air concentrations for two exposure durations (1-hour and 8-hours) were calculated and these values compared to the Draft Acute Exposure Guideline Levels (AEGLs) for acetone (USEPA, 2003). AEGLs represent threshold exposure limits for the general public and are applicable to emergency periods ranging from 10 minutes to 8-hours.
Three AEGL levels are developed for the various time periods and are differentiated by varying degrees of severity of toxic effects. EPA believes that the recommended exposure levels are applicable to the general population, including infants and children, and other individuals who may be sensitive or susceptible. The short-term acetone exposure concentrations have been compared to the draft AEGL-1 values for acetone. The AEGL-1 is the airborne concentration of a substance above which it is predicted that the general population, including susceptible individuals, could experience notable discomfort, irritation, or certain asymptomatic, non-sensory effects. However, the effects are not disabling and are transient and reversible upon cessation of exposure. The AEGL-1 value for acetone is 200 ppm for all durations ranging from 10 minutes to 8-hours.
Table 9-6 presents the typical and upper bound 1-hr and 8-hr TWA concentrations for the spray paint and spot remover scenarios.
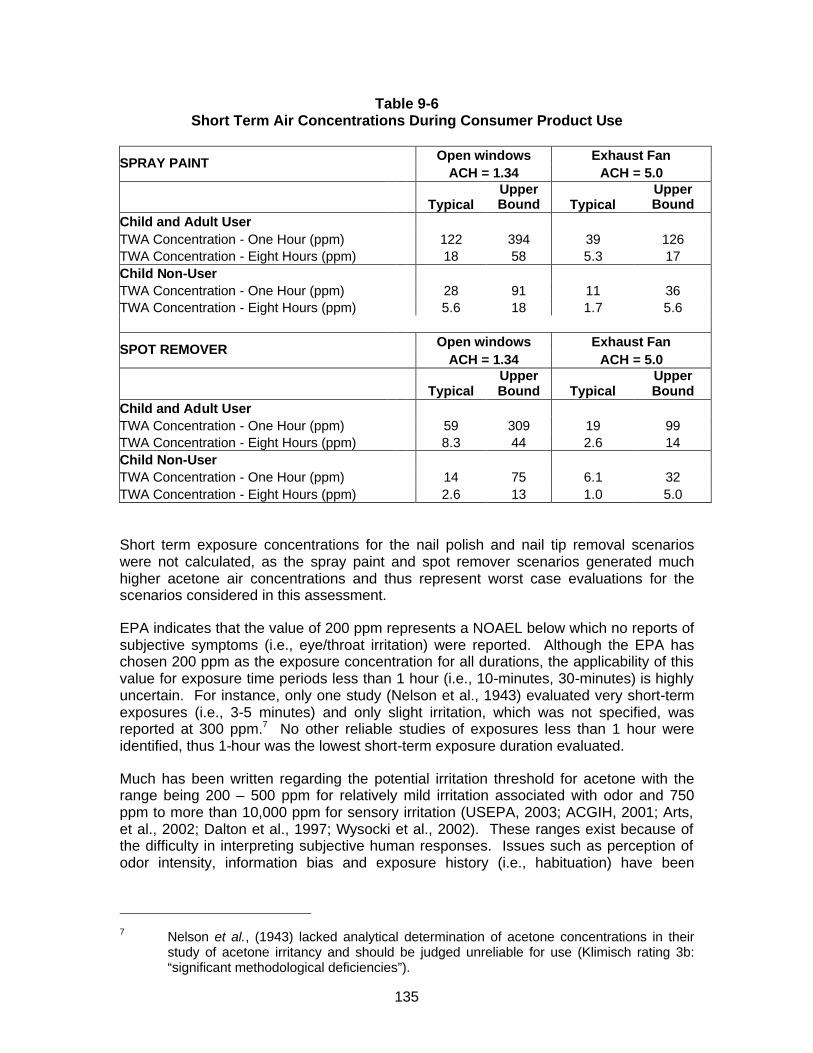
135
Table 9-6 Short Term Air Concentrations During Consumer Product Use
Open windows Exhaust Fan SPRAY PAINT
ACH = 1.34 ACH = 5.0
Typical Upper Bound Typical
Upper Bound
Child and Adult User TWA Concentration - One Hour (ppm) 122 394 39 126 TWA Concentration - Eight Hours (ppm) 18 58 5.3 17 Child Non-User TWA Concentration - One Hour (ppm) 28 91 11 36 TWA Concentration - Eight Hours (ppm) 5.6 18 1.7 5.6
Open windows Exhaust Fan SPOT REMOVER ACH = 1.34 ACH = 5.0
Typical Upper Bound Typical
Upper Bound
Child and Adult User TWA Concentration - One Hour (ppm) 59 309 19 99 TWA Concentration - Eight Hours (ppm) 8.3 44 2.6 14 Child Non-User TWA Concentration - One Hour (ppm) 14 75 6.1 32 TWA Concentration - Eight Hours (ppm) 2.6 13 1.0 5.0 Short term exposure concentrations for the nail polish and nail tip removal scenarios were not calculated, as the spray paint and spot remover scenarios generated much higher acetone air concentrations and thus represent worst case evaluations for the scenarios considered in this assessment.
EPA indicates that the value of 200 ppm represents a NOAEL below which no reports of subjective symptoms (i.e., eye/throat irritation) were reported. Although the EPA has chosen 200 ppm as the exposure concentration for all durations, the applicability of this value for exposure time periods less than 1 hour (i.e., 10-minutes, 30-minutes) is highly uncertain. For instance, only one study (Nelson et al., 1943) evaluated very short-term exposures (i.e., 3-5 minutes) and only slight irritation, which was not specified, was reported at 300 ppm.7 No other reliable studies of exposures less than 1 hour were identified, thus 1-hour was the lowest short-term exposure duration evaluated.
Much has been written regarding the potential irritation threshold for acetone with the range being 200 – 500 ppm for relatively mild irritation associated with odor and 750 ppm to more than 10,000 ppm for sensory irritation (USEPA, 2003; ACGIH, 2001; Arts, et al., 2002; Dalton et al., 1997; Wysocki et al., 2002). These ranges exist because of the difficulty in interpreting subjective human responses. Issues such as perception of odor intensity, information bias and exposure history (i.e., habituation) have been
7 Nelson et al., (1943) lacked analytical determination of acetone concentrations in their
study of acetone irritancy and should be judged unreliable for use (Klimisch rating 3b: “significant methodological deficiencies”).
136
determined to be confounding factors in the reporting of irritation effects for acetone concentrations below 1000 ppm (Arts et al., 2002).
Arts et al. conducted a critical review of published studies, which revealed that the odor detection threshold ranges from about 20 to 400 ppm and that loss of sensitivity due to adaptation to acetone odor could occur. Further, the authors conclude that the true sensory irritation threshold of acetone lies between 10,000 and 40,000 ppm. Wysocki et al (2002) used lateralization techniques to measure objective nasal sensory irritation response and concluded that acetone is a weak sensory irritant with irritation thresholds exceeding 15,000 ppm of acetone for non-occupationally exposed subjects. Again, the researchers concluded that odor adaptation has a significant influence in the irritation thresholds reported.
ACGIH (2001) recommends an 8-hour TLV for acetone of 500 ppm to protect against sensory irritation; while this value is intended for workers, it is not evident that the general population would have strong or pronounced sensory irritation from exposures between the proposed AEGL-1 value of 200 ppm and the TLV of 500 ppm. When removing acetone from the Toxics Release Inventory (see section 3.3), EPA considered potential acute effects on the general population and stated, “Acetone can cause eye, nose and throat irritation at 500 to 1,000 ppm (1,188 to 2,376 mg/m3), and acute CNS depression at concentrations in excess of 10,000 ppm.” In any event, as already noted, effects from exposures in this range would not be disabling and would be transient and quickly reversible upon cessation of exposure.
As can be seen from Table 9-6, the only instances in which the AEGL-1 for acetone may be exceeded are the 1-hr TWAs predicted for the upper bound exposure of the spray paint and spot remover users when mechanical ventilation is not employed. Thus, under typical exposure conditions and when using adequate ventilation under upper bound use conditions, acetone air concentrations are expected to be below levels at which slight irritation symptoms may occur, and well below levels at which more significant irritation would be expected.
9.5 Potential for Unique Susceptibility of Children to Acetone Exposure
The oral RfD and inhalation RfC derived by Gentry et al., like similar values derived by EPA, are intended to represent exposures that may be continued for a lifetime for the general population, including potentially susceptible subgroups such as children, without appreciable health risks. In fact, the RfD and RfC derived by Gentry et al. are based on the inhalation developmental toxicity study of acetone by Mast et al., (1988), so that the values derived are also protective of the embryo-fetus. Comparisons based on these values therefore should be protective of children (both unborn and post-partum) as well as other subpopulations.
Available data do not indicate that children are more susceptible to acetone exposures than adults. For example, the literature includes examples of acute acetone poisoning in infants followed by full recovery (Gamis and Wasserman, 1988; Knapp et al., 1997). The symptoms observed in these children as a result of acute acetone exposures, at doses either comparable to or higher than the dose for the acute poisonings in adults, were similar to those observed in adults. See discussion in section 7.12. Additionally, as described in section 7.12, a ketogenic diet has been used effectively to treat children with refractory epilepsy with no apparent ill effects. Acetone concentrations in the breath of these children are more than 100-fold greater than levels in the breath of untreated

137
children, indicating that blood levels have been raised significantly without adverse consequences. This clinical experience indicates children do not have any unique sensitivity to acetone exposure.
Further, because of their higher energy requirements, children have higher endogenous acetone production than most adults. As described in section 8, the younger the child, the higher the expected endogenous production. See Table 8-4. Potential exposures modeled in this assessment would have little or no impact on acetone blood levels in children. The highest estimated exogenous exposures for children identified in this assessment are associated with breast feeding by an occupationally-exposed mother, but even these exposures represent less than 10 percent of normal endogenous production. Further, all of these exposures are small by comparison to the exposures associated with the ketogenic diet described in the preceding paragraph.
In summary, available data indicate children are not uniquely susceptible to acetone exposure. Experience using a ketogenic diet to treat epileptic children without apparent adverse effect provides strong evidence to the contrary.
9.6 Occupational Maternal Exposures
It should be noted that a HI for the maternal dose received from occupational exposure has not been calculated. This is because occupational risk is not evaluated using the hazard index – reference dose approach. Occupational exposure levels are established primarily on human data and the TLV for acetone was established using human studies of workers exposed via inhalation (ACGIH, 2001). Exposures below these levels are considered safe for nearly all workers exposed daily. Further, as presented on Table 8-50, exposure at the TLV would result in an average daily exogenous dose of 22 mg/kg-day, which falls within the normal range of endogenous production (i.e., 20-72 mg/kg-day) and is less than an adult would produce by simply fasting (See Table 8-2). Therefore, occupational exposure to prospective mothers in the range of the TLV is not indicative of a health risk. For reasons explained in Section 7 (Hazard Assessment), acetone is not believed to pose a developmental or reproductive hazard. Information on maternal occupational exposures has been used to estimate an infant’s exposure to acetone through human milk when the mother is occupationally exposed.
9.7 Discussion of Uncertainties
Uncertainties in the exposure estimates are described in Section 8. Uncertainties in the derivation of the RfD and RfC values used for this assessment are described in Gentry et al. (2003, in press). Neither the hazard assessment nor the exposure assessment is an exact science, but conservative, (i.e., health protective) assumptions have been employed in each area, such that margins of safety are more likely to be understated than overstated. Because exposures in all measured or modeled scenarios are below the relevant health benchmarks, there is no need to reduce any of the uncertainties inherent in the hazard or exposure assessments, as further discussed in Section 10.
9.8 Conclusions
The information in this risk assessment and the underlying hazard assessment and exposure assessment demonstrates the following:

138
• Endogenously produced acetone in children is the dominant source of acetone exposure, resulting in more than 90% of the total acetone exposure;
• Dietary exposure from acetone’s natural presence in many food items is likely the second largest source of acetone exposure for all children except those nursing from occupationally exposed mothers. For the latter group, acetone from mother’s milk is the second largest source of acetone exposure, although even that exposure represents only 10 percent of typical endogenous production, and only about 3 percent of the upper bound estimate of normal endogenous production in infants;
• Very low acetone exposures are received from the ambient sources of exposure including ambient air, water, and food, and aggregated doses resulted in less than 1% of the RfD of 8.7 mg/kg-day derived by Gentry et al.;
• Chronic inhalation exposures from acetone-containing consumer products that are used in the presence of or by children do not result in exceedances of the RfD of 8.7 mg/kg-day derived by Gentry et al., including when combined with background ambient doses, and single day doses from use of these products are one to two orders of magnitude less than the daily endogenous levels;
• EPA’s RfD for acetone of 0.9 mg/kg-day would be exceeded by a breast-feeding infant of a non-occupationally exposed mother with no exogenous exposure at all other than the breast milk pathway. This comparison calls into question the scientific reasonableness of an RfD value for acetone that is derived from standard methodology without adequate consideration of normal endogenous production.
• Short term air concentrations of acetone to which children may be exposed during use of various consumer products are not expected to exceed the draft AEGL-1 value of 200 ppm proposed by the USEPA except under conditions where adequate ventilation is not used; and
• The quantitative risk characterization indicates that reasonably anticipated children’s exposures to acetone from the ambient background environment and consumer products are unlikely to pose significant health risks.
139
10. Data Needs Assessment
10.1 Hazard Information
All Tier 1, Tier 2 and Tier 3 studies specified in the VCCEP announcement have been conducted for acetone or its metabolic precursor, isopropanol. Thus, additional studies of acetone are not needed to fulfill the goals of the VCCEP. Moreover, even beyond the toxicity studies specified in the VCCEP announcement, there is a wealth of information concerning the potential health effects from exposures to acetone. The SIAR concludes that acetone has been “well-studied” and is a “low priority” for further work. The VCCEP sponsors of acetone agree. No further testing of acetone is warranted at this time. Specifically, none of the toxicity studies identified in the VCCEP announcement are necessary for acetone.
10.2 Exposure Information
For a compound like acetone, additional exposure assessment work is always possible. The VCCEP sponsors believe, however, that the information presented in this document is adequate to demonstrate that reasonably anticipated exposures to acetone are not likely to present significant health risks to children. Accordingly, the VCCEP sponsors believe additional exposure assessment work also should be a low priority, and is not necessary to meet the objectives of the VCCEP program.
140
TABLE OF REFERENCES
*Asterik denotes key references.
Abshagen, U. & Reitbrock, N. (1969) Elimination of 2-propanol in dogs and rats. Naunyn-Schmiedebergs Arch. Pharmakol. exp. Pathol., 264: 110-118 (in German).
Agency for Toxic Substances and Disease Registry (ATSDR) (1994). Toxicological Profile and ToxFAQ for Acetone.
Albertini, S. (1991). Reevaluation of the 9 compounds reported conclusive positive in yeast Saccharomyces cerevisiae aneuploidy test systems by the gene-tox program using strain D61. M of Saccharomyces cerevisiae. Mutat. Res. 260, 165-180.
Amacher D/E., Paillet S.C., Turner G.N., et al. 1980. Point mutations at the thymidine kinase locus in L5178Y mouse lymphoma cells. II. Test validation and interpretation. Mutat Res 72:447-474.
American Conference of Governmental Industrial Hygienists (ACGIH) (1990). In: Threshold Limit Values and Biological Exposure Indices for 1989-1990 p. 11. American Conference of Governmental Industrial Hygienists, Cincinnati, OH.
American Conference of Governmental Industrial Hygienists (ACGIH) (2001). Documentation of the TLV for Acetone. ACGIH Cincinnati, Ohio. 2003.
American Conference of Governmental Industrial Hygienists (ACGIH) (2003). Threshold Limit Values 2003 for Chemical Substances and Physical Agents & Biological Exposure Indices. American Conference of Governmental Industrial Hygienists, Cincinnati, Ohio.
Argilés, J. M. (1986). Has acetone a role in the conversion of fat to carbohydrate in mammals? Trends Biochem. Sci. 11, 61-63.
Arts, JH, Moket J, van Gemer LJ, Emmen HH, Lammers JH, Marquart J, Woutersen RA, Feron VJ. (2002). An analysis of human response to the irritancy of acetone vapors. Crit Rev Toxicol. Jan; 32(1): 43:66.
Ashley et al. (1994) “Blood concentrations of volatile organic compounds in a nonoccupationally exposed US population and in groups with suspected exposure,” Clin Chemistry, 40(7)
ATSDR (1994). Toxicological Profile For Acetone. U.S. Department of Health and Human Services Agency for Toxic Substances and Disease Registry, TP-93/01.
Axelsson, G., Lutz, C., and Rylander, R. (1984). Exposure to solvents and outcome of pregnancy in university laboratory employees. Br., J. Ind. Med. 41,305-312.
Barale, R. et al. (1983). The induction of forward gene mutation and gene conversion in yeasts by treatment with cyclophosphamide in vitro and in vivo. Mutat. Res. 111, 295-312.
Basler, A. (1986). Aneuploidy-inducing chemicals in yeast evaluated by the micronucleus test. Mutat. Res. 174,11-13.

141
*Bates, H. K., McKee, R. H., Bieler, G. S., Gardiner, T.H., Gill, M. W., Strother, D. E. and Masten, L. W. (1994). Developmental neurotoxicity evaluation of orally administered isopropanol in rats. Fundam. Appl. Toxicol., 22:152-158.
Bergman, E.N., Sellers, A.F. and Spurrell, F.A. (1960). Metabolism of C14-labeled acetone, acetate and palmitate in fasted pregnant and nonpregnant guinea pigs. Am. J. Physiol. 198, 1087-1093.
*Bevan, C., Tyler, T. R., Gardiner, T. H., Kapp, R. W., Jr., Andrews, L. and Beyer, B. K. (1995). Two-generation reproductive toxicity study with isopropanol in rats. J. Appl. Toxicol. 15(2):117--123.
BIBRA (British Industrial Biological Research Association) (1986a). Report 0570/3/86.
BIBRA (British Industrial Biological Research Association) (1986b). Report 0570/2/86.
Boatman, R. J., Perry, L. G., and Fiorica, L. A. (1995). Dermal absorption and pharmacokinetics of isopropanol in the male and female F-344 rat. TX-95-103. Chemical Manufacturers Association, Washington, D.C. Prepared for Toxicological Sciences Laboratory, Health and Environment Laboratories, Eastman Kodak Company, Rochester, N. Y. October 12, 1995.
Boorman, G. A., Chapin, R. E., and Mitsumori, K. (1990). Chapter 24. Testis and Epididymis. In: Pathology of the Fischer Rat, (Boorman, R. A., Eustis, S. L., Elwell, M. R., Montgomery, C. A., Jr., and Mackenzie, W. F., eds.), pp. 405-418, Academic Press, CA.
Brentwood Beauty Labs International, Inc. (2002). Beauty Secrets Pure Acetone Manicurist Solvent, Salon Formula. Warning Label. Brentwood Beauty Labs International, Inc. Hillside, Illinois.
Brown et al. (1994) “Concentrations of Volatile Organic Compounds in Indoor Air – A Review,” Indoor Air, 4: 123-134.
Bruckner, J. V., and Peterson, R. G. (1978). Effect of repeated exposure of mice and rats to concentrated toluene and acetone vapors. Toxicol. Appl. Pharmacol., 45: 359.
*Burleigh-Flayer, H. D. and Hurley, J. M. (1994a). Isopropanol: Ninety-day vapor inhalation neurotoxicity study in female Fischer 344 rats. Bushy Run Research Center, Export, PA. Laboratory Project ID: 93N1245. Report to CMA.
*Burleigh-Flayer, H. D. and Benson, C .L. (1994b). Isopropanol vapor inhalation oncogenicity study in Fisher 344 rats. Bushy Run Research Center, Project ID 91N0133, Report to CMA.
*Burleigh-Flayer, H. D., Gill, M. W., Strother, D. E., Masten, L. W., McKee, R. H., Tyler, T. R. and Gardiner, T. (1994a). Isopropanol 13-week vapor inhalation study in rats and mice with neurotoxicity evaluation in rats. Fundam. Appl. Toxicol., 23:421-428.
California Air Resources Board (CalEPA), (2000). The 1997 Consumer and Commercial Products Survey. Dated March 21, 2000.

142
Casazza J. P., Felver M. E. and Veech , R. L. (1984). The metabolism of acetone in the rat. Biol Chem 259:231-236.
Celanese, (2003). Personal correspondence between Bill Thomas of Celanese Acetate and Julie Panko, of AMEC Earth & Environmental Inc.
Chapin RE, Phelps JL, Schwetz BA, Yang RS. (1989). Toxicology studies of a chemical mixture of 25 groundwater contaminants. III. Male reproduction study in B6C3F1 mice. Fundam Appl Toxicol. 13(3):388-98.
Charbonneau, M. et al. (1988). Assessment of the minimal effective dose of acetone for potentiation of the hepatotoxicity induced by trichloroethylene-carbon tetrachloride mixtures. Fundam. Appi. Toxicol. 10, 431-438.
Charbonneau, M., Tuchweber, B. and Plaa, G. L. (1986). Acetone potentiation of chronic liver injury induced by repetitive administration of carbon tetrachloride. Hepatology. 6, 694-700.
Chemical Data Inc., Monthly Petrochemical & Plastics Analysis, April 2003.
Chen, T. H., et al., (1984). Inhibition of metabolic cooperation in chinese hamster cells by various organic solvents and simple compounds. Cell Biol. Toxicol. 1, 155-171.
Cheng, S. J. et al., (1981). Promoting effect of Roussin's red identified in pickled vegetables from linxian china. Carcinogenesis (London)2, 313-319.
*Christoph (1997). “Subchronic Operant Behavior Study of Acetone by Inhalation in Rats,” Haskell Laboratory Medical Research Project No. 10078-001.
Clegg, E. D., Cook, J.C., Chapin, R.E., Foster, P.M.D., and Daston, G.P. (1997). Leydig cell hyperplasia and adenoma formation: Mechanisms and relevance to humans. Reproductive Toxicology, 11(1):107-121.
*Clewell, H. J, et al. (2001). Development of a Physiologically Based Pharmacokinetic Model of Isopropanol and Its Metabolite Acetone. Tox. Sciences. 63:160-172.
Clothier, R. H. et al. (1987). Comparison of the in vitro cytotoxicities and acute in vivo toxicities of 59 chemicals. Mol. Toxicol. 1, 571-577.
Conkle, J. P., Camp, B. J. and Welch, B. E. (1975). Trace composition of human respiratory gas. Arch. Environ. Health 30, 290-295.
Cox, G. E., Bailey, D. E., and Morgareidge, K. (1975). Toxicity studies in rats with 2-butanol including growth, reproduction, and teratologic observations. Food and Drug Research Laboratories, Inc. Report.
Dalgaard, M; Ostergaard, G; Lam, H.R.; Hansen, E. V.; Ladefoged, O. (1999). Toxicity Study of Di(2-Ethylhexyl)phthalate (DEHP) in Combination with Acetone in Rats. Pharmacol.& Tox. 86: 92-100.

143
Dalton P, Wysocki CJ, Brody MJ, Lawley HJ. (1997). Perceived odor, irritation, and health symptoms following short-term exposure to acetone. American Journal of Industrial Medicine, May 31(5):558-69.
De Ceaurriz, J. C. et al. (1981). Sensory irritation caused by various industrial airborne chemicals. Toxicol. Lett. 9,137-143.
DeFlora, S., Zanacchi, P., Camoirano, A., Bennicelli, C., and Badolati, G. S. (1984). Genotoxic activity and potency of 135 compounds in the Ames reversion test and in a bacterial DNA-repair test. Mutat. Res. 133,161-198.
DeMarini, D. M., et al. (1991). Compatibility of organic solvents with the microscreen prophage-induction assay: Solvent-mutagen interactions. Mutat. Res. 263, 107-113.
Dewalle, FB and Chian, ES. (1981). Detection of trace organics in well water near a solid waste landfill. J. Am. Water Works Assoc. 73: 206-211.
Dick, R. B., Brown, .W. D., Setzer, J. V., et al. (1988). Effects of short duration exposures to acetone and methyl ethyl ketone. Toxicol Lett 43:31-49.
Dick, R. B., Setzer J. V., Taylor, B. J., et al. (1989). Neurobehavioral effects of short duration exposures to acetone and methyl ethyl ketone. Br J Ind Med 46: 1 1 l- 121.
*Dietz, D. D. (1990). Toxicity studies of acetone in F3441N rats and B6C3F1 mice (drinking water studies). NTP Tox 3, pp. 1-38. USDHHS, National Toxicology Program, Research Triangle Park N.C.
*Dietz, D. D., Leininger, J. R., Rauckman, E. J., Thompson; M. B., Chapin, R. E., Morrissey, R. L., and Levin, B.S. (1991). Toxicity studies of acetone administered in the drinking water of rodents. Fund. App. Toxicol. 17: 347-360.
DiMario, FJ and Holland, JH. (2002). The ketogenic diet: a review of the experience at Connecticut Children’s Medical Center. Pediatric Neurology, 26(4): 288-292.
DiVincenzo ,G. D., Yanno F. J., Astill B. D. (1976). Exposure of man and dog to low concentrations of acetone vapor. Am Ind Hyg Assoc J 34:329-336.
Duffield T. (2000). Subclinical ketosis in lactating dairy cattle. Vet Clin North Am Equine Pract 2000 Jul;16(2):231-53.
Federal Register, (2000). Voluntary Children’s Chemical Evaluation Program 65 FR 81700. December 26,2000.
Federal Register, (1995a). Acetone: Toxic Chemical Release Reporting; Chemical Right to Know 60 FR31643. June 16, 1995.
Federal Register, (1995b). Acetone: Revision to Definition of Volatile Organic Carbon – Exclusion of Acetone 60FR 31634. June 16, 1995.
Fisher P. (1951). The role of the ketone bodies in the etiology of diabetic coma. Am J Med Sci 221:384-397.
144
Fiskesjö, G., (1981). Benzo(a)pyrene and N-methyl-N-nitroguanidine in the Allium Test. Hereditas 95, 155-162.
Flury, F. and Wirth, W. (1934). Zur Toxikologie der Lösungsmittel (Verschiedene Ester, Acetone, Methylalkohol). Arch. Gewerbepathol. Gewerhyg. 5, 1.
Fowles, J and Bates, M. (2000). The Chemical Constituents in Cigarettes and Cigarette Smoke: Priorities in Harm Reduction. Report to the New Zealand Ministry of Health.
Freeman, A. E., et al., (1973). Transformation of cell cultures as an indication of the carcinogenic potential of chemicals. J. Natl. Cancer Inst. 51, 799-808.
Freeman, J. J. and Hayes, E. P. (1985). Acetone potentiation of acute acetonitrile toxicity in rats. J. Toxicol. Environ. Health 15, 609-621.
Friedrich, U. and Nass, G. (1983). Evaluation of a mutation test using S49 mouse lymphoma cells and monitoring simultaneously the induction of dexamethasone resistance, 6-thioguanine resistance and ouabain resistance. Mutat. Res. 110, 147-162.
Fujino A, Satoh T, Takebayashi T, Nakashima H, Sakurai H, Higashi T, Matumura H, Minaguchi H and Kawai T. (1992). Biological monitoring of workers exposed to acetone in acetate fibre plants. Br J Ind Med 49(9):654-7.
Gamis, A. S. and Wasserman; (1988). Acute acetone intoxication in a pediatric patient. Pediatr. Emerg. Care 4, 24-26.
Gehly, E. B. and Heidelberger, C. (1982). The induction of Ouar-mutations in nontransformable CVP3SC6 mouse fibroblasts. Carcinogenesis (London) 3, 963-967.
Gentry, P.R., Covington, T.R., Andersen, M.A. and Clewell, H.J. (2003). “Application of a Physiologically-Based Pharmacokinetic Model for Reference Dose and Reference Concentration Estimation for Acetone,” accepted for publication in the Journal of Toxicology and Environmental Health (Appendix D).
Gill, M. W., Burleigh-Flayer, H. D., Strother, D. E., Master, L. W., McKee, R. H., Tyler, T. R., and Gardiner, T.H. (1995). Isopropanol: Acute vapor inhalation neurotoxicity in rats. J. Appl. Toxicol., 15(2): 77-84.
Glatt, H., DeBalle, L., Oesch, F. (1981). Ethanol- or acetone-pretreatment of mice strongly enhances the bacterial mutagenicity of dimethylnitrosamine in assays mediated by liver subcellular fraction, but not in host-mediated assays. Carcinogenesis 2:1057-1067.
Goldberg ME, Johnson HE, Pozzani UC, et al. (1964). Effect of repeated inhalation vapors of industrial solvents on animal behavior. Am Ind Hyg Assoc J 25:369-375.
Grampella, C. et al., Health surveillance in workers exposed to acetone. (1987.) Proc. 7th Int. Symp.Occup. Health Prod. of Arti. Org. Fibres, pp. 137-141.
Haff, A. C. and Reichard, G. A. (1977). A method for estimation of acetone radioactivity and concentration in blood and urine. Biochem. Med. 18, 308-314.
145
Haggard, H.W., Greenberg, L.A. and Turner, J. M. (1944). The physiological principles governing the action of acetone together with the determination of toxicity. J. Ind. Hyg. Toxicol. 26,133-151.
Haseman, J. K. and Arnold, J. (1990). Chapter 35. Tumor Incidences in Fischer 344 Rats: NTP Historical Data. In: Pathology of the Fischer Rat., (Boorman, G. A., Eustis, S. L., Elwell, M. R., Montgomery, C. A., Jr., and MacKenzie, W .F., eds.), pp. 555-564, Academic Press, CA.
Hatch, G. G. et al. (1983). Chemical enhancement of viral transformation in Syrian hamster embryo cells by gaseous and volatile chlorinated methanes and ethanes. Cancer Res. 43, 1945-1950.
Heindel JJ, Chapin RE, George J, Gulati, DK, Fail PA, Barnes LH, Yang RS (1995). Assessment of the reproductive toxicity of a complex mixture of 25 groundwater contaminants in mice and rats. Fundam Appl Toxicol. 25(1):9-19.
Hetu C, Joly, J G. (1988). Effects of chronic acetone administration on ethanol-inducible monooxygenase activities in the rat. Biochem Pharmacol 37:421-426.
Hewitt, W. R. and Plaa, G. L. (1983). Dose-dependent modification of 1,1-dichloroethylene toxicity by acetone. Toxicol. Lett. 16, 145-152.
Hewitt, W. R. et al. (1982). Dose-response relationships in 1,3-butanediol-induced, potentiation of carbon tetrachloride toxicity. Toxicol. Appl. Pharmacol 64, 529-540.
Hewitt, W. R., et al. (1980). Acute alteration of chloroform-induced hepato- and nephrotoxicity by n-hexane, methyl n-butyl ketone, and 2,5-hexanedione. Toxicol. Appl. Pharmacol 53, 230-248.
Hift, W. and Patel, P. L. (1961). Acute acetone poisoning due to a synthetic plaster cast. S. Aft Med J. 35,246-250.
HSDB. (2002). Hazardous Substance Databank accessed at toxnet.nlm.nih.gov. National Library of Medicine.
Huhtanen P, Miettinen H and Ylinen M. (1993). Effect of increasing ruminal buyrate on milk yield and blood constituents in dairy cows fed a grass silage-based diet. J. Dairy Sci. 76(4): 1114-24.
Idota, S. (1985) [Studies on isopropanol metabolism and poisoning.] j. Nihon Univ. Med. Assoc., 44: 39-47 (in Japanese).
Ishidate, M. et al., Primary mutagenicity screening of food additives currently used in Japan. Food Chem. Toxicol. 22, 623-636 (1984).
Jerrard, D., Verdile, V., Yealy, D., Krenzelok, E. & Menegazzi, J. (1992) Serum determinations in toxic isopropanol ingestion. Am. J. Emerg. Med., 10, 200-202.
146
*Johnson, T., Mihlan, G, LaPointe, J, Fletcher, K and Capel, J. (1999). Estimation of carbon monoxide exposures and associated carboxyhemoglobin levels in Denver residents using pNEM/CO (Version 2.0).
*Johnson J, Weaver M, Mozier J, Kleindienst T, Smith D, Nero C and Ollison W. (1998). Proceedings of the Air and Waste Management Specialty Conference – Measurement of Toxic and Related Air Pollutants Conference, VIP-85. Research Triangle Park, NC. pp. 633-651. Sept. 1-3, 1998.
Kagan, E. (1924). Experimentelle Studien Über den Einfluss technisch and hygienisch wichtiger Gase, und Dämfpe auf den Organismus. XXXVI. Aceton. Arch. Hyg. 94, 41-53
*Kanada, M. et al. (1994). Neurochemical profile of effects of 28 neurotoxic chemicals on the central nervous system in rats. (1) Effects of oral administration on brain contents of biogenic amines and metabolites. Ind. Health 32, 145-164.
Kane, L. E. , Domboske, R., and Alarie, Y. (1980). Evaluation of sensory irritation from some common industrial solvents. Am. Ind. Hyg. Assoc. J. 41: 451-455.
Kezic S, Monster AC, van de Gevel IA, Kruse J, Opdam JJ and Verberk MM (2001). Dermal absorption of neat liquid solvents on brief exposures in volunteers. AIHAJ, 62(1):12-8.
Kimura, E. T., Ebert, D. M., and Dodge, P W. (1971). Acute toxicity and limits of solvent residue for sixteen organic solvents. Toxicol. Appl. Pharmacol. 19: 699-704.
Kitchin K. T., Ebron M. T. (1984). Further development of rodent who embryo culture: Solvent toxicity and water insoluble compound delivery system. Toxicology 30:45-57.
Koehler AE, Windsor E, Hill E. (1941). Acetone and acetoacetic acid studies in man. J Biol Chem 140:81 l-825.
Kossoff, EH, Pyzik, PL, McGrogan, JR, Vining, E and Freeman, JM. (2002). Efficacy of the ketogenic diet for infantile spasms. Pediatrics, 109(5): 780-783.
Kosugi K, Chandramouli V, Kumaran K, et al. (1986a). Determinants in the pathways followed by the carbons of acetone in their conversion to glucose. J Biol Chem 261:13179-13181.
Kosugi K, Scofield RF, Chandramouli V, et al. (1986b). Pathways of acetone’s metabolism in the rat. J Biol Chem 162:3952-3957.
Krasavage, W. J., O'Donoghue, J.L., and DiVincenzo, G. D., (1980). "Ketones," in Clayton, G. D. and Clayton, F. E. (Eds.), "Patty's Industrial Hygiene and Toxicology", John Wiley and Sons, Vol. IIC, 4709-4800.
Kubinski, H. Gutzke, G. E. and Kubinski, Z. O. (1981). DNA-cell-binding (DCB) assay for suspected carcinogens and mutagens. Mutat. Res. 89, 95-136.
Kumagai S & Matsunaga I (1995). Physiologically based pharmacokinetic model for acetone. Occup Environ Med, 52:344-352.
147
Kurnayeva, V. P., et al. (1986). Experimental study of combined effect of solvents and noise. J. Hyg. Epidemiol. Microbiol. Immunol. 30,49-56.
Lacouture PG, Heldreth DD, Shannon M, & Lovejoy FH (1989). The generation of acetonemia/acetonuria following ingestion of a subtoxic dose of isopropyl alcohol. Am J Emerg Med. 7(1): 38-40.
Ladefoged O, Hass U, Simonsen L. (1989). Neurophysiological and behavioral effects of combined exposure to 2,5-hexanedione and acetone or ethanol in rats. Pharmacol Toxicol 65:372-375.
Ladefoged, O., Perbellini, L., (1986). Acetone-induced changes in the toxicokinetics of 2,5-hexanedione in rabbits. Stand J Work Environ Health 122:627-629.
Laham, S., Potvin, M., & Schrader, K. (1979). Microméthode de dosage simultané de l’alcool isopropylique et de son métabolite l’acetnoe. Chémosphere, 2: 79-87.
Laham, S., Potvin, M., Schrader, K., & Marino, I. (1980). Studies on inhalation toxicity of 2-propanol. Drug Chem. Toxicol., 3: 343-360.
Lake, R. S. et al., (1978). Chemical induction of unscheduled DNA synthesis in human skin epithelial cell cultures. Cancer Res. 38, 2091-2098.
Lankas, G. R., (1979). Effect of cell growth rate and dose fractionation on chemically-induced ouabain-resistant mutations in chinese hamster V79 cells. Mutat. Res. 60, 189-196.
*Larsen, J. J; Lykkegaard, M; Ladefoged, O. (1991). Infertility in rats induced by 2,4-hexanedione in combination with acetone. Pharmacol. Tox.. 69:43-46.
Latt, S. A., Allen, J., Bloom, S. E., Carrano, A., Falke, E., Kram, D., Schneider, E., Schrack, R., Tice, R., Whitfield, B., and Wolfe, S. (1981). Sister-chromatid exchanges: A report of the gene-tox program. Mutat. Res. 87,17-62.
Lehman, A. J,. Schwerma, H., and Rickards, E. (1945). Isopropyl alcohol - Acquired tolerance in dogs, rate of disappearance from blood stream in various species, and effects on successive generation in rats. J. Pharmacol. Exp. Ther., 85:61-69.
Levey, S. et al. (1964). Studies of metabolic products in expired air II. acetone. J. Lab. Clin. Med. 63: 574-584.
Light, D.R., Dennis, M.S., Forsythe, I.J., Liu, C.-C., Green, D.W., Kratzer, D.A. & Plapp, B.V. (1992) α-Isozyme of alcohol dehydrogenase from monkey liver. J. Boil. Chem., 267, 12592-12599.
Lillehaug, J. R. and Djurhuus, R. (1982). Effect of diethylstilbestrol on the transformable mouse embryo fibroblast C3H/10T1/2C18 cells. Tumor promotion, cell growth, DNA synthesis, and ornithine decarboxylase. Carcinogenesis (London) 3, 797-799.
Logan. (1999). Environmental Transport Processes. John Wiley & Sons, Inc. New York.
148
Loveday, K.S. et al., (1990). Chromosome aberration and sister chromatid exchange tests in chinese hamster ovary cells in vitro. V: Results with 46 chemicals. Environ. Mol. Mutagen. 16, 272303.
Mashbitz, L. M., Sklianskaya, R. M. and Urieva, F. I. (1936). The relative toxicity of acetone, methylalcohol and their mixtures: II. Their action on white mice. J. Ind. Hyg. Toxicol. 18, 117-122
Mason, M.F. and Hutson, D. (1975). The range of concentrations of free acetone in the plasma and breath of diabetics and some observations on its plasma/breath ratio. In Proc. 6th Int. Conf. Alcohol, Drugs, Traffic Saf. Toronto, Canada.
*Mast, T. J., Evanoff, J.J., Rommereim, R. L., Stoney, K. H., Weigel, R. J., and Westerberg, R. B. (1988). Inhalation developmental toxicology studies: Teratology study of acetone in mice and rats. Prepared for the National Institute of Environmental Health Sciences, National Toxicology Program, Contract DE-AC-06-76RLO 1030. Pacific Northwest Laboratory, Battelle Memorial Institute.
Matsushita, T., Yoshimune, A., Inoue, T., et al. (1969b) [Experimental studies for determining the MAC value of acetone. 1. Biological reaction in the “one-day exposure” to acetone.] Sangyo Igaku 11:477-484 (Japanese)[Translation in progress]
Mayhew, D.A., and Morrow, L. D. (1988). Ninety day gavage study in albino rats using rats. U.S. Environmental Protection Agency, EPA Contract No. 68-01-7075.
McCann J. E. et al., (1975). Detection of carcinogens as mutagens in the Salmonella/microsome test: Assay of 300 chemicals. Proc. Natl. Acad. Sci. U.S.A. 72, 5135-5139.
McCarroll, N. E, Keech, B. H. and Piper, C. E. (1981). A microsuspension adaptation of the Bacillus subtilis "rec" assay. Environ. Mutagen. 3: 607-616.
McGregor, D . B. , Edward, I., Riach, C . G , Cattanach, P., Martin, R., Mitchell, A., and Capary, W. J. (1988). Studies of an S9-based metabolic activation system used in the mouse lymphoma L5178Y cell mutation assay. Mutagenesis 3,485-490.
McLaughlin, J. et al. (1963). The injection of chemicals into the yolk sac of fertile eggs prior to incubation as a toxicity test. Toxicol. Appl. Pharmacol. 5, 760-771.
McLaughlin, J. et al. (1964). Toxicity of fourteen volatile chemicals as measured by the chick embryo method. Am. Ind. Hyg. J. 25, 282-284.
Mikolajczak, P. et al., (1993). The toxic and pharmacokinetic interactions between ethanol and atone in rats. Vet. Hum. Toxicol. 35, 363 (abstr.).
Mishra, N. K., et al. (1978). Simultaneous determination of cellular mutagenesis and transformation by chemical carcinogens in Fischer rat embryo cells. J. Toxicol. Environ. Health 4, 79-91.

149
Misumi, J. and Nagano, M. (1984). Neurophysiological studies on the relation between the structural properties and neurotoxicity of aliphatic hydrocarbon compounds in rats. Br J. Ind. Med. 41, 526-532.
Monaghan, M.S., Olsen, K.M., Ackerman, G.H., Fuller, G.L., Porter, W.H., and Pappas, A.A. (1995). Measurement of serum isopropanol and the acetone metabolite by proton nuclear magnetic resonance: Application to pharmacokinetic evaluation in a simulated overdose model. Clin. Toxicol. 33, 141-149.
Morgott DA. (2001). Acetone. In: Patty’s Toxicology Fifth Edition Volume 6. Edited by E. Bingham, B. Cohrssen, and C. H. Powell. John Wiley and Sons.
Mourkides G. A., Hobbs D. C., Koeppe R. E. (1959). The metabolism of acetone-2-C14 by intact rats. J Biol Chem 234:27-30.
Murray, DM and Burmaster, DE. (1995). Residential air exchange rates in the United States: Empirical and Estimated Parametric Distributions by Season and Climatic Region. Risk Analysis, 15(4): 459-465.
*Musa-Velosa K, Rarama E, Comeau F, Curtis R and Cunnane S. (2002). Epilepsy and the ketogenic diet: assessment of ketosis in children using breath acetone. Pediatric Research, 52(3): 443-8.
Nakaaki, K. (1974). An experimental study on the effect of exposure to organic solvent vapor in human subjects. J. Sci. Labour 50, 89-96.
Nakamura, S. et al. (1987). SOS-inducing activity of chemical carcinogens and mutagens in Salmonella typhimurium TA1535/pSK1002: Examination with 151 chemicals. Mutat. Res. 192, 239-246.
Naruse, M. (1984). Effects on mice of long-term exposure to organic solvents in adhesives. Nagoya Med J. 28, 183-120.
National Toxicology Program (NTP), (1987). Cellular and Genetic Toxicology, Fiscal Year 1987 Annual Plan, NTP-87-001, U.S. Department of Health and Human Services, Research Triangle Park, NC, pp. 43-96.
National Toxicology Program (1989). Toxicity Study of Acetone, “Summary of Information on Acetone,” NTPTS2.
Nelson, B. W., Brightwell, W. S., Mackenzie-Taylor, D. R., Khan, A., Burg., J. R., Wiegel, W. W., and Goad, P. T. (1988). Teratogenicity of n-propanol and isopropanol administered at high inhalation concentrations to rats. Fd. Chem. Toxic., 26(3):247-254.
Nelson N, Lagesson V, Nosratabadi AR, Ludvigssson J, Tagesson C. (1998). Exhaled isoprene and acetone in newborn infants and children with diabetes mellitus. Pediatric Research, 44:363-367.
National Institute for Occupational Safety and Health (NIOSH). (1991). Health Hazard Evaluation Report No. HETA-90-048-2253, Haute Nails Norman, Oklahoma. U.S. Department
150
of Health and Human Services, Public Health Service, Centers for Disease Control, National Institute for Occupational Safety and Health. Cincinnati, Ohio.
National Institute for Occupational Safety and Health (NIOSH) (1992). Health Hazard Evaluation Report No. HETA-92-128-2241, Tina and Angela's Nail Salon, Springdale, Ohio. U.S. Department of Health and Human Services, Public Health Service, Centers for Disease Control, National Institute for Occupational Safety and Health. Cincinnati, Ohio.
Nishimura, H. et al. (1994). Analysis of acute toxicity (LD50-value) of organic chemicals to mammals by solubility parameter (δ). Jpn. J. Ind. Health 36, 428-434.
Nordmann, R., Ribiere, C., Rouach, H., Beauge, F., Giudicelli, Y., & Nordmann, J. (1973) Metabolic pathways involved in the oxidation of isopropanol into acetone by the intact rat. Life Sci., 13: 919-932.
Norppa, H. (1981). The in vitro induction of sister chromatid exchanges and chromosome aberrations in human lymphocytes by styrene derivatives. Carcinogenesis (London) 2,237-242.
NTP (1989). Toxicology research and applied studies overview. In National Toxicology Program Fiscal Year 1989 Annual Plan, Chpt. VII, pp. 41-134. Dept. Health and Human Services, Research Triangle Park, NC, NTP-89-168.
OECD, Screening Information Dataset Dossier for Acetone (1997) (Appendix A).
OECD, SIDS Initial Assessment Report for Acetone (1999) (Appendix A).
Oglesby, F. L., Williams, J. E., and Fassett, D. W. (1949). Eastman Chemical Company, Rochester, NY: Unpublished paper presented at the Annual Meeting of the American Industrial Hygiene Association, Detroit.
Oser, B.L. and Ford, R.A. (1973). Recent progress in the consideration of flavoring ingredients under the food additives amendment 6 GRAS substances. Food Technol. 27: 64-67.
Ott M. G., Skory, L. K., Holder, B. B., et al. (1983b). Health evaluation of employees occupationally exposed to methylene chloride: Mortality. Stand J Work Environ Health 9(Supp 1):8-16.
Ott MG, Skory LK, Holder BB, et al. (1983a). Health evaluation of employees occupationally exposed to methylene chloride: General study design and environmental considerations. Stand J Work Environ Health 9 (Supp 1) l-7.
Ott, M. G., Skory, L. K., Holder, B. B, et al. (1983c). Health evaluation of employees occupationally exposed to methylene: Clinical laboratory evaluation. Stand J Work Environ Health 9(Supp 1):17-25.
Owen, O. E, Trapp V. E, Skutches C. L., et al. (1982). Acetone metabolism during diabetic ketoacidosis. Diabetes 3 1:242-248.
151
Owen OE, Trapp VE, Skutches CL, Mozzoli MA, Hoeldtke RD, Boden G, Reichard GA Jr. (1982). Acetone metabolism during diabetic ketoacidosis. Diabetes, 31(3):242-8.
Peclet, C., P. Picotte, and F. Jobin, (1994). The use of vitreous humor levels of glucose, lactic acid and blood levels of acetone to establish antemortem hyperglycemia in diabetes. Forensic Sci. Int. 65 1-6.
*Peden, V.H. (1964). Determination of individual serum “ketone bodies,” with normal values in infants and children. J. Lab. Clin. Med. 63: 332-343.
Pellizzari, E. D., et al. (1982). Purgeable organic compounds in mother’s milk. Bull. Environ. Contam. Toxicol 28, 322-328.
Peterson, A. R. et al. (1981). Oncogenic transformation and mutation of C3H/10T½ clone 8 mouse embryo fibroblasts by alkylating agents. Cancer Res. 41, 3095-3099.
Pienta, R.J. 1980. Transformation of Syrian. hamster embryo cells by diverse chemicals and correlation with their reported carcinogenic and mutagenic activities. In F. J. de Serres and A. Hollaender, eds., Chemical Mutagen: Principles and Methods for their Detection, Plenum, New York, NY, pp. 175-202.
Plaa GL. (1988). Experimental evaluation of haloalkanes and liver injury. Fund Appl Toxicol 10:563-570.
Plaa, G. L. et al. (1982). Isopropanol and acetone potentiation of carbon tetrachloride-induced hepatotoxicity: Single versus repetitive pretreatment in rats. J. Toxicol Environ. Health 9, 235-250.
Pozzani, U. C., Weil, C.S., and Carpenter, C. P. (1959). The toxicological basis of threshold limit values: 5. The experimental inhalation of vapor mixtures by rats, with notes upon the relationship between single dose inhalation and single dose oral data. Am. Ind. Hyg. Assoc. J. 20: 364-369.
Price TD, Rittenberg D. (1950). The metabolism of acetone. I. Gross aspects of catabolism and excretion. J Biol Chem 185:449-459.
Quarles J. M., Sega, M. W., Schenley, C. K., et al. (1979a). Transformation of hamster fetal cells by nitrosated pesticides in a transplacental assay. Cancer Res 39:4525-4533.
Quarles, J. M., Sega, M. W., Schenley, C. K., et al. (1979b). Rapid screening for chemical carcinogens: Transforming activity of selected nitroso compounds in a transplacental host-mediated culture system. Nat’l Cancer Inst Monogr 51:257-263.
Raleigh, R .L., and McGee, W. A. (1972). Effects of short, high-concentration exposures to acetone as determined by observation in the work area. J. Occup. Med. 14: 607-610.
Rao, G. N. , Edmondson, J. and Elwell, M .R. (1993). Influence of dietary protein concentration on severity of nephropathy in Fischer-344 (F-344/N)P-3441N)rats. Toxicol.-Pathol. 21, 353-361.
152
Rédei, G.P. (1982). Mutagen assay with Arabidopsis. A report of the U. S. Environmental Protection Agency Gene-Tox Program. Mutat. Res. 99, 243-255.
*Reichard, G. A., et al. (1979). Plasma acetone metabolism in the fasting human. J. Clin. -Invest. 633. 619-626.
Rengstorff, R. H., Petrali J. P., Sim, V. M. (1976). Attempts to induce cataracts in rabbits by cutaneous application of acetone. Am J Optom Physiol Opt 53:41-42.
Rengstorff, R. H., Petrali J. P., Sim, V. M. (1972). Cataracts induced in guinea pigs by acetone, cyclohexanone, and dimethyl sulfoxide. Am J Optom Arch Acad Opt 49:308-319.
Roberson, JA, and Crowe, CT. (1993). Engineering Fluid Mechanics, 5th Edition. Houghton Mifflin Company, Boston, MA.
Roe, F. J. C., Carter, R .L., Mitchley, B .C. V., Peto, R., and Hecker, E. (1972). On the persistence of tumour initiation and the acceleration of tumor progression in mouse skin tumorigenesis. Int. J. Cancer 9,264-273.
Rossman, T. G, et al. (1991). Performance of 133 compounds in the lambda prophage induction endpoint of the microscreen assay and a comparison with S. typhimurium mutagenicity and rodent carcinogenicity assays. Mutat. Res. 260, 349-367.
Roudabush,R. L., et al. (1965). Comparative acute effects of some chemicals on the skin of rabbits and guinea pigs. Toxicol. Appl. Pharmacol. 7, 559-565.
*Sack TM, Steele DH, Hammerstrom K, et al. (1992). A survey of household products for volatile organic compounds. Atmos. Environ., 26A(6):1063-1070.
Sakai, A. and Sato, M. (1989). Improvement of carcinogen identification in BALB/3T3 cell transformation by application of a 2-stage method. Mutat. Res. 214, 285-296.
Savolainen, H., Pekari, K., & Helojoki, H. (1979). Neurochemical and behavioural effects of extended exposure to isopropanol vapour with simultaneous ethanol intake. Chem.-biol. Interact., 28: 237-248.
Shah and Singh (1988). “Distribution of Volatile Organic Chemicals in Indoor and Outdoor Air,” Environ. Sci. Technol., 22: 1381-1388.Abbondandolo, A., Bonatti, S., Corsi, C., Corti, G., Fiorio, R., Leporini, C., Mazzaccaro, A., and Nieri, R. (1980). The use of organic solvents in mutagenicity testing. Mutation Research 79: 141-150.
Shipp, A .M., Allen, B.C., Van Landingham, C., Gentry, P .R., and Crump, K. S. (1997). Quantitative dose-response analysis - Application of the benchmark method to the multi-generation rat reproduction study for isopropanol. Report prepared for the Chemical Manufacturers Association Isopropanol Panel.
Siebert, H., Siebert, G., & Bohn, G. (1972) [Animal experimental investigations into the metabolism of propan-2-ol.] Dtsch. Apoth.-ZTG., 112: 1040-1041 (in German).
153
Simmons, J.E. et al. (1994). Toxicology studies of a chemical mixture of 25, groundwater contaminants: Hepatic and renal assessment, response to carbon tetrachloride challenge, and influence of treatment-induced water restriction. J. Toxicol. Environ. Health 43, 305-325.
Sina, J. F. et al. (1983). Evaluation of the alkaline elution/rat hepatocyte assay as a predictor of carcinogenic/mutagenic potential. Mutat. Res. 113, 357-391.
Sinclair, P. R. et al. (1989). Uroporphyrin caused by acetone and 5-aminolevulinic acid in iron-loaded mice. Biochem. Pharmacol. 23, 4341-4344.
Singh et al. (1994). “Acetone in the atmosphere: distribution, sources and sinks” J Geophys Res, 99: 1805-1819.
Skutches C. L., Owen, O. E., Reichard Jr. , G. A. (1990). Acetone and acetol inhibition of insulin-stimulated glucose oxidation in adipose tissue and isolated adipocytes. Diabetes 39:450-455.
Slauter, R. W., Coleman, D. P., Gaudette, N. J., McKee, R. H., Masten, L. W., Gardiner, T. H., Strother, D. E., Tyler, T. R., and Jeffocat, A. R. (1994). Disposition and pharmacokinetics of isopropanol in F-344 rats and B6C3F1 mice. Fundam. Appl. Toxicol. 23, 407-420.
Smith, VE, Economic Impact of Metabolic Problems, The Dairy Focus A publication for dairy farm businesses in Pennsylvania's Capital Region., Penn State, College of Agricultural Sciences - Cooperative Extension
Smyth, H.F. Jr., Carpenter, C. P., Weil, C. S., Pozzani, V. C., and Striegel, J. A. (1962). Range-finding toxicity data: list VI. Am. Ind. Hyg. Assoc. J. 23: 95-107.
Soden, K. J. (1993). An evaluation of chronic methylene chloride exposure. J. Occup. Med. 35, 282-286.
Sollmann T. (1921). Studies of chronic intoxications on albino rats. II. Alcohols (ethyl, methyl and “wood”) and acetone. J Pharmacol Exp Ther 16:291-309
Specht, H. Miller, J. W. and Valaer, P. J. (1939). Acute response of guinea pigs to the inhalation of dimethyl ketone (acetone) vapor in air. Public Health Rep. 52, 944-954.
*Spencer, P.S., Bischoff, M. C., and Schaumburg, H. H. (1978). On the specific molecular configuration of neurotoxic aliphatic hexacarbon compounds causing central-peripheral distal axonopathy. Toxicol. and Appl. Pharmacol. 44: 17-28.
Stewart R. D., Hake, C. L., Wu, A. et al. (1975). Acetone: Development of a biologic standard for the industrial worker by breath analysis. Cincinnati, OH: National Institute for Occupational Safety and Health. NTIS PB82-172917.
Strange, J. R., Allred, P. M. and Kerr, W.E. (1976). Teratogenic and toxicological effects of 2,4,5trichlorophenoxyacetic acid in developing chick embryos. Bull. Environ. Contam. Toxicol. 15, 682-688.
Sulway, M.J. and Mullins, J.M., Acetone in diabetic ketoacidosis, Lancet 1, 736-740 (1970).
154
Sulway, M. J. et al. (1971). Acetone in uncontrolled diabetes. Postgrad. Med J° 47,.383 –387.
Sulway, M. J., Malins, M. J. 1970. Acetone in diabetic ketoacidosis. Lancet 1:1736-1740. Mutat Res 88:397-410.
Swartout, J.C., P.S. Price, M.L. Doruson, H. Calson-Lynch, and R.E. Keenan (1998). A probablistic framework for the reference dose. Risk. Anal. (18) 3, 271-282.
Tanii, H., Tsuji, H., and Hashimoto, K. (1986). Structure - toxicity relationship of monoketines. Toxicol. Lett. 30: 13-17.
Targowski, S. P. and Klucinski, W. (1983). Reduction in mitogenic response of bovine lymphocytes by ketone bodies. Am. J. Vet. Res. 44, 828-830.
Tates, A. D. and Kriek, E. (1981). Induction of chromosomal aberrations and sister chromatid exchanges in Chinese hamster cells in vitro by some proximate and ultimate carcinogenic arylamide derivatives. Mutat. Res. 88,397-410.
Taylor, A. , Smith, D. E., Palmer, V. J., et al. (1993). Relationships between acetone, cataracts, and ascorbate in hairless guinea pigs. Ophthalmic Res 25:30-35.
Teitz, N.W. (1983). Clinical Guide to Laboratory Tests, Saunders, Philadelphia, PA, pp. 2-3, 862-865.
Trotter, M. D., Sulway, M. J. and Trotter, E. (1971). The rapid determination of acetone in breath and-, plasma. Clin. Chim. Acta 35, 137-143.
Tyl, R. W. (1996). February 12, 1996 Letter to the Chemical Manufacturers Association Isopropanol Panel.
Tyl, R. W., Masten L. W., Marr M. C., Myers C. B., Slauter R. W., Gardiner T. H., Strother D. E., McKee R. H. and Tyler T. R. (1994). Developmental toxicity evaluation of isopropanol by gavage in rats and rabbits. Fundam. Appl. Toxicol. 22:139-151.
U.S. Environmental Protection Agency (USEPA). (2003). Draft Acute Exposure Guideline Levels (AEGLs) for Acetone. National Advisory Council. NAC/Draft 1: 01/2003.
U.S. Environmental Protection Agency (USEPA). (2002). Child-Specifiic Exposure Factors Handbook (Interim Report) USEPA EPA-600-P-00-002B. 01 Sep 2002. U.S. Environmental Protection Agency, Office of Research and Development, National Center for Environmental Assessment, Washington Office, Washington, DC, 448.
U.S. EPA, Draft Toxicological Review of Acetone, (2001) available at http://cfpub.epa.gov/ncea/.
U.S. Environmental Protection Agency (USEPA). (2001). Risk Assessment Guidance for Superfund: Volume III – Part A, Process for Conducting Probabilistic Risk Assessment. Office of Emergency and Remedial Response. EPA 540-R-02-002. December, 2001.
155
U.S. Environmental Protection Agency (USEPA). (2000). Source Ranking Database. Draft Version 3.0. Office of Pollution Prevention and Toxics, Economics, Exposure, and Technology Division, Exposure Assessment Branch.
U.S. Environmental Protection Agency (USEPA). (1998). Methods for Exposure-Response Analysis for Acute Inhalation Exposure to Chemicals (External Review Draft). EPA/600/R-98/051.
U.S. Environmental Protection Agency (USEPA). (1997). Exposure Factors Handbook – Volumes I, II and III. EPA/600/P-95/002F. Office of Research and Development.
U.S. Environmental Protection Agency (1996). Draft Final RM1 Risk Assessment of Isopropanol, OPPT. TSCA Public Docket Number AR-141.
U.S. Environmental Protection Agency (USEPA). (1995a). Risk Assessment: Technical Guidance Manual: Region 3 Assessing Dermal Contact with Soil: Existing Guidance. Office of Superfund Programs.
U.S. Environmental Protection Agency (USEPA). (1995b). Supplemental Guidance to RAGS: Region 4 Bulletins, Human Health Risk Assessment (Interim Guidance). Waste Management Division, Office of Health Assessment.
U.S. Environmental Protection Agency (USEPA). (1992). Dermal Exposure Assessment: Principles and Applications. Exposure Assessment Group. Office of Health and Environmental Assessment.
U.S. Environmental Protection Agency. (USEPA). (1989). Risk Assessment Guidance for Superfund, Volume 1. Human Health Evaluation Manual (Part A), interim final. Office of Emergency and Remedial Response, Washington, D.C. EPA/540/1-89/002.
U.S. Environmental Protection Agency (USEPA) 1988. Integrated Risk Information System (IRIS). Background Document 1. National Center for Environmental Assessment, Cincinnati, OH.
Van Duuren, B. L., Sivak, A., Katz C., and Melchionne, S. (1971). Cigarette smoke carcinogenesis: Importance of tumor promoters. J. Natl. Cancer Inst. 47,235-240.
Van Duuren, B .L., Loewengart, G., Seidman, I., Smith, A. C., and Melchionne, S. (1978). Mouse skin carcinogenicity tests of the flame retardants tris (2,3-dibromopropyl) phosphate, Tetrakis (hydroxymethyl) phosphonium chloride, and polyvinyl bromide. Cancer Res. 38: 3236-3240.
Vance, D. E. (1983). Metabolism of fatty acids and triacylglycerols. In: Zubay G, ed. Biochemistry. Reading, MA: Addison-Wesley Publishing Co., 471-503.
Vasavada, H. A. and Padayatty, J. D. (1981). Rapid transfection assay for screening mutagens and carcinogens. Mutat. Res. 91, 9-14.
Von der Hude ,W. et al. (1987). Genotoxicity of three-carbon compounds evaluated in the SCE test in vitro. Environ. Mutagen. 9, 401-410.
156
Von der Hude, W. et al. (1988). Evaluation of the SOS chromotest. Mutat. Res. 203, 81-94.
Walther, A. and Neumann, G. (1969). Uber den Verlauf Azetonausscheidung in der Ausatmungsluft bei Radsportlern vor, wahrend und nach einer spezifischen Laborbelastung. Acta Biol. Med. Ger. 22: 117-121.
Ward J. M. , Quander, R., Devor, D., et al. 1986. Pathology of aging female SENCAR mice used as controls in skin two-stage carcinogenesis studies. Environ Health Perspect 68:81-89.
*Westat / EPA, (1987). Household Solvent Products: A National Usage Survey. EPA Exposure Evaluation Division. NTIS #: PB88-132881.
Wigaeus, E, Holm S, Astrand I. (1981). Exposure to acetone. Uptake and elimination in man. Scand. J. Work. Environ. Health, 7: 84-94.
Whittaker, W. G. et al. (1989). Detection of induced mitotic chromosome loss in Saccharomyces cerevisiae-An interlaboratory study. Mutat. Res. 224, 31-78.
WHO (1998). Environmental Health Criteria: Acetone. World Health Organization, International Programme On Chemical Safety. EHC 207. Geneva, Switzerland.
WHO (1990). Environmental Health Criteria: 2-Propanol. World Health Organization International Programme on Chemical Safety. EHC 103. Geneva, Switzerland.
Williamson, E.H. and Whitelaw, E. (1978) Physiological aspects of the regulation of ketogenesis. Biocbem Soc. Symp. 43: 137-161.Swartz, W. J. , Long- and short-term effects of carbaryl exposure in chick embryos. Environ. Res. 26, 463-471 (1981).
Wysocki, CJ; Dalton, P; Brody, MJ; Lawley, HJ. (2002). Acetone odor and irritation thresholds obtained from acetone-exposed factory workers and from control (unoccupationally exposed) subjects. Crit Rev Toxicol. 2002 Jan; 32(1) 43-66
Yadav, A. S., Vashishat, R. K. and Kakar, S. N. (1982). Testing endosulfan and fenitrothion for genotoxicity in Saccharomyces cerevisiae. Mutat. Res. 105, 403-407.
Zakhari, S. 1977. Acute oral, intraperitoneal, and inhalational toxicity of methyl isobutyl ketone in the mouse. In L. Goldberg, ed., Isopropanol and Ketones in the Environment, CRC Press, Cleveland, OH, pp. 101-104.
*Zakova, N., Zak, F., Froelich, E., and Hess, R. (1985). Evaluation of skin carcinogenicity of technical 2,2-bis-(p-glycidyloxyphenyl)-propane in CF1 mice. Food Chem. Toxicol. 23: 1081-1089.
Zarani, F., Papazafiri, P. and Kappas, A. (1999). Induction of micronuclei in human lymphocytes by organic solvents in vitro. J. Environ. Pathol. Toxicol. Oncol. 18, 21-28.
Zeiger, E., et al. (1992). Salmonella mutagenicity tests: V. Results from the testing of 311 chemicals. Environ. Mol. Mutagen. 19(Suppl. 21), 2-141.
157
Zhao L, Zhang Y, Wang X, Riskowski GL and Christianson LL. (1999). Measurement of airflow patterns in ventilated spaces using particle image velocimetry. Paper #994156 presented at 1999 ASAE Annual International Meeting. Accessed at http://www.age.uiuc.edu/bee/research/piv/Pivpaper3.htm
Zimmermann, F. K., et al. (1985). Acetone, methyl ethyl ketone, ethyl acetate, acetonitrile and other polar aprotic solvents are strong inducers of aneuploidy in Saccharomyces cerevisiae. Muta. Res. 149,339-351.
DC\576168.5