achieve the lean six sigma continuous process … · evolving a fully integrated lean six sigma...
TRANSCRIPT
Dale L. MooreNAVAIR AIRSpeed
Deputy Corporate Deployment ChampionMay 2007
Achieve the Achieve the MissionMission
Decrease Inventory
Decrease Cycle Time
Improve Reliability
Decrease Operating Expenses
Evolving a Fully Integrated Lean Six Sigma Continuous Process Improvement
Systems Approach for Enterprise “End-to-End” Value Stream Excellence
presented to
NPS Acquisition Research Symposium
Report Documentation Page Form ApprovedOMB No. 0704-0188
Public reporting burden for the collection of information is estimated to average 1 hour per response, including the time for reviewing instructions, searching existing data sources, gathering andmaintaining the data needed, and completing and reviewing the collection of information. Send comments regarding this burden estimate or any other aspect of this collection of information,including suggestions for reducing this burden, to Washington Headquarters Services, Directorate for Information Operations and Reports, 1215 Jefferson Davis Highway, Suite 1204, ArlingtonVA 22202-4302. Respondents should be aware that notwithstanding any other provision of law, no person shall be subject to a penalty for failing to comply with a collection of information if itdoes not display a currently valid OMB control number.
1. REPORT DATE MAY 2007 2. REPORT TYPE
3. DATES COVERED 00-00-2007 to 00-00-2007
4. TITLE AND SUBTITLE Evolving a Fully Integrated Lean Six Sigma Continuous ProcessImprovement Systems Approach for Enterprise ’End-to-End’ ValueStream Excellence
5a. CONTRACT NUMBER
5b. GRANT NUMBER
5c. PROGRAM ELEMENT NUMBER
6. AUTHOR(S) 5d. PROJECT NUMBER
5e. TASK NUMBER
5f. WORK UNIT NUMBER
7. PERFORMING ORGANIZATION NAME(S) AND ADDRESS(ES) Naval Air Systems Command (NAVAIR),47123 Buse Rd, B2272 UnitIPT,Patuxent River,MD,20670-1547
8. PERFORMING ORGANIZATIONREPORT NUMBER
9. SPONSORING/MONITORING AGENCY NAME(S) AND ADDRESS(ES) 10. SPONSOR/MONITOR’S ACRONYM(S)
11. SPONSOR/MONITOR’S REPORT NUMBER(S)
12. DISTRIBUTION/AVAILABILITY STATEMENT Approved for public release; distribution unlimited
13. SUPPLEMENTARY NOTES 4th Annual Acquisition Research Symposium: Creating Synergy for Informed Change, May 16-17, 2007 inMonterey, CA
14. ABSTRACT
15. SUBJECT TERMS
16. SECURITY CLASSIFICATION OF: 17. LIMITATION OF ABSTRACT Same as
Report (SAR)
18. NUMBEROF PAGES
27
19a. NAME OFRESPONSIBLE PERSON
a. REPORT unclassified
b. ABSTRACT unclassified
c. THIS PAGE unclassified
Standard Form 298 (Rev. 8-98) Prescribed by ANSI Std Z39-18
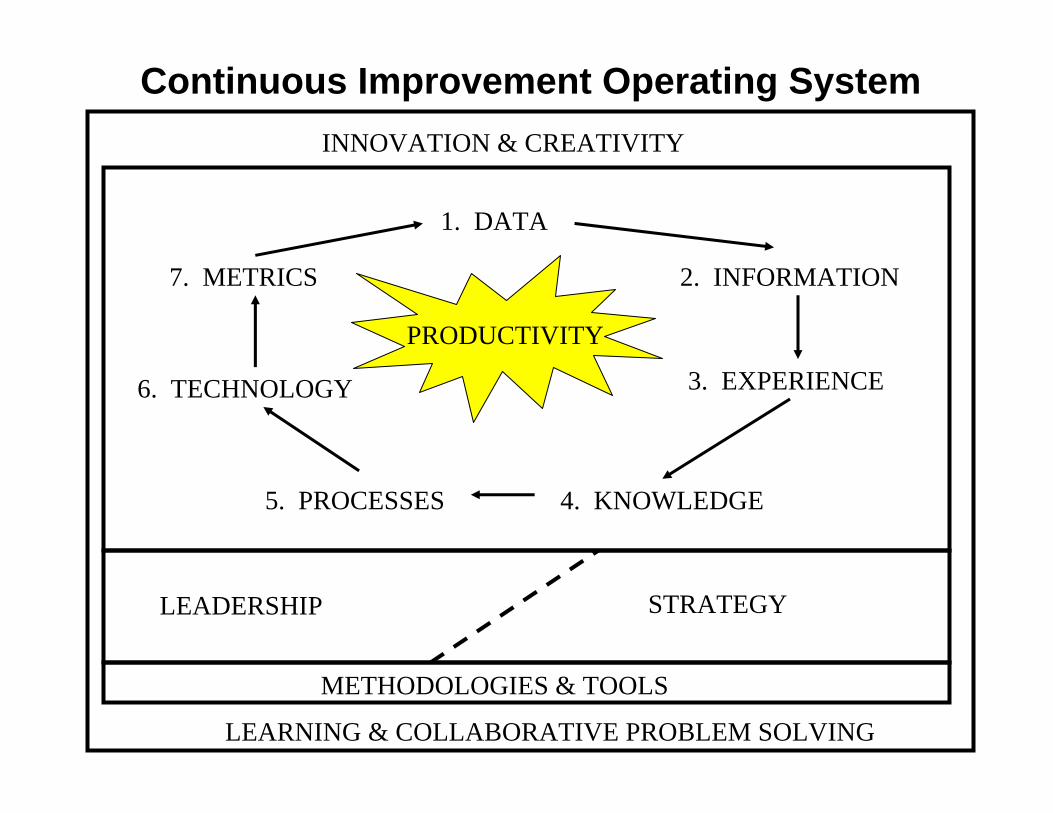
Continuous Improvement Operating System
1. DATA
2. INFORMATION
3. EXPERIENCE
4. KNOWLEDGE5. PROCESSES
6. TECHNOLOGY
7. METRICS
LEADERSHIP STRATEGY
LEARNING & COLLABORATIVE PROBLEM SOLVING
INNOVATION & CREATIVITY
PRODUCTIVITY
METHODOLOGIES & TOOLS
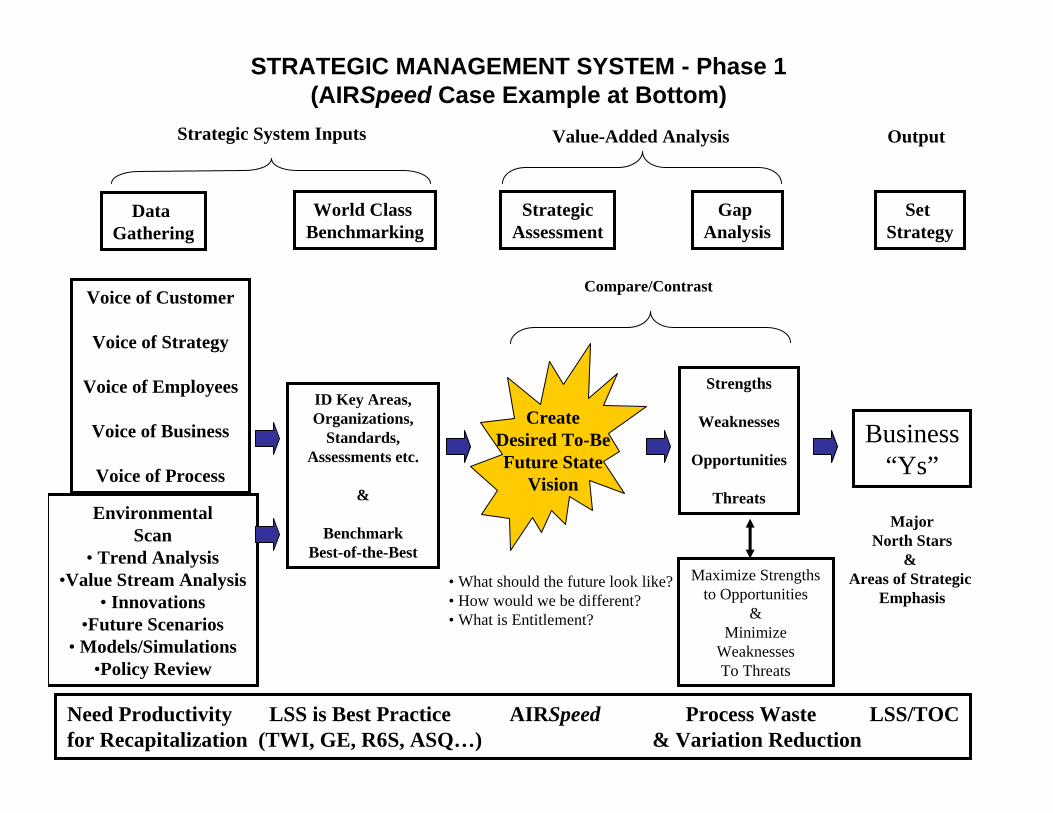
STRATEGIC MANAGEMENT SYSTEM - Phase 1(AIRSpeed Case Example at Bottom)
Data Gathering
World Class Benchmarking
StrategicAssessment
Gap Analysis
Set Strategy
Voice of Customer
Voice of Strategy
Voice of Employees
Voice of Business
Voice of Process
EnvironmentalScan
• Trend Analysis•Value Stream Analysis
• Innovations•Future Scenarios
• Models/Simulations•Policy Review
ID Key Areas,Organizations,
Standards,Assessments etc.
&
BenchmarkBest-of-the-Best
CreateDesired To-BeFuture State
Vision
Strengths
Weaknesses
Opportunities
Threats
Business“Ys”
Strategic System Inputs Value-Added Analysis Output
• What should the future look like?• How would we be different?• What is Entitlement?
Maximize Strengths to Opportunities
&Minimize
Weaknesses To Threats
Compare/Contrast
MajorNorth Stars
& Areas of Strategic
Emphasis
Need Productivity LSS is Best Practice AIRSpeed Process Waste LSS/TOCfor Recapitalization (TWI, GE, R6S, ASQ…) & Variation Reduction
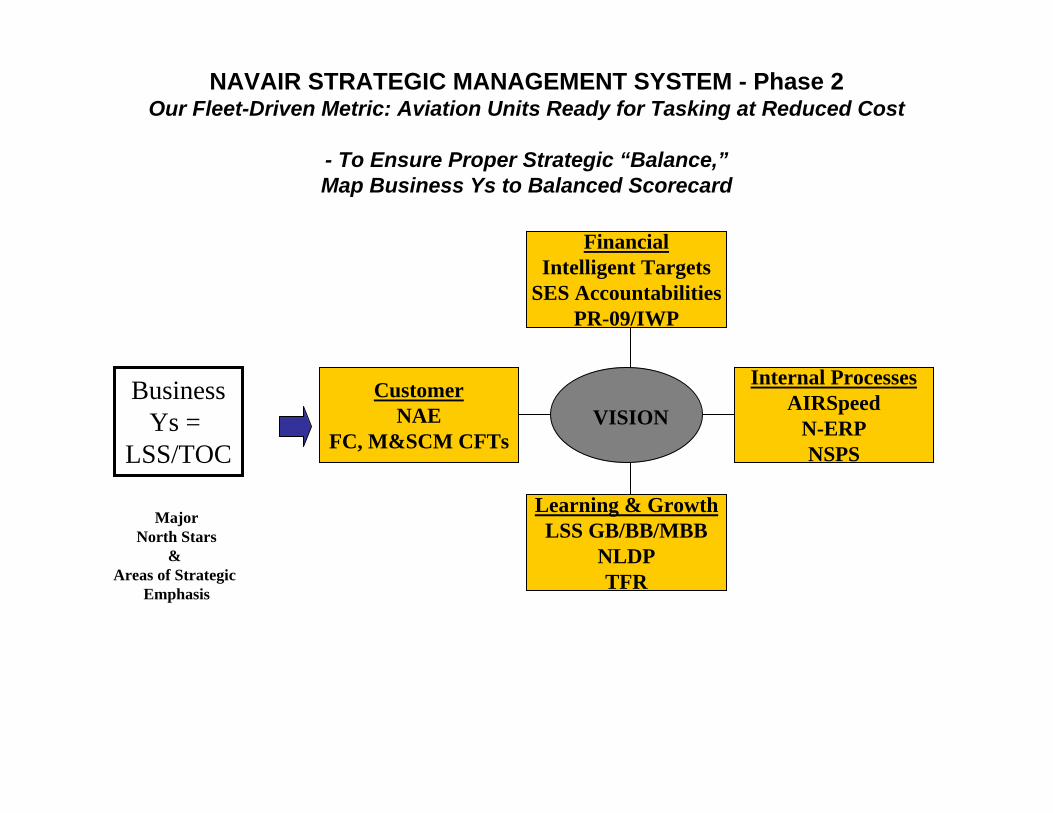
NAVAIR STRATEGIC MANAGEMENT SYSTEM - Phase 2Our Fleet-Driven Metric: Aviation Units Ready for Tasking at Reduced Cost
- To Ensure Proper Strategic “Balance,”Map Business Ys to Balanced Scorecard
BusinessYs =
LSS/TOC
MajorNorth Stars
& Areas of Strategic
Emphasis
FinancialIntelligent Targets
SES AccountabilitiesPR-09/IWP
CustomerNAE
FC, M&SCM CFTs
Learning & GrowthLSS GB/BB/MBB
NLDPTFR
Internal ProcessesAIRSpeed
N-ERPNSPS
VISION
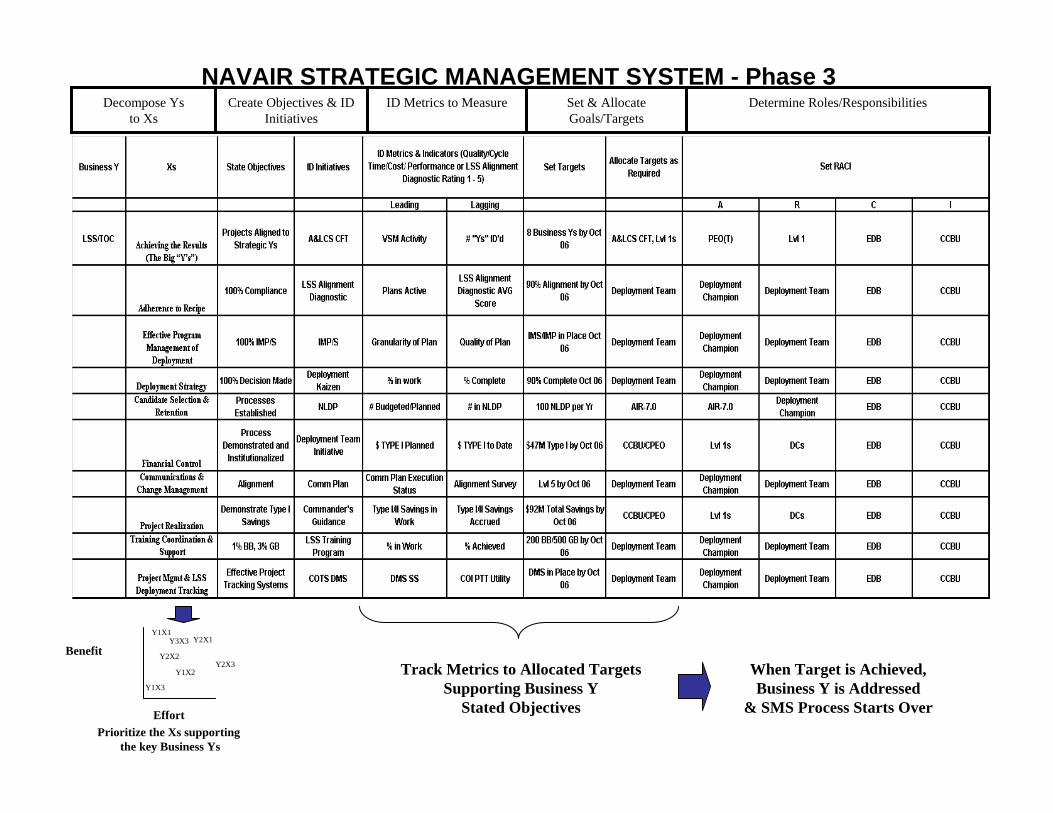
NAVAIR STRATEGIC MANAGEMENT SYSTEM - Phase 3Decompose Ys
to XsCreate Objectives & ID
InitiativesID Metrics to Measure Set & Allocate
Goals/TargetsDetermine Roles/Responsibilities
Benefit
Effort
Y1X1
Y1X2
Y2X1Y3X3
Y2X2Y2X3
Y1X3
Prioritize the Xs supporting the key Business Ys
Track Metrics to Allocated TargetsSupporting Business Y
Stated Objectives
When Target is Achieved,Business Y is Addressed
& SMS Process Starts Over
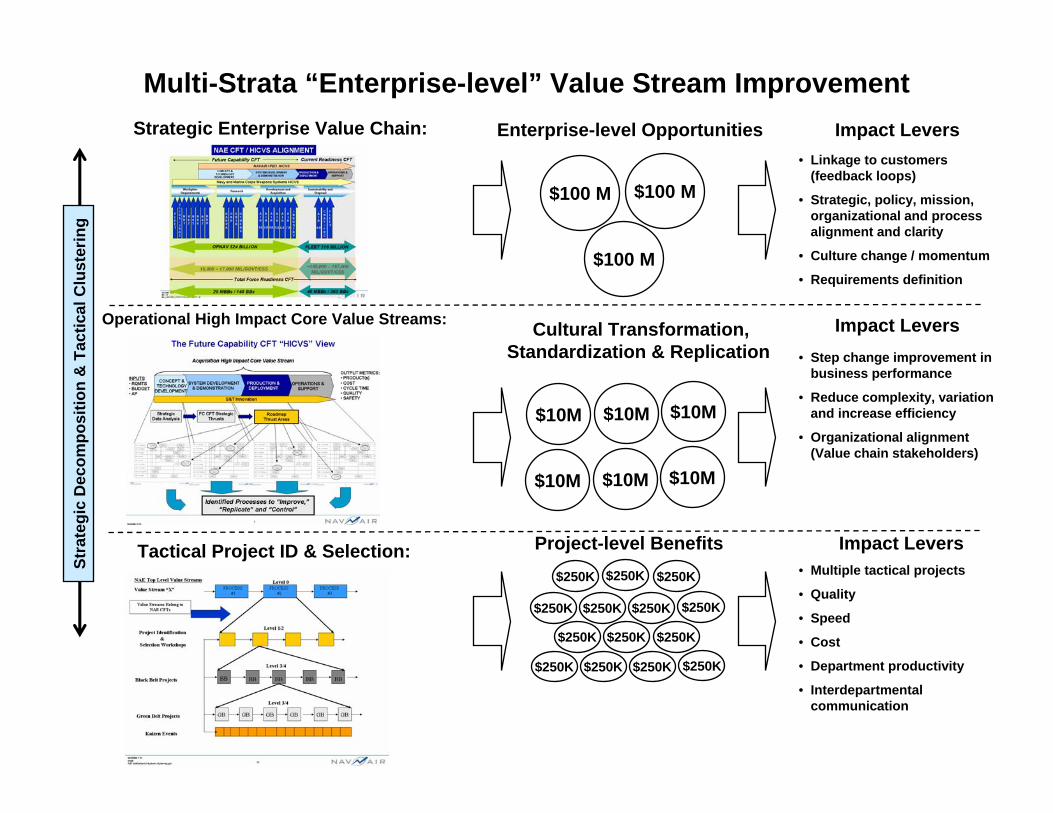
Multi-Strata “Enterprise-level” Value Stream ImprovementSt
rate
gic
Dec
ompo
sitio
n &
Tac
tical
Clu
ster
ing
Strategic Enterprise Value Chain:
$100 M $100 M
$100 M
Enterprise-level Opportunities Impact Levers• Linkage to customers
(feedback loops)
• Strategic, policy, mission, organizational and process alignment and clarity
• Culture change / momentum
• Requirements definition
Operational High Impact Core Value Streams:
$10M $10M
Cultural Transformation,Standardization & Replication
Impact Levers• Step change improvement in
business performance
• Reduce complexity, variation and increase efficiency
• Organizational alignment (Value chain stakeholders)
$10M
$10M $10M $10M
• Multiple tactical projects
• Quality
• Speed
• Cost
• Department productivity
• Interdepartmental communication
$250K
$250K
$250K $250K $250K
$250K
$250K$250K
$250K $250K
$250K $250K$250K $250K
Tactical Project ID & Selection: Project-level Benefits Impact Levers
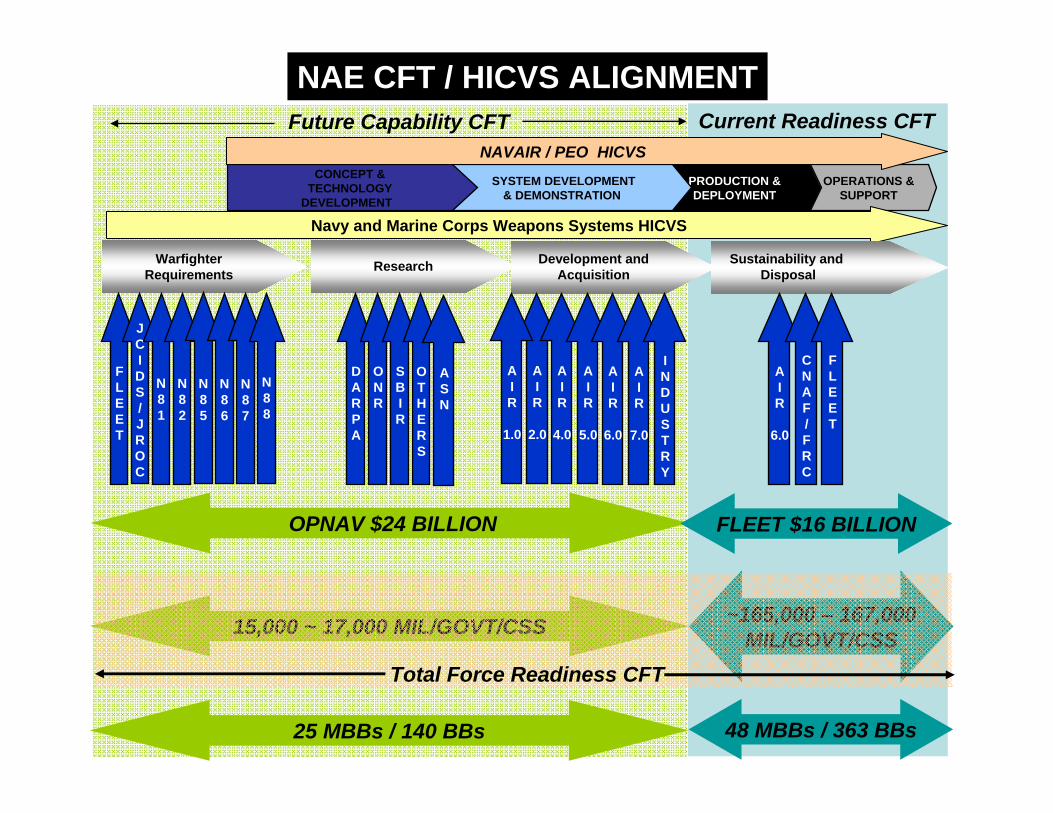
OPERATIONS &SUPPORT
PRODUCTION &DEPLOYMENT
SYSTEM DEVELOPMENT& DEMONSTRATION
CONCEPT &TECHNOLOGY
DEVELOPMENT
Navy and Marine Corps Weapons Systems HICVS
WarfighterRequirements Research Development and
AcquisitionSustainability and
Disposal
NAVAIR / PEO HICVS
Current Readiness CFTFuture Capability CFT
FLEET
JCIDS/JROC
DARPA
ONR
SBIR
OTHERS
N81
N82
N85
N86
N87
N88
AIR
2.0
AIR
4.0
AIR
5.0
AIR
6.0
AIR
7.0
INDUSTRY
AIR
6.0
OPNAV $24 BILLION FLEET $16 BILLION
CNAF/FRC
FLEET
15,000 ~ 17,000 MIL/GOVT/CSS ~165,000 – 167,000 MIL/GOVT/CSS
25 MBBs / 140 BBs 48 MBBs / 363 BBs
Total Force Readiness CFT
NAE CFT / HICVS ALIGNMENT
AIR
1.0
ASN
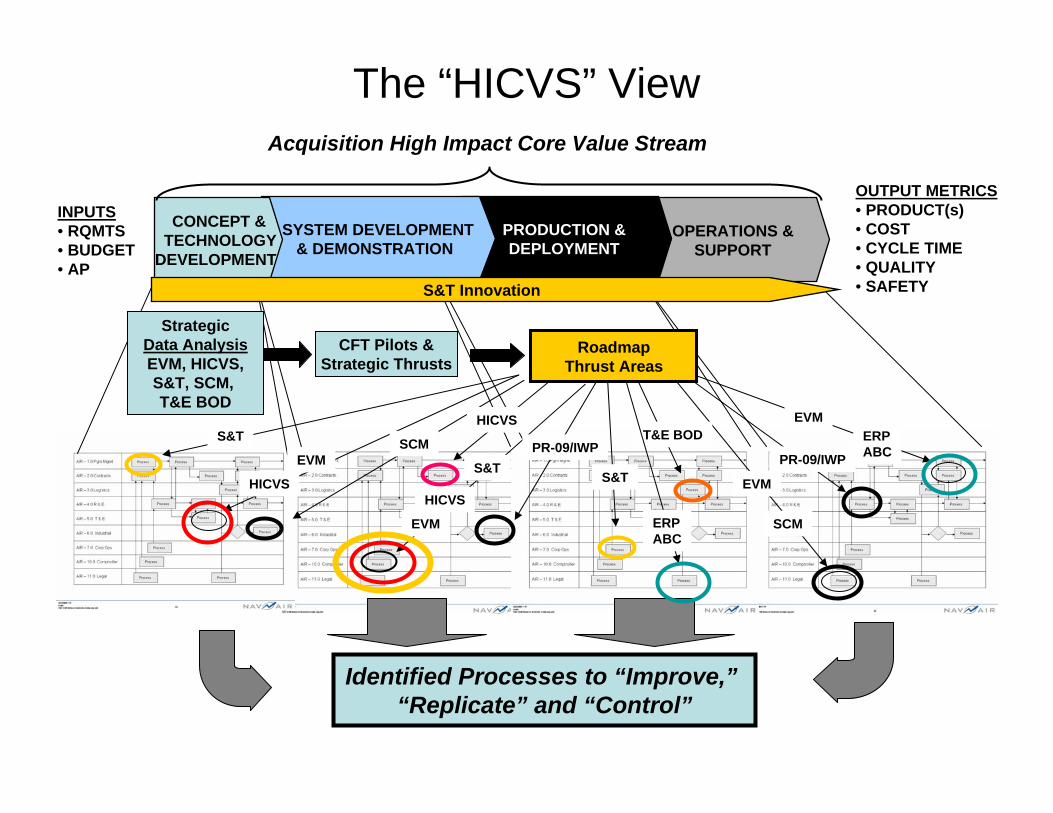
The “HICVS” View
OPERATIONS &SUPPORT
PRODUCTION &DEPLOYMENT
SYSTEM DEVELOPMENT& DEMONSTRATION
CONCEPT &TECHNOLOGY
DEVELOPMENT
Acquisition High Impact Core Value Stream
INPUTS• RQMTS• BUDGET• AP
OUTPUT METRICS• PRODUCT(s) • COST• CYCLE TIME• QUALITY• SAFETY
Identified Processes to “Improve,”“Replicate” and “Control”
Roadmap Thrust Areas
S&T Innovation
StrategicData AnalysisEVM, HICVS,S&T, SCM, T&E BOD
CFT Pilots &Strategic Thrusts
EVM
EVM
S&T
S&T
T&E BODHICVS
HICVS
SCM
SCM
EVM
EVMHICVS
S&T PR-09/IWPPR-09/IWP
ERPABC
ERPABC
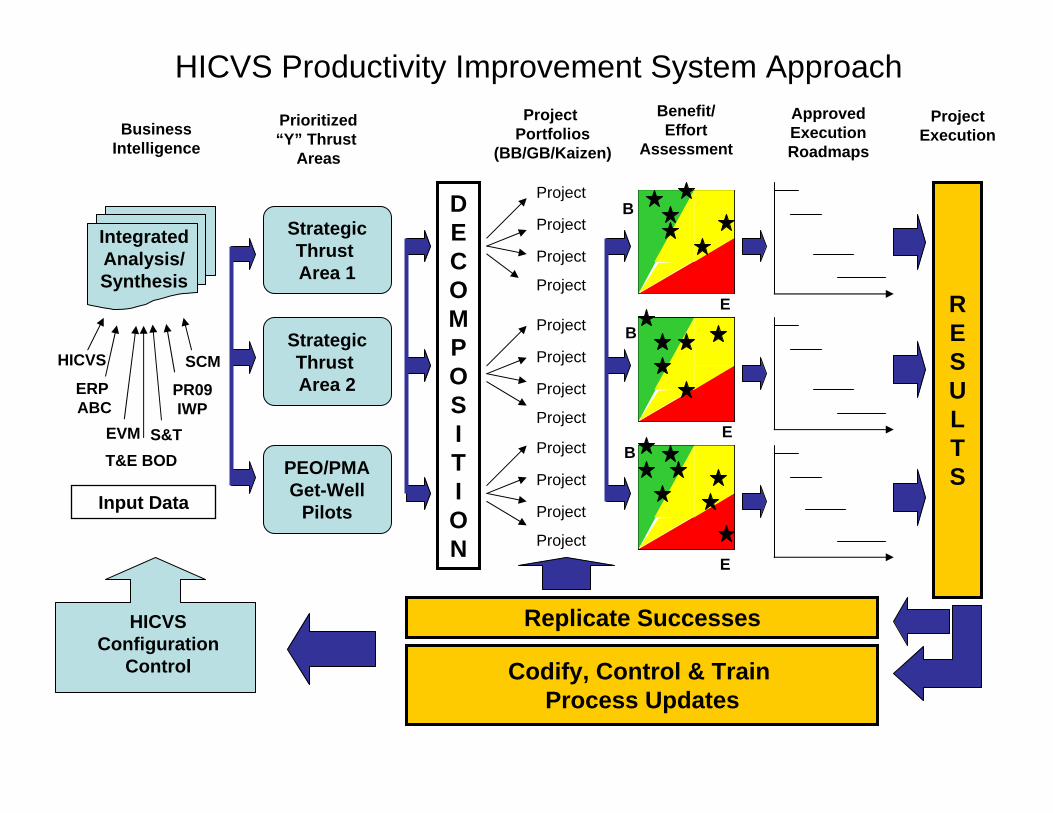
HICVS Productivity Improvement System Approach
IntegratedAnalysis/Synthesis
StrategicThrust Area 1
StrategicThrust Area 2
PEO/PMAGet-Well
Pilots
DECOMPOSITION
Project
Project
Project
Project
Project
Project
Project
Project
Project
Project
Project
ApprovedExecutionRoadmaps
RESULTS
Codify, Control & Train Process Updates
Prioritized“Y” Thrust
Areas
Project Portfolios
(BB/GB/Kaizen)
Benefit/Effort
Assessment
B
Project
B
B
E
E
E
HICVS
EVMT&E BOD
S&T
SCM
Input Data
HICVSConfiguration
Control
Replicate Successes
BusinessIntelligence
ProjectExecution
ERP ABC
PR09IWP
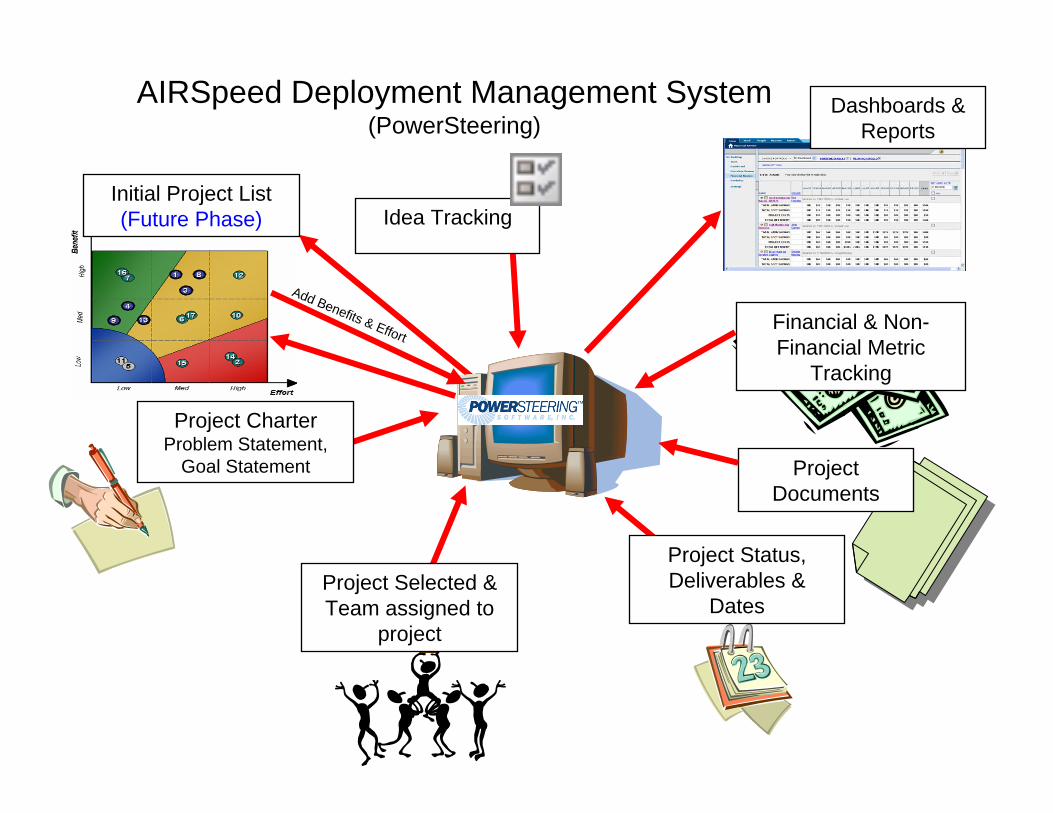
AIRSpeed Deployment Management System(PowerSteering)
Initial Project List (Future Phase)
Project Charter Problem Statement,
Goal Statement
Project Selected & Team assigned to
project
Project Status, Deliverables &
Dates
Project Documents
Dashboards & Reports
Financial & Non-Financial Metric
Tracking
Idea Tracking
Add Benefits & Effort
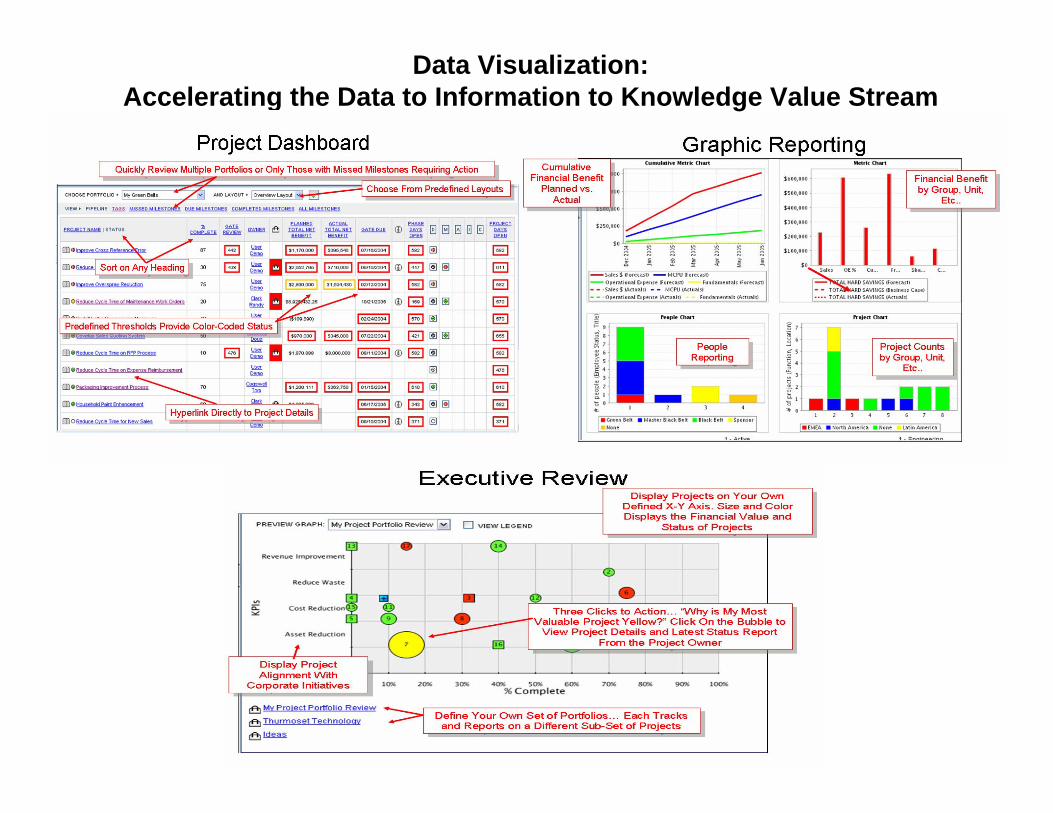
Data Visualization: Accelerating the Data to Information to Knowledge Value Stream
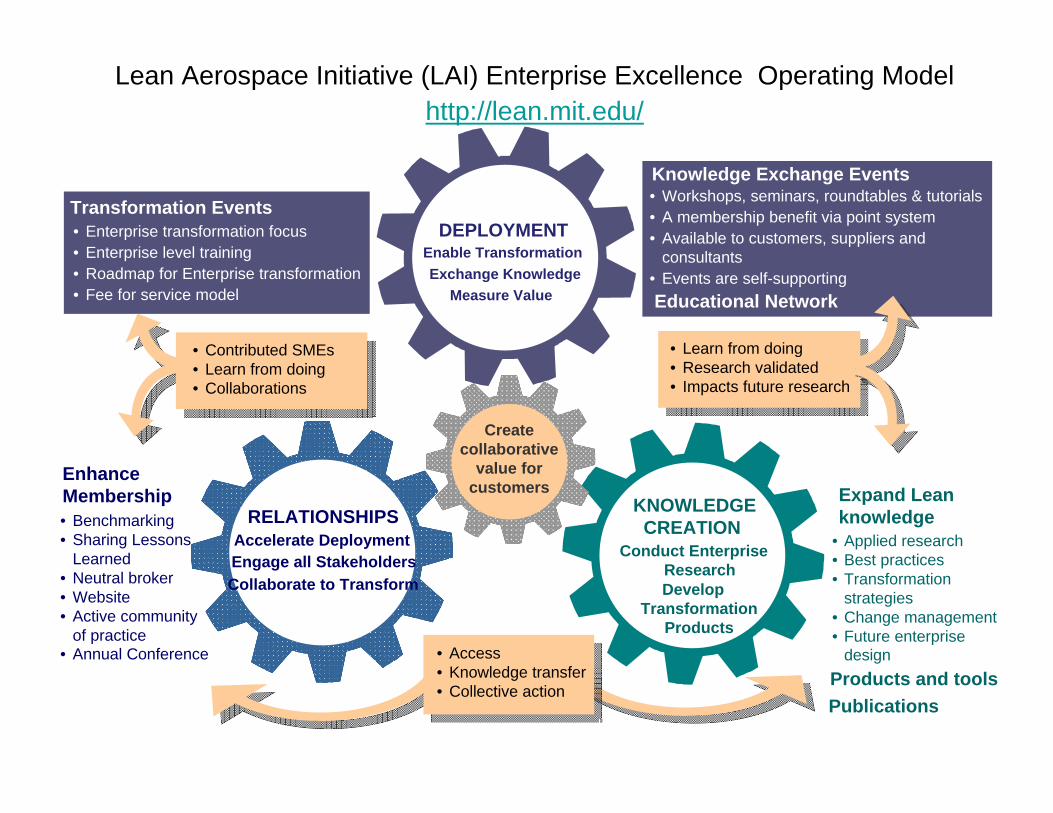
• Workshops, seminars, roundtables & tutorials• A membership benefit via point system• Available to customers, suppliers and
consultants • Events are self-supporting
• Enterprise transformation focus• Enterprise level training• Roadmap for Enterprise transformation• Fee for service model
Products and tools
• Applied research• Best practices• Transformation
strategies• Change management• Future enterprise
design
• Benchmarking• Sharing Lessons
Learned• Neutral broker• Website• Active community
of practice• Annual Conference
Lean Aerospace Initiative (LAI) Enterprise Excellence Operating Modelhttp://lean.mit.edu/
• Contributed SMEs• Learn from doing• Collaborations
Conduct Enterprise Research
KNOWLEDGE CREATION
Enable Transformation
Accelerate DeploymentRELATIONSHIPS
DEPLOYMENT
Createcollaborative
value for customers
• Learn from doing • Research validated• Impacts future research
Transformation Events
Knowledge Exchange Events
Exchange Knowledge
Develop Transformation
Products
Collaborate to TransformEngage all Stakeholders
Educational Network
Publications
Expand Lean knowledge
EnhanceMembership
• Access• Knowledge transfer• Collective action
Measure Value
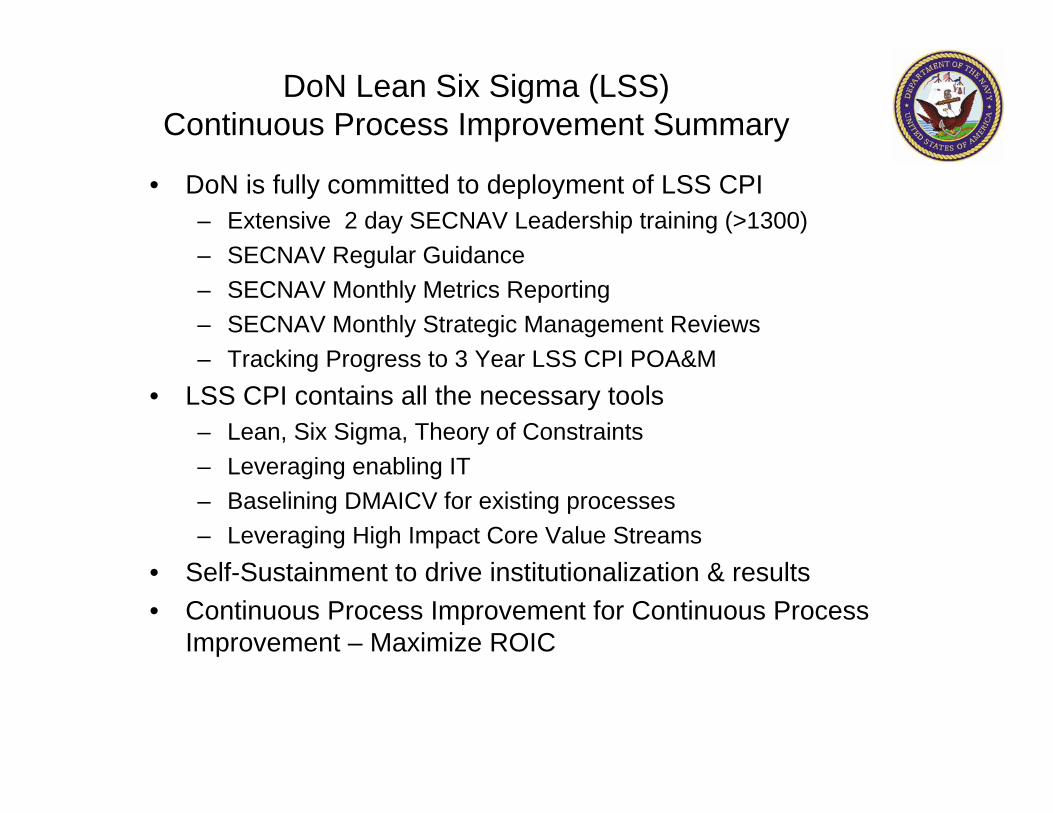
DoN Lean Six Sigma (LSS) Continuous Process Improvement Summary
• DoN is fully committed to deployment of LSS CPI– Extensive 2 day SECNAV Leadership training (>1300)– SECNAV Regular Guidance– SECNAV Monthly Metrics Reporting– SECNAV Monthly Strategic Management Reviews– Tracking Progress to 3 Year LSS CPI POA&M
• LSS CPI contains all the necessary tools– Lean, Six Sigma, Theory of Constraints– Leveraging enabling IT– Baselining DMAICV for existing processes– Leveraging High Impact Core Value Streams
• Self-Sustainment to drive institutionalization & results• Continuous Process Improvement for Continuous Process
Improvement – Maximize ROIC
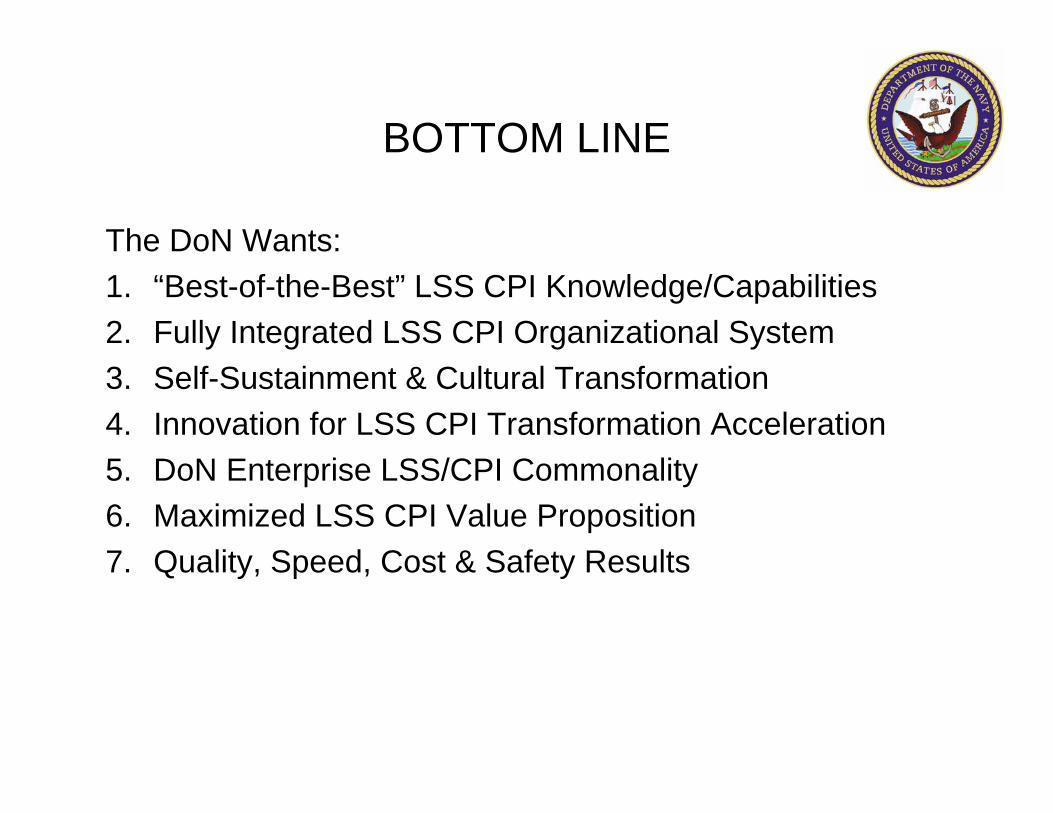
BOTTOM LINE
The DoN Wants:1. “Best-of-the-Best” LSS CPI Knowledge/Capabilities2. Fully Integrated LSS CPI Organizational System3. Self-Sustainment & Cultural Transformation4. Innovation for LSS CPI Transformation Acceleration5. DoN Enterprise LSS/CPI Commonality6. Maximized LSS CPI Value Proposition7. Quality, Speed, Cost & Safety Results
DoN Lean Six Sigma (LSS) Continuous Process Improvement (CPI)
Go to: a) www.navair.navy.mil
b) DOING BUSINESS WITH US
c) OPEN SOLICITATIONS
d) N00421-07-R-0012DoN LSS CPI
Breaking the Barriers to Productivity & Effectiveness
for our Sailors & Marines
QUESTIONS?

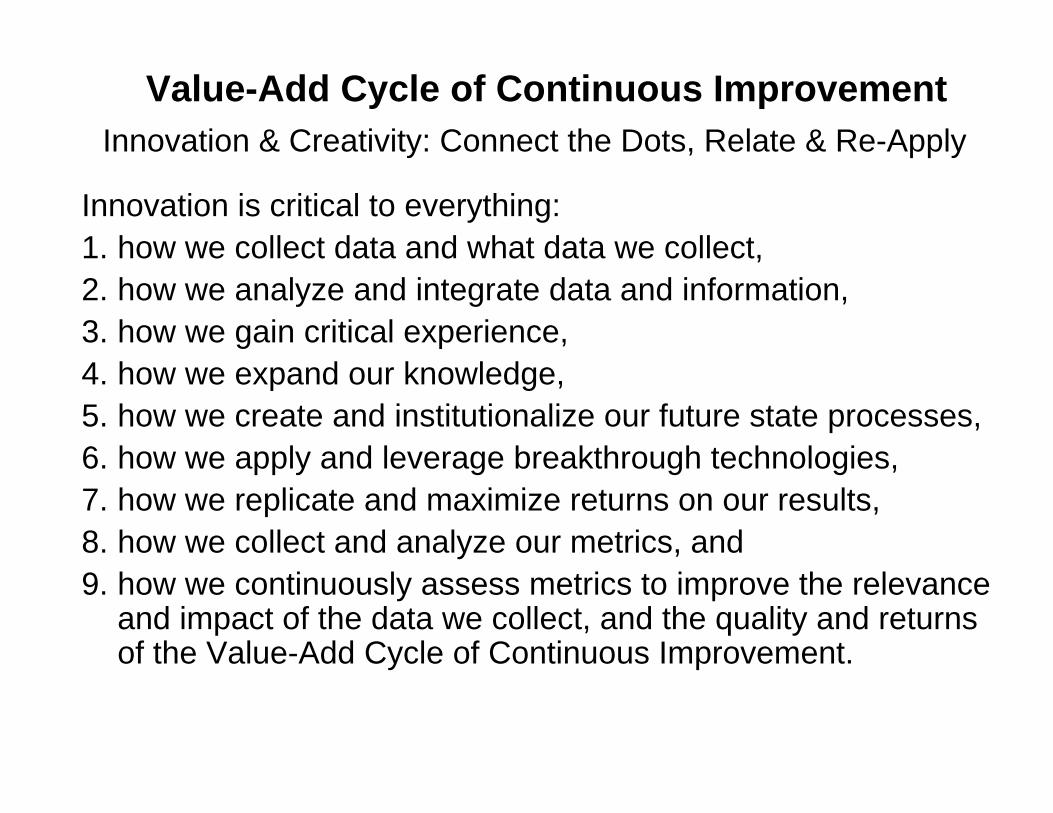
Innovation & Creativity: Connect the Dots, Relate & Re-Apply
Innovation is critical to everything: 1. how we collect data and what data we collect, 2. how we analyze and integrate data and information, 3. how we gain critical experience, 4. how we expand our knowledge, 5. how we create and institutionalize our future state processes, 6. how we apply and leverage breakthrough technologies, 7. how we replicate and maximize returns on our results, 8. how we collect and analyze our metrics, and9. how we continuously assess metrics to improve the relevance
and impact of the data we collect, and the quality and returns of the Value-Add Cycle of Continuous Improvement.
Value-Add Cycle of Continuous Improvement
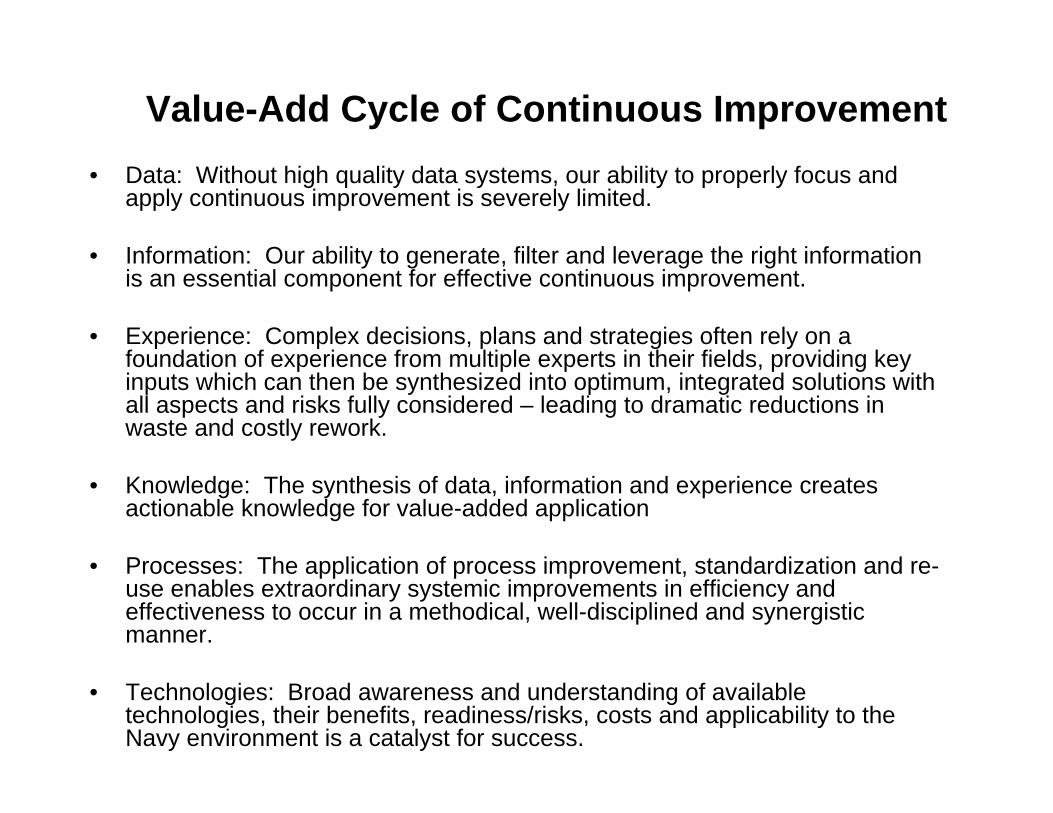
• Data: Without high quality data systems, our ability to properly focus and apply continuous improvement is severely limited.
• Information: Our ability to generate, filter and leverage the right information is an essential component for effective continuous improvement.
• Experience: Complex decisions, plans and strategies often rely on a foundation of experience from multiple experts in their fields, providing key inputs which can then be synthesized into optimum, integrated solutions with all aspects and risks fully considered – leading to dramatic reductions in waste and costly rework.
• Knowledge: The synthesis of data, information and experience creates actionable knowledge for value-added application
• Processes: The application of process improvement, standardization and re-use enables extraordinary systemic improvements in efficiency and effectiveness to occur in a methodical, well-disciplined and synergistic manner.
• Technologies: Broad awareness and understanding of available technologies, their benefits, readiness/risks, costs and applicability to the Navy environment is a catalyst for success.
Value-Add Cycle of Continuous Improvement
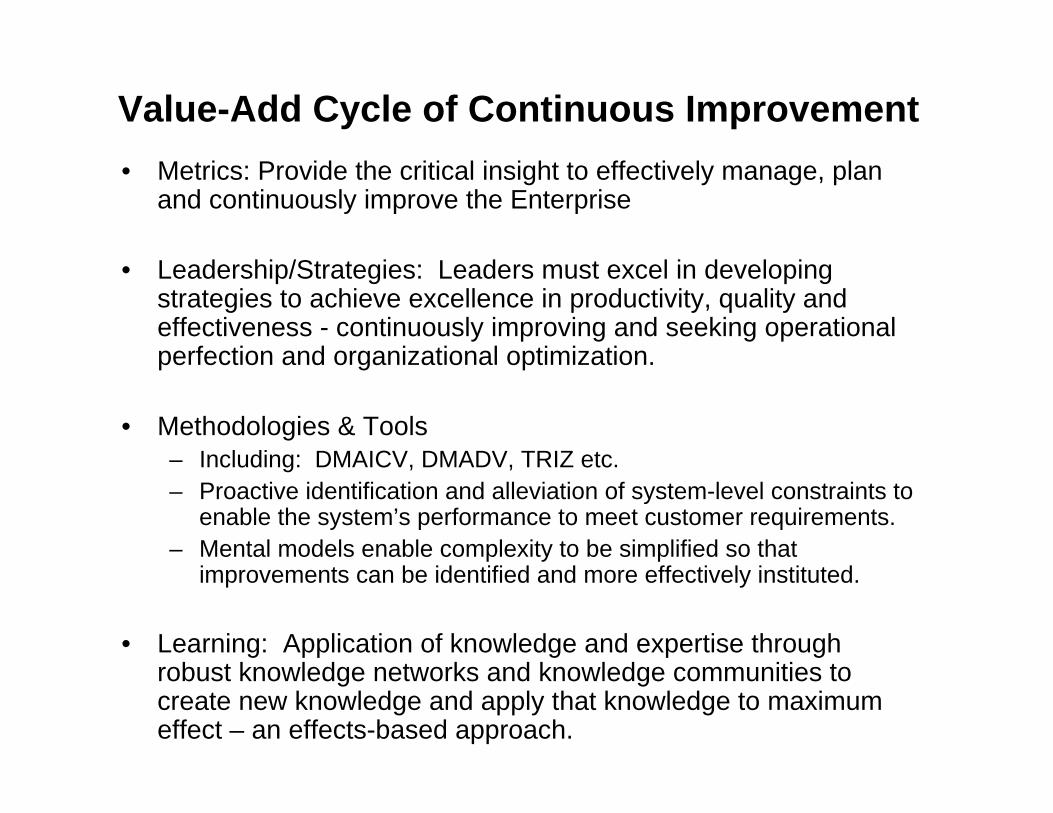
• Metrics: Provide the critical insight to effectively manage, plan and continuously improve the Enterprise
• Leadership/Strategies: Leaders must excel in developing strategies to achieve excellence in productivity, quality and effectiveness - continuously improving and seeking operational perfection and organizational optimization.
• Methodologies & Tools – Including: DMAICV, DMADV, TRIZ etc.– Proactive identification and alleviation of system-level constraints to
enable the system’s performance to meet customer requirements. – Mental models enable complexity to be simplified so that
improvements can be identified and more effectively instituted.
• Learning: Application of knowledge and expertise through robust knowledge networks and knowledge communities to create new knowledge and apply that knowledge to maximum effect – an effects-based approach.
Value-Add Cycle of Continuous Improvement
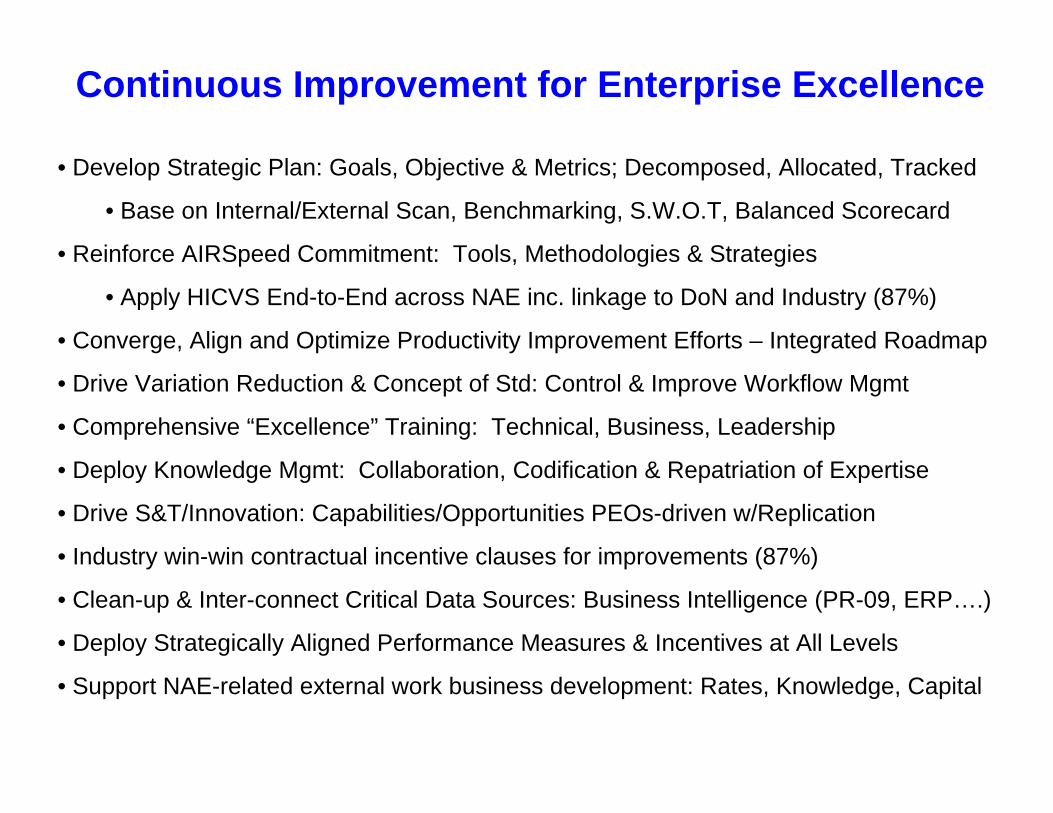
• Develop Strategic Plan: Goals, Objective & Metrics; Decomposed, Allocated, Tracked
• Base on Internal/External Scan, Benchmarking, S.W.O.T, Balanced Scorecard
• Reinforce AIRSpeed Commitment: Tools, Methodologies & Strategies
• Apply HICVS End-to-End across NAE inc. linkage to DoN and Industry (87%)
• Converge, Align and Optimize Productivity Improvement Efforts – Integrated Roadmap
• Drive Variation Reduction & Concept of Std: Control & Improve Workflow Mgmt
• Comprehensive “Excellence” Training: Technical, Business, Leadership
• Deploy Knowledge Mgmt: Collaboration, Codification & Repatriation of Expertise
• Drive S&T/Innovation: Capabilities/Opportunities PEOs-driven w/Replication
• Industry win-win contractual incentive clauses for improvements (87%)
• Clean-up & Inter-connect Critical Data Sources: Business Intelligence (PR-09, ERP….)
• Deploy Strategically Aligned Performance Measures & Incentives at All Levels
• Support NAE-related external work business development: Rates, Knowledge, Capital
Continuous Improvement for Enterprise Excellence
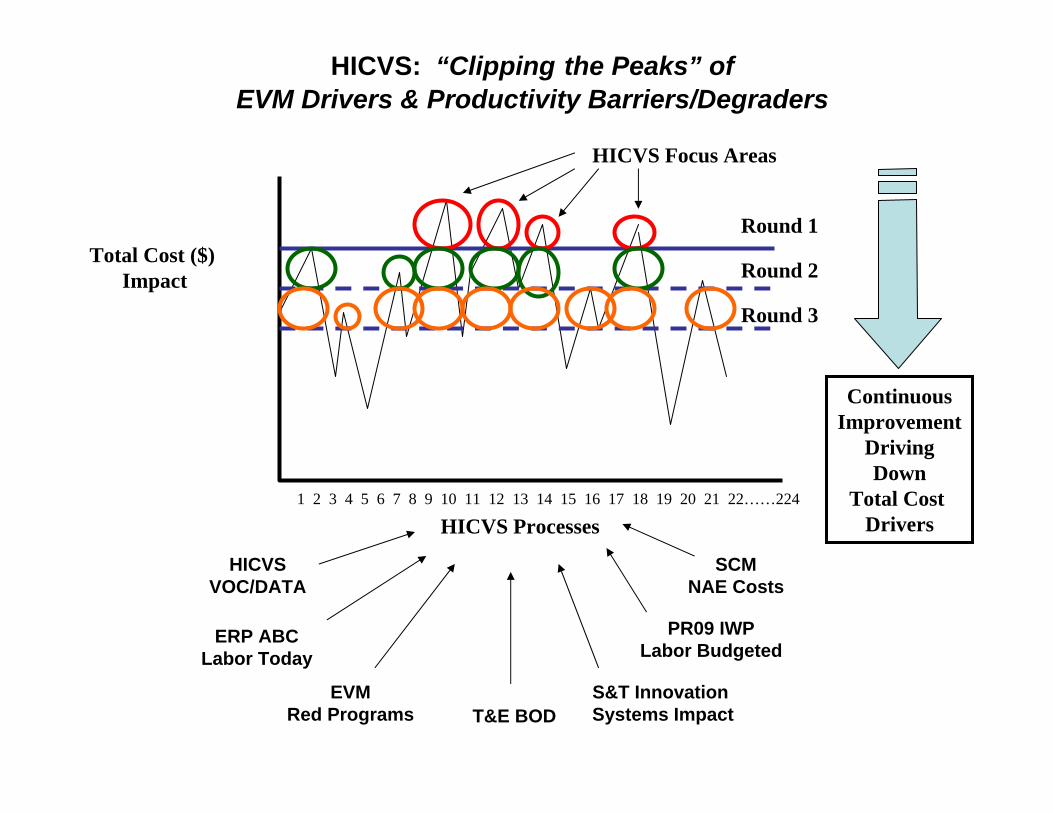
HICVS: “Clipping the Peaks” of EVM Drivers & Productivity Barriers/Degraders
1 2 3 4 5 6 7 8 9 10 11 12 13 14 15 16 17 18 19 20 21 22……224
Total Cost ($) Impact
Round 1
Round 2
Round 3
ContinuousImprovement
DrivingDown
Total Cost DriversHICVS Processes
HICVS Focus Areas
HICVSVOC/DATA
EVMRed Programs T&E BOD
S&T Innovation Systems Impact
ERP ABCLabor Today
PR09 IWPLabor Budgeted
SCMNAE Costs
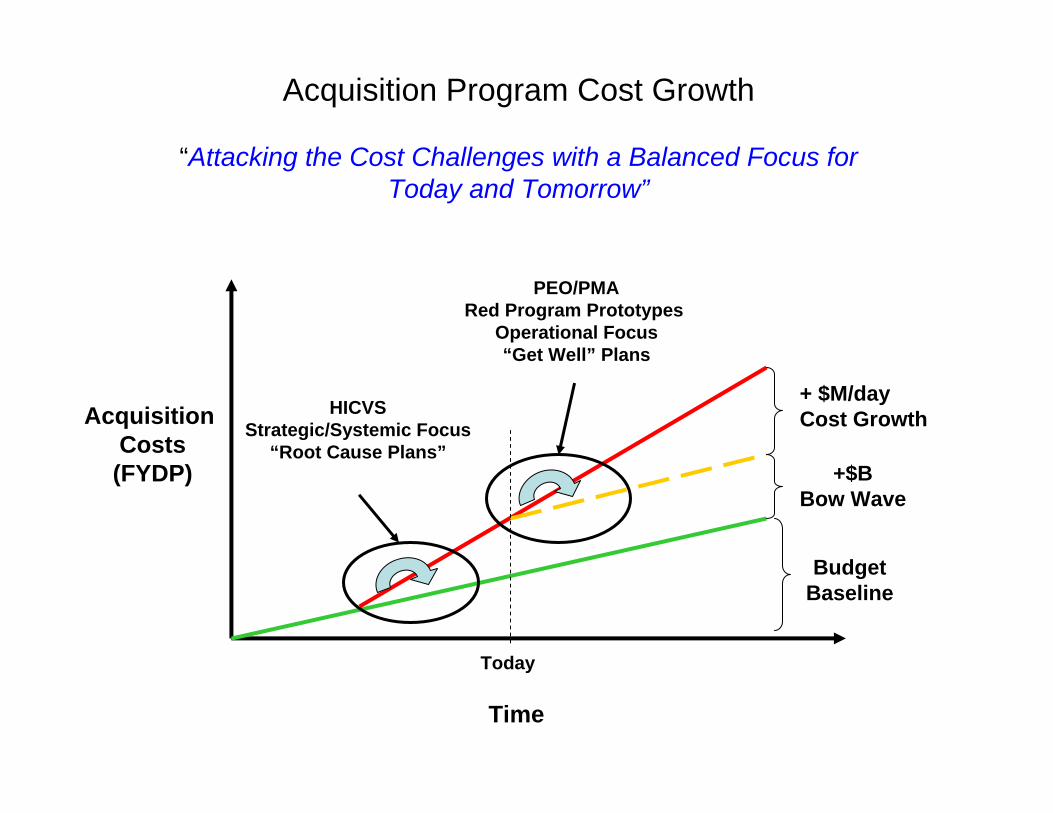
Acquisition Program Cost Growth
“Attacking the Cost Challenges with a Balanced Focus for Today and Tomorrow”
+$BBow Wave
+ $M/day Cost GrowthAcquisition
Costs(FYDP)
PEO/PMARed Program Prototypes
Operational Focus“Get Well” Plans
HICVSStrategic/Systemic Focus
“Root Cause Plans”
Time
Today
BudgetBaseline
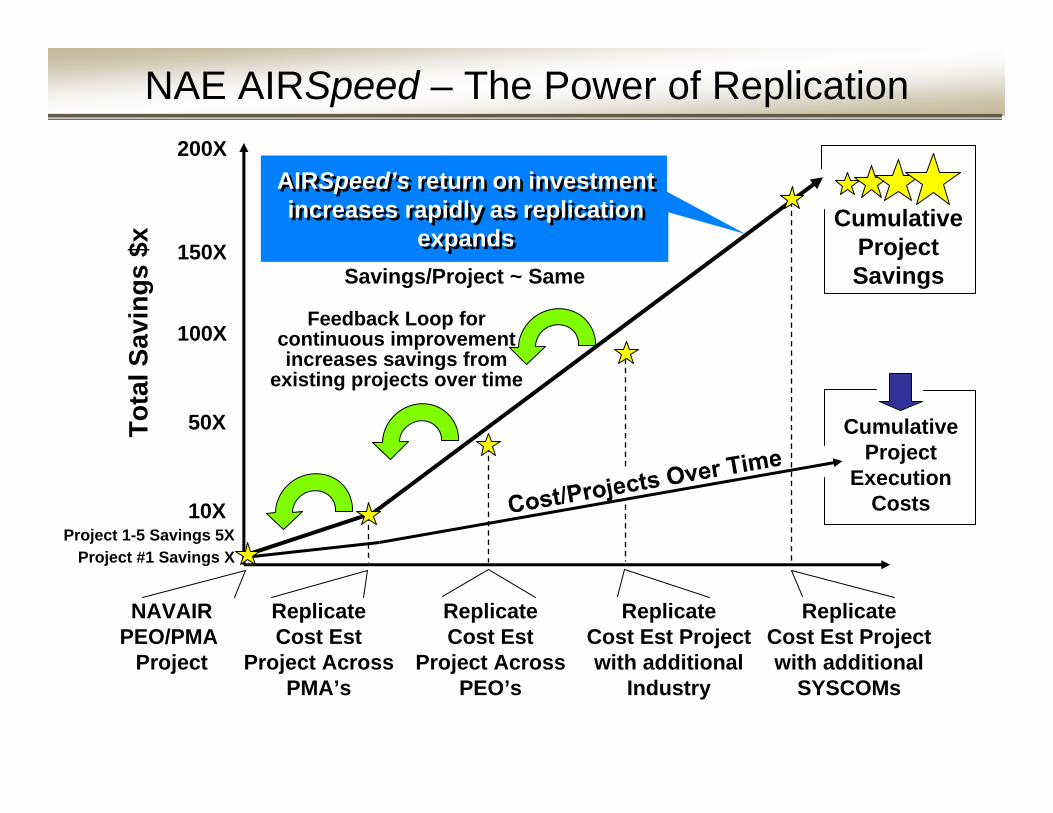
NAE AIRSpeed – The Power of ReplicationTo
tal S
avin
gs $
x
Project #1 Savings X
200X
150X
100X
50X
10XProject 1-5 Savings 5X
Cumulative Project
Execution Costs
AIRSpeed’s return on investmentincreases rapidly as replication
expands
AIRSpeed’s return on investmentincreases rapidly as replication
expandsCumulative
Project SavingsSavings/Project ~ Same
NAVAIRPEO/PMA
Project
ReplicateCost Est
Project AcrossPMA’s
Feedback Loop for continuous improvementincreases savings from
existing projects over time
ReplicateCost Est Projectwith additional
Industry
ReplicateCost Est
Project AcrossPEO’s
ReplicateCost Est Projectwith additional
SYSCOMs
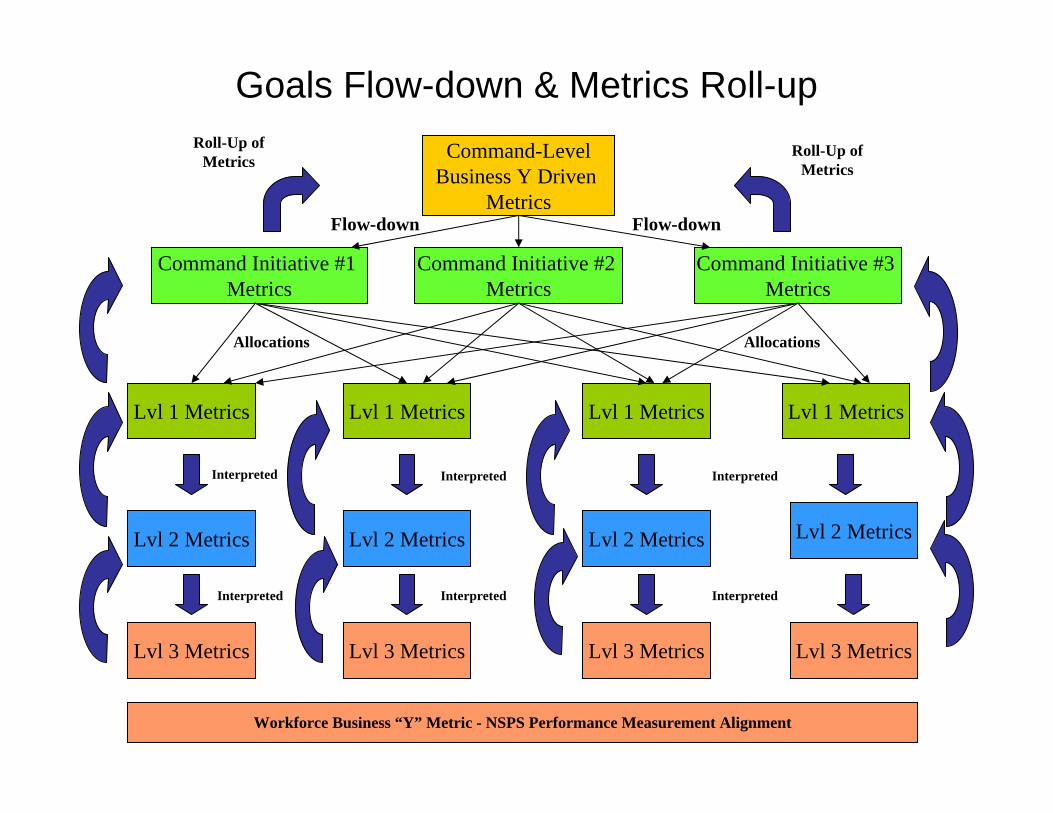
Goals Flow-down & Metrics Roll-upCommand-Level
Business Y Driven Metrics
Lvl 1 Metrics Lvl 1 Metrics Lvl 1 Metrics Lvl 1 Metrics
Command Initiative #1 Metrics
Command Initiative #2 Metrics
Command Initiative #3 Metrics
Lvl 2 Metrics Lvl 2 Metrics Lvl 2 Metrics Lvl 2 Metrics
Lvl 3 Metrics Lvl 3 Metrics Lvl 3 Metrics Lvl 3 Metrics
Roll-Up ofMetrics
Roll-Up ofMetrics
Flow-down Flow-down
Interpreted
InterpretedInterpreted
Interpreted Interpreted
Interpreted
Workforce Business “Y” Metric - NSPS Performance Measurement Alignment
Allocations Allocations
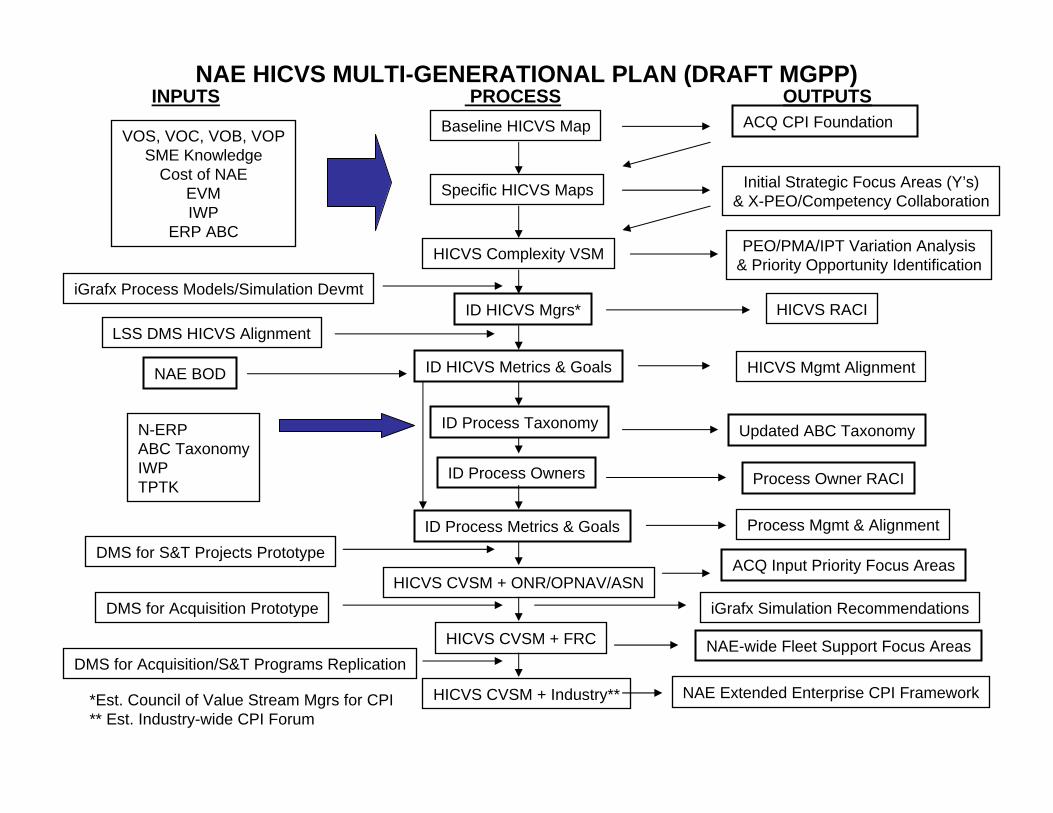
NAE HICVS MULTI-GENERATIONAL PLAN (DRAFT MGPP)
Baseline HICVS Map
Specific HICVS Maps
HICVS Complexity VSM
HICVS CVSM + ONR/OPNAV/ASN
HICVS CVSM + FRC
HICVS CVSM + Industry**
ID HICVS Mgrs*
ID Process Taxonomy
ID Process Owners
ID HICVS Metrics & Goals
ID Process Metrics & Goals
VOS, VOC, VOB, VOPSME Knowledge
Cost of NAEEVMIWP
ERP ABC
INPUTS PROCESS OUTPUTS
Initial Strategic Focus Areas (Y’s)& X-PEO/Competency Collaboration
PEO/PMA/IPT Variation Analysis& Priority Opportunity Identification
HICVS RACI
HICVS Mgmt Alignment
Process Owner RACI
Updated ABC Taxonomy
Process Mgmt & Alignment
ACQ Input Priority Focus Areas
NAE-wide Fleet Support Focus Areas
NAE Extended Enterprise CPI Framework
ACQ CPI Foundation
*Est. Council of Value Stream Mgrs for CPI** Est. Industry-wide CPI Forum
LSS DMS HICVS Alignment
DMS for S&T Projects Prototype
DMS for Acquisition Prototype
DMS for Acquisition/S&T Programs Replication
N-ERPABC TaxonomyIWPTPTK
iGrafx Process Models/Simulation Devmt
NAE BOD
iGrafx Simulation Recommendations
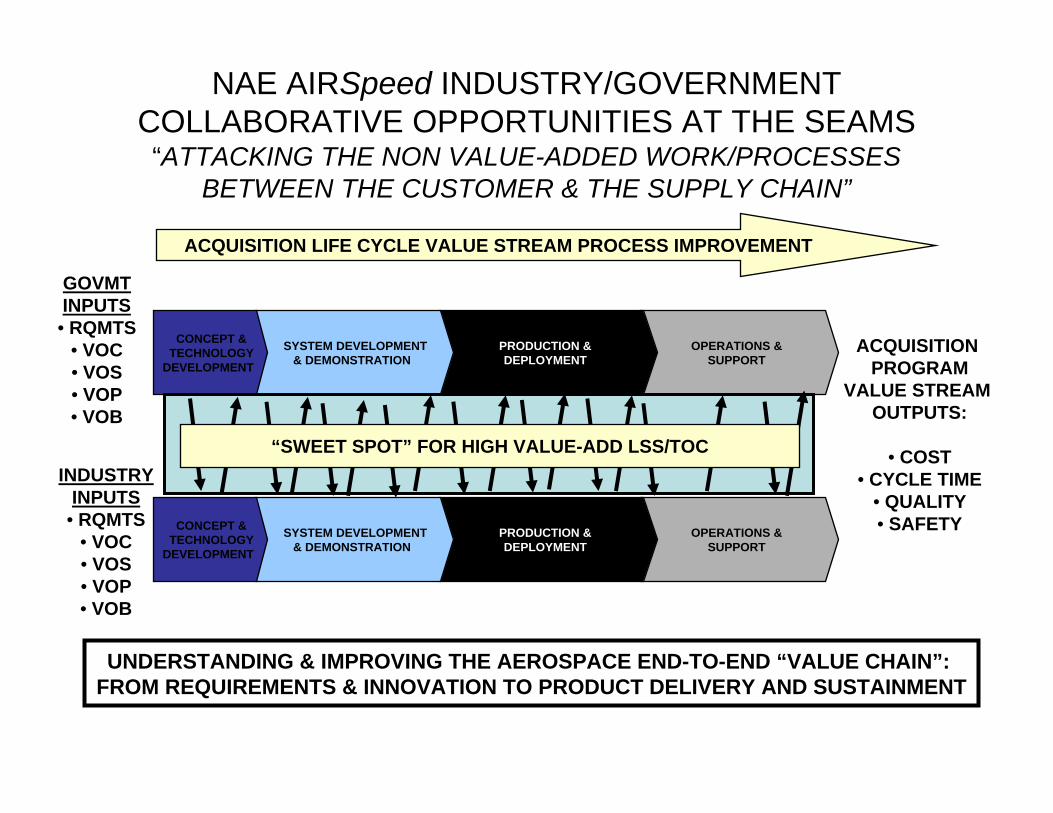
NAE AIRSpeed INDUSTRY/GOVERNMENT COLLABORATIVE OPPORTUNITIES AT THE SEAMS“ATTACKING THE NON VALUE-ADDED WORK/PROCESSES
BETWEEN THE CUSTOMER & THE SUPPLY CHAIN”
OPERATIONS &SUPPORT
PRODUCTION &DEPLOYMENT
SYSTEM DEVELOPMENT& DEMONSTRATION
CONCEPT &TECHNOLOGY
DEVELOPMENT
GOVMTINPUTS• RQMTS
• VOC• VOS• VOP• VOB
OPERATIONS &SUPPORT
PRODUCTION &DEPLOYMENT
SYSTEM DEVELOPMENT& DEMONSTRATION
CONCEPT &TECHNOLOGY
DEVELOPMENT
INDUSTRYINPUTS
• RQMTS• VOC• VOS• VOP• VOB
ACQUISITION PROGRAM
VALUE STREAM OUTPUTS:
• COST• CYCLE TIME
• QUALITY• SAFETY
ACQUISITION LIFE CYCLE VALUE STREAM PROCESS IMPROVEMENT
“SWEET SPOT” FOR HIGH VALUE-ADD LSS/TOC
UNDERSTANDING & IMPROVING THE AEROSPACE END-TO-END “VALUE CHAIN”: FROM REQUIREMENTS & INNOVATION TO PRODUCT DELIVERY AND SUSTAINMENT