achievement gaps in early education eugene e garcia, ph.d. · achievement gaps in early education....
TRANSCRIPT

Achievement Gaps in Early Education
Eugene E Garcia, Ph.D.

NickelodeonNickelodeon’’s s bilingual Dora the bilingual Dora the Explorer is the Explorer is the No. 2 preNo. 2 pre--school school show on show on commercial TV.commercial TV.
SabSabííasas QueQue…… (Did you know(Did you know……))

According to Hallmark Cards, According to Hallmark Cards, pipiññatas are now the 2atas are now the 2ndnd most most popular party favorpopular party favor……balloons balloons #1.#1.
SabSabííasas QueQue……

HispanicsHispanicsFrom the General to the SpecificsFrom the General to the Specifics

A Growing PopulationA Growing Population
Between the 1960Between the 1960’’s and 2005, the Latino s and 2005, the Latino population in the United States grew 400% * population in the United States grew 400% * Hispanic children under age 5 amounted to 4.2 Hispanic children under age 5 amounted to 4.2 million or 21 percent of the total US population million or 21 percent of the total US population under 5 years old. (18%, ages 4under 5 years old. (18%, ages 4--19)19)

Specific Specific (country of (country of origin, origin, generation generation status, English status, English language language proficiency, proficiency, etc.) etc.) demographic demographic trends of the trends of the Hispanic child Hispanic child population.population.

Demographics: Our YoungestDemographics: Our Youngest–– New BornNew Born
–– 24% of US babies born in 2005 were Hispanic24% of US babies born in 2005 were Hispanic–– This totals 912,329; up from 593,073 in 1990;This totals 912,329; up from 593,073 in 1990;
a 53% increasea 53% increase–– Hispanic new Hispanic new bornsborns are highly concentrated yet are highly concentrated yet
disperseddispersed50% born in two states (CA and TX)50% born in two states (CA and TX)75% born in eight states75% born in eight statesYet, in 25 states, 10% born to Hispanic mothersYet, in 25 states, 10% born to Hispanic mothers
–– 46% born to single mothers (18.4% in 1980)46% born to single mothers (18.4% in 1980)–– 47% born to mothers with less than a high school 47% born to mothers with less than a high school
education (54% in 1980)education (54% in 1980)–– 63% born to mothers born outside the US (32% in 63% born to mothers born outside the US (32% in
1980)1980)–– 73% Mexican origin (66% in 1980)73% Mexican origin (66% in 1980)

Demographics: DistributionDemographics: Distribution
–AGES 0-8 YEARS OLD–1 out of 5 children in the US is Hispanic–Hispanics are diverse in their national origin
68% Mexican origin8.5% Puerto Rican origin7.0% Central American origin5.7% South American origin2.7% Dominican origin2.5% Cuban origin
5.6% Other

Demographics: DistributionDemographics: Distribution
–AGES 0-8 YEARS OLD–Dispersed and Highly Concentrated
79% of Hispanic children live in nine states25 other states contain 10% or more
–62.3% live in immigrant Hispanic families— 90% are US born
–10% living in immigrant households are themselves foreign born – i.e., 1st generation

–Home language at 9- months:
34% primarily Spanish with English22% primarily English with Spanish19% Spanish only21% English only & 4% other75% are influenced by 75% are influenced by SpanishSpanish
Demographics: LanguageDemographics: Language
Specific academic Specific academic achievement achievement trajectories of trajectories of Hispanic children Hispanic children from kindergarten from kindergarten through third grade through third grade by SES, English by SES, English language language proficiency, national proficiency, national origin, and origin, and generational status.generational status.

Selected ECLS-K Math and Reading
Data for Kindergarten and the Third
Grade

Math Proficiency Levels
• Level 1: Number and shape• Level 2: Relative size• Level 3: Ordinality and sequence• Level 4: Addition and subtraction• Level 5: Multipication and division• Level 6: Place value• Level 7: Rate and measurement
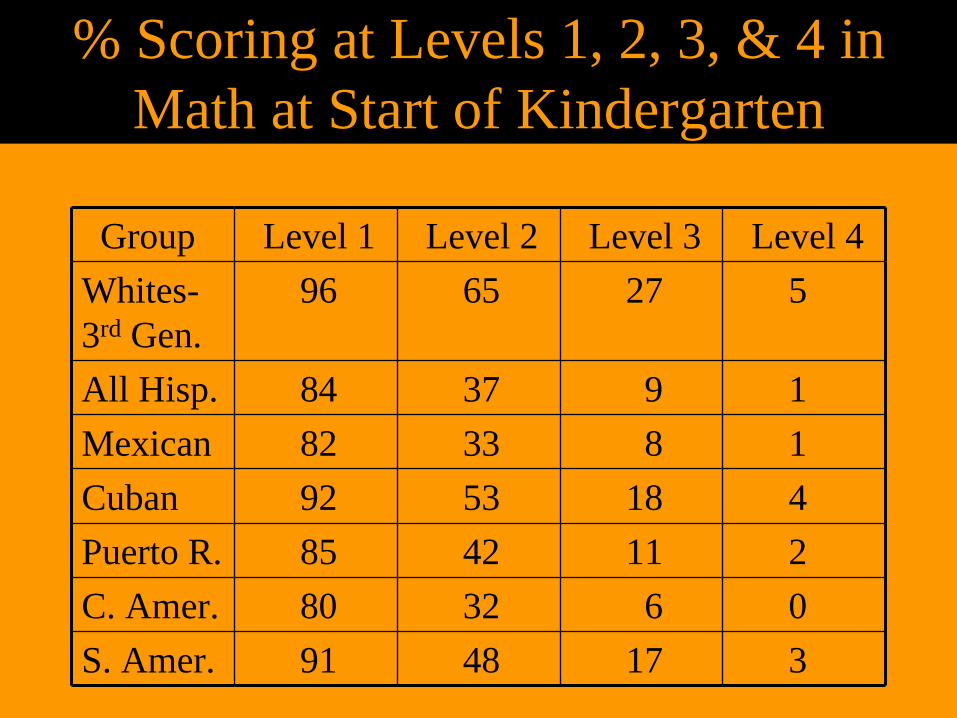
Group Level 1 Level 2 Level 3 Level 4Whites- 3rd Gen.
96 65 27 5
All Hisp. 84 37 9 1 Mexican 82 33 8 1 Cuban 92 53 18 4 Puerto R. 85 42 11 2 C. Amer. 80 32 6 0 S. Amer. 91 48 17 3
% Scoring at Levels 1, 2, 3, & 4 in Math at Start of Kindergarten

% Scoring at Levels 1, 2, 3, & 4 in Math at Start Kindergarten by Mexican Generation
Group Level 1 Level 2 Level 3 Level 4
Whites- 3rd Gen.
96 65 27 5
Mexican- 1st Gen.
78 27 4 0
Mexican- 2nd Gen.
78 27 5 1
Mexican- 3rd Gen.
90 46 14 2

Group Level 4 Level 5 Level 6 Level 7Whites- 3rd Gen.
98 84 49 19
All Hisp. 95 67 28 9Mexican 95 66 25 7Cuban 99 85 53 22Puerto R. 94 68 33 10C. Amer. 96 70 26 8S. Amer. 97 77 41 19
% Scoring at Levels 4, 5, 6, & 7 in Math at End of Third Grade

% Scoring at Levels 4, 5, 6, & 7 in Math at End of Third Grade by Mexican Generation
Group Level 4 Level 5 Level 6 Level 7
Whites- 3rd Gen.
98 84 49 19
Mexican- 1st Gen.
94 59 20 8
Mexican- 2nd Gen.
94 63 21 5
Mexican- 3rd Gen.
97 75 35 10

Reading Proficiency Levels
• Level 1: Letter recognition• Level 2: Beginning sounds• Level 3: Ending sounds• Level 4: Sight words• Level 5: Comprehension of words in context• Level 6: Literal inference• Level 7: Extrapolation• Level 8: Evaluation
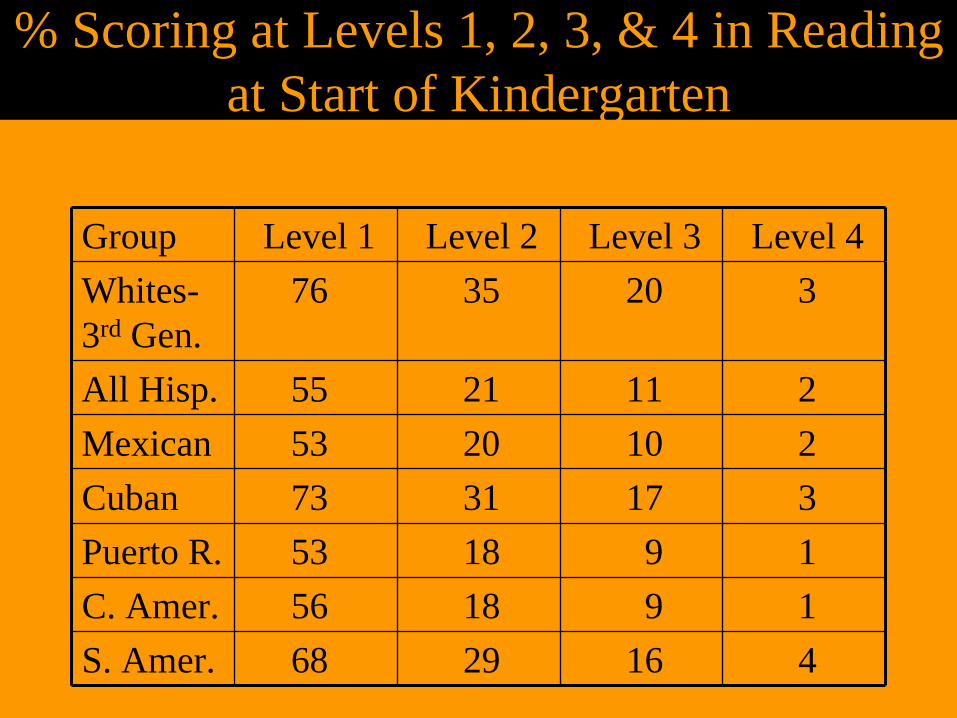
% Scoring at Levels 1, 2, 3, & 4 in Reading at Start of Kindergarten
Group Level 1 Level 2 Level 3 Level 4Whites- 3rd Gen.
76 35 20 3
All Hisp. 55 21 11 2 Mexican 53 20 10 2 Cuban 73 31 17 3 Puerto R. 53 18 9 1C. Amer. 56 18 9 1S. Amer. 68 29 16 4

% Scoring at Levels 1, 2, 3 & 4 in Reading at Start of Third Grade by Mexican Generation
Group Level 1 Level 2 Level 3 Level 4
Whites- 3rd Gen.
76 35 20 3
Mexican- 1st Gen.
46 22 12 3
Mexican- 2nd Gen.
44 14 7 1
Mexican- 3rd Gen.
61 25 14 2

% Scoring at Levels 5, 6, 7 & 8 in Reading at End of Third Grade
Group Level 5 Level 6 Level 7 Level 8Whites- 3rd Gen.
96 83 53 33
All Hisp. 89 63 30 18Mexican 88 59 25 15Cuban 97 87 52 31Puerto R. 89 63 32 21C. Amer. 91 68 31 18S. Amer. 96 79 43 27

% Scoring at Levels 5, 6, 7 & 8 in Reading at End of Third Grade by Mexican Generation
Group Level 5 Level 6 Level 7 Level 8
Whites- 3rd Gen.
96 83 53 33
Mexican- 1st Gen.
77 46 18 12
Mexican- 2nd Gen.
86 53 20 12
Mexican- 3rd Gen.
94 75 38 22


ECLS-K
Longitudinal ECLS-K Data by SES and Race/Ethnic Group

-1.5
-1.0
-0.5
0.0
0.5
Sta
ndar
d D
evia
tions
Bel
ow W
hite
s
FK SK F1 S1 S3 FK SK F1 S1 S3 FK SK F1 S1 S3 FK SK F1 S1 S3 FK SK F1 S1 S3
SES Q1 (Low) SES Q2 SES Q3 SES Q4 SES Q5 (High)
Hispanic Smoothed Population Gap Trend
Black Smoothed Population Gap Trend
Trends in Estimated Within-SES Quintile Math Gaps,by SES Quintile and Race/Ethnic Group

-1.5
-1.0
-0.5
0.0
0.5
Sta
ndar
d D
evia
tions
Bel
ow W
hite
s
FK SK F1 S1 S3 FK SK F1 S1 S3 FK SK F1 S1 S3 FK SK F1 S1 S3 FK SK F1 S1 S3
SES Q1 (Low) SES Q2 SES Q3 SES Q4 SES Q5 (High)
Hispanic Smoothed Population Gap Trend
Black Smoothed Population Gap Trend
Trends in Estimated Within-SES Quintile Reading Gaps,by SES Quintile and Race/Ethnic Group

SUMMARYSUMMARY–– Throughout KThroughout K--3 there are 3 there are
sustained achievement sustained achievement differences between Hispanic differences between Hispanic subgroups by country of subgroups by country of origin.origin.
–– Children of Cuban origin, Children of Cuban origin, followed by those from South followed by those from South American origin, fare the best American origin, fare the best in reading and mathematics in reading and mathematics (K(K--3) and score as well as 3) and score as well as Whites in third grade reading Whites in third grade reading and slightly higher than and slightly higher than Whites in third grade Whites in third grade mathematics. mathematics.
HispanicHispanic KK--3 Achievement Trajectories3 Achievement Trajectories

SUMMARYSUMMARY
– Children from Mexican and Central American score lowest in reading and in mathematics at the start of kindergarten
– At 3rd grade children of Mexican origin score the lowest in math and reading—generational status important.
HispanicHispanic KK--3 Achievement Trajectories3 Achievement Trajectories

Effects of Tulsa PreEffects of Tulsa Pre--K Program by K Program by Race/Ethnicity of StudentRace/Ethnicity of Student
53%
79%
49%52%
29%
39%
20%n.s.
26%21%
54%
35%
6%n.s.
0%
10%
20%
30%
40%
50%
60%
70%
80%
90%
Black His panic Native Am erican White
Race/Ethnicity of Student
Test
Sco
re G
ains
Letter-Word Identification
SpellingApplied Problem s
n.s . = not s ignificant
Students of divers e races and ethnicities benefit from the Tuls a pre-K program .

Age-Equivalent Test Scores for Children Exposed to Tulsa Pre-K
5-2
5-04-9
4-74-6
4-5
4-0
4-2
4-4
4-6
4-8
5-0
5-2
5-4
Letter-Word Identif ication Spelling Applied Problems
Test
Age
Pre-KNo Pre-K
Note: Age-equivalent scores are expressed in years and months.
Students in Tulsa pre-K advance several months beyond other students.

RECENT PUBLICATIONS
Garcia, E. and Gonzalez, D. M. (2006) Pre-k and Latinos. Pre-K Now Research Series. Washington , DC: www.preknow.org.
Garcia, E. and Jensen, B. (2007) Helping Young Hispanic Learners. Educational Leadership, 64, #6, pp. 34-39.
National Task Force on Early Childhood Education for National Task Force on Early Childhood Education for Hispanics*Hispanics*
www.ecehispanic.orgwww.ecehispanic.org
La ComisiLa Comisióón Nacional para la Educacin Nacional para la Educacióón de la Nin de la Niññez ez HispanaHispana

Specific Task Force Analyses: Specific Task Force Analyses: Initial FindingsInitial Findings
PREGUNTAS?PREGUNTAS?

Eugene E. Garcia, Ph.D.
Office of the Vice President, Ed. Partnerships
Arizona State UniversityP.O. Box 870211
Tempe, AZ 85287-0211
E-Mail: [email protected]
URL http://www.ecehispanic.org