achievements and challenges in financing uhc in thailand phusit prakongsai, md. ph.d. supon...
TRANSCRIPT

Achievements and challenges in financing UHC in Thailand
Phusit Prakongsai, MD. Ph.D.Supon Limwattananon, Bsc. Ph.D.
Viroj Tangcharoensathien, MD. Ph.D.Wilailuk Wisasa, Bsc. Msc.
International Health Policy Program (IHPP)Ministry of Public Health, Thailand
Regional Forum on Health Care FinancingPhnom Penh, Cambodia
2-4 May 2012

Inte
rna
tio
na
l H
ea
lth
Po
lic
y P
rog
ram
-T
ha
ila
nd
Inte
rnati
onal H
ealt
h P
olic
y P
rogra
m -
Thaila
nd
Outline of presentation
• Health financing arrangements of universal health coverage (UHC) in Thailand
• Achievements after achieving UHC– Equity improvements– Financial risk protection– Poverty reduction
• Key challenges in financing UHC in Thailand• Conclusions

1945
2000
2002
Informal user fee exemption
1980
1970
User fees
1-3rd NHP1962-76Provincial hospitals
Health Infrastructure extension--wide geographical coverage
Historical development of the Thai health system:
Infrastructure development + financial protection extension
1975LIC
1990
Establishment of prepayment schemes
1983CBHI
1980CSMBS
1990SSS
Universal Coverage
CSMBS
2002 full achieve
Universal Coverage
SSS
LIC MWS 1994Pub VHI
CSMBS
SSS
Expansion consolidation of prepayment schemes
4th -5th NHP (1977-86) District hospitalsHealth centers

Inte
rna
tio
na
l H
ea
lth
Po
lic
y P
rog
ram
-T
ha
ila
nd
Inte
rnati
onal H
ealt
h P
olic
y P
rogra
m -
Thaila
nd
How health care providers are paid by How health care providers are paid by
insurance ?insurance ?Financing sources and payment methods for CSMBS, UCS, and
SSS
Health care finance and service provision of Thailand after achieving universal coverage (UC)
General tax
General tax Standard Benefitpackage
Tripartite contributionsPayroll taxes
Risk relatedcontributions
CapitationCapitation & global
Co-payment budget with DRG for IP
Services
Fee for servicesFee for services - OP
Population Patients
Ministry of Finance - CSMBS(6 million beneficiaries)
National Health Insurance Office The UC scheme (47 millions of pop.)
Social Security Office - SSS(9 millions of formal employees)
Voluntary private insurance
Public & Private Contractor networks
Source: Tangcharoensathien et al. (2010)
Traditional FFS for OPDirect billing FFS(2006+) for OP
FFSuntil 2006, DRG for IP
Capitation for OP
DRG under global budget
Full capitation

5
Increased access to and utilization of health services with very low unmet needs
Prevalence of unmet need OP IP
National average 1.44% 0.4%
CSMBS 0.8% 0.26%
SSS 0.98% 0.2%
UCS 1.61% 0.45%
Source: NSO 2009 Panel SES, application of OECD unmet need definitions

Distribution of government subsidies for health:
BIA from 2001 to 2007
28%
31%
28%
29%
20%
22%
26%
24%
17%
15%
20%
20%
17%
16%
14%
14%
18%
15%
11%
12%
0% 20% 40% 60% 80% 100%
OP&IP
OP&IP
OP&IP
OP&IP
2544
2546
2549
2550
Quintile 1 Quintile 2 Quintile 3 Quintile 4 Quintile 5
More pro-poor health care system and distribution of government subsidies for health after achieving UHC in 2002
24%
1%9%
26%
1% 3%
24%
4%
6%
24%
7% 6%
18%
34% 21%
16%
38%
23%
11%
48% 55%
12%
35%
57%
0%
20%
40%
60%
80%
100%
UC SS CS UC SS CS
2003 2007
20% poorest Quintile 2 Quintile 3 Quintile 4 20% richest

7
Incidence of catastrophic health spending
OOP>10% total consumption expenditure
Source: Analysis of Socio-economic Survey (SES)

8
UHC achieved
Protection against health impoverishment

9
Sub-national health impoverishment 1996 to 2008
Per 100 households
0 – 0.5
0.6 – 1.0
1.1 – 2.0
2.1 – 3.0
3.1+
Per 100 households
0 – 0.5
0.6 – 1.0
1.1 – 2.0
2.1 – 3.0
3.1+
Per 100 households
0 – 0.5
0.6 – 1.0
1.1 – 2.0
2.1 – 3.0
3.1+
Per 100 households
0 – 0.5
0.6 – 1.0
1.1 – 2.0
2.1 – 3.0
3.1+
1996 1998 2000 2002
Per 100 households
0 – 0.5
0.6 – 1.0
1.1 – 2.0
2.1 – 3.0
3.1+
Per 100 households
0 – 0.5
0.6 – 1.0
1.1 – 2.0
2.1 – 3.0
3.1+
Per 100 households
0 – 0.5
0.6 – 1.0
1.1 – 2.0
2.1 – 3.0
3.1+
Per 100 households
0 – 0.5
0.6 – 1.0
1.1 – 2.0
2.1 – 3.0
3.1+
2004 2006 2007 2008
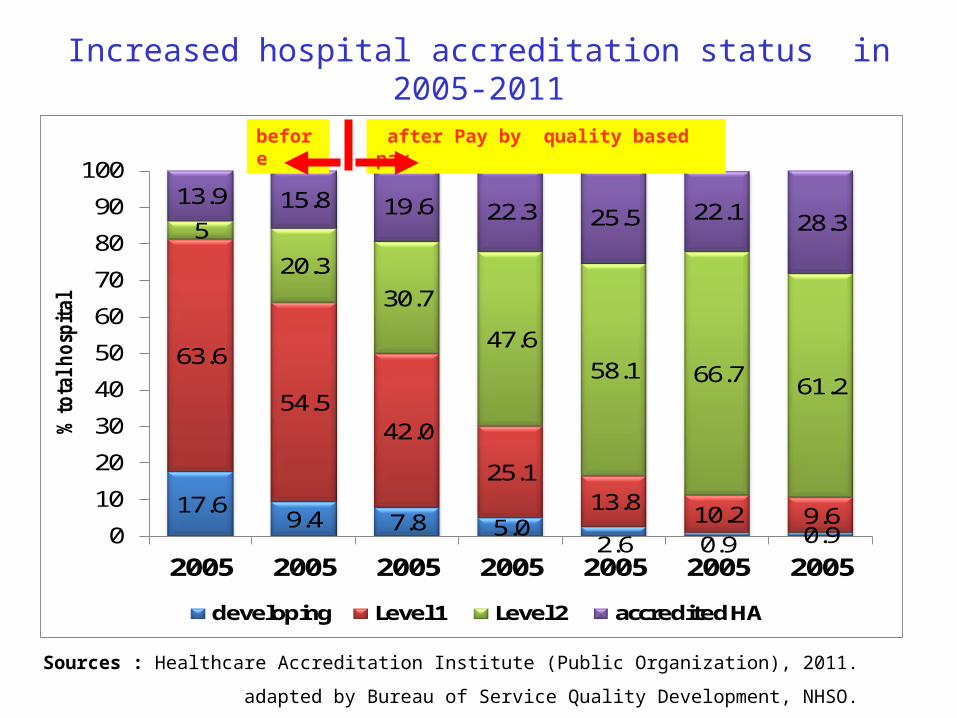
17.69.4 7.8 5.0
2.6 0.9 0.9
63.6
54.542.0
25.113.8 10.2 9.6
5
20.330.7
47.658.1 66.7 61.2
13.9 15.8 19.6 22.3 25.5 22.1 28.3
0
10
20
30
40
50
60
70
80
90
100
2005 2005 2005 2005 2005 2005 2005
% t
ota
l h
osp
ita
l
developing Level 1 Level 2 accredited HA
after Pay by quality based paybefore
หมายเหตุ� ปี 2554 เปี�นข้�อม�ล ณ ไตุรมาส 2Sources : Healthcare Accreditation Institute (Public Organization), 2011.
adapted by Bureau of Service Quality Development, NHSO.
Increased hospital accreditation status in 2005-2011

Starting
special pay
*54 = estimation from Aug. 2010 – Jul.2011 Source : IP individual record 2005- 2011 , NHSO

Starting Refer-back networking devlop.
Starting
Special pay
*54 = estimation from Aug. 2010 – Jul.2011
Source : IP individual record 2005- 2011 , NHSO

How health equity and efficiency were achieved?
1. Long term financial sustainability
2. Technical efficiency, rational use of services at primary health care
Functioning primary health care at district level, wide geographical coverage of services, referral back up to tertiary care where needed, close-to-client services with minimum traveling cost
In-feasible for informal sector (equally 25% belong to Q1 and Q2) to adopt contributory scheme
1. Equity in financial contribution Tax financed scheme,
adequate financing of primary healthcare
2. Minimum catastrophic health expenditure 3. Minimum level of impoverishment
Breadth and depth coverage, comprehensive benefit package, free at point of services
4. Equity in use of services 5. Equity in government subsidies
Provider payment method: capitation contract model and global budget + DRG
EQUITY GOALS
EFFICIENCY GOALS

Inte
rna
tio
na
l H
ea
lth
Po
lic
y P
rog
ram
-T
ha
ila
nd
Inte
rnati
onal H
ealt
h P
olic
y P
rogra
m -
Thaila
nd
Remaining key challenges in financing UCH in Thailand

Inte
rna
tio
na
l H
ea
lth
Po
lic
y P
rog
ram
-T
ha
ila
nd
Inte
rnati
onal H
ealt
h P
olic
y P
rogra
m -
Thaila
nd
Inequitable government subsidies among three public health insurance schemes
• Harmonization of benefit package and provider payment methods among three schemes is urgently needed,
• Ensuring equal distribution/access of services across regions• Ensuring good quality of health services
15

Inequity in quality of care and health service provision:
Percentage of caesarian section to total deliveriesby health insurance schemes
15.4% 15.9% 16.4% 17.0% 17.2% 17.8% 18.3% 18.9% 19.8% 20.0% 20.0% 20.1%
17.0% 17.3% 16.2% 16.8% 18.4%20.2% 20.3% 21.6% 20.6% 20.1% 19.3% 19.7%
28.8%
36.3%
30.5%
24.3%
35.9%
42.3%
37.7%41.4%
45.6%
40.1%
48.4% 48.1%
9.8%
14.3%
6.0%
9.3%
14.0%12.2% 12.7%
18.5%16.4% 16.4%
20.4%
15.1%
0%
5%
10%
15%
20%
25%
30%
35%
40%
45%
50%
2004Qtr1
2004Qtr2
2004Qtr3
2004Qtr4
2005Qtr1
2005Qtr2
2005Qtr3
2005Qtr4
2006Qtr1
2006Qtr2
2006Qtr3
2006Qtr4
UC SSS CSMBS ROP
Source: Electronic claim database of inpatients from National Health Security Office, 2004-2006 (N=13,232,393 hospital admissions)

49% 48%51%
47% 47%
52%50% 51% 53%
55% 55% 55% 56%54%
51%
24%22% 23% 23%
25% 24%22%
18%
30%26% 26%
28% 27% 27% 26%
23%21%
22%20%
24%22%
24% 24% 24% 26%28% 27%
29% 28% 28%
0%
10%
20%
30%
40%
50%
60%
Qtr1
Qtr2
Qtr3
Qtr4
Qtr1
Qtr2
Qtr3
Qtr4
Qtr1
Qtr2
Qtr3
Qtr4
Qtr1
Qtr2
Qtr3
2004 2005 2006 2007
CS
SS
UC
45%47% 48%
50%52% 50% 51%
53% 54% 55% 56%54% 56% 58% 59%
17% 17% 16% 17%18%
20% 20% 22% 21% 20% 19% 20%
16% 16% 17% 17% 18% 18% 19% 20% 20% 20% 20% 20% 20% 21% 21%
0%
10%
20%
30%
40%
50%
60%
Qtr1
Qtr2
Qtr3
Qtr4
Qtr1
Qtr2
Qtr3
Qtr4
Qtr1
Qtr2
Qtr3
Qtr4
Qtr1
Qtr2
Qtr3
2004 2005 2006 2007
CS
SS
UC
Cesarean section Laparoscopic cholecystectomy
Use of expensive proceduresUse of expensive proceduresVariations across 3 public insurance schemesVariations across 3 public insurance schemes
Source: Limwattananon et al. (2009)

Angiotensin II receptor blockers
0
5
10
15
20
25
30
35
40
45
50
Jan
Apr Ju
l
Oct
Jan
Apr Ju
l
Oct
Jan
Apr Ju
l
Oct
Jan
Apr Ju
l
Oct
Jan
Apr Ju
l
Oct
2003 2004 2005 2006 2007
CS
SS
UC
Single source statins and new antihyperlipidemia
0
5
10
15
20
25
30
35
40
45
50
Jan
Apr Ju
l
Oct
Jan
Apr Ju
l
Oct
Jan
Apr Ju
l
Oct
Jan
Apr Ju
l
Oct
Jan
Apr Ju
l
Oct
2003 2004 2005 2006 2007
CS
SS
UC
Clopidogrel
0
5
10
15
20
25
30
35
40
45
50
Jan
Apr Ju
l
Oct
Jan
Apr Ju
l
Oct
Jan
Apr Ju
l
Oct
Jan
Apr Ju
l
Oct
Jan
Apr Ju
l
Oct
2003 2004 2005 2006 2007
CS
SS
UC
Coxibs
0
5
10
15
20
25
30
35
40
45
50
Jan
Apr Ju
l
Oct
Jan
Apr Ju
l
Oct
Jan
Apr Ju
l
Oct
Jan
Apr Ju
l
Oct
Jan
Apr Ju
l
Oct
2003 2004 2005 2006 2007
CS
SS
UC
Use of expensive OP medicinesUse of expensive OP medicinesVariations across 3 public insurance schemesVariations across 3 public insurance schemes
Source: Limwattananon et al. (2009)

Cost escalation: Consequence of fee for services in Civil Servant Medical Benefit Scheme
46,588
61,304
37,004
54,904
46,481
17,058
26,043
20,476
16,44013,587
9,954
3,1566,0004,316
62,196
13,905
21,896
30,833
38,803
9,5097,007
1,729 2,337 3,3745,8664,826
45,531
1988 1989 1990 1991 1992 1993 1994 1995 1996 1997 1998 1999 2000 2001 2002 2003 2004 2005 2006 2007 2008 2009 2010
Total expenditure (million Baht) Outpatient (million Baht) Inpatient
Evidence:
• In 2010, 62.196 billion THB total expenditure for 5 million CSMBS beneficiaries, US$ 416 per capita is 5.2 times that of UC member capitation US$ 80
• CSMBS: OP applies fee for service direct disbursement to providers, DRG replaces FFS for IP since 2006, help stabilize expenditure

Mismatch between increasing burden of disease from NCD and low investment in HP and disease
preventionDALY lost from Risk factors, Thailand 1999 and 2004
943
838
595
594
440
410
238
169
144
132
91
54
53
29
25
1,310
550
490
490
400
370
220
140
370
120
120
60
70
30
40
0 200 400 600 800 1000 1200 1400
Unsafe Sex
Alcohol
Blood pressure
Tobacco
Non-Helmet
BMI
Cholesterol
Low intake of fruit and vegetable
Illicit Drugs
P hysical Inactivity
Air P ollution
WSH
Malnutrition-Inter
Malnutrition-Thai
Non-Seatbelt
DALYs('000)
19992004 Health administration
and health insurance 8.5%
Medical goods4.3%
Ancillary services 0.4%
Prevention and public health services
4.8%
Services of curative & rehabilitative care
78.1%
Gross capital formation
3.9%
0
50
100
150
200
250
300
350
400
450
500
Q1 Q2 Q3 Q4 Q5
Thou
sand
s
inactivity
low intake fruit
cholesterol
BMI
Blood pressure
smoking
Alcohol0
50100150200250300350400450500
Q1 Q2 Q3 Q4 Q5
Thou
sand
s
inactivity
low intake fruit
cholesterol
BMI
Blood pressure
smoking
Alcohol
DALYs attributable to risk factors

21
HIV/AIDS Financing (Source: UNGASS Reports 2008 & 2010)
2007200
8
200
9
Total Expenditure:Total AIDS expenditure, million Baht
6728, 692
8 7208
Total Health Expenditure, million Baht2488,52
3 6 3 ,771
383,051
Total AIDS expenditure, as
per capita population, Baht 105 110 114
per capita PLWHA, Baht 1160,0
142,75
144,17
% GDP008
008 008
% THE27. % 19. % 19. %
Sources of Fund: Domestic, % of Total AIDS Expenditure
83 85 93
International, % Total AIDS Expenditure
17 15 7
Types of Expenditure: Treatment, % Total AIDS Expenditure
71.8 65.8 76.1
Prevention, % Total AIDS Expenditure
14.1 21.7 13.7
↑2.97% ↑4.01%

Sources: Analyses from the 2002, 2004, and 2006 SES
52 65
152
303
433
303
390433
650
867
47 6093 120
205
0
100
200
300
400
500
600
700
800
900
1000
Q1 Q2 Q3 Q4 Q5
Bah
t per
cap
ita
Income quintiles
Median (in Thai Baht) of household spending on tobacco, alcohol and health in 2006
Tobacco
Alcohol
Health
Household expenditure: tobacco, alcohol and health
Median household expenditure (Baht per month), 2002-2006

Inequity in geographical distribution of Health workforce in 2007
Physicians
800-3,3053,306-6,2746,245-9,2729,243-12,300
Dentists
5,500-15,14315,144-25,76725,768-36,39036,391-47,011
Nurses
280 - 652653 - 904905 - 1,1561,157 – 1,408

Inte
rna
tio
na
l H
ea
lth
Po
lic
y P
rog
ram
-T
ha
ila
nd
Inte
rnati
onal H
ealt
h P
olic
y P
rogra
m -
Thaila
nd
Economic loss of 12 priorities BOD in Thailandfor prioritization of health investment in the 10th
NHDP
diseasesDALY loss
(1)
Curative expenditure
(2)
Productivity loss due
to premature death(3)
Productivity loss due
to absenteeis
m (4)Total
(2+3+4)
1 HIV/AIDS 19% 17% 35% 6% 30%
2Traffic accidents 15% 31% 26% 30% 27%
3 CVD 13% 7% 9% 5% 9%
4 DM 9% 18% 4% 32% 8%
5 Liver cancer 8% 1% 10% 1% 8%
Total 100% 100% 100% 100% 100%
Total top 12 disease burden
4,780,000 yr
61,936 million Baht
208,287 million Baht
11,273 million Baht
281,497 million Baht
Percent by row22% 74% 4% 100%
% of Thai GDP in 2005 4.0%Note:
1.Little success in controlling and preventing road traffic injuries, increasing incidence and prevalence of MDR- and XDR-TB,
2.Revitalizing HIV control and prevention in the light of universal ART.
3.Controlling the incidence and prevalence of ESRD patients who require renal replacement therapy (hemodialysis, PD, and KT)

Inte
rna
tio
na
l H
ea
lth
Po
lic
y P
rog
ram
-T
ha
ila
nd
Inte
rnati
onal H
ealt
h P
olic
y P
rogra
m -
Thaila
nd
25
ConclusionsEffective implementation: enabling factors
• System design focusing on equity and efficiency• Strengthening supply side capacity to deliver services
– Extensive geographical coverage of functioning primary health care, and district health systems need strong PHC and health infrastructure and health workforce,
– Long-standing policy on government bonding of new graduates health workforce for rural services since 1972.
• Strong leadership with sustained commitment– Continued political support despite changes in governments, – Capable technocrats, – Active civil society,
• Strong institutional capacity– Long term investment in health information system,– Health technology assessment (HTA),– Health system and policy research, – Good collaboration among researchers, reformists, and
advocacy, – Key platform for evidence to inform policy making decisions.

Inte
rna
tio
na
l H
ea
lth
Po
lic
y P
rog
ram
-T
ha
ila
nd
Inte
rnati
onal H
ealt
h P
olic
y P
rogra
m -
Thaila
nd
26
Key stakeholders and participatory processes in topic selection for economic evaluation of UC benefit
package
Academic
Medical specialists
Civil Society
Patients
Focus group
discussionPolicy maker
Medical specialists
Academic group
Civil Society
General population
Patients
Industry
Topic selection
meetingKey s
takeh
old
ers
Key
sta
keh
old
ers
Research working
groups
UC Benefit PackageSubcommittee
Submission of topics of concerns for consideration
- evidence on cost effectiveness,
-- budget impact analysis,
-- systems readiness to implement,
-- equity and ethical considerations

Inte
rna
tio
na
l H
ea
lth
Po
lic
y P
rog
ram
-T
ha
ila
nd
Inte
rnati
onal H
ealt
h P
olic
y P
rogra
m -
Thaila
nd
27
Acknowledgement
27
• Ministry of Public Health (MOPH) of Thailand• National Statistical Office of Thailand (NSO)• Health Systems Research Institute (HSRI) • Health Information System Development Office (HISO)• Thai Health Promotion Foundation (THPF) • National Health Security Office (NHSO)• WHO long-term fellowship program of WHO-SEA region