achieving nutritional security in india: vision 2030
TRANSCRIPT

NABARD
ACHIEVING
NUTRITIONAL SECURITY
IN INDIA: VISION 2030
Shyma JoseAshok GulatiKriti Khurana
INDIAN COUNCIL FOR RESEARCH ON INTERNATIONAL ECONOMIC RELATIONS (ICRIER)
NABARD RESEARCH STUDY-9

1
NABARD Research Study-9
Achieving Nutritional Security in India: Vision 2030
Shyma Jose Ashok Gulati Kriti Khurana
The NABARD Research Study Series has been started to enable wider
dissemination of research conducted/sponsored by NABARD on the thrust areas of
Agriculture and Rural Development among researchers and stakeholders. The
present report on ‘Achieving Nutritional Security in India: Vision 2030’ is the ninth in the series. It
assesses the trends for nutritional security and identifies determining factors that have
a significant effect on reducing malnutrition levels in India. Complete list of studies is
given on the last page.

2
Authors' Affiliations 1. Shyma Jose, Research Fellow, Indian Council for Research on International Economic Relations, New Delhi2. Ashok Gulati, Infosys Chair Professor for Agriculture (ICRIER) & former Chairman of the Commission forAgricultural Costs and Prices (CACP), Government of India3. Kriti Khurana, Research Assistant, Indian Council for Research on International Economic Relations, NewDelhi
©2020
Copyright: NABARD and ICRIER
ISBN 978-81-937769-4-0
Disclaimer:
Opinions and recommendations in the report are exclusively of the author(s) and not of any other individual or institution including ICRIER. This report has been prepared in good faith on the basis of information available at the date of publication. All interactions and transactions with industry sponsors and their representatives have been transparent and conducted in an open, honest and independent manner as enshrined in ICRIER Memorandum of Association. ICRIER does not accept any corporate funding that comes with a mandated research area which is not in line with ICRIER’s research agenda. The corporate funding of an ICRIER activity does not, in any way, imply ICRIER’s endorsement of the views of the sponsoring organization or its products or policies. ICRIER does not conduct research that is focused on any specific product or service provided by the corporate sponsor.
The contents of this publication can be used for research and academic purposes only with due permission and acknowledgment. They should not be used for commercial purposes. NABARD does not hold any responsibility for the facts and figures contained in the book. The views are of the authors alone and should not be purported to be that of NABARD.

3
Table of Contents List of Figures .................................................................................................................................4 List of Tables ..................................................................................................................................5 List of Abbreviations ......................................................................................................................6 Foreword ......................................................................................................................................... 7 Preface.............................................................................................................................................8 Abstract ..........................................................................................................................................10 Executive Summary .......................................................................................................................11
1. Introduction ................................................................................................................................14 1.1. Review of Literature ......................................................................................................... 16 1.2. Data Sources and Methodology ........................................................................................ 20
2. India’s Position Globally in terms of Nutritional Security ...................................................... 25 2.1 Understanding the Burden of Malnutrition in India: Temporal and Spatial Trends ......... 28
3. Linkage between Nutritional Security, Economic Growth, Poverty and Agriculture................... 34 3.1. Achieving Nutritional Security: Tracing how far Economic Growth and Poverty Reduction take us ........................................................................................................................................... 34 3.2 Linkage between Agricultural Performance, Food and Nutritional Security .......................... 36 3.2.1. Food security and Nutritional Security in India .................................................................. 36 3.2.2. Food Availability and Affordability.................................................................................... 38 3.2.3. Food Grain Security to Diet Diversification ....................................................................... 40
4. Determinants of Malnutrition........................................................................................................ 42 4.1. Immediate Determinants of Child Malnutrition ..................................................................... 42 4.2. Nutritional Interventions ........................................................................................................ 45 4.3. Malnutrition and Underlying Factors ..................................................................................... 46 4.4. Empirical Analysis of Determinants of Malnutrition and Infant Mortality Rates in India .... 50
5. Future Prospects and Existing Policy Initiatives ........................................................................... 59 5.1. Nutrition Sensitive Interventions in India .............................................................................. 59
5.2. Covid-19 Impact on Food and Nutritional Security ................................................................... 67 5.3 Projection of SDG Targets Based on Current Trends and Existing Nutritional Programmes 68
6. Lessons from International Experience of Food and Nutritional Security for India ................. 71 6.1 Under-nutrition across BICS Nations ......................................................................................... 71
6.2 Key Lessons for India from these Developing Countries ....................................................... 74 7. Policy Recommendations .......................................................................................................... 76
Reference .......................................................................................................................................... 80 Annexure ........................................................................................................................................... 89

4
List of Figures
Figure 1: Conceptual Framework of Food Security .............................................................................. 16 Figure 2: Conceptual Framework of Under-nutrition ........................................................................... 18 Figure 3: Number of Poor at $1.90 a day (2011 PPP) (in millions) and Prevalence of Undernourished People across Top Countries, 2016-18 ................................................................................................. 26 Figure 4: Prevalence of Stunted and Wasted Children under 5 Years of Age across Countries, 2018 . 27 Figure 5: Spatial Distribution of the Proportion of Underweight, Stunted and Wasted children across Indian Districts, 2015-16 ...................................................................................................................... 30 Figure 6: Trends in Child Mortality Rates ............................................................................................ 32 Figure 7: Percentage of Underweight and Stunted Children under Five and IMR (2015-16) by State Per Capita Income (TE 2017-18) .......................................................................................................... 34 Figure 8: Reduction in Poverty Head Count Ratio (2004-05 to 2011-12) and Reduction in Malnutrition (2005-06 to 2015-16) across States.................................................................................. 35 Figure 9: Per Capita Availability of Different Food Commodities in India: 1990-91 to 2018-19........ 37 Figure 10: Percentage Share of Expenditure on Food and Non-food Items among Poorest (bottom 30 per cent Monthly Per Capita Expenditure Classes), 2004-05 to 2011-12 ............................................. 39 Figure 11: Incidence of Hunger in India ............................................................................................... 40 Figure 12: (A) Percentage of Children who were Breastfed within an Hour of Birth and (B) Children (aged 0-6 months) Exclusively Breastfed in States of India, 2015-16 .................................................. 44 Figure 13: Proportion of Stunted and Underweight Children under Five Years and IMR by Women’s Educational Status, 2015-16 ................................................................................................................. 47 Figure 14: Proportion of Underweight and Stunted Children under Five Years and Infant Mortality Rates across the Poorest and Richest Wealth Quintiles, 2015-16 ......................................................... 49 Figure 15: Percentage Distribution of Population across Districts by Poorest & Poorer Quintiles, 2015-16 ................................................................................................................................................. 50 Figure 16: PDS Leakages in Indian States (%) ..................................................................................... 60 Figure 17: Percentage Distribution of Women by Higher Education Level across Districts, 2015-16 63 Figure 18: Open Defecation in India, 2015-16 and 2019-20 ................................................................ 65 Figure 19: Linear Projections of Poverty Rates, Child Mortality Indicators & Malnutrition Indicators till 2030 ................................................................................................................................................. 70 Figure 20: Under-nutrition across Countries ........................................................................................ 72
5
List of Tables
Table 1: Description of the Variables used in Logistic Regression Analysis ....................................... 23 Table 2: Trends in the Nutritional Status of Children ........................................................................... 29 Table 3: Percentage Break-Up of Calorie and Protein Intake by Food Group: 1993-94 to 2011-12 .... 38 Table 4: Logit Estimates of Children under Five Years of Age who are Underweight, Stunted and Wasting against its Determinants, 2015-16 .......................................................................................... 53 Table 5: Logit Estimates of Children under Five Years of Age who are Underweight, Stunted and Wasting against its Determinants, 2005-06 .......................................................................................... 54 Table 6: Coefficients of Cox Proportional Hazard Model for infant mortality (children who have died before attaining 1 year of age) over its determinants, 2015-16 (NFHS-4) ........................................... 57 Table 7: Percentage of Schools with Selected Basic Facilities (Rural India) ....................................... 78
6
List of Abbreviations
AAY Antyodaya Anna Yojana AMB Anaemia Mukt Bharat APL Above Poverty Line ASER Annual Status of Education Report AWCs Anganwadi centres BCG Bacillus Calmette-Guérin BICS Brazil, India, China and South Africa BMI Body Mass Index BPL Below Poverty Line CES Consumption Expenditure Survey CGIAR Consultative Group of International Agricultural Research CIP Central Issue Price COVID-19 Novel Coronavirus 2019 DAY-NRLM Deendayal Antodaya Yojana – National Rural Livelihoods Mission DPT Diphtheria, Tetanus & Pertussis Vaccine FAO Food and Agriculture Organization FAOSTAT Food and Agriculture Organization Corporate Statistical Database GHI Global Hunger Index GoC Government of China HGNSJ Har Ghar Nal Se Jal ICAR Indian Council of Agricultural Research ICDS Integrated Child Development Scheme IECD Integrated Early Childhood Development IFA Iron Folic Acid IFSS Integrated Food Security Strategy MDG Millennium Development Goal MDMS Mid Day Meal Scheme MOSPI Ministry of Statistics and Programme Implementation NFHS National Family Health Survey NFSA National Food Security Act NHFPC National Health and Family Planning Commission NNM National Nutrition Mission NSIGSE National Scheme of Incentive to Girls for Secondary Education NSNP National School Nutrition Programme NSSO National Sample Survey Organisation NULM National Urban Livelihood Mission PMMVY Pradhan Mantri Matru Vandana Yojna PNAN National Food and Nutrition Policy PNSAN. National Food and Nutrition Security Policy PPP Purchasing power parity RDP Reconstruction and Development Programme RMSA Rashtriya Madhyamik Shiksha Abhiyan SAG Scheme for Adolescent Girls SDG Sustainable Development Goal SHG Self Help Groups SISAN National Food and Nutrition Security System SRS Sample Registration system SSA Sarva Shiksha Abhiyan UNESCO United Nations Educational, Scientific and Cultural Organization UNICEF United Nations Children's Fund WASH Water, Sanitation and Hygiene WFP World Food Programme WHO World Health Organization

7
Foreword
Hunger and malnutrition among children is one of the pervasive health problems in the world contributing to mortality at young age especially among developing countries. Today agriculture produces enough food for everyone, but the number of people experiencing moderate to severe food insecurity stands at two billion of the global population according to the report on ‘The State of Food Security and Nutrition in the World’ (2019). Despite India being self-sufficient in food grain production, it was home to 194.4 million undernourished people during 2016-18.
The main victims of undernourishment are poor, especially young children, pregnant and lactating mothers. Since the nutritional status of women has a direct impact on the nutritional and health status of a child, the food and nutritional developments aimed at improving the diets of women especially of reproductive age is crucial to end the cycle of hunger and malnutrition. The prevalence of undernutrition and micronutrient deficiencies particularly among disadvantaged women and children can be addressed by integrating the nutritional sensitive programmes with food security, agriculture, poverty reduction and education to achieve nutritional security.
More recently, the central government launched the National Nutrition Strategy (2017) which aims to reduce the prevalence of underweight children (0-3 years) by three percentage points every year by 2022 from NHFS 2015-16 estimates. Additionally, the National Nutrition Mission (NNM), also known as POSHAN Abhiyan aims to reduce stunting and underweight and low birth weight, each by 2% per annum; and anaemia among children, adolescent girls and women, each by 3% per annum by 2022. However, the Global Burden of Disease Study 1990–2017 has estimated, if the current trend continues, India would fall short of achieving the targets of stunting, underweight and low birth weight under NNM by 2022. Clearly, the piecemeal efforts of all those concerned have not been able to bring significant improvement in nutritional status of the population. Based on extensive research, the report has critically assessed India’s existing nutritional policies and programmes and provided key measures to address multi-dimensional challenge of nutritional insecurity and end all forms of malnutrition by 2030.
I appreciate the work done in this report which highlighted the situation of malnutrition not just at state and district level but also at unit level using data from the National Family Health Survey. Besides, the report also examines the inter linkage between agriculture and nutrition to help formulate the future policies of agriculture that are more nutrition sensitive. We hope that the findings of this study will be of immense use to policy makers and other stakeholders including planners, academicians and researchers to bring colossal problem of nutritional insecurity to the forefront and provide solutions to set India on a robust path towards achieving nutritional security by 2030.
Rajat Kathuria, Director & CEO, ICRIER G.R.Chintala, Chairman, NABARD

8
Preface Undernourishment, a measure of inability to access minimum nutrition requirement expressed in terms of daily calories intake, is one of the most serious health problems affecting 809.9 million people worldwide (FAO, IFAD, UNICEF, WFP and WHO, 2019). Given the gravity of the situation, the targets of ending hunger, achieving food security and ending all forms of malnutrition by 2030 were adopted in the UN’s Sustainable Development Goals (SDGs). For holistic nourishment of the population, the targets under SDG 2 (zero hunger) have been broadened to include measures of chronic (stunting) and acute (wasting) deficiencies and to address agricultural productivity, nutrition and income of small-scale food producers as compared to the Millennium Development Goals (MDGs) which concentrated only on food security, undernourishment and underweight children.
India is home to the largest number of undernourished people in the world (24 per cent of the world population). As a proportion of India’s own population, around 14% of the total population was undernourished during 2016-18. India also accounts for the highest proportion of stunted (31 per cent) and wasted children (51 per cent) worldwide (FAO, IFAD, UNICEF, WFP and WHO, 2019). Importantly, our linear projections of malnutrition indicators (based on a business-as-usual model) show that India will not be able to achieve the SDG target of eliminating all forms of malnutrition by 2030, if the current trend continues. Evidently, the piecemeal approach of the governments’ food-based welfare programmes including the mid-day meal (MDM) scheme, the anganwadi system under the Integrated Child Development Scheme (ICDS), and subsidised food grains through the public distribution system (PDS), has not been able to make a significant dent in improving the nutritional status of the population.
Given the high burden of nutritional insecurity, the present paper assesses the status, determinants, implications of malnutrition as well as existing policies and programmes to tackle the multi-dimensional challenge of nutritional insecurity in India. Our study finds that leveraging agricultural policies and programmes to be more “nutrition-sensitive” and reinforcing diet diversification towards a nutrient rich diet is the need of hour. The focus of food distribution programmes need to shift from ‘calories fundamentalism’ to providing a more diversified food basket, including coarse grains, millets, and pulses to improve the nutritional status of pre-school children and women of reproductive age. Ensuring availability of nutritious diet in areas affected by chronic malnutrition needs adoption of innovative techniques such as bio-fortification, which involves incorporating nutrients into the seeds of major food grains to improve the micro-nutrient intake. Indeed, various food-based safety nets such as PDS, MDM etc. can include bio-fortified staples to provide a more diversified food basket.
Moreover, various studies suggest that the efficacy of nutritional-sensitive interventions that determine adequate nourishment such as food, access to health care, and adequate child care practices, in turn, depends upon underlying factors such as household income and mother’s education. Our findings, using logistic regression on unit level NFHS data, reiterate that mothers’ education is strongly associated with the nutritional outcomes of children. Notably, higher education among women strongly correlates with household food security, sanitation

9
and hygiene, and child caring practice. In spite of considerable efforts by the government to improve female literacy, only 13.7% of women attained higher education level (NFHS, 2015-16). Hence, targeted programmes for improving the educational status of girls, particularly at the higher educational levels need to be promoted.
Wealth index is another important determinant of child undernutrition, which subsumes important factors that impact malnutrition such as access to sanitation facilities and safe drinking water. WASH initiatives, i.e., safe drinking water, sanitation and hygiene, are critical in improving child nutritional outcomes and are key to the success of nutritional interventions. Moreover, we also found that WASH initiatives in schools improve access to education and reduces dropout rates, especially among girls by providing them with a safe and equitable environment. Without a doubt, a synergy between WASH initiatives and nutritional interventions will have a multiplier effect on nutritional outcomes. The remarkable progress achieved in programmes like Swachh Bharat Abhiyaan and Jal Jeevan mission will go a long way to improve nutritional outcomes in the coming years.
Child caring practices including exclusive breastfeeding, and introduction of complementary food and a diversified diet after the first six months play significant role in improving the nutritional status of children and ensure their appropriate growth and cognitive development. Incidentally, only 55% of children in India were exclusively breastfed in 2015-16. Not just that, less than a quarter of Indian children (aged 6-23 months) could afford minimum dietary diversity and only one-tenth were fed a minimum acceptable diet (NFHS-2015-16). Through infant and young child feeding guidelines, ICDS and National Breastfeeding Promotion Programmes, there is a need to strengthen the regulation on breast milk substitutes and improve breastfeeding practice. Besides, improving access and utilisation of prenatal and postnatal health care services play a significant role in curbing undernutrition among children through comprehensive awareness programmes and community participation.
It is absolutely necessary to plug the gaps in existing nutritional programmes with better targeting and monitoring along with addressing the multidimensional determinants of malnutrition on urgent basis. Moreover, the emergence of Covid-19 is going to exacerbate the already existing food and nutritional insecurity and derail India’s efforts for becoming malnutrition free by 2030, unless stringent actions are adopted.
Shyma JoseAshok GulatiKriti Khurana
10
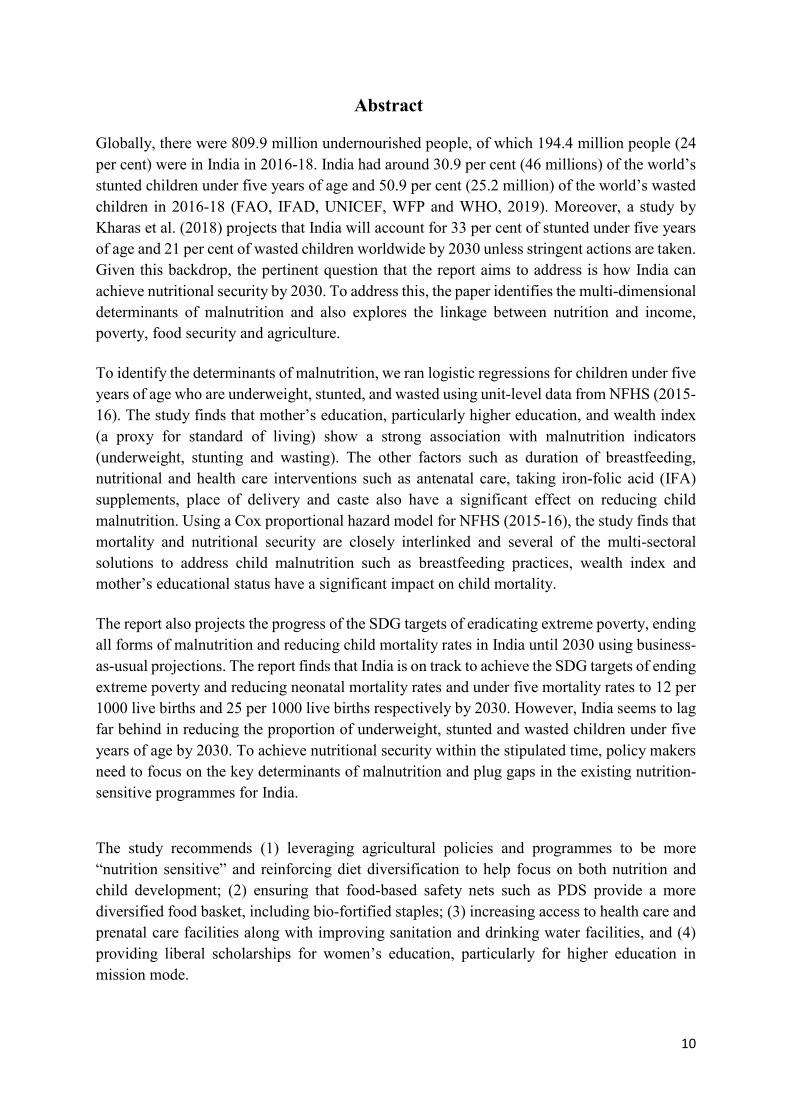
Abstract
Globally, there were 809.9 million undernourished people, of which 194.4 million people (24 per cent) were in India in 2016-18. India had around 30.9 per cent (46 millions) of the world’s stunted children under five years of age and 50.9 per cent (25.2 million) of the world’s wasted children in 2016-18 (FAO, IFAD, UNICEF, WFP and WHO, 2019). Moreover, a study by Kharas et al. (2018) projects that India will account for 33 per cent of stunted under five years of age and 21 per cent of wasted children worldwide by 2030 unless stringent actions are taken. Given this backdrop, the pertinent question that the report aims to address is how India can achieve nutritional security by 2030. To address this, the paper identifies the multi-dimensional determinants of malnutrition and also explores the linkage between nutrition and income, poverty, food security and agriculture.
To identify the determinants of malnutrition, we ran logistic regressions for children under five years of age who are underweight, stunted, and wasted using unit-level data from NFHS (2015-16). The study finds that mother’s education, particularly higher education, and wealth index (a proxy for standard of living) show a strong association with malnutrition indicators (underweight, stunting and wasting). The other factors such as duration of breastfeeding, nutritional and health care interventions such as antenatal care, taking iron-folic acid (IFA) supplements, place of delivery and caste also have a significant effect on reducing child malnutrition. Using a Cox proportional hazard model for NFHS (2015-16), the study finds that mortality and nutritional security are closely interlinked and several of the multi-sectoral solutions to address child malnutrition such as breastfeeding practices, wealth index and mother’s educational status have a significant impact on child mortality.
The report also projects the progress of the SDG targets of eradicating extreme poverty, ending all forms of malnutrition and reducing child mortality rates in India until 2030 using business-as-usual projections. The report finds that India is on track to achieve the SDG targets of ending extreme poverty and reducing neonatal mortality rates and under five mortality rates to 12 per 1000 live births and 25 per 1000 live births respectively by 2030. However, India seems to lag far behind in reducing the proportion of underweight, stunted and wasted children under five years of age by 2030. To achieve nutritional security within the stipulated time, policy makers need to focus on the key determinants of malnutrition and plug gaps in the existing nutrition-sensitive programmes for India.
The study recommends (1) leveraging agricultural policies and programmes to be more “nutrition sensitive” and reinforcing diet diversification to help focus on both nutrition and child development; (2) ensuring that food-based safety nets such as PDS provide a more diversified food basket, including bio-fortified staples; (3) increasing access to health care and prenatal care facilities along with improving sanitation and drinking water facilities, and (4) providing liberal scholarships for women’s education, particularly for higher education in mission mode.

11
Executive Summary
According to the FAO (2009), nutrition security implies “physical, economic and social access to balanced diet, clean drinking water, safe environment, and health care (preventive and curative) for every individual. Education and awareness are needed to utilise these services”. Malnutrition occurs not just due to lack of adequate and nutritious food but also due to a variety of interconnected economic and social risks and vulnerabilities such as inadequate care in terms of breastfeeding and child care, and education (UNICEF, 2015).
The link between nutrition, poverty, food security and agriculture has been recognised and is embodied in the UN’s Sustainable Development Goals (SDGs). Of the 17 SDGs, the report focuses on three interrelated SDGs of eradicating extreme poverty, zero hunger and good health and well-being. The report uses the Global Indicators Framework for SDGs to ensure that the ultimate goal of ending all forms of malnutrition and nutritional security is achieved by 2030.
Globally, India accounts for the highest proportion of stunted (31 per cent) and wasted children (51 per cent) and under five deaths (16 per cent) (FAO, IFAD, UNICEF, WFP and WHO, 2019; UNICEF, 2019). India is also the home to the largest number of undernourished people in the world (24 per cent of the world population) (FAO, IFAD, UNICEF, WFP and WHO, 2019). Thus, the pertinent question that the report aims to address is how India can achieve nutritional security by 2030. In this backdrop, the report assesses the status, determinants, implications of malnutrition as well as existing policies and programmes to tackle the multi-dimensional challenge of nutritional insecurity in India. Additionally, the report also focuses on the inter-linkages between agriculture, food and nutritional security to develop a strong policy framework to achieve nutritional security by 2030.
Despite the secular decline in extreme poverty in India from 45.9 per cent to 13.4 per cent between 1993 and 2015 (defined at $1.9 per capita per day at the 2011 purchasing power parity rate (PPP)), India still suffers from a high malnutrition burden (World Bank, 2019). Under-nutrition in childhood leads to long-term physical underdevelopment, reduces the development of learning skills, and, as a consequence, affects productivity and increases morbidity and mortality. It is measured using anthropometric measures – low height-for-age (stunting), low weight-for-age (underweight) and low weight-for-height (wasting). Between 2005-06 and 2015-16, the proportion of underweight and stunted children has declined in India from 42.5 per cent to 35.8 per cent and 48.0 per cent to 38.4 per cent respectively. Even so, more than one-third of the children in India are underweight and stunted. The proportion of wasted children has increased from 19.8 per cent to 21 per cent in India during the same period (NFHS, 2015-16). Our findings from the linear projections of malnutrition indicators (based on a business-as-usual model) also show that India will not be able to achieve the SDG target of eliminating all forms of malnutrition by 2030 unless more stringent and targeted actions are adopted. Given the emergence of COVID 19, there is a possibility that India will deviate further from achieving its SDG targets.

12
Child mortality is another aspect which is closely linked to under-nutrition. Globally, India has a major role to end preventable new-born deaths and death among children below five years of age by 2030. The under-five mortality rate declined from 123 per 1000 live births to 44, the infant mortality rate from 80 to 37 per 1000 live births and the neonatal mortality rate from 56 per 1000 live births to 26 per 1000 live births in the period 1991 to 2015 (World Bank, 2019; SRS, Census). Our linear projection of child mortality rates predict that India seems to be on track to achieve the SDG targets of reducing neonatal mortality rates and under five mortality rates to 12 per 1000 live births and 25 per 1000 live births respectively by 2030.
Ensuring access to food is not the same as ensuring optimal nutritional security. Improving nutritional outcomes also depend upon the availability and affordability of a nutritious diet. While examining the inter-linkages between agriculture and nutrition, we find that an increase in agricultural productivity and relative reduction in food prices leads to diversification of diet, particularly towards micronutrient-rich diets such as fruits, vegetables pulses and animal products. In India, there has been a marked shift in the consumption pattern of people, which has increased the demand of non-cereal food crops. Over time, the per capita availability of food grains has declined and the consumption of cereals has remained more or less stagnant whereas the consumption of nutritious food like livestock products, fruits, vegetables, pulses, etc., have increased. Moreover, there has been considerable decline in the incidence of hunger from 4.45 per cent to 1.26 per cent between 1993-94 and 2011-12 (NSSO, 2004-05 and 2011-12).
To determine the factors that have a significant effect on reducing malnutrition levels in India, the study runs a logistic regression using unit level data for underweight, stunted, and wasted children under the age of 5 years for 2015-16 (NFHS-IV). The estimates indicate that malnutrition is a multidimensional problem that requires multi-sectoral solutions. Mothers’ educational status, particularly higher education, has the strongest association with being underweight (β= -0.64, 95% CI [-0.69,-0.59]) and stunting (β= -0.59, 95% CI [-0.54,-0.62]). The wealth index (a proxy for standard of living which includes important factors such as sanitation and drinking water) also shows a strong association with malnutrition indicators and the probability of a child suffering from malnutrition decreases in the richer quintiles of the wealth index. For every one unit increase in the richest wealth quintile, we expect a decrease of the log-odds of being underweight by -0.73 (95% CI [-0.77,-0.68]) and of stunting by -0.59 (95% CI [-0.63,-0.54]). For mothers with body mass index>18.5 kg/𝑚𝑚2, we expect a decrease in the log-odds of being underweight and of stunting by -0.51 (95% CI [-0.54, -0.49]) and -0.22 (95% CI [-0.24, -0.0.19]) respectively. The other key factors that have a significant impact on reducing child malnutrition indicators are the duration of breastfeeding, nutritional and health care interventions such as antenatal care, taking iron folic acid (IFA) supplements, place of delivery and caste. Unless a debate on these key determinants and nutrition sensitive interventions are given precedence, the target of ending all forms of malnutrition will not be achieved by 2030.
The Cox proportional hazard model estimates for the year 2015-16 confirms the findings of earlier studies that factors affecting child malnutrition also have a significant influence on

13
infant mortality. Major factors in curbing infant mortality are breastfeeding practices, mother’s education, maternal age and wealth index. The hazard ratio (risk of dying before one year of age) among children who are breastfed as compared to the ones who are never breastfed declines by a factor of -1.45. As compared to young mothers (aged 15-20 years), being mothers in the age group 20-30 years, 30-40 years and 40 above years reduces the risk of their children dying before one year of age, i.e., the expected log of hazard ratio decreases by -0.55, -0.59 and -0.64 respectively. For each year increase in the mother’s higher educational status, the risk of children dying before one year of age reduces by -0.57. For infants belonging to the richer (richest) wealth quintiles, the risk of a child dying before one year of age decreases by -0.22 (-0.48).
The report also provides a synthesis of the experience of three developing countries (Brazil, China, and South Africa) in enhancing nutritional security and the major public policies and programmes adopted by these countries to tackle the problem of malnutrition. India can draw key lessons from these developing countries to tackle the challenge of food insecurity and malnutrition. Brazil has transformed its food system and is investing in agricultural R&D and social protection programmes to reduce the level of hunger in the country. China, on the other hand, attached great importance to early childhood development and has formulated a series of plans in this regard. Similarly, South Africa has introduced various nutritional programmes over the years and explicitly guaranteed the right to food in its constitution.
The report recommends that agricultural policies should be more “nutrition-sensitive” to promote diet diversification towards one that is healthy and nutritious. The Indian Council of Agricultural Research (ICAR) along with the Consultative Group of International Agricultural Research (CGIAR) could work together to implement a cost effective and sustainable approach to develop new nutrient rich staple food crops through bio-fortification under their Harvest Plus programme. Social safety net programmes like the public distribution system and mid-day meal schemes have had limited success in addressing the problem of nutritional insecurity in the country. Diverting a part of food subsidy (on wheat and rice) towards nutritious food can help reduce food and nutritional insecurity.
Women’s education has a positive multiplier effect on the nutritional status of children. Thus, according high priority to female education, particularly higher education, by providing liberal scholarships can go a long way in tackling the problem of child malnutrition. Efforts are also needed to reduce the dropout rates among girls in schools, particularly at the secondary and high school level. Improving health care facilities and prenatal care along with increased investments in institutional deliveries at primary health centres, district hospitals and government run hospitals will have positive outcomes on child and maternal health. A targeted approach is needed to track the gaps in nutritional interventions programmes, particularly in the clusters of districts where the prevalence of malnutrition is high. It is also necessary to have access to improved sanitation and safe drinking water. From this perspective, programmes like Swachh Bharat Abhiyaan and Jal Jeevan mission will have significant and positive outcomes in the coming years.

14
1. Introduction
Nutrition security is achieved “when all people at all times consume food of sufficient quantity and quality in terms of variety, diversity, nutrient content and safety to meet their dietary needs and food preferences for an active and healthy life, coupled with a sanitary environment, adequate health, education and care” (FAO, 2012). The lack of ability to access a minimum nutrition requirement, expressed in terms of daily energy intake in calories terms, has serious implications for human development. Protein and energy deficiencies affect physical and cognitive development in children, and leads to higher morbidity and mortality rates among children and low labour productivity in the long run.
Malnutrition as a term is used by nutritionists to describe all kinds of nutritional deficiencies. It arises due to food insecurity caused by deficiency, excess or imbalance in the intake of micro/macro-nutrients in one’s diet. In other words, the triple burden of malnutrition includes under-nutrition, over nutrition and micro-nutrient deficiency but the present paper will focus mainly on under-nutrition.
Malnutrition among children under five is one of the most serious health problems in India. A child’s nutritional status is a function of food intake, food absorption, health, and the socio-economic and ecological environment. Malnutrition can be measured using food energy intake norms1 as well as outcome indicators such as anthropometric measures, clinical measures of malnutrition and bio-chemical indicators. Anthropometric measures are given prominence over food energy intake whereas clinical measures are used for extreme malnutrition (Radhakrishnan and Ravi, 2004). Although the term malnutrition is a medical problem, it is also an economic issue related to food entitlement, poverty and the socio-economic structure of societies.
In India, 194.4 million people were undernourished in 2016-18; the number stood at 809.9 million people globally (FAO, IFAD, UNICEF, WFP and WHO, 2019). The examination of anthropometric indicators shows that the proportions of underweight and stunted children under five years of age declined from 42.5 per cent to 35.8 per cent and 48.0 per cent to 38.4 per cent respectively between 2005-06 and 2015-16 in India. However, wasting among Indian children increased from 19.8 per cent to 21 per cent during the same period. It is surprising that despite an unprecedented economic growth of 6.8 per cent per annum from 1992-93 to 2015-16 and a commensurate decline in poverty as reflected in national and international poverty estimates, malnutrition still remains alarmingly high in the country. A recent study by Kharas et al. (2018) emphasises that if the shortfalls in current trajectories are not corrected, India will account for 26 per cent of the total number of undernourished worldwide by 2030 based on business-as-usual projections. Moreover, India’s will also account for 33 per cent and 21 per cent of the total number of stunted and wasted children under five years of age respectively.
1 See Annexure Table A1 for recommended dietary allowance for energy, protein, fat and minerals for the Indian population

15
The pertinent question is: will India be able to achieve nutritional security by 2030? To eradicate nutritional insecurity in India, the paper will identify the multi-dimensional determinants of malnutrition and explore the linkage between nutrition and income, poverty, food security and agriculture.
For comprehending and tackling the challenges of nutritional security and malnutrition, the report will assess the three interrelated Sustainable Development Goals (SDGs) of eradicating extreme poverty, zero hunger and good health and well-being. These SDGs provide the conceptual policy framework and mandates tackling the obstacles in ongoing nutritional programmes and policy initiatives (Fears et al., 2018, Fears et al., 2019). The projections of the progress on these SDGs until 2030 will help us understand the level and nature of transformative actions needed to accelerate efforts to achieve nutritional security.
Critically analysing existing nutrition sensitive policies and programmes will provide a policy framework to address key determinants of nutritional security. Given the high burden of malnutrition in India, there is urgent need to strengthen nutritional interventions and food security initiatives with good governance, focused policies and evidence based interventions, even more so now with the emergence of the Novel Coronavirus (COVID-19) pandemic. The COVID-19 crisis will have an unprecedented effect on food availability and accessibility, health and nutrition and the livelihoods of people around the world. Although the analysis in the report was done before the COVID-19 crisis, the findings remain valid in the light of this pandemic.
In view of the challenges it faces, the central question that this study aims to address is how India can achieve nutritional security by 2030. To address this question and develop an urgent action plan to accelerate India’s progress in achieving nutritional security by 2030, the study will
1. assess the trend in malnutrition spatially and temporally as well as examine India’s currentposition globally,
2. identify the key determinants of malnutrition and study the implications of malnutrition onchild mortality rates,
3. examine possible linkages through which income and poverty reduction can impactnutritional outcomes,
4. analyse linkage between nutrition and agriculture to make agricultural policies morenutrition-sensitive, and
5. study loopholes in existing policies and programmes to tackle the challenge of under-nutrition and draw lessons from other developing countries to develop an effective andfocused action plan to tackle the challenge of nutritional insecurity by 2030.
The report is organised into seven broad sections. After introducing the backdrop of the report in Section 1, Section 1.1 presents a review of literature and Section 1.2 provides details of the data and methodology used in the study. Section 2 discusses India’s position globally in terms of nutritional security and throws light on the three interrelated SDGs (eradicating extreme

16
poverty, zero hunger and good health and well-being). Section 2.1 examines temporal and spatial trends in malnutrition. Section 3 evaluates how income growth and poverty reduction affect nutritional security. The section also discusses the linkage between agricultural growth, food security and nutritional security. In Section 4, we identify the various determinants of malnutrition and identify the factors that affect the infant mortality rate. Section 5 discusses the future prospects of achieving nutritional security by projecting the SDG targets till 2030 and assessing nutritional sensitive interventions initiated in India. Section 6 discusses the key learning from international experience and Section 7 puts forward policy recommendations.
1.1.Review of Literature
There are a large number of studies that have looked at various aspects of malnutrition including its link with food production and food security, poverty reduction, and socio-economic factors like access to health care, educational status of women, etc. UNICEF (2015) points out that nutritional insecurity is caused not only due to the lack of adequate and nutritious food but also a variety of interconnected economic and social risks and vulnerabilities such as inadequate care in terms of breastfeeding and child care, and education. Socio-economic and political factors influence the nutritional status of children by increasing the risk of morbidity and mortality in the short run and extending the consequences such as poor school performance and reduced productivity in the long run.
The World Food Summit Report defines food security as the “availability at all times of adequate world food supplies of basic food stuffs to sustain a steady expansion of food consumption and to offset fluctuations in production and prices”. Food security depends upon the availability of and access to a nutritious diet, and its utilisation (Figure 1). Availability is a physical determinant, which is ensured if adequate food is available at peoples’ disposal. Accessibility is achieved if a household has sufficient resources to obtain an appropriate diet. Utilisation depends upon the biological and social environment and proper health care.
Figure 1: Conceptual Framework of Food Security
Source: FAO, 2000
Nutritional Status
Utilisation
Accessibility
Availability
Stab
ility

17
Food security and nutrition linkages have been recognised and acknowledged under SDG 2, which aims to end hunger, achieve food security and improved nutrition, and promote sustainable agriculture (Bhavani and Rampal, 2018, Johnston et al. 2015). Agriculture plays a crucial role in achieving adequate nutrition, as it produces food without which nutrition security cannot be attained (Pinstrup-Anderson, 2006). Many studies have empirically estimated that agricultural growth has a significant effect on reducing malnutrition (Gulati et al., 2012; Headey, Chiu and Kadaliya, 2012; Bhagowalia et al. 2012, Hoddinott et al., 2013) and increase in food production seems to be the most important linkage between agricultural growth and nutrition (Headey, 2011).
In India, food security has always been associated with food grain security. However, while adequacy of grain can ensure that dietary energy requirements are met, diet diversity is important to meet nutrient requirements (Arimond and Ruel, 2004; Kumar et al., 2007). Several studies have pointed out that sustained economic growth, increasing population and changing lifestyles have caused significant changes in the Indian food basket, away from staple food grains towards high-value horticultural and animal products (Kumar et al., 2007; Mittal, 2007;). Radhakrishna & Ravi (2004) have noted the shifts and diversification in the pattern of food consumption as incomes and availability of other food commodities have increased; while the consumption of non-cereals has increased, expenditure as a proportion of income on food consumption has also changed. The changing consumption pattern towards a nutrient rich diet is likely to have positive effect on health and nutritional outcomes (Fears et al., 2019).
UNICEF (1990) outlines a conceptual framework of the causes of malnutrition. Figure 2 outlines UNICEF’s conceptual framework and the impact of malnutrition as outlined in the Lancet nutrition series (2008), Maternal and Child Under-nutrition. The Lancet nutrition series provided strong evidence of the impact of malnutrition on infant and child mortality and its long-term effect on health and cognitive development.

18
Figure 2: Conceptual Framework of Under-nutrition
Source: Adapted and modified from UNICEF (1991) and Lancet Nutrition Series (2008)
According to UNICEF’s framework, the main causes of child malnutrition can be classified into basic, underlying and immediate factors. Household food insecurity, inadequate care and unhealthy household environment and lack of health care services are the main underlying factors of malnutrition, which in turn are determined by basic determinants such as socio-political, environmental and economic factors. Each of these determinants is strongly affected by poverty. The immediate causes of under-nutrition, according to UNICEF’s framework, can be classified into inadequate dietary intake and diseases. The interaction between these immediate causes accounts for high morbidity and mortality in developing countries (Tontisirin and Gillespie, 2001; UNICEF 1998). Under-nutrition in childhood leads to long-term physical underdevelopment and, as a consequence, increases the likelihood of developing chronic diseases (Tarrozzi and Mahajan, 2006). In developing countries, repeated bouts of infectious diseases are responsible for nutrition-related health problems resulting in maternal and child mortality, which are the short-term consequences of under-nutrition.
Short-term consequences: Mortality, morbidity, disability
Long-term consequences: Adult size, Cognitive and physical development and economic productivity,
reproductive performance, metabolic and cardiovascular disease
Inadequate care
Inadequate dietary intake
Disease
Household food insecurity
Unhealthy household environment and lack of health services
Income poverty: employment, agriculture
dwelling, assets (Wealth Index),
Lack of capital: financial, human, physical, social, and
natural
Socio-economic, and political context
Underlying causes
Immediate causes
Basic causes
Malnutrition

19
The Lancet series (2008) has highlighted that addressing the underlying factors would result in a substantial decline in under-nutrition; however, prevention of under-nutrition can also be achieved through programmatic health and nutritional interventions. Integrating the UNICEF’s and the Lancet series’ frameworks, Menon et al. (2017) have categorised the key determinants of child under-nutrition as immediate determinants, nutrition-specific interventions and underlying determinants. Given the significance of nutrition-specific intervention in tackling malnutrition, it has been identified as a determinant to reduce malnutrition in the present study.
Various studies have also illustrated the link between poverty reduction and malnutrition (Desai and Vanneman, 2015; Radhakrishna et al. 2004). Although poverty reduces the risk of malnutrition among children in India, eradication of poverty cannot ensure elimination of malnutrition (Radhakrishna et al 2004). Desai and Vanneman (2015) found that the proportion of underweight children declined only modestly during the years when poverty declined sharply in India. There exists a two-way relationship between poverty and under-nutrition. Poverty not only reduces a household’s ability to feed adequate and balanced micro-nutrient rich food to children, it also affects the household’s ability to demand child and maternal health care services (Black et al. 2008).
Several studies highlight the effects of chronic energy deficiency among mothers on the nutritional status of children, and its adverse effects on labour productivity and consequently economic growth in the long run, which perpetuates the vicious cycle of poverty and malnutrition (Menon et al. 2018, Radhakrishna et al. 2004, Vollmer et al. 2014).The economic cost of under-nutrition in terms of lost national productivity and economic growth is huge. According to UNICEF (2019), poor childhood growth and micronutrient deficiencies results in an annual GDP loss of 11 per cent in Asia. According to a World Bank study, India loses more than $12 billion in GDP due to vitamin and mineral deficiencies (World Bank, 2009).
There have also been a large number of studies that have looked at the relationship between economic growth and its impact on malnutrition (Haddad et al., 2003, Smith and Haddad, 2000; Heltberg, 2009, Ruel and Alderman, 2013). Smith and Haddad (2000), using household survey data for 12 countries, found that a one per cent increase in economic growth resulted in a reduction in the proportion of underweight children by 0.50 per cent. Ruel and Alderman (2013), using cross country fixed effect regression model, found that a 10 per cent increase in GDP per capita tends to reduce stunting by 5.9 per cent. For India, Ruel and Alderman (2013) found that the relationship was much weaker than it was globally.
Pathways to Address Nutritional Insecurity
There is ample literature on the different approaches to address the problem of nutritional security. Broadly, the approaches to tackling the problem of malnutrition have been classified into the following: direct nutrition specific interventions and multi-sectoral approach (Bezanson and Isenam, 2010). Direct nutrition-specific interventions are based on the link between food insecurity and under-nutrition; there is a close link between hunger and different

forms of malnutrition. These include pro-nutrition policies and programmes that directly affect the nutritional outcomes of populations.
The multi-sectoral approach addresses nutritional insecurity through three pathways. First, it can address the key determinants of under-nutrition such as income and agricultural production which have a direct impact on food security. Another important determinant is women’s education, which is a significant factor in reducing malnutrition (Gillespie and Haddad, 2003; Alderman and Headey, 2017; Spears, Ghosh and Cumming, 2013; Gulati et al. 2012). Besides, safe drinking water supply and access to sanitation facilities can address the cycle of infectious diseases and malnutrition (Headey et al. 2019; Gulati el al. 2012; India State-Level Disease Burden Initiative Malnutrition Collaborators, 2019; Deaton and Dreze, 2009, UNICEF, 1990). Second, integrating nutrition specific strategies with programmes in other sectors will speed up the achievement of nutritional security (Gulati et al. 2012, Thow et al, 2016). For instance, integrating pro-nutrition policies with agricultural development can lead to a more diversified and nutritious food basket while integrating such policies with the school curriculum can improve nutritional education. Third, the approach to addressing under-nutrition needs better policy co-ordination between nutritional programmes and policies in other sectors through good governance to eliminate the key causes of under-nutrition (Bezanson and Isenam, 2010, Fears et al., 2018). Based on these two approaches, i.e., direct nutrition interventions and a multi-sectoral approach, the report analyses the key determinants of under-nutrition to address the issue of nutritional insecurity in India.
Although there are a large number of studies that have examined the linkage between food and nutritional security, and have projected the likelihood of achieving the SDG targets based on cross-country analysis, there has been no study that examined whether India was on track to achieving nutritional security by 2030. There have been a few studies in the recent past that have only analysed the latest unit level data of NFHS (2015-16). The present study contributes to a better understanding of the current situation of malnutrition. First, it examines the spatial distribution of different indicators of malnutrition at the district level. Second, the study identifies the determinants of malnutrition that need to be tackled to eradicate all forms of malnutrition as well as reduce child mortality in the country. It also examines the likelihood of India being able to meet the SDG goals relating to nutritional security. Unlike other studies, the present study also provides a pathway to end malnutrition, eliminate extreme poverty, and reduce mortality rates by 2030, besides providing a framework to policy makers to achieve nutritional security in India.
1.2.Data Sources and Methodology The report makes use of unit level data of the National Family Health Survey (NHFS) for the years 1992-93, 1998-99, 2005-06 and 2015-16 published by the International Institute for Population science. The data from the different rounds of NHFS are not strictly comparable. In 2006, WHO released new international growth standards and recommended their use in all nutrition programmes. However, the anthropometric data in the earlier rounds, NFHS-1(1992-
20

21
93) and NFHS-II (1998-99) utilised the NCHS standards.2 Thus, in this report, malnutritionmeasures of children utilise the age and sex specific norms of the World Health Organization(WHO) as well as the National Centre for Health Statistics (NCHS). Another issue with theNFHS rounds is that height and weight were measured for children below 4 years of age inNFHS-I, below 3 years of age in NFHS-II and below 5 years of age in NFHS-III and NFHS-V.
Apart from various rounds of NFHS, the report also makes use of secondary data from the Comprehensive National Nutrition Survey (CNNS, 2016-18). It is the largest micronutrient survey that has ever been conducted using a multi-stage survey design covering rural and urban households. The survey provides data on anthropometric and biochemical indicators for three target population groups: pre-schoolers (0-4 years), school-age children (5-9 years) and adolescents (10-19 years).
The report has used the Consumption Expenditure Survey of the National Sample Survey Organisation (NSSO) for the years 2004-05, 2009-10 and 2011-12 to estimate the incidence of hunger and monthly expenditure. Data from the NSSO has been supplemented using data from the Directorate of Economics and Statistics, Government of India (GoI), the Central Statistical Organisation, the Census of India (1991, 2001, 2011), Planning Commission’s estimates of poverty, FAOSTAT for food supply quantity, World Development Indicators, Labour Bureau, Ministry of Labour and Employment, (GoI), and Lok Sabha questions.
Apart from these data sources, the study uses data from various reports such as India State-Level Disease Burden Initiative Malnutrition Collaborators, Agricultural Statistics at a Glance (2018) (Ministry of Agriculture and Farmers’ Welfare), Basic Animal Husbandry Statistics (2018) (Ministry of Fisheries, Animal Husbandry and Dairying), reports of Nutritional Intake in India (2011-12, 2009-10) from NSSO, the Global Hunger Index report (2010, 2019), Annual Status of Education Report (ASER 2018), The State of Food Security and Nutrition in the World (2019) and the union budget (for various years), GoI.
To measure child malnutrition, the report uses anthropometric measures, low height-for-age (stunting), low weight-for-age (underweight) and low weight-for-height (wasting). Stunting is a measure of chronic under-nutrition which measures deficiency in food energy intake over a long duration; underweight is a composite measure of both chronic and acute under-nutrition and wasting is a measure of acute under-nutrition (Radhakrishna and Ravi, 2004 Gillespie and McNeill, 1992). Children whose anthropometric indicators given in standard deviation scores (SD)3 are less than median -2 SD are considered moderately malnourished. Nutritional
2The new WHO reference population (WHO Multicenter Growth Reference Study Group, 2006) in NFHS-1 and NFHS-2 unit level datasets are unavailable. 3Standard deviation score, also called Z-scores, is calculated as the difference between an observed individual value and median value of the reference population, divided by the standard deviation of value in the reference population

22
deficiencies in adults can be measured by anaemia (iron deficiency) and body mass index (BMI).
The report also analyses child mortality indicators, measured by the under-five mortality rate (U5MR), neonatal mortality rate (NMR) and infant mortality rate (IMR). U5MR is defined as the probability of dying between birth and exactly 5 years of age, expressed per 1,000 live births; NMR is defined as the probability of dying during the first 28 days of life expressed per 1000 live births and IMR is defined as the probability of dying between birth and age 1 per 1000 live births.
Methodology
The paper examines trends in malnutrition over time and spatially along with their determinants using NFHS unit level data. Information on anthropometric indicators for children under five years of age has been used uniformly in all the analyses, unless otherwise specified. The determinants of malnutrition are estimated using logistic regression analysis for the years 2005-06 and 2015-16 for children under five years of age. Logistic regression analysis has also been done to identify factors that affect malnutrition level among children under three years of age using unit level data from the four NFHS rounds (1992-93, 1998-99, 2005-06 and 2015-16). The dependent variable in the logistic regression assumes the value 0 if the child’s anthropometric indicator is more than median -2 SD (no malnutrition) and 1 if the child’s anthropometric indicator is less than -2 SD. Three separate logistic regression models for weight-for-age, height-for-age and weight-for-height have been run.
As discussed earlier, the determinants of malnutrition are classified according to UNICEF’s conceptual framework of the causes of malnutrition (UNICEF 1990) and the framework used in the Lancet nutrition series (Black et al. 2008). The determinants of malnutrition in children in our study are represented by vectors 𝑋𝑋𝑖𝑖, 𝑌𝑌𝑖𝑖, 𝑎𝑎𝑎𝑎𝑎𝑎 𝑍𝑍𝑖𝑖 and the logit model can be specified as
𝐿𝐿𝑖𝑖 = 𝐼𝐼𝑎𝑎 �𝑃𝑃𝑖𝑖
1 − 𝑃𝑃𝑖𝑖� = 𝛽𝛽1 + 𝛽𝛽2𝑋𝑋𝑖𝑖 + 𝛽𝛽3𝑌𝑌𝑖𝑖 + 𝛽𝛽4𝑍𝑍𝑖𝑖
where 𝑃𝑃𝑖𝑖 = 11+𝑒𝑒−(𝛽𝛽1+ 𝛽𝛽2𝑋𝑋𝑖𝑖 + 𝛽𝛽3𝑌𝑌𝑖𝑖 +𝛽𝛽4𝑍𝑍𝑖𝑖)
𝑃𝑃𝑖𝑖 measures the probability of the child being undernourished, 𝑃𝑃𝑖𝑖1−𝑃𝑃𝑖𝑖
measures the odds ratio of
being undernourished and 𝐿𝐿𝑖𝑖 is the log of odds ratio. Table 1 gives the detailed description of the different variables used in the regression analysis.

23
Table 1: Description of the Variables used in Logistic Regression Analysis
Factors Description (categories) Immediate determinants:
Mother’s BMI Body mass index of the mother. The variable is categorised into : BMI < 18.5 and BMI >18.5
Duration of breastfeeding Number of months child was breastfed Categorised into : Never breastfed, 0-6 months, 7-12 months, 13 and above months
Consumption of nutritious food by child*
If child was given nutritious food including green leafy vegetables, fruits, milk and milk products. Categorised into did not consume, consumed
Nutritional Interventions:
Antenatal visits Number of antenatal visits during pregnancy Categorised into: No visits, 1-4 visits, 5-10 visits, 10 and above
Taken Iron Folic Supplements (IFA) during pregnancy
During pregnancy, given to or bought iron tablets/syrup for mother Categorised into: Not taken supplements, taken supplements
Received Vitamin A in last six months preceding the survey
Whether the child received a vitamin A dose in the form of an ampoule, a capsule or syrup in last 6 months.
Categorised into : received and not received Basic Vaccinations If the child was given all the basic vaccination include BCG,
measles, and three doses each of DPT and polio vaccine (excluding polio vaccine given at birth) Category: Received, Not received
Place of delivery Place of delivery of child Category: At home, At government or private healthcare institutions
Underlying Factors:
Mothers’ Education status Education level of the mother Category : Illiterate, primary (1-5 years of education), secondary (6-12 years of education), highest (more than 12 years of education)
Wealth Index * Wealth index quintile Category: Poorest, poorer, middle, rich and richest
Caste Caste of the individual. Category : Scheduled population including SC and ST ; Non-scheduled population including OBCs and upper castes
Source: Compiled by authors Note: *NFHS gives information on wealth index which is based on assets and housing characteristics.4 “Each household asset is assigned a weight (factor score) constructed through principal components analysis, and the resulting asset scores are standardised in relation to a normal distribution with a mean of zero and standard deviation of one” (NFHS, 2005-06, pp 43).
4Asset and household characteristics include household electrification, type of windows, drinking water source, type of toilet facility, type of flooring, material of exterior walls, type of roofing, cooking fuel, house ownership, number of household members per sleeping room. ownership of a bank or post-office account, ownership of a mattress, a pressure cooker, a chair, a cot/bed, a table, an electric fan, a radio/transistor, a black and white television, a colour television, a sewing machine, a mobile telephone, any other telephone, a computer, a refrigerator, a watch or clock, a bicycle, a motorcycle or scooter, an animal-drawn cart, a car, a water pump, a thresher, and a tractor. NFHS-4 also collected information on household assets such as air conditioners, washing machines and an internet connection, which were not collected during the earlier NFHS 2005–06

24
To identity the determinants of infant mortality, we make use of survival analysis. The Cox Proportional Hazard model is the most appropriate regression technique for survival analysis. In a Cox regression, the proportional hazard, i.e., the relative risk of an event or β in the regression model is constant over time (Cox, 1972). In our regression, the risk of the child dying before attaining one year of age is the event. The Cox proportional hazard model can be written as follows:
ℎ(𝑡𝑡) = ℎ0(𝑡𝑡)exp (𝑏𝑏1𝑋𝑋1 + 𝑏𝑏2𝑋𝑋2 + ⋯+ 𝑏𝑏𝑝𝑝𝑋𝑋𝑝𝑝)
where h(t) is the expected hazard5 at time t, ℎ0(𝑡𝑡) is the baseline hazard and represents the hazard when all the predictors 𝑋𝑋1,𝑋𝑋2, … ,𝑋𝑋𝑝𝑝 are equal to zero. The association between each risk factor or predictor (𝑋𝑋1,𝑋𝑋2, … ,𝑋𝑋𝑝𝑝) and the outcome is quantified by the regression coefficients (𝑏𝑏1, 𝑏𝑏2, … . 𝑏𝑏𝑝𝑝) (Cox and Oakes, 1984). The coefficients of a Cox proportional hazard function are analogous to the coefficient in multiple logistic regression analysis.
To examine if India is on track to achieve the SDG goals of eradicating extreme poverty, achieving zero hunger and reducing child mortality by 2030, the paper makes use of linear projections based on the current trajectories of the targets. We extrapolate targets till 2030 assuming that progress maintains a business-as-usual trajectory. However, these projections must be interpreted with the caveat of linear projections.6 Besides, our projections are based on business-as-usual models and do not take account of the impact of COVID-19.
5 The hazard ratio can be interpreted as follows: If the hazard ratio for a predictor is close to 1, then that predictor does not affect survival whereas if the hazard ratio is less than 1, then the predictor is protective (i.e., associated with improved survival). If the hazard ratio is greater than 1, then the predictor is associated with increased risk of death (or decreased survival).
6 The two main caveats of the linear projections are first, they are based on a constant annual percentage decline, which may slow down and become non-linear over time and second, these projections may suffer from aggregation bias (Ravallion, 2015; Nicolai et al 2015).

25
2. India’s Position Globally in terms of Nutritional Security
The Global Indicator Framework for SDGs includes defined targets and indicators for achieving progress in all dimensions of human development – social, economic and environmental. It recognises that ending poverty and eliminating nutritional deprivation by 2030 can be achieved only if other dimensions that improve health and education, reduce inequality, spur economic growth and tackle climate change are given equal importance. Of the 17 SDGs, the present report will study the inter-linkages between the three inter-related goals of ending poverty, ensuring zero hunger and good health and well-being, which pertain to integrating nutrition and health strategies with agriculture and food security. The targets and indicators under these SDGs provide an outline of the key considerations and priorities to ensure that the ultimate goal of ending all forms of malnutrition and ensuring nutritional security is achieved by 2030. Thus, in this section, we will discuss these SDGs and their inter-linkages to examine India’s position globally in terms of nutritional security and illustrate which indicators are currently on track to make the most and least progress until 2030.
SDG 1 aims to eradicate extreme poverty everywhere by 2030 (measured as people living on less than $1.25 per day). An important component of this goal is to ensure appropriate social protection systems and equal rights to economic resources and basic services by 2030. Pro-poor economic growth in developing countries has important implications for nutrition (Pinstrup-Anderson, 2012). India is still home to the largest number of the extremely poor in the world. Globally, there were 735 million extremely poor people (as measured by the World Bank’s international poverty line defined as $1.9 per day per capita at the 2011 purchasing power parity rate (PPP)), of which 175.8 million people (23.9 per cent) were residing in India in 2015 (see Figure 3). In relative terms, the proportion of population living in extreme poverty in India has plummeted from 45.9 per cent in 1993 to 13.4 per cent in 2015 (World Bank, 2019).
Another important aspect closely related to poverty and nutrition is hunger with each impacting the other7 (Heady 2013). India has become self-sufficient in food grain production, but only increasing food production does not ensure nutritional or food security. It is necessary to differentiate between food availability and food access (Herforth et al. 2012). Despite a substantial increase in agricultural production and considerable decline in poverty, progress toward reducing the proportion of the undernourished in India has been sluggish. Of 809.9 million undernourished people globally in 2016-18, around 194.4 million people were in India (FAO, IFAD, UNICEF, WFP and WHO, 2019) (Figure 3). The nutritional status of the population of any country depends on the quantity and the quality of food consumed by individuals, which depends upon the biological and social environment and proper health care. The link between adequate food and nutritional security and proper heath care is embodied in SDG 2.
7 “A high prevalence of undernourishment perpetuates poverty both directly, through a loss of productivity due to poor physical condition, and indirectly, through poor cognitive function and learning deficits” (Martins et al. 2011).

26
Figure 3: Number of Poor at $1.90 a day (2011 PPP) (in millions) and Prevalence of Undernourished People across Top Countries, 2016-18
Source: Poverty & Equity, World Bank; the figures for the undernourished are from ‘The State of Food Security and Nutrition in the World, 2019’ (FAO, IFAD, UNICEF, WFP and WHO, 2019). Note: Data for Pakistan and Nigeria for the year 1993 corresponds to 1990 and 1992, respectively.
SDG 2 aims to end hunger, achieve food security and improved nutrition and promote sustainable agriculture. One of the important targets under SDG 2 pertains to ending all forms of malnutrition by 2030, including reducing the incidence of stunting and wasting among children below 5 years of age and addressing the nutritional needs of adolescent girls, pregnant and lactating women and older persons. As compared to the Millennium Development Goals (MDGs), which concentrated on food security, undernourishment and underweight children, the targets under SDG 2 have been broadened to include measures of chronic (stunting) and acute (wasting) deficiencies and to address agricultural productivity, nutrition and income of small-scale food producers.
Ending all forms of malnutrition is one of the important targets under the zero hunger goal. During 2016-2018, around 30.9 per cent (46 millions) of the world’s stunted children under five years of age (measured by low height for age) and 50.9 per cent (25.2 million) of world’s wasted children (low weight for height) were in India (Figure 4). As a proportion of India’s own population, around 37.9 per cent of children below 5 years of age were stunted and 20.8 per cent were wasted during 2016-2018 (FAO, IFAD, UNICEF, WFP and WHO, 2019).
0
100
200
300
400
500
600
700
800
Num
ber o
f poo
r (in
mill
ions
)
1993 2015
0
50
100
150
200
250
300
350
Und
erno
uris
ed (I
n m
illio
n)
1990-92 2016-18

27
Figure 4: Prevalence of Stunted and Wasted Children under 5 Years of Age across Countries, 2018
Source: The State of Food Security and Nutrition in the World 2019 (FAO, IFAD, UNICEF, WFP and WHO, 2019); UNICEF (2019)
SDG 3 – good health and well-being – aims to ensure healthy lives and promote well-being for all at all ages. One of the important targets under SDG 3, closely linked to under-nutrition, is to end preventable deaths among new born and children under five years of age, i.e., to reduce neo-mortality rates to 12 per 1000 live births and under-five mortality rates to 25 per 1000 live births by 2030. India has highest share of under-five deaths worldwide, accounting for about 8.82 lakh out of 53.2 lakh total under-five deaths globally in 2018 (UNICEF, 2019). Under-nutrition is one of the leading risk factors for under-five deaths in India, accounting for 68.2 per cent of total under-five deaths (1.04 million) in 2017 (India State-Level Disease Burden Initiative Malnutrition Collaborator Report, 2019).
India 31%
Nigeria9%
Pakistan6%Indonesia
6%China
5%0%
Sub-Saharan
countries (excluding nigeria)
27%
Rest of the world
16%
Stunting
India 51%
Nigeria7%Pakistan
4%
Bangladesh4%
Indonesia 7%
China3%
Sub Saharan
countries (excluding Nigeria)
16%
Rest of the world
8%
Wasting
India16%
Nigeria16%
Pakistan8%DemocraticRepublic of
Congo5%Ethiopia
4%China
3%
Rest of the world48%
U5MR

28
Further, an examination of the Global Hunger Index (GHI), which captures the multi-dimensional nature of hunger based on four components – undernourishment, child stunting, child wasting and child mortality rates – shows that the country has been performing poorly in terms of reducing the incidence of hunger. Despite an improvement in the GHI score from 38.8 in 2000 to 30.3 in 2019, India still suffers from serious levels of hunger (Welthungerhilfe et al., 2019). It seems that at this rate of progress, India will not be able to achieve the global nutrition targets by 2030. As a recent study by Kharas et al. (2018) points out, if shortfalls in current trajectories are not corrected, more than 660 million (8 per cent of world population) will still be malnourished globally in 2030 of which India will account for 26 per cent under business-as-usual projections.
In this backdrop, this report analyses the spatial and temporal trends in malnutrition in India. Enumerating the magnitude of malnutrition in the country will help examine the factors responsible for the unacceptably high burden of malnutrition and hence, in developing strong policy initiatives and national commitment to meet the SDG targets of reducing under-nutrition and child mortality.
2.1 Understanding the Burden of Malnutrition in India: Temporal and Spatial Trends
In this section, we discuss trends in the three indicators of malnutrition in India (Table 2). For children under five years of age, there has been a sustained reduction in the proportion of both stunted (height for age <-2 SD) and underweight (weight for age <-2 SD) children, particularly between 2005-06 and 2015-16. During the same period, the proportion of children (under the age of five years) suffering from wasting (weight for height <-2 SD) has increased from. 19.8 per cent to 21 per cent.
There is a dearth of data on nutritional outcomes after 2015-16 for children under five years of age. Nevertheless, examination of the data on anthropometric indicators using the latest CNNS shows that the proportion of stunted, underweight and wasted children stood at 34.7 per cent, 33.4 per cent and 17.0 per cent respectively for children below four years of age during 2016-18.

29
Table 2: Trends in the Nutritional Status of Children
Indicators Proportion of children under three years of age Proportion of children under five years of age
NFHS-1(1992-93) NFHS-II (1998-99)
NFHS-III (2005-06)
NFHS-III (2005-06)
NFHS-IV (2015-16)
Underweight 51.5 47.0 45.9 42.5 35.8
Stunted 52.0 45.5 38.4 48.0 38.4
Wasted8 19.0 15.5 19.1 19.8 21.0
Source: International Institute for Population Sciences (2000, 2007, 2016), NFHS-I, II, III, IV
Note; Proportion of children under three are based on NCHS standards and under five are based on WHO standards
Despite the improvements in stunting and underweight rates among children under five years of age, more than one-third of Indian children are still underweight and stunted, according to NFHS (2015-16). An examination of the spatial pattern of malnutrition helps identify districts in the country that lag behind in terms of ensuring adequate nutrition among children under the age of five.9 NFHS (2015-16) provides information for anthropometric indicators for 640 districts spread across the 36 states/UTs of India. Figure 5 illustrates the spatial trend of underweight, stunted and wasted children under five years of age.
There are wide inter-district variations in child anthropometric indicators. Moreover, a clear sizeable geographical clustering of high risk districts can be seen in the case of both the proportion of stunted and underweight children. The proportion of underweight children under five years of age ranges between 6.3 per cent and 67 per cent. The proportion of underweight children was in excess of 40 per cent in around 210 districts. These districts were located in central, eastern and western India in the states of Jharkhand, Bihar, Madhya Pradesh, Gujarat, Rajasthan and Uttar Pradesh. The proportion of underweight children was less than 20 per cent in around 15.4 per cent of the districts (99 of 640 districts), mostly located in the southern states (Kerala and Tamil Nadu), north-eastern states and Jammu and Kashmir. Only 9 districts had a proportion of less than 10 per cent underweight children in the 640 districts and are likely to achieve the SDG-2 target of ending all forms of malnutrition by 2030.
Stunting among children under five years of age ranges from 13 per cent to 65.7 per cent across the districts. Around 241 districts reported high prevalence of stunting (more than 40 per cent). Poorly performing districts in terms of stunting are located in Bihar, Uttar Pradesh, Jharkhand and Madhya Pradesh. Some districts in Kerala, the north-eastern states, Himachal Pradesh, Orissa and Jammu and Kashmir had relatively low rates of stunting.
8The height of children could not be measured in the states of Andhra Pradesh, West Bengal, Himachal Pradesh, Madhya Pradesh, and Tamil Nadu due to unavailability of measuring instruments during the first phase of NFHS-1 9The state wise trend of in terms of the proportion of underweight, stunted and wasted children are given in the annexure (Figure A1).

30
Wasting among children under five years of age varies between 1.8 per cent and 47.4 per cent across districts with more than 85 districts reporting high prevalence of wasting (more than 30 per cent). Most of the poorly performing districts in terms of wasting are located in the state of Jharkhand, Gujarat, Karnataka and Madhya Pradesh.
Figure 5: Spatial Distribution of the Proportion of Underweight, Stunted and Wasted children across Indian Districts, 2015-16

31
Source: International Institute for Population Sciences (2016), NFHS- IV

32
Micro-nutrient Deficiencies and Child Mortality
As pointed out earlier, malnutrition is estimated to have caused around 68.2 per cent of the total under-five deaths in India in 2017. Figure 6 shows the trend in the under-five mortality rate (U5MR), neonatal mortality rates (NMR) and infant mortality rate (IMR) since the 1990s. Child mortality rates have gradually declined in India since the 1990s. U5MR declined from 123 per 1000 live births in 1991 to 44 per 1000 live births in 2015 whereas IMR declined from 80 per 1000 live births in 1991 to 37 per 1000 live births by 2015.
Figure 6: Trends in Child Mortality Rates
Source: SRS, Census and World Bank data, various years Note: U5MR: Under five mortality rates, IMR: Infant mortality rates and NMR: Neonatal morality rates. U5MR and NMR data have been taken from the World Development Indicators as time series data of U5MR and NMR were not available from the Census.
Although all three child mortality rates have declined across all states, some states still had high prevalence of U5MR, IMR and NMR, particularly Uttar Pradesh, Madhya Pradesh, Chhattisgarh and Bihar in 2015-16 (see annexure (Figure A2)). However, there were some Indian states that had already achieved the SDG targets of reducing neo-mortality rates and under five mortality rates to at least as low as 12 per 1,000 live births and 25 per 1,000 live births respectively in 2015-16. These are Kerala, Tamil Nadu, Delhi, Maharashtra, Jammu and Kashmir and Punjab. Between 2005-06 and 2015-16, the highest reduction in U5MR and IMR was recorded in Arunachal Pradesh, followed by Orissa and Jharkhand.
The other closely linked implication of under-nutrition is micronutrient deficiencies or hidden hunger, which affects cognitive skills as well as productivity because of the associated higher rates of morbidity, especially among women and children. These deficiencies include vitamin A deficiency, iron deficiency and iodine deficiency. One of the major health issues in India is iron deficiency, which manifests in morbidity, stunting, physical impairment and premature mortality. Studies have shown a positive and significant association between iron deficiency
0
20
40
60
80
100
120
140
1991
1992
1993
1994
1995
1996
1997
1998
1999
2000
2001
2002
2003
2004
2005
2006
2007
2008
2009
2010
2011
2012
2013
2014
2015U
5MR,
IMR,
NM
R (p
er 1
000
live
birt
h)
IMR NMR U5MR

33
and child mortality rates (Scott et al. 2014). Anaemia among woman before and during pregnancy is a cause of poor intrauterine growth and stunting.
In 2015-16, 58.5 per cent of children aged 6-59 months were anaemic as compared to 69.5 per cent in 2005-06. Anaemia among women aged 15-49 years declined from 56.2 per cent in 2005-06 to 53.1 per cent in 2015-16 (see Annexure (Figure A3)).
At this rate of progress, will India be able to achieve the SDG target of reducing new born and under five mortality rates and ending all forms of malnutrition by 2030?

34
3. Linkage Between Nutritional Security, Economic Growth,Poverty and Agriculture
3.1. Achieving Nutritional Security: Tracing how far Economic Growth and Poverty Reduction take us The association between stunting, being underweight and infant mortality rates (IMR) by per capita net state domestic product (a measure of economic growth) for Indian states/UTs is shown Figure 6. It is evident that economic growth is negatively correlated with malnutrition and mortality indicators. States like Bihar, Uttar Pradesh, Jharkhand and Madhya Pradesh with low per capita income have a higher proportion of underweight and stunted children.10 There is a similar trend in the case of IMR (Figure 7). Across Indian states, a one per cent increase in per capita income reduces being underweight by 0.4 per cent, stunting by 1.4 per cent and the infant mortality rate by 0.6 per cent. Thus, it is evident that economic growth reduces child under-nutrition and mortality rate in India, with its impact being the strongest on the incidence of stunting.
Figure 7: Percentage of Underweight and Stunted Children under Five and IMR (2015-16) by State Per Capita Income (TE 2017-18)
Source: Central Statistical Organisation, and National Family Health Survey- IV (2015-16). Note: Per capita income is measured by per capita net state domestic product (expressed in Rs.’000) at 2011-12 prices for TE 2017-18 whereas the data for IMR, underweight and stunting are from NFHS (2015-16).
Economic growth can affect under-nutrition through two pathways. First, growth needs to trickle down to the lowest income deciles through increased household income or through increased government spending. Second, increased income should result in augmenting household spending on nutrition and health or on government nutritional programmes (Vollmer et al. 2016). There is growing consensus that poverty reducing economic growth with a framework to protect the poor and the vulnerable through efficient governance is crucial to accelerate the reduction in the incidence of malnutrition (Gillespie and Haddad, 2001).
10However, the north-eastern states such as Manipur, Meghalaya and Nagaland, appear to have succeeded in lowering the proportion of stunted and underweight children despite lower per capita incomes.

35
Does poverty reduction have any effect on nutritional outcomes in India? To address this question, we assess the inter-linkage between poverty and under-nutrition. According to UNICEF’s framework of the causes of malnutrition, poverty is one of the important underlying factors, and has a severe impact on food security and healthcare. However, there are studies that have found a weak but positive association between poverty reduction and malnutrition (Datt and Ravallion, 1997; Bhat and Xavier, 1999; Jose, 2016). Radhakrishna et al. (2004) found that the risk of under-nutrition declines with an increase in household income, though eradication of poverty cannot result in eliminating under-nutrition.
The elasticity of malnutrition with respect to poverty across Indian states is estimated to be 0.2 per cent. This conforms to the findings of earlier studies of a weak and positive association between malnutrition and poverty. However, the reduction in under-nutrition with respect to poverty reduction varies widely across Indian states. Figure 8 shows the percentage decline in poverty head count ratio between 2004-05 and 2011-12 and percentage decline in the proportion of underweight children under five between 2005-06 and 2015-16 across Indian states. Some states have done well in reducing poverty between 2004-05 and 2011-12 such as Tripura (-3.2 per cent per annum), Orissa (-3.1 per cent per annum) and Sikkim (-2.9 per cent per annum). However, the progress achieved in reducing the malnutrition level (underweight children) has been significant only in Tripura. Orissa and Sikkim have performed poorly in decreasing the malnutrition level between 2005-06 and 2015-16. Other states that have performed well in reducing malnutrition and poverty are Madhya Pradesh, Uttarakhand, Himachal Pradesh and Bihar. Although Nagaland, Arunachal Pradesh and Mizoram were able to reduce under-nutrition between 2005-06 and 2015-16, these states recorded an increase in poverty rates between 2004-05 and 2011-12 (Figure 8).
Figure 8: Reduction in Poverty Head Count Ratio (2004-05 to 2011-12) and Reduction in Malnutrition (2005-06 to 2015-16) across States
Source: Planning commission, various years and National Family Health Survey- III, IV

36
It is quite clear from the discussion above that economic growth and poverty are closely related to nutritional security; however, there are other pathways to eliminate under-nutrition that are elaborated in the next section.
3.2 Linkage between Agricultural Performance, Food & Nutritional Security There are several pathways linking agriculture to nutrition. These can be categorised into generic and specific effects (Gillespie and Haddad, 2001; Haddad 2000). The generic effect links nutrition to agriculture through employment and income generation. Another generic effect is through the gender pathway focussing on “women’s role in agriculture, their social status and decision making power in agriculture and household food security, and their time allocation between productive activity and household and care work” (Bhavani and Rampal, 2018). On the other hand, the specific effect includes availability of and access to food, consumption of own production, household food acquisition and allocation behaviour (Pinstrup-Anderson, 2012, Gulati et al., 2012).
Broadly, the consensus is that agricultural programmes and policies should focus on improving diet diversity and access to micro-nutrient rich diets to improve nutritional outcomes. This requires developing food systems that are nutrient rich and strengthening institutions and policies that have a positive effect on nutrition (Bhavani and Rampal, 2018, Johnston et al. 2015). In this back drop, the next section will discuss the possible ways through which agriculture can affect nutritional outcomes.
3.2.1. Food security and Nutritional Security in India In India, a major share of the population suffers from malnutrition despite the fact that India became self-sufficient in food grain production two decades after independence. Food grain production in the country increased from 176.39 million tonnes in 1990-91 to 284.95 million tonnes in 2018-19.11 However, it is important to recognise that self-sufficiency in food production and having enough food available per person for the country is not the only condition to achieve food security; households must also have access to available food to achieve adequate nutrients intakes (Pinstrup-Andersen, 2013). Availability and affordability of nutritious diet is crucial to reduce the burden of malnutrition.
Historically, food security in India was always synonymous with food grain security. The per capita availability of food grains has declined from 186.2 kg/year in 1991-92 to 180.3 kg/year in 2018-19(P). This decline in cereal availability has been concomitant with a marked increase in the availability of pulses, eggs and dairy and a marginal increase in per capita availability of sugar and edible oil (Figure 9). This changing trend in per capita food availability reflects significant changes in the Indian food basket, away from staple food grains towards high-value horticultural and animal products (Kumar et al., 2007; Mittal, 2007).
11 The total production of wheat and rice in 1990-91 was 129.43 million tonnes and in 2018-19 was 218.61 million tonnes.

37
Figure 9: Per Capita Availability of Different Food Commodities in India: 1990-91 to 2018-19
Food Crops Livestock
Source: Agriculture Statistics at a glance (2018), FAOSTAT Note: Net availability= Gross production (-) seed, feed and wastage (-) exports (+) imports (+/-) change in stock Per capita availability of food grains is the net availability of food grains divided by the total population from Census 2011.
0
20
40
60
80
100
120
140
160
180
20019
90-9
119
91-9
219
92-9
319
93-9
419
94-9
519
95-9
619
96-9
719
97-9
819
98-9
919
99-0
020
00-0
120
01-0
220
02-0
320
03-0
420
04-0
520
05-0
620
06-0
720
07-0
820
08-0
920
09-2
010
2010
-201
120
11-2
012
2012
-201
320
13-2
014
2014
-201
520
15-2
016
2016
-201
720
17-2
018
2018
-201
9(P)
Kg/Y
ear
Per capita net availability of Foodgrains (kg/year) Per capita availability of Edible Oil (kg/year)
Per capita availability of sugar (kg/year) Per capita availability of Fruits (Kg/Year)
Per capita availability of Vegetables (Kg/Year)
0
20
40
60
80
100
120
140
160
0
10
20
30
40
50
60
70
80
90
1990
-91
1992
-93
1994
-95
1996
-97
1998
-99
2000
-01
2002
-03
2004
-05
2006
-07
2008
-09
2010
-201
1
2012
-201
3
2014
-201
5
2016
-201
7
2018
-201
9(P)
Nos
/Yea
r
Kg/Y
ear
Per Capita availability of eggs (Nos/Year)Per capita availability of fish and meat (Kg/year)Per capita availability of milk (Kg/year)

38
Over time, the consumption of cereals (particularly coarse cereals) has declined whereas the consumption of milk, eggs, fruits, vegetables, etc., has increased (Kumar, 2016). In India, there has been a clear increasing in calories and proteins from non-cereal items in both rural and urban areas (Table 3). The proportion of household expenditure on cereals has also registered a decline from 18 per cent and 10.1 per cent in 2004-05 to 10.7 per cent India and 6.6 per cent in 2011-12 in rural and urban India respectively (NSSO, 2004-05 and 2011-12).
Diet diversification towards animal and dairy products has a positive effect on nutrition, particularly in terms of the micronutrient content in food; however, increasing consumption of edible oil and sugar may lead to double burden of malnutrition.12
Table 3: Percentage Break-Up of Calorie and Protein Intake by Food Group: 1993-94 to 2011-12
Source: NSS Report No.540, Nutritional Intake in India
3.2.2. Food Availability and Affordability One of the linkages between food availability and nutrition comes from the fact that increased availability leads to affordability. Increase in agricultural productivity and a relative reduction in food prices enable increased intake of fruits, vegetables, pulses and animal products, which has a significant impact on reducing micronutrients deficiencies (Herforth et al. 2012). Food prices are important from the nutritional perspective as they have significant implications in terms of access to food and food choices.13 Food accounts for a large chunk of total expenditure in households with low income and a decline in relative food prices is likely to increase consumption and release purchasing power for other commodities (Figure 10). However, an
12According to WHO, the double burden of malnutrition is “characterised by the coexistence of under-nutrition along with overweight and obesity.” 13The trend in the ratios of food to general price indices for rural and urban sectors using the monthly consumer price index for agricultural labour (CPI-AL) and industrial workers (CPI-IW) is shown in Annexure Figure A4.
Calories (kcal) Protein (gm)
Year Rural Urban Rural Urban
Cereal Non cereal
Cereal Non cereal
Cereal Non cereal
Cereal Non cereal
1993-94 71.03 28.97 58.53 41.47 69.42 30.58 59.41 40.59
1999-00 67.55 32.45 55.05 44.96 67.43 32.57 57.03 42.97
2004-05 67.54 32.46 56.08 43.92 66.37 33.63 56.16 43.84
2009-10 64.16 35.85 55.01 44.97 64.87 35.13 56.39 43.61
2011-12 57.40 42.60 48.00 52.00 58.00 42.00 49.00 51.00

39
increase in relative food prices adversely affects food security and affordability, and worsens the incidence of hunger.
Figure 10: Percentage Share of Expenditure on Food and Non-food Items among Poorest (bottom 30 per cent Monthly Per Capita Expenditure Classes), 2004-05 to 2011-12
Source: adapted from Food and Nutrition Security Analysis, India (2019) by MOPSI and WFP, GOI, pp 75 (Calculation based on CES, NSSO 61st and 68th rounds)
The Consumption Expenditure Survey (CES) of the NSSO collects information on the availability of two square meals a day, which can be used to measure the incidence of hunger. Overall, the incidence of hunger has declined from 4.45 per cent in 1993-94 to 1.26 per cent in 2011-1214 (Figure 11). The incidence of hunger in the states of Odisha and West Bengal, which was more than 10 per cent in 1993-94, has declined to 1.28 per cent and 1.16 per cent in 2011-12. The north-eastern states of Assam, Arunachal Pradesh and Manipur have almost eradicatedthe incidence of hunger. Against this, there has been an increase in the incidence of hunger inPunjab (from 0.12 per cent in 1993-94 to 1.43 per cent in 2011-12), in Himachal Pradesh (0.28per cent in 1993-94 to 1.51 per cent in 2011-12), in Delhi (from 0.44 per cent in 1993-94 to0.74 per cent in 2011-12) and in Haryana (from 0.56 per cent in 1993-94 to 1.19 per cent in2011-12).
However, these numbers need to be interpreted with caution because the question asked differed between the 50th and 68th rounds (Deaton and Dreze, 2009).15 However, there is little doubt that there has been a significant decline in the incidence of hunger across states (Kumar, 2012).
14 NSSO collects information related to two square meals a day. However, over the years the question to measure two square meals has changed. In the 50th round, the question asked was “Do all members get two square meals a day”; in the 68th round, the question changed to: “number of meals taken in a day”. 15 The earlier CES captures self-reported hunger based on the response of the head of the households (often a man) who may not admit his inability to provide even two square meals a day to the family. This may have led to an underreporting of incidence of hunger in the earlier rounds (Saxena, 2011).
66.0
60.3
59.9
55.0
34.0
39.7
40.1
45.0
0
20
40
60
80
100
120
2004-05 2011-12 2004-05 2011-12
Rural Urban
Perc
enta
ge sh
are
of e
xpen
ditu
re (%
)
Non-Food
Food

40
Figure 11: Incidence of Hunger in India
Source: Calculated by Author from NSS 50th and 68th round. Note: Incidence of hunger is measured by persons reporting not getting two square meals a day.
Despite the marked shift away from the consumption of cereals to non-cereals, the focus of agricultural policies has been on the production of staples, primarily rice and wheat, leading to dietary imbalance. The question that arises is what pathways can be used to achieve diet diversification and nutritional security in India.
3.2.3. Food Grain Security to Diet Diversification
Various food based welfare programmes have been implemented by the government over the years to reduce the level of hunger and under-nutrition in the country. These include the mid-day meal (MDM) scheme, the anganwadi system under the Integrated Child Development Scheme (ICDS) to provide rations to pregnant and lactating women and subsidised food grains for those living the below poverty line through the public distribution system (PDS). Additionally, the National Food security Act (2013) was passed to ensure food and nutritional security through associated schemes and programmes.16 However, these food distribution programmes mainly focus on providing adequate calories rather than nutrition, and has been termed “calories fundamentalism” by Headey et al. (2012). Many people in India suffer from the problem of hidden hunger (chronic micronutrient deficiency) where a person may have access to sufficient calories but lacks adequate micronutrients (George, McKay 2019).
It is a matter of concern that policies that contribute to a diet rich in micro-macronutrients have been overlooked, resulting in perpetuation of micronutrient deficiencies (Thow et al., 2016). Food-based interventions are unlikely to result in a significant reduction in malnutrition if they are not nutrition sensitive. Moreover, a clear synergy is essential between agricultural policies
16These schemes have been discussed in greater detail in section 5.2
0
4
8
12
16Pu
njab
Him
acha
l Pra
desh
Delh
i
Hary
ana
Raja
stha
n
Goa
Guj
arat
Mad
hya
Prad
esh
Tam
il N
adu
Andh
ra P
rade
sh
Utt
ar P
rade
sh
Karn
atak
a
Mah
aras
tra
All I
ndia
Trip
ura
Biha
r
Kera
la
Assa
m
Man
ipur
Wes
t Ben
gal
Oris
sa
Arun
acha
l Pra
desh
Perc
ent
1993-94 2011-12

41
and the nutritional quality of food supply (Ruel and Alderman 2013; Pinstrup-Andersen 2011).An innovative way to ensure availability of micro-nutrients in areas affected by chronic malnutrition is to adopt the technique of bio-fortification, which involves incorporating nutrients into the seeds of major food grains to improve the micro-nutrient intake among populations that are chronically malnourished. There are several examples of this having been implemented successfully in different countries (Ruel et al., 1999; Gillespie and Haddad, 2001; Gulati et al., 2012, Pinstrup-Andersen, 2012, von Braun, 2010). For example, orange-fleshed sweet potato in Mozambique has resulted in increased serum retinol in children below five years of age (Hotz et al., 2012). WHO has also recommended fortification of rice with iron to improve the iron status of the population where rice is a staple food and wheat flour with folic acid to increase the intake of folate by women. The Harvest-Plus programme of the Consultative Group on International Agricultural Research has been working on improving the nutritional status of pre-school children and women of reproductive age by releasing iron and zinc bio-fortified pearl millet, zinc-bio fortified rice and wheat; iron bio-fortified beans and vitamin-A rich yellow cassava and orange maize in 30 countries. In India, the Harvest-Plus programme has been promoting iron fortified pearl millet and zinc-fortified wheat to improve nutrition and public health. Bio-fortification, however, is a short or medium term measure to reduce under-nutrition among low income households; in the long term, the objective should be to work towards assuring access to an energy and micronutrient rich diversified diet (Herforth, 2012, Bouis, Eozenou, and Rahman 2011).

42
4. Determinants of Malnutrition
Hitherto, we have discussed the pathways through which economic growth and poverty affect child malnutrition indicators in India. It has been established how accessibility and affordability of nutritious food have a significant impact on child malnutrition in India. However, there are many other factors that need to be examined to achieve nutritional security.
Smith and Haddad (2000) in their study of developing countries during 1970-1995 highlighted other underlying factors apart from food such as the status of women, healthcare and health environment that have a significant impact on reducing the proportion of children who are underweight. In their cross-country analysis, the study found that while the availability of food had the largest significance in reducing the prevalence of underweight during the 1980s, the importance of women’s education in reducing the proportion of underweight children grew steadily in later years. This is not surprising given that women increase the probability of a household being more food secure if they have a greater share of household resources (Alderman et al.1995; Gillespie and Haddad 2001).
As discussed earlier, we have identified the key determinants of child malnutrition based on UNICEF’s conceptual framework of causes of child malnutrition and the maternal and child under-nutrition framework used in Lancet’s nutrition series (2008). UNICEF’s conceptual framework combines effective action at the national, district and local level to improve nutritional outcomes whereas the Lancet series framework includes nutrition sensitive interventions that address both immediate and underlying determinants (Menon et al., 2018). Broadly, we have classified the determinants of child malnutrition as immediate determinants, nutrition and health care interventions and underlying determinants.
4.1. Immediate Determinants of Child Malnutrition The immediate determinants of child malnutrition include maternal nutritional outcomes and child feeding practices (Menon et al., 2018). It is well established that a mother’s nutritional status is closely associated with her child’s nutrition status and is a key determinant of the child’s survival (Coffey, 2015, Gulati et al., 2012, Bhutta et al., 2013, Khan and Mohanty, 2018). Poor maternal health and nutrition has an intergenerational impact on health and malnutrition (Delisle, 2008) whereas low birth weight and undernourishment during pregnancy result in low duration of breastfeeding, which in turn leads to child malnutrition (Black et al., 2013).
The body mass index (BMI) of the mother is used as a proxy to measure the mother’s nutritional status. Mothers with a BMI lower than 18.5 kg/𝑚𝑚 2 are classified as suffering from under-nutrition. At the all India level, the prevalence of low BMI among women has declined from 35.5 per cent in 2005-06 to 22.9 per cent in 2015-16. Across states, Jharkhand (31.6 per cent), Bihar (30.5 per cent) and Rajasthan (28.4 per cent) have a high proportion of women with low BMI whereas Manipur (8.8 per cent), Mizoram (8.4 per cent) and Sikkim (6.4 per cent) reported a low proportion (see Annexure Figure A5).

43
Child feeding practices have a significant impact on the nutritional status of children as well as infant survival rates. Child feeding practices commonly includes exclusive breastfeeding in the first six months, continued breastfeeding through till two years as well as the initiation of nutritious food at the age of six months. Early initiation of breastfeeding is an important part of infant and child feeding practices, which requires the child to be put to the breast within one hour of birth. Around 41.5 per cent of children were breastfed within one hour in 2015-16, which was a considerable increase from 24.5 per cent from 2005-06. Figure 12A shows the spatial distribution of children (percentage) who were breastfed within one hour of birth. The states with a low percentage of children breastfed within one hour are Uttar Pradesh (25.4 per cent), Rajasthan (28.4 per cent), Uttarakhand (28.8 per cent), Punjab (29.9 per cent), Bihar (35.3 per cent) and Jharkhand (33.0 per cent). Goa (75 per cent) and Mizoram (73 per cent) performed better in terms of children being breastfed within one hour. .
The duration of breastfeeding also has a significant impact on the malnutrition rate as well as infant mortality rates (Banerjee, 2018; Binns and Lee, 2014). WHO recommends exclusive breastfeeding for children in the first six months. In India, there has been considerable progress in exclusive breastfeeding among children under six months of age; it increased from 46 per cent in 2005-06 to 55 per cent in 2015-16. Figure 12B shows the percentage of children (aged 0-6 months) exclusively breastfed in Indian states in 2015-16. Chhattisgarh, Andhra Pradesh,Manipur and Tripura have more than 70 per cent of children who were exclusively breastfedaccording to NFHS-IV (2015-16). Meghalaya, Uttar Pradesh, Tamil Nadu and Nagaland havea low percentage of children who were exclusively breastfed.
Nutritious food should contain a diverse diet from different food groups to provide the child with micro-nutrients. The introduction of complementary and nutritious food after the first six months is essential to meet the nutrition needs of infants and to ensure appropriate growth and development. The WHO has recommended a minimum acceptable diet,17 which is a combination of diet diversity18 and minimum meal frequency19 depending upon whether or not the child is breastfed. The lack of a diverse diet and frequent meals has a significant impact on under-nutrition, especially on stunting, and deficiency of micronutrients, which can result in morbidity and mortality. In 2015-16, around 22 per cent of children (aged 6-23 months) were given minimum dietary diversity, 35.9 per cent were given minimum meal frequency and only 9.6 per cent were fed a minimum acceptable diet.
17 “Breastfed children aged 6-23 months who had at least the minimum dietary diversity and the minimum meal frequency during the previous day and non-breastfed who received at least two milk feedings, and had at least the minimum dietary diversity (not including milk feeds), and the minimum meal frequency during the previous day” (NFHS-2015-16, pp 297).
18 Minimum dietary diversity means feeding the child food from at least four food groups. 19 Minimum meal frequency is a proxy for a “child’s energy requirements” and requires children (aged 6-23 months) to be receiving solid, semi-solid, or soft foods at least four times a day for non-breastfed children and at least three times a day for breastfed children (NFHS-IV, 2015-16)

44
Figure 12: (A) Percentage of Children who were Breastfed within an Hour of Birth and
(B) Children (aged 0-6 months) Exclusively Breastfed in States of India, 2015-16
Source: International Institute of Population Science (2017), National Family Health Survey-, IV
45
4.2. Nutritional Interventions Nutritional intervention is a proxy for the utilisation of prenatal and postnatal health care services for mother and child. Antenatal care (ANC) and delivery at a health facility with skilled assistance are key determinants of malnutrition (Menon et al., 2018, Radhakrishna and Ravi, 2004; Jose, 2016, Khan and Mohanty, 2018) and has a significant effect on infant and child mortality rates (Arokiasamy and Gautam, 2008; Pradhan and Arokiasamy, 2006). A low proportion of institutional deliveries, i.e., delivery at a health care facility, coupled with poor level of health assistance is a major cause of maternal and child mortality rates. There has been a huge increase in institutional deliveries between 2004-06 and 2015-16 – from 39 per cent to 79 per cent. Increasing antenatal care coverage has a significant impact on increasing institutional deliveries. However, the wide variation in institutional deliveries across states, despite the implementation of the reproductive child health programme initiative since the 1990s, is alarming.
The risk of infant mortality declines for mothers of all age groups if they have received proper antenatal check-ups (UNICEF, 2004). There has been considerable improvement in the percentage share of women who have had at least four ANC visits during their pregnancy, as recommended by WHO – from 37 per cent in 2005-06 to 51.2 per cent in 2015-16. States such as Kerala, Goa and Jammu and Kashmir reported a high percentage share of women with at least four ANC visits in 2015-16 while Bihar, Nagaland, Uttar Pradesh were the worst performers (as illustrated in Annexure (Figure A6).
Although there has been considerable improvement in antenatal coverage during the last decade, it is necessary to increase coverage further; efforts are also needed to increase awareness of nutritional supplements. In India, although 77.7 per cent of women with a birth in the last five years were provided iron and folic acid (IFA) during their pregnancy, women who took IFA tablets for at least 100 days was as low as 30.3 per cent in 2015-16 (see Annexure Figure A7). Moreover, states that have a higher percentage of women who took IFA tablets for at least 100 days also performed better in ANC coverage.
Postnatal nutritional intervention for infants and children include immunisation and vitamin A supplements. Immunisation of children can reduce child morbidity and mortality (Pradhan and Arokiasamy, 2006; Banerjee, 2018) and has a significant impact on the nutritional status of children (Menon et al., 2018, Gulati et al. 2012). The percentage of children aged 12-23 months who received all the basic vaccinations (BCG, measles, and three doses each of DPT and polio vaccines) increased from 44 per cent in 2005-06 to 62 per cent in 2015-16. The coverage of basic vaccination varies widely across states. The highest coverage has been recorded in Punjab (89.0 per cent), Goa (88.4 per cent) and West Bengal (84.4 per cent) and the lowest in Nagaland (35.4 per cent) and Arunachal Pradesh (38.2 per cent) in 2015-16 (as depicted in Annexure Figure A8).
The other major factor influencing childhood morbidity and mortality – micronutrient deficiency – can be curbed through direct supplementation. The deficiency of vitamin A has serious implications for the immune system and increases the probability of under-nutrition. In

46
this regard, children under five years of age are given vitamin A supplements. In 2015-16, around 59.5 per cent of children aged 6-59 months were given vitamin A supplements in the last six months of the NFHS survey. Across states, the percentage share ranges from 29 per cent in Nagaland to 89 per cent in Goa (see Annexure Figure A8).
4.3. Malnutrition and Underlying Factors Interventions to prevent under-nutrition need to focus on the main underlying factors that determines adequate nourishment such as food, access to health care and nutritional intervention which, in turn depends upon a household’s income, access to household amenities and socio-economic factors (Gulati et al. 2012, Tette et al. 2015). In this paper, we have used mother’s educational status, household wealth index and caste (a proxy of a household’s social status) as the underlying determinants.
As mentioned earlier, mothers’ educational status is strongly associated with the nutritional status of children as well child mortality indicators. There is a body of evidence to suggest that the nutritional, health and educational status of children increases with the parents’, especially mothers’, education level (Thomas and de Vreyer, 1996; Ravallion and Wodon, 2000; Hala 2003; Gillespie and Haddad, 2001; Alderman and Headey, 2017; Spears, Ghosh and Cumming, 2013; Gulati et al. 2012) whereas mortality rates decline with mothers educational status (Banerjee 2018, Pradhan and Arokiasamy 2006; Khan and Mohanty, 2018; Menon et al., 2018; Bora and Saikia, 2018). Educated women have fewer and healthier babies and they are more likely to raise them to become educated and productive, creating a healthier and more stable society (UNICEF, 2007). Around 69 per cent of women were literate in 2015-16 as against 43.3 per cent in 1992-93, reflecting the high priority given to education in various centrally sponsored schemes. Over the years, women’s’ educational level has been improving at the primary, secondary and higher education level.20 Figure 13 below shows the proportion of underweight and stunted children under five and mortality rates in children by women’s educational levels.
20The level of primary education among women increased from 27.2 in 1992-93 to 33.8 in 2005-06, but declined marginally to 32.7 per cent in 2015-16. This could be due to a significant increase in the level of secondary (higher) education from 13.5 per cent (2.6 per cent) to 22.4 per cent (13.7 per cent) during 1992-93 to 2015-16.

47
Figure 13: Proportion of Stunted and Underweight Children under Five Years and IMR by Women’s Educational Status, 2015-16 Stunting and women’s primary education Stunting and women’s secondary education Stunting and women’s higher education
Underweight and women’s primary education Underweight and women’s secondary education Underweight and women’s higher education
IMR and women’s primary education IMR and women’s secondary education IMR and women’s higher education
Source: International Institute of Population Science (2017), National Family Health Survey- IV

48
While the data for 2015-16 indicated no association between the proportion of underweight children and mortality rate and the proportion of women with primary level education, there is a negative association between these parameters when women have completed education beyond the primary level. It is also interesting to note that the slope between these nutritional and mortality indicators gets steeper as women achieve higher education levels.
Literature on nutrition and the mother’s educational status highlights the possible pathways through which a mother’s educational status influences key factors responsible for the prevalence of malnutrition among children. According to the Comprehensive National Nutrition Survey (CNNS, 2016-18) report, the consumption of milk or curd, fruits, eggs, and fish or chicken or meat increases with an increase in the mother’s education level. Additionally, the mother’s education level has a positive effect on sanitation and hygiene, access to safe drinking water, and adequate and appropriate breastfeeding practice.
Another important underlying determinant is the wealth index, a measure of economic status based on the number of household amenities and assets.21 NFHS gives information about the wealth index of households in quintiles. The two important household amenities that have a significant impact on nutritional outcomes and mortality rates and that have been used in the construction of the wealth index are the type of sanitation facilities available and the sources of drinking water (Pradhan and Arokiasamy, 2006; Spears, Ghosh and Cumming, 2013; Gulati et al. 2012, Khan and Mohanty, 2018). WASH initiatives, i.e., safe drinking water, sanitation and hygiene, can be critical in shaping child nutritional outcomes and are key to the success of nutritional interventions.
At the all-India level, 61.1 per cent of the household reported having access to sanitation facilities and 89.9 per cent reported access to improved sources of drinking water in 2015-16. The percentage share of households reporting sanitation facilities (access to toilets) and safe/improved drinking water facility (piped water into dwelling, tube well, public tap or standpipe) are shown in the Annexure (Figure A9 and A10 respectively). States like Bihar, Jharkhand, Chhattisgarh, Madhya Pradesh, Rajasthan, and Uttar Pradesh reported more than 50 per cent of households without a toilet facility. The performance of states in providing improved/safe sources of drinking water was better than in providing sanitation facilities –states that performed poorly in terms of safe drinking water were Assam, Jharkhand and Andhra Pradesh.
Figure 14 plots the proportion of the population in the lowest and richest wealth quintiles and the proportion of stunted and underweight children and infant mortality rates. It shows that the higher the proportion of the population in the lowest wealth quintiles, the higher the proportion of stunted and underweight children and the higher the infant mortality rate. By contrast, states with a higher proportion in higher wealth quintiles show much lower proportions of stunted and underweight children and lower infant mortality rates.
21 The composition of wealth index has been discussed in data and methodology section in detail.

49
Figure 14: Proportion of Underweight and Stunted Children under Five Years and Infant Mortality Rates across the Poorest and Richest Wealth Quintiles, 2015-16
Poorest Quintiles Richest Quintiles
Source: International Institute of Population Science (2017), National Family Health Survey- IV, 2015-16
The spatial distribution of the two bottom most quintiles of the wealth index across districts for the year 2015-16 is illustrated in Figure 15. Evidence of a clear clustering of districts with more than 50 per cent of the population in the two bottom most quintiles is visible in the figure. Many districts in the central, eastern and north-east have more than 50 per cent of population in the two bottom most quintiles whereas districts in Punjab, Kerala, Gujarat, Tamil Nadu and Andhra have less than 20 per cent of their population in these quintiles.

50
Figure 15: Percentage Distribution of Population across Districts by Poorest & Poorer Quintiles, 2015-16
Source: International Institute of Population Science (2017), National Family Health Survey- IV, 2015-16
4.4. Empirical Analysis of Determinants of Malnutrition and Infant Mortality Rates in India The logistic regression estimates for children under five years of age who are underweight, stunted, and wasted using the unit level data from NFHS-IV (2015-16) and NFHS-III (2005-06) are presented in Table 4 and Table 5. For brevity, we will discuss the NFHS-IV results. Likewise, the results of the logistic regression analysis for children under 3 years of age who are underweight, stunted, and wasted for the years 2015-16 (NFHS-IV), 2005-06 (NFHS-III), 1998-99 (NFHS-II) and 1992-93 (NFHS-I) are presented in the annexure (Tables A2-A5).
The dependent variable in the logistic regression assumes the value 0 if the child’s anthropometric indicator is more than median -2 SD (no malnutrition) and 1 if the child anthropometric indicator is less than -2 SD, where anthropometric indicators are measured by weight-for-age (underweight), height-for-age (stunting) and weight-for-height (wasting). The independent variables used in the logistic regression are selected based on UNICEF’s and Lancet series’ framework for the causes of child malnutrition and have been classified into three categories: first, the immediate determinants, which include mother’s BMI index, duration of breastfeeding, consumption of nutritious food (includes green leafy vegetables, fruits, milk and milk products); a second set of factors that include nutritional and health care

51
interventions such as number of antenatal visits during pregnancy, iron folic supplements taken during pregnancy, vitamin A supplementation, place of delivery and whether the child received basic vaccinations (BCG, measles, and three doses each of DPT and polio vaccine excluding polio vaccine given at birth); and the third set that includes underlying factors which include mother’s education, wealth index (composite index which also includes important variables like type of sanitation facility and drinking water sources) and caste (see section 1 for more details on the variables).
The logistic regression model estimates show that the selected immediate, nutritional and health care interventions and underlying factors closely determine all forms of malnutrition (underweight, stunting, and wasting) for children under five years of age for the year 2015-16. The estimates indicate that among the immediate determinants, children whose mothers have BMI > 18.5kg/𝑚𝑚2 have lower log-odds of being underweight (β= -0.51, 95% CI [-0.54, -0.49]), stunted (β =-0.22, 95% CI [-0.24, -0.19]) and wasted (β=-0.39, 95% CI [-0.41, -0.36]).
The other immediate cause of child malnutrition is the duration of breastfeeding and the reference category is children who have never been breastfed. The logistic regression estimates show a strong negative association between children who are breastfed for the first six months and malnutrition indicators, i.e. underweight rates (β= -0.28, 95% CI [-0.33, -0.22]) and stunting (β= -0.54, 95% CI [-0.60, -0.48]). Children who are breastfed for the first six months exclusively have a lower probability of being malnourished. However, if the child is still breastfed for more than 13 months, the β coefficients of underweight and stunting turn positive, depicting that there is a higher probability of being underweight (β= 0.14, 95% CI [0.08, 0.20]) and stunted (β= 0.24, 95% CI [0.18, 0.29]). This is because a child needs to be exclusively breastfed till six months, but needs to be given nutritious and solid food to improve his/her nutritional status after the sixth month. The estimates also indicate that the consumption of nutritious food (includes green leafy vegetables, fruits, milk and milk products) has a significant impact on reducing the probability of being underweight (β= -0.16, 95% CI [-0.18, -0.13]).
Across nutritional and health care interventions, higher coverage of ANC, measured by the number of ANC visits, has a negative and statistically significant relationship with stunting and underweight rates. The higher the number of ANC visits, the higher is the decline in child under-nutrition rates. Women with more than 10 ANC visits have lower chances of having children who are underweight (β= -0.24, 95% CI [-0.29,-0.18]) and stunted (β= -0.25, 95% CI [-0.30, -0.20]). Although supplementation with IFA tablets during pregnancy is negatively associated with underweight (β= -0.03, 95% CI [-0.06,-0.0]) and stunted (β= -0.09, 95% CI [-0.11, -0.06]) children, the magnitude of the coefficient was much smaller as compared to ANC visits. Delivery in a health care facility (government or private), as compared to delivery at home also lowers the log-odds of being underweight (β= -0.07, 95% CI [-0.10,-0.04]) and stunted (β= -0.04, 95% CI [-0.07, -0.01]).
The association between the mother’s education level and the probability of underweight and stunted children under five years of age is also strong and statistically significant. For children under five years whose mothers have studied only up to the primary education level, the log-
52
odds of being underweight (stunted) declined by -0.16 (-0.15) as compared to the children whose mothers are illiterate.
Similarly, for children belonging to mothers with secondary education level, the log-odds of being underweight (stunted) declined by -0.31 (-0.37). Children belonging to mothers with higher education level have lower log-odds of being underweight (β= -0.64, 95% CI [-0.69,-0.59]), stunted (β= -0.59, 95% CI [-0.73,-0.62]) and wasted (β= -0.04, 95% CI [-0.09, 0.01]) as compared to those belonging to mothers with education up to the secondary and primary level.
The magnitude of the coefficient of child malnutrition indicators increases with increasing wealth quintiles. For every one unit increase in the richest wealth quintiles, the log odds of being underweight (stunted) declined by -0.73 (CI [-0.77, -0.68]) (-0.59(CI [-0.63, -0.54]) whereas the log-odds of being wasted declined by -0.25(CI [-[-0.29, -0.21]). Caste, a proxy for the social status of the household, also shows a negative relation with being underweight, stunted and wasted. The non-scheduled population, including OBCs and upper castes, have lower log-odds of being underweight (-0.13 CI [-0.15, -0.10]), stunted (-0.09 (CI[-0.11, -0.07]) and wasted (-0.11 (CI[-0.13, -0.08])) as compared to children from the scheduled caste and tribe population.
Among the logistic estimates of the immediate, nutrition and health care intervention and underlying factors, we find that the household’ wealth index and child malnutrition indicators (underweight, stunting and wasting) have the largest and significant negative association. The estimates clearly show that malnutrition is a multidimensional problem that requires addressing these key determinants if significant progress is to be made towards achieving the SDGs by 2030.

53
Table 4: Logit Estimates of Children under Five Years of Age who are Underweight, Stunted and Wasted against its Determinants, 2015-16 Variables Underweight Stunting Wasting
Coefficient [95% CI] Coefficient [95% CI] Coefficient [95% CI] Immediate determinants:
Mother’s BMI (Reference: BMI lower than 18.5) BMI >18.5 -0.51*** [-0.54, -0.49] -0.22*** [-0.24, -0.19] -0.39*** [-0.41, -0.36]
Duration of breastfeeding (Ref: Never breastfed) 0-6 months -0.28*** [-0.33, -0.22] -0.54*** [-0.60, -0.48]
7-12 months -0.15*** [-0.21, -0.09] -0.35*** [-0.41, -0.29]
13 and above months 0.14*** [0.08, 0.20] 0.24*** [0.18, 0.29] Consumption of nutritious food * by child (Ref : did not consume) Consumed -0.16*** [-0.18, -0.13]
Nutritional Interventions:
Antenatal visits (Ref: No visits) 1-4 visits -0.04*** [-0.07, -0.01] -0.10*** [-0.14, -0.07]5-10 -0.13*** [-0.17, -0.10] -0.27*** [-0.31, -0.24]10 above -0.24*** [-0.29, -0.18] -0.25*** [-0.30, -0.20]Taken Iron Folic Supplements during pregnancy (Ref: not taken) Taken supplements -0.03*** [-0.06, -0.00] -0.09*** [-0.11, -0.06]
Place of delivery (Ref: at home) Institution (Private or Govt. health care facility) -0.07*** [-0.10, -0.04] -0.04*** [-0.07, -0.01]
Underlying factors:
Mother’s Educational status (Ref: No Education)

54
Primary -0.16*** [-0.19, -0.13] -0.15*** [-0.18, -0.11] -0.03* [-0.07, 0.00]Secondary -0.31*** [-0.33, -0.28] -0.37*** [-0.40, -0.34] 0.01 [-0.02, 0.04] Higher -0.64*** [-0.69, -0.59] -0.67*** [-0.73, -0.62] -0.04* [-0.09, 0.01]Wealth Index ( Ref: poorest) Poorer -0.18*** [-0.21, -0.15] -0.10*** [-0.12, -0.07] -0.10*** [-0.13, -0.07]Middle -0.36*** [-0.39, -0.32] -0.23*** [-0.26, -0.19] -0.18*** [-0.21, -0.15]Richer -0.50*** [-0.53, -0.46] -0.39*** [-0.42, -0.35] -0.19*** [-0.23, -0.15]Richest -0.73*** [-0.77, -0.68] -0.59*** [-0.63, -0.54] -0.25*** [-0.29, -0.21]Caste (Ref: Scheduled population) OBCs or Others -0.13*** [-0.15, -0.10] -0.09*** [-0.11, -0.07] -0.11*** [-0.13, -0.08]
Constant 0.58*** [0.51, 0.64] 0.45*** [0.38, 0.51] -0.82*** [-0.85, -0.80]
Number of observations 160493 160493 216027Pseudo R square 0.06 0.06 0.01
Source: Author’s calculation Note: *Nutritious food includes green leafy vegetable, fruits, milk and milk products. **Basic vaccinations include BCG, measles, and three doses each of DPT and polio vaccine (excluding polio vaccine given at birth) *** The results are based on WHO standards.
Table 5: Logit Estimates of Children under Five Years of Age who are Underweight, Stunted and Wasted against its Determinants, 2005-06
Variables Underweight Stunting Wasting
Coefficient [95% CI] Coefficient [95% CI] Coefficient [95% CI] Immediate determinants:
Mother’s BMI (Reference: BMI lower than 18.5) BMI >18.5 -0.45*** [-0.5, -0.4] -0.17*** [-0.22, -0.12] -0.44*** [-0.5, -0.39]
Duration of breastfeeding (Ref: Never breastfed) 0-6 months -0.40*** [-0.63, -0.16] -1.09*** [-1.31, -0.86]

55
7-12 months -0.07 [-0.3, 0.17] -0.49*** [-0.71, -0.27]13 and above months 0.29*** [0.06, 0.52] 0.24** [0.02, 0.45]
Nutritional Interventions:
Antenatal visits (Ref: No visits) 1-4 visits -0.28*** [-0.34, -0.22] -0.15*** [-0.22, -0.09] -0.13*** [-0.2, -0.06]5-10 -0.44*** [-0.52, -0.36] -0.36*** [-0.44, -0.28] -0.25*** [-0.35, -0.16]10 above -0.73*** [-0.89, -0.57] -0.58*** [-0.73, -0.42] -0.40*** [-0.6, -0.2]Basic Vaccinations **(Ref: Not received)Received -0.24*** [-0.3, -0.17] Place of delivery (Ref: at home)Institution (Private or Govt. health care facility) -0.11*** [-0.17, -0.05] -0.11*** [-0.17, -0.05]
Underlying factors:
Mother’s Educational status (Ref: No Education) Primary -0.14*** [-0.21, -0.07] -0.11*** [-0.18, -0.04] -0.03 [-0.11, 0.06]Secondary -0.26*** [-0.32, -0.2] -0.28*** [-0.34, -0.21] -0.10*** [-0.18, -0.02]Higher -0.64*** [-0.79, -0.49] -0.68*** [-0.82, -0.54] -0.07 [-0.24, 0.1]Wealth Index ( Ref: poorest) Poorer -0.19*** [-0.25, -0.12] -0.13*** [-0.2, -0.06] -0.12*** [-0.19, -0.04]Middle -0.40*** [-0.47, -0.33] -0.21*** [-0.29, -0.14] -0.24*** [-0.33, -0.16]Richer -0.53*** [-0.61, -0.45] -0.33*** [-0.41, -0.25] -0.32*** [-0.42, -0.22]Richest -0.92*** [-1.03, -0.82] -0.70*** [-0.8, -0.6] -0.47*** [-0.6, -0.35]Caste (Ref: Scheduled population) OBCs or Others -0.38*** [-0.51, -0.26] -0.20*** [-0.32, -0.08] -0.34*** [-0.5, -0.17]
Constant 0.62*** [0.39, 0.86] 0.65*** [0.42, 0.87] -0.59*** [-0.66, -0.52]Number of observations 30249 30249 27461Pseudo R square 0.09 0.09 0.03
Source: Author’s calculation

56
Note: **Basic vaccinations include BCG, measles, and three doses each of DPT and polio vaccine (excluding polio vaccine given at birth) *** The results are based on WHO standards
4.5 Determinants of Infant Mortality Rate As discussed in the conceptual framework, mortality and nutritional security are closely interlinked and several of the multi-sectoral solutions to address child malnutrition such as breastfeeding practices, health care utilisation, wealth index and mother’s educational status along with birth order and mother’s age have a significant impact on child mortality. Taking infant mortality as a composite indicator of child mortality, we examine the impact of these variables on infant mortality. This will help us understand what measures need to be taken to achieve the child mortality targets under SDG 3.
We estimate the key determinants of infant mortality using a Cox proportional hazard model, controlling for other predictors in the model. In our regression, the risk of a child dying before attaining one year of age (infant mortality) is regressed over the key independent variables of the Cox Hazard model for the years 2015-16 (NFHS-IV), 2005-06 (NFHS-III), 1998-99 (NFHS-II) and 1992-93 (NFHS-I) (Table 6). For the sake of parsimony, we will discuss the results for the year 2015-16.
The parameter estimate of the Cox proportional hazard model represents the increase in the expected log of relative hazard (in our case death of the child before attaining one year of age) for each unit increase in the predictor, holding other predictors constant. In other words, a positive parameter estimate signifies that the hazard (risk of death before one year of age) is higher and, thus, the prognosis worse for the child with higher values of that predictor. For example, the exponential coefficient (exp (-1.45)) of a breastfed child is 0.87, also known as the hazard ratio. To make the comprehension of the results easier, we will discuss the coefficients rather than the hazard ratio.
For children who are breastfed in reference to never breastfed children, the risk of infant mortality (children dying before attaining one years of age), measured as the expected log of hazard ratio, declines by -1.45 (or reduces the hazard ratio by 0.87). The higher the number of ANC visits, the lower the risk of infant mortality. For children whose mother had more than 5-10 ANC (more than 10 ANC) visits, the risk of infant mortality decreases by -0.27 (-0.28) or the hazard ratio reduces by a factor of 0.76 (0.76).
For every unit increase in the number of mothers who took IFA supplements during pregnancy in reference to mothers who did not take IFA tablets, the risk of infant mortality decreases by -0.23. Mother’s age also has a significant impact on child mortality indicators. As compared to young mothers (aged 15-20 years), being mothers in the age group 20-30 years, 30-40 years and 40 years and above reduces the risk of their children dying before one year of age, i.e., the expected log of hazard ratio, by -0.55, -0.59 and -0.64 respectively.

57
Various studies have shown that the birth order of the children has a strong effect on child mortality. Children of the birth order 2 and above have a higher risk of infant mortality compared to children of first birth order. The Cox estimates shows that for every unit increase in children with birth order between 4 and 5, and six and more, the risk of death before the age of one increases by 0.50 and 0.82 respectively (or increases their hazard by a factor of 1.65 and 2.27 respectively).
Mother’s education has a significant impact on reducing the hazard ratio of children dying before one year of age. For each year’s increase in primary (secondary) education, the risk of children dying before one year of age reduces by -0.20 (-0.35). At higher education levels, the risk of infant mortality, i.e., log of hazard ratio, gets reduced by -0.57. In line with earlier research findings, our finding reiterates that higher education has a significant impact on child malnutrition and mortality indicators.
Wealth index is another key determinant of child mortality rates, which subsumes important mortality causes such as access to sanitation facilities and safe drinking water and living standard. The children in households belonging to the richer and richest quintiles have a lower risk of infant mortality. For infants belonging to households of richer (richest) wealth quintiles, the risk of infant mortality, i.e. log of hazard ratio, decreases by -0.22 (-0.48).
Our Cox Proportional Hazard model analyses the way in which maternal age, utilisation of health care facilities and nutritional interventions, and socio-economic factors such as wealth index and mother’s education influenced infant mortality in 2015-16. Maternal and health care facilities have a statistically significant impact on infant mortality. A major contribution to curb infant mortality comes from breastfeeding practices, mother’s education, maternal age and wealth index. These key indicators can be addressed by focusing on nutritional interventions, improving the access to health care programmes, increasing awareness of factors that pose high risk of mortality and taking preventive measures to address the issue of infant mortality. Priority should also be given to improving the educational status of girls, and reducing dropout rates among girls, particularly at the higher educational levels.
Table 6: Coefficients of Cox Proportional Hazard Model for infant mortality (children who have died before attaining 1 year of age) over its determinants, 2015-16 (NFHS-4) Determinants NFHS 4
(2015-16) NFHS-3
(2005-06) NFHS-2
(1998-99) NFHS-1
(1992-93) Breastfeeding (Ref: Never breastfed) Breastfed children -1.45*** -1.40*** -1.92*** -1.80***Antenatal visits (Ref: No visits) 1-4 visits 0.00 -0.46*** -0.52***5-10 -0.27*** -0.84*** -0.93***10 above -0.28* -0.09 -0.78***Taken Iron Folic Supplements during pregnancy (Ref: not taken) Taken supplements -0.23***Mother’s age (15-20 years) 20-30 years -0.55*** -0.44*** -0.37*** -0.24***

58
30-40 year -0.59*** -0.58*** -0.37*** -0.18*Above 40 years -0.64*** -0.63*** -0.06 0.42***
Birth order (Ref: 1) 2–3 0.05 4–5 0.50*** 6+ 0.82***
Mother’s Educational status (Ref: No Education) Primary -0.20** -0.41*** 0.12 -0.08Secondary -0.35*** -0.68*** -0.40*** -0.24**Higher -0.57*** -1.19*** -1.01*** -1.73***Wealth Index ( Ref: poorest) Poorer 0.05 0.22** -0.18 -0.05Middle 0.05 0.00 -0.19 -0.18**Richer -0.22** -0.24** -0.47*** -0.19**Richest -0.48*** -0.39** -0.41** -0.43***
Number of subjects 179388 53443 31198 46445No. of failures 1338 902 561 1159 Log Likelihood -15731 -9624 -5593 -12107LR Chi-square 694.3 278.9 286.1 459Prob>chi-square 0.00 0.00 0.00 0.00
Source: Author’s calculation from NFHS-I, II, III, IV
Based on the regression analyses, we have identified the key determinants of child malnutrition and infant mortality rates in India using the most recent unit level data of the NFHS. In the next section, we critically assess existing policies and programmes in India to achieve nutritional security, to address the determinants and implications, and highlight their successes and failures.

59
5. Future Prospects and Existing Policy Initiatives
5.1. Nutrition Sensitive Interventions in India
Tackling the challenges of malnutrition requires adoption of an approach that combines short and long term actions, and strengthens the linkages between the preventable and curable aspects, developmental and humanitarian interventions (FAO, 2015). According to UNICEF (2015), the risk of stunting, wasting, micronutrient deficiencies, being overweight and obesity can be significantly reduced through nutrition specific interventions by focusing on disadvantaged women (particularly pregnant and lactating women) and children under the age of 2 years. There exists a strong linkage between social protection intervention and malnutrition as nutrition sensitive programmes help improve the nutritional status of the household in which a child grows and develops by increasing the level of coverage and scale of the intervention. Health is a major determinant of nutritional status, which is affected by household access to clean water and sanitation facility, and use of health services. Thus, nutrition sensitive programmes need to be integrated with programmes on food security, agriculture, poverty alleviation, employment generation and education to bring nutritional security in India.
There are already a number of nutritional schemes relating to food, health, water and sanitation, poverty and education in India that directly/indirectly affect the nutritional status of children (0-6 years of age), pregnant women and lactating mothers. Some of these schemes are discussed below.
Food Security and Nutrition Programmes
Among the major programmes being implemented by the government at the national level is the provision of food grains (wheat and rice) to around 813 million individuals (67 per cent of the population) residing in India under the National Food Security Act (NFSA) (the largest food based programme in the world). The scheme is being implemented in all 36 states/UTs. Studies have shown that access to the public distribution system (PDS) increases the consumption of cereals and hence, the intake of calories by households. However, the PDS system has often been criticised for poor targeting and high exclusion errors. As per the Economic Survey 2017-18, around 40 per cent of the bottom 40 per cent of India’s population was not included in PDS. Besides, various studies have estimated that PDS leakages22 were more than 40 per cent in 2011-12 (Dreze and Khera, 2015; Gulati and Saini, 2015). States such as Jharkhand, Nagaland and Manipur had more than 75 per cent of food grain leakages from the PDS in 2011-12(Figure 16). However, the system leakages from the PDS have fallen to 20.8 per cent (Economic Survey 2017-18). Besides, the reforms undertaken under PDS such as digitisation of ration cards, automation of fair price shops and aadhar seeding in PDS could be the key factors for the improvement in the malnutrition status of the country (Welthungerhilfe et al., 2014).
22Leakages are defined as an excess of grains supplied over what is consumed through the PDS by a state’s population (Gulati and Saini, 2015).

60
As mentioned earlier, the consumption basket of an individual is not only limited to rice and wheat but has diversified with time towards meat, fish, eggs, fruits etc. But, PDS in its current form, focuses on providing calories to individuals in the form of wheat and rice, which needs to be diversified with evolving consumer preferences.
Figure 16: PDS Leakages in Indian States (%)
Source: Adapted from ‘Leakages from Public Distribution System (PDS) and the way forward’; Gulati, A and Saini, S, 2015.
Additionally, through NFSA (2013), the government has provided financial and nutritional support to pregnant and lactating mother under the Integrated Child Development Scheme (ICDS) (more than 8.75 crore beneficiaries) and children aged 6 months to 14 years under the mid-day meal (MDM) scheme (9.17 crore studying in 11.34 lakh institutions in 2018-19) (Lok Sabha Question, 2019a).
The central government has given high priority to the issue of malnutrition and has implemented various schemes like anganwadi services, scheme for adolescent girls and Pradhan Mantri Matru Vandana Yojna (PMMVY) under the umbrella ICDS Scheme. The
61
services under the ICDS scheme are provided through anganwadi workers (AWWs) and anganwadi helpers (AWHs) at all local ICDS (or anganwadi) centres.
Despite these programmes, India still suffers from the problem of a high proportion of stunted, wasted and underweight children. Concerted efforts have been made by the government to improve the nutritional status of people, particularly since 2015-16. The National Nutrition Mission (renamed POSHAN–Abhiyaan) was one such scheme introduced by the government in November 2017 to reduce the level of stunting, under-nutrition, anaemia and low birth weight babies. Under the POSHAN Abhiyan, the government has fixed targets to reduce stunting, under-nutrition, anaemia (among young children, women and adolescent girls) and low birth weight by 2 per cent, 2 per cent, 3 per cent and 2 per cent per annum respectively. The mission also aims to reduce the level of stunting in India to 25 per cent by 2022. It has a three-year budget of Rs.9046.17 crore, starting from 2017-18 (GoI 2017a).
Similarly, in order to provide accessible and affordable healthcare to an individual, Ayushman Bharat – Pradhan Mantri Jan Aarogya Yojana (AB-PMJAY) was launched on September 23, 2018. The scheme provides health coverage of up to Rs.5 lakh per family per year for secondary and tertiary hospitalisation to around 10.74 crore poor and vulnerable families through empanelled hospitals (GoI, 2019b).
The major weaknesses of existing national nutritional programmes are the lack of proper monitoring and targeting and the narrow focus on the consumption of staples.
Educational Programmes
It has been widely accepted that women’s education is closely linked to a reduction in the fertility rate, mortality rate, lower population growth and improved nutrition (Pandey 2018). Our regression findings have established that education, particularly mother’s education, plays an important role in ensuring nutritional security. There are various policies and programmes in India that focus on increasing literacy as well as the quality of education, especially among girls.
In India, free and compulsory education for all children in the age group of six to fourteen years is a fundamental right. Eight years of elementary education, which starts at the age of six years, is compulsory. In May 2008, the National Scheme of Incentive to Girls for Secondary Education (NSIGSE) was launched to reduce dropout rates and promote the enrolment of the girl child (14-18 years) at the secondary stage. The scheme covered all SC/ST girls who have passed class VIII from Kasturba Gandhi Balika Vidyalayas (irrespective of whether they belong to the SC/ST community) and enrolled for class IX in state/UT government, government-aided or local body schools. The scheme provided a sum of Rs.3000 to eligible girls as a fixed deposit that can be withdrawn with interest once they turn 18 years and have passed the class 10th examination (GoI, 2016a).

62
To enable self-development, improve their nutritional and health status, and promote awareness about health, hygiene and nutrition among adolescent girls of the age group 11-18 years, the Rajiv Gandhi Scheme for the Empowerment of Adolescents – SABLA – was launched in 2010 in 200 districts of India on a pilot basis. The central government also introduced the Beti Bachao Beti Padhao (BBBP) campaign on January 22, 2015, to address the declining sex ratio and eliminate gender bias against the girl child. As a result, the sex ratio at birth has increased from 918 in 2014-15 to 931 in 2018-19 (GoI, 2018a). The scheme is being implemented in 640 districts (Census 2011) in the country of which 405 districts are covered under a multi-sectoral intervention and advocacy and media campaign, while the remaining 235 districts are covered under the advocacy and media campaign only.
More recently, the Government of India launched the Samagra Shiksha scheme in 2018-19 to make good quality education accessible and affordable to all. The scheme subsumed the three erstwhile centrally sponsored schemes of Sarva Shiksha Abhiyan (SSA), Rashtriya Madhyamik Shiksha Abhiyan (RMSA) and Teacher Education (TE) (GoI, 2020a).
As a result of these initiatives, the enrolment ratio of girls to boys at the primary level (class I-V) improved to 95.39 per cent in 2017-18 from 85.5 per cent in 1990-91. The dropout rates among girls at the primary level declined from 6.49 per cent in 2014-15 to 6.30 per cent in 2016-17 (Lok Sabha Questions Unstarred, 2018b). According to the ASER rural report (2018), the overall proportion of girls in the age group 11 to 14 years who are out of school has fallen to 4.1 per cent.
However, the dropout rates among girls increased from 20.19 per cent in 2014-15 to 22.15 per cent in 2016-17 at the secondary school level and from 4.56 per cent in 2014-15 to 12.98 per cent in 2016-17 at the higher secondary level (Lok Sabha Unstarred Question, 2018b. The predominant reason for girls dropping out is due to family constraint and financial burdens. Moreover, distance between school and home, household chores, early marriage and low aspiration towards female education also increases the dropout rates (ASER, 2017; Basumatary, 2012; CRY, 2019). This requires policy initiatives through awareness programmes between parents and community to reduce dropout rates among girls (Taneja, 2018).
In India, only one tenth of women had attained higher education levels (12 or more years of education completed), even though it is evident from our regression that higher education among mothers has the strongest impact on bringing down the malnutrition level. The emphasis in educational programmes clearly needs to shift their focus from the primary to higher education level. In India, around 376 districts in India had less than or equal to 10 per cent of women with higher education (Figure 17). Kerala and Uttarakhand are the only states with more than 30 per cent of women with higher education levels.

63
Figure 17: Percentage Distribution of Women by Higher Education Level across Districts, 2015-16
Source: International Institute of Population Science (2017), National Family Health Survey- IV, 2015-16
WASH initiatives: Water and Sanitation Programmes
Investments in water, sanitation and hygiene (WASH) are crucial for improving child nutrition and mortality rates (Heady and Palloni, 2019). According to a report by the Water and Sanitation Program (2011), inadequate sanitation in India led to an economic cost of Rs.2.4 trillion or 6.4 per cent of India’s GDP in 2006. Various studies have proved the importance of water, sanitation and hygiene to address the issue of child stunting (Dodos et al., 2017; Cumming and Cairncross, 2016). In 2010, out of 1.1 billion individuals defecating openly in the world, 626 million were from India while China had only 14 million people defecating in the open (UNICEF, 2012).
In 2015, the issue of sanitation became a global priority after it became a part of UN’s SDGs. According to UN (2018), WASH in schools improves access to education and the outcomes of learning, especially among girls by providing them a safe and equitable environment. However, across rural India, sanitation coverage stood at only 38.7 per cent in 2014 showing slow progress in the provision of toilet facilities. To provide sanitation to a country with a population of around 1.35 billion people, the Government of India launched the Swachh Bharat Abhiyaan on October 2, 2014. The aim of the mission was to eliminate open defecation, eradicate manual scavenging, bring about behavioural change regarding healthy sanitation practices and generate

64
awareness among citizens regarding sanitation and its linkage with public health. Figure 18 shows the reduction in the percentage of population defecating openly in India in 2019-20 over 2015-16. As on October 2, 2019, all 36 states and union territories were declared 100 percent open defecation free in rural areas (Ministry of Jal Shakti, GoI). In urban areas, 99 percent (4324) of the cities were declared open defecation free, of which 96 percent (4204) of the cities have been verified as on August 4, 2020 (Ministry of Housing and Urban Affairs, GoI). The abhiyaan has played a significant role in improving sanitation facilities in the country. The impact of the mission on combating malnutrition can only be assessed in the coming years.
In addition to the Swachh Bharat Mission, the central government restructured the National Rural Drinking Water Programme (NRDWP) into Jal Jeevan Mission (JJM) to provide every rural household with a functional tap connection providing water at the rate of 55 litres per capita per day – Har Ghar Nal Se Jal (HGNSJ) – by 2024. As on April 1, 2019, only 3.27 crore rural households had a connection for piped water supply while 14.60 crore rural households did not have tap connections for piped water supply (Lok Sabha Unstarred Question, 2020b).

65
Figure 18: Open Defecation in India, 2015-16 and 2019-20
Source: National Family Health Survey (2015-16); Ministry of Housing and Urban Affairs, GoI; Ministry of Jal Shakti, GoI Note: Due to the unavailability of district level data of open defection in India for 2019-20, we have used the state level data.

66
Poverty Alleviation Programmes
Ending extreme poverty has been recognised as the most important SDG goal which has a significant impact on other SDGs. Poverty in India has declined from 45.9 per cent in 1993 to 13.4 per cent in 2015 (measured at $1.9 per capita per day at 2011 purchasing power parity). A large number of programmes and initiatives have been implemented by the government to combat poverty, including employment generation programmes and providing support to backward areas and vulnerable people.
For instance, the Deendayal Antodaya Yojana – National Rural Livelihoods Mission (DAY-NRLM) – was launched to reduce the level of poverty in rural areas by building sustainable community institutions for the poor. The aim of the programme was to ensure that at least one woman member from about 9 crore households became a part of a women’s self-help group (SHG). Similarly, the National Urban Livelihood Mission (NULM) was introduced to create employment opportunities and income for the urban poor through skill development and training, providing shelter to the urban homeless with essential services, forming SHGs in a phased manner, etc.
Additionally, rural workers are protected against unemployment to the extent of 100 days under the Mahatma Gandhi National Rural Employment Guarantee Act (MGNREGA), which was launched in 2005. It aims to provide 100 days of wage employment to every rural household. According to CACP (2012), MGNREGA has been one of the important factors contributing to an increase in rural wages.
Based on the findings of our linear projections of extreme poverty as well as review of literature, India seems to be on track to end poverty before 2030, although these projections are based on the business-as-usual scenario and do not take account the impact of COVID-19, which could act as a dampener in achieving the target. However, since the projections also do not account for the various special programmes introduced since 2015-16 to achieve the SDGs by implementing schemes such as the POSHAN Abhiyaan (National Nutrition Mission), National Health Mission, Swachh Bharat Abhiyaan (water, sanitation and hygiene), and the beti bachao beti padhao mission which aim to strengthen nutrition, healthcare, hygiene/sanitation and education in the country, it is possible that the impact of these programmes could offset some of the effects of COVID-19 on the progress in achieving the SDGs.
With only 10 years remaining, it is imperative to examine if the country is well equipped to achieve nutritional security by 2030. For this, we examine the budgetary expenditure on various nutritional programmes in the country. In India, a total of Rs.3.66 lakh crore has been earmarked for nutrition and other programmes affecting nutrition like the ICDS, MDM, NFSA, National Health Mission, Swachh Bharat Mission, National Education Mission and others in 2020-21. The allocation for the mid-day meal scheme and the umbrella ICDS for 2020-21 is higher as compared to the allocation made in 2018-19 and 2019-20. The expenditure for sanitation and drinking water facilities, which are closely related to child development, have

67
increased to Rs.0.23 lakh crore in 2020-21 (BE) as compared to Rs.0.20 lakh crore in 2018-19 (see Annexure Table A6).
With the emergence of COVID-19 pandemic, a part of the government spending will be allocated to revive the crippled Indian economy. These adjustments in health and budgetary resources to tackle the COVID-19 crisis, in turn, will affect the effective implementation of existing nutrition sensitive programmes. In the next section, we will discuss what the impact of the pandemic on nutritional security will be and what government can do to mitigate its negative impact.
5.2. Covid-19 Impact on Food and Nutritional Security The novel coronavirus disease (COVID-19) was declared a pandemic by the World Health Organization (WHO) on March 11, 2020. Countries were advised to take immediate action to stem the spread of the infection and save lives with minimum impact. As on July 20, 2020, a total of 14,508,892 cases of coronavirus have been confirmed worldwide, leading to the death of 606,206 people according to the John Hopkins Coronavirus Resource Centre. India took early action in the form of a nationwide lockdown to prevent the spread of coronavirus. Yet, the numbers quoted by the Ministry of Health and Family Welfare (MoHFW) shows that 11,18,043 cases have been reported in 32 states/UTs with 27,497 fatalities as of July 20, 2020.
The measures being taken by India as well as by other countries will help in fighting the spread of COVID-19 but a complete shutdown of all economic activities worldwide will have a negative economic impact. Moreover, the pandemic will also have a severe impact on absolute poverty in the short run. Many international agencies have estimated the impact of COVID-19 on global poverty. The World Bank claims that around 40-60 million people will be in extreme poverty globally in the coming months given the severity of the economic shock. Kharas and Hamel (2020) have shown that extreme poverty (measured at international poverty line of $1.9 per day per capita) would increase by 50 million globally. For India, their estimates predict that the number of the extremely poor will increase by 10 million in the current year. So, the pertinent question is what will be the impact of the Covid-19 on the progress achieved in terms of nutritional security and what needs to be done to mitigate its negative impact on hunger and malnutrition in India.
The central government had initially announced Rs.1.70 lakh crore for the Pradhan Mantri Garib Kalyan Yojana (PMGKY). The package provided free food grain and cash payments to women, the poor, senior citizens and farmers. PMGKY offers an additional 5 kg of food grain and 1 kg of pulses per household to 80 crore individuals covered under NFSA until November 2020. Additionally, a relief-cum-stimulus package of Rs.20 lakh crore was announced by the government (10 per cent of the GDP) to achieve Aatmanirbhar Bharat (self-reliant India). The package subsumes a range of monetary and fiscal stimuli to revive the crippled Indian economy. These packages by the central government had neglected the urgent need for economic support to the millions of citizen who have lost their livelihood, particularly migrant workers. The only relief that was announced in the ‘stimulus package’ was distribution of free

68
food grains to around 8 crore migrants for two months who were left stranded by the lockdown. However, neither of these relief packages is considered sufficient to mitigate the negative impact of the pandemic on food and nutritional security.
Moreover, various initiatives taken by the centre and the state governments in terms of food transfer schemes such as MDM and ICDS have been frozen due to the breakdown of food markets. The COVID-19 pandemic has highlighted the gaps in our public health system and social safety nets that put nutritional security at risk and needs to be addressed. Unless state governments takes urgent measures to keep food safety nets, and maternal and child health services functioning, the situation of malnutrition among women and children could worsen in the country (Headey and Ruel, 2020).
Based on our discussion of existing nutritional interventions, the emergence of Covid-19, and the current trend of the three interrelated SDGs, we will project if India will be able to eradicate nutritional insecurity by 2030. Monitoring shortfalls in meeting the SDG targets will throw light on the best possible ways to end malnutrition, eliminate extreme poverty and reduce mortality rates to achieve global targets and nutritional security by 2030. This will also help in developing a policy framework to change the current trajectory to tackle the challenge of nutritional security.
5.3 Projection of SDG Targets Based on Current Trends and Existing Nutritional Programmes Figure 28 shows the estimated linear projection for extreme poverty, child mortality indicators (U5MR, IMR, NMR) and malnutrition indicators for children under five years of age (underweight, stunting and wasting) for 2030 using business-as-usual projections. Projecting trends until 2030 will help us focus on areas that require a serious breakthrough. However, these projections do not account for the COVID-19 impact and must be interpreted with the caveat of linear projections.
A simple linear projection of extreme poverty measured by the World Bank’s international poverty line at $1.9 (2011 PPP) shows that if the current trend continues, India will be able to eradicate extreme poverty much before 2030. Projections of the infant mortality rate, under five mortality rates and neonatal mortality rate (per 1000 live birth) show that the child mortality indicators will decline considerably by 2030. Based on our business-as-usual projections, India seems to be on track to achieve the target of reducing neonatal mortality rates and under five mortality rates to 12 per 1000 live births and 25 per 1000 live births respectively by 2030. This is line with the findings of a recent study by Kharas et al. (2018), which states that India is on track to achieve the SDG goals relating to the elimination of extreme poverty and reducing child mortality.
The projections of malnutrition indicators, being underweight, stunting and wasting for children under five, are expected to lag far behind the SDG targets of 2030 (Figure 19). These projections illustrate that the SDG target of bringing down stunting and wasting will not be met

69
unless more focused action is taken. Moreover, there is also fear of an increase in the incidence of wasting in India by 2030. Our projection of malnutrition indicators are also in line with the findings of Kharas et al. (2018), who found that India will account for 33 per cent and 21 per cent of the total worldwide number of stunted and wasted children respectively. The progress of SDGs in India holds the key to the achievement of SDGs globally.
The business-as-usual projections have some limitations as this method suffers from aggregation bias (Nicolai et al 2015). These projections are also based on a constant annual percentage decline, which may slow down and become non-linear over time (Ravallion, 2015). Since these projections are based on continuation of past trends, they do not take into account the impact of COVID-19. The pandemic is likely to derail India from its trajectory to achieve the SDGs by 2030. The programmes and policies implemented after 2015, having significant impact on nutritional security, are not accounted for in these projections. However, there is reason to believe that the progress achieved in the schemes implemented after 2015 and emergence of COVID-19 pandemic will alter the trend of our projections.
Hitherto, we have critically analysed the existing policies and impact of these policies on achieving nutritional security by 2030. In addition, our linear projections also highlight the areas that need close monitoring. However, there are many other developing nations that are closer to achieving their SDG targets. For instance, Brazil and China are on track to end poverty and reduce child mortality by 2030. The findings of Kharas et al. (2018) show that Brazil will account for 1 per cent each of the total number of stunted and wasted children worldwide whereas China will account for 5 per cent and 3 per cent of the total number of stunted and wasted children respectively by 2030. Thus, India can draw lessons by critically analysing the policies and programmes of these emerging economies.
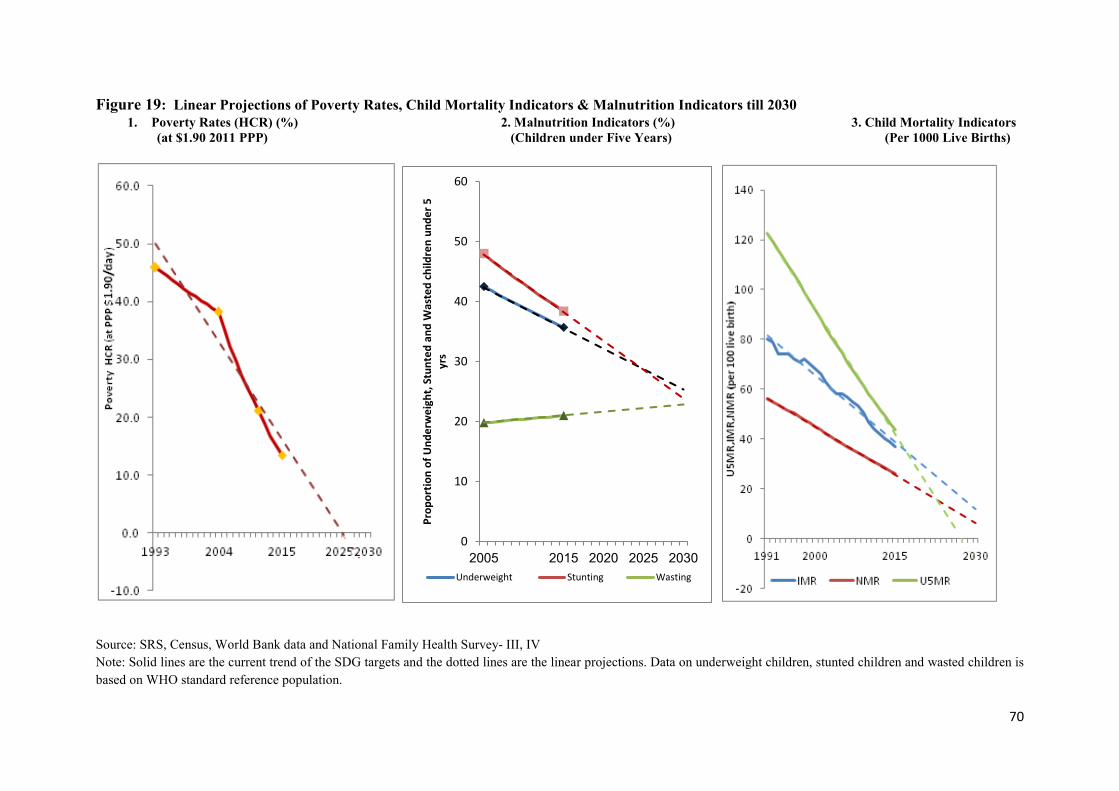
70
Figure 19: Linear Projections of Poverty Rates, Child Mortality Indicators & Malnutrition Indicators till 2030 1. Poverty Rates (HCR) (%) 2. Malnutrition Indicators (%) 3. Child Mortality Indicators
(at $1.90 2011 PPP) (Children under Five Years) (Per 1000 Live Births)
Source: SRS, Census, World Bank data and National Family Health Survey- III, IV Note: Solid lines are the current trend of the SDG targets and the dotted lines are the linear projections. Data on underweight children, stunted children and wasted children is based on WHO standard reference population.
0
10
20
30
40
50
60
2005 2015 2020 2025 2030
Prop
ortio
n of
Und
erw
eigh
t, St
unte
d an
d W
aste
d ch
ildre
n un
der 5
yr
s
Underweight Stunting Wasting

71
6. Lessons from International Experience of Food and Nutritional Security for India
The present section compares the food and nutritional security programmes of three emerging nations, Brazil, China, and South Africa, with India’s (BICS). This synthesis will offer insights to improve our existing food and nutritional security programmes. By assessing the successes and failures of the nutritional programmes of the three emerging BICS economies (Brazil, China and South Africa), India can draw lessons to address nutritional insecurity in the country.
According to the latest World Bank data, India’s expenditure on health was 3.5 per cent of GDP, which was much lower than the global average expenditure of 9.8 per cent in 2017. Comparatively, China spent 5.15 per cent of GDP on health whereas Brazil and South Africa spent 9.4 per cent and 8.1 per cent of the GDP respectively in the same year. In education, India spent around 3.8 per cent of GDP in 2013 as compared to 5.83 per cent in Brazil and 6.01 per cent in South Africa (according to the latest World Bank data available for India). In China, 20.8 per cent of total government expenditure was on education in 2013 (National Bureau of Statistics China). The expenditure incurred by the Indian government under various nutrition, education, and poverty alleviation programmes is quite meagre as compared to that of the other BICS nations.
6.1 Under-nutrition across BICS Nations Globally, food security for BICS nations is a serious concern as they together account for 40.6 per cent23 of the total number of undernourished people worldwide. Figure 20 shows the prevalence of undernourishment in BICS countries. India has the highest prevalence of undernourishment followed by China, South Africa and Brazil. The emerging economies, particularly Brazil and China, have made exceptional progress in providing adequate food and nutritional security to their populations (Sharma and Gulati, 2012). The Government of India has also been concerned about addressing the issue of food and nutritional security for a long time. As pointed out in an earlier section, various food security and nutrition sensitive programmes such as NFSA, ICDS, SAG and MDM scheme have been introduced by the government. Despite this, the prevalence of malnutrition has been persistent in India. Many empirical studies have indicated that NFSA and ICDS do not have much impact on malnutrition among children (Lokshin et al, 2005; Kochar, 2005). This raises the question of what policies and programmes were implemented by the governments of other BICS countries and what India can learn from them to reduce the prevalence of malnutrition.
23 The number of undernourished people in Brazil was taken for the year 2014-16 as the number of undernourished people in Brazil has not been reported in 2016-18.

72
Figure 20: Under-nutrition across Countries
Source: The state of food insecurity in the world, FAO, IFAD, WFP (Various years) Note: * indicates that in Brazil, less than 5 per cent of population was undernourished in 2010-12 and less than 2.5 per cent of the population was undernourished in 2016-18. ^ indicates that from 1990-92 to 2010-12, less than 5 per cent of the population was undernourished in South Africa
To improve access to food and provide nutrition to its people, the governments of these developing nations introduced various food subsidy programmes such as school meals, and conditional and unconditional cash transfers over the years. Brazil has been able to reduce the level of food insecurity by improving access to food, generating income, supporting production of food by small farmers and improving food security governance (de Sousa et al., 2019). After the creation of the National Institute of Food and Nutrition in Brazil in the 1970s, the country was able to solve nutrition related problems by focusing more on structured nutritional programmes (Schmitz et al 2011). In 1999, National Food and Nutrition Policy (PNAN) was included in the Brazilian National Health Policy. The new 2011 guidelines, which were approved by the Ministry of Health guaranteed food and nutritional safety to the Brazilian population to improve their diet, nutrition and health status (Ministry of Health of Brazil, 2013).
The Family Grant Programme, started in 2003 to reduce poverty and social inequality, led to a reduction in the weight-for-age deficit and height-for-age deficit among beneficiary children between 2005 and 2009 (Schmitz et al 2011). The currently operating Bolsa Familia (conditional cash transfer programme) in Brazil has contributed directly to ensuring access to food, reducing the level of stunting and the mortality rate among children and encouraging people to consume a more diversified diet (UN, 2013). It is the largest income transfer programme benefiting 13.8 million families (around 41 million individuals and 22 per cent of the Brazilian population) with the fiscal expenditure by the Federal government reaching R$29 billion (US$ 7.38 billion24) in 2017. The expenditure as a percentage of GDP increased from less than 0.05 per cent in 2003 to over 0.5 per cent in 2011 (World Bank) and has remained the same since then (OECD-Brazil Economic Survey 2018). According to Brauw, Gilligan et al
24 1 USD= 3.927 Brazilian Real (as on 21 July 2020) (OECD)
18.6
14.8
23.9 23.7
<5
10.7
<2.5
8.5
14.5
6.2
0
5
10
15
20
25
30
World Brazil* China India South Africa^
Perc
ent
1990-92 2000-02 2010-12 2016-18

73
(2014), Bolsa Familia had a strong and significant impact on the decision making power of women at the aggregate level on children’s school attendance, heath expenses, household durable goods purchases, and contraception use. Khera (2016) also highlighted that Bolsa Familia gave financial autonomy to beneficiaries to spend money on products other than food such as clothes, school material, sofas and refrigerators.
The Government of China (GoC) has attached great importance to early childhood development and has formulated a series of plans in this regard. The first national action plan for children, “Planning Outline of Child Development in China in the 1990s”, was issued in 1992 to promote comprehensive and healthy development of children. Subsequently, “Outline of Child Development in China (2001–2010)” and “Outline of Child Development in China (2011–2020)” were issued, which set 10-year national goals and strategies for childhood development in the early stages in terms of health, education and child protection (Shao J, 2019). The Medium and Long-term Plan for National Food Security 2008-2020 identifying the goal of national food security was released in November 2008.
The Chinese government introduced the Nutrition Improvement Plan in 2011 to support and safeguard child development and ensure the attainment of enough nutrition among students in poor regions. Through an allocation of four yuan per student per day (124.8 billion Yuan or USD 18.06 billion)25 to improve their diet with nutrient rich food, about 37 million rural students benefitted from this programme until June 2018. The scheme reduced the prevalence of anaemia among students from 17 per cent in 2012 to 7.6 per cent in 2016.
The GoC developed the Healthy China 2030 policy in 2016 based on a ‘health-for-all’ approach, followed by the National Nutrition Plan (2017–2030) to improve the nutritional and health status of its population. These policies covered a wide range of malnutrition targets including stunting, anaemia, folic acid deficiency, obesity, and breastfeeding among vulnerable people. The National Programme for Food and Nutrition Development in China (2014-2020) has set targets to reduce stunting among children under 5 to less than 7 per cent and reducing anaemia prevalence to less than 10 per cent by 2020. Additionally, the National Child Development Plan for Poverty-Stricken Areas (2014–2020) was launched to increase child survival and promote healthy child development from birth to the completion of compulsory education to cover 40 million rural children in 680 counties.
Several nutritional intervention programmes have also been implemented in South Africa over the years to alleviate the problem of malnutrition. The Reconstruction and Development Programme (RDP) was adopted in South Africa in 1994 to make food security a priority policy objective. Therefore, public spending was reprioritised by the government to improve food security of historically disadvantage people (Republic of South Africa, 2002). This led to an increase in spending on various social programmes such as school feeding schemes, free health services (children between 0-6 years), health services for pregnant and lactating women,
25 1 USD = 6.908 Chinese Yuan (as on 21 July 2020) (OECD)

74
pension funds for the elderly, etc. In 2002, the Integrated Food Security Strategy (IFSS) was launched to provide physical, social and economic access to sufficient, safe and nutritious food to all people in the nation all the time to meet the dietary requirements for an active and healthy life.
The National School Nutrition Programme (NSNP) was introduced by the South African government in 1994 to provide nutritious meals to children in primary and secondary schools. A variety of proteins including soya, fish, eggs, meat, sour milk, fresh fruits and vegetables, carbohydrate/starch are included under the scheme. The outreach of the programme was 9.7 million learners daily for the year 2019-20.
Some lessons that India can draw from the experience of these developing countries to improve nutritional security are discussed in the section below.
6.2 Key Lessons for India from these Developing Countries
China First, by focusing on factors such as the role of the mother in improving the nutritional status of children, meal allowances, waiving off of tuition fees for rural schools and aligning their teaching standards with that of urban schools, the Chinese government has prioritised the health and education sectors. China’s extensive school feeding programmes have improved the educational and nutritional status of children. In India, schemes like the mid-day meal scheme (MDMS) and Integrated Child Development Scheme (ICDS) to improve the nutritional and health status of the children are cereal dominant and do not offer a nutritious diet. In 2008, the Chinese National Health and Family Planning Commission (NHFPC) promoted ‘Ying Yang Bao’ (a soybean-based supplement fortified with vitamins and minerals) to reduce micronutrient deficiencies that rural Chinese infants and young children suffered from.
Second, China has understood the importance of linking agriculture with nutrition and is paying serious attention to promoting more nutritious and diversified crops. A combination of agricultural research and public policies has been able to bring in greater supply of non-staple foods including fruits and vegetables, fisheries and livestock in the diet with a positive impact on nutrition. This has enabled China to improve the nutritional and health status of Chinese children. India should also learn from this and adopt innovative technologies of bio-fortifying cereals.
Brazil and South Africa The Brazilian constitution recognises food as a human right, which is guaranteed by the National Food and Nutrition Security System (SISAN) and the National Food and Nutrition Security Policy (PNSAN). Similarly, South Africa has a progressive constitution that explicitly guarantees the right to food, while the Indian Constitution does not include the right to food as a constitutional right.

75
At the same time, women’s education and increase in the coverage of health and sanitation facilities led to a notable reduction in the level of under-nutrition in Brazil between 1988 and 2010 (UN 2013). Brazil was able to meet the Millennium Development Goal (MDG) 1 of halving the proportion of population whose income is less than one dollar a day and the proportion of population that suffered from hunger. The country also met MDG 4 of reducing the under-five mortality rate by two-thirds between 1990 and 2015 (from 63 per 1000 live births to 15.7 per 1000 live births).
Besides, there has been a shift in the dietary pattern of people in Brazil from traditional minimally processed food such as rice, beans and cassava to freshly prepared meals and ultra-processed foods which are rich in energy, salt, sugar and fat (UN 2013). However in India, the PDS (the largest food based welfare programme) still focuses on providing wheat and rice to the people, i.e., its focus on the calorie intake of the people and neglects nutritional intake. Brazil has transformed its food system and declined the level of hunger in the country through targeted investment in agriculture R&D and social protection programmes (FAO 2018, Gulati & Khurana 2020).
The synthesis underlines the fact that the incidence of malnutrition can be reduced in India if the government focuses on increased access to schools, clean water, sanitation and basic health care along with including a nutrient rich diet in food welfare programmes. Enhancing the role of the private sector in resource mobilisation and food and nutrition initiatives can also bring the country close to achieving nutritional security by 2030.

76
7. Policy Recommendations
Globally, India’s commitment to achieving nutritional security, ending extreme poverty and reducing child mortality is significant since India accounts for the largest number of under five deaths, stunted and wasted children, the extremely poor and the undernourished. Despite the considerable decline in extreme poverty in India from 45.9 per cent to 13.4 per cent between 1993 and 2015 (measured at $1.9 per capita per day at the 2011 purchasing power parity rate (PPP)), it still lags behind in its efforts to alleviate nutritional insecurity. Thus, the central question that this study aims to address is how India can achieve nutritional security by 2030.
In this regard, the present report has analysed the inter-linkages between nutrition and agricultural policies and programmes, economic growth and poverty to tackle the challenges of under-nutrition. The report has critically assessed India’s existing nutritional policies and programmes to address the key determinants of under-nutrition. The experience of other developing countries has been reviewed to draw lessons for India and develop a policy framework to eliminate all forms of malnutrition and thus, achieve nutritional security.
The report has also used linear projections to examine if India is on track to achieve the SDGs of eradicating extreme poverty, achieving zero hunger and reducing child mortality by 2030 based on a business-as-usual model.
Based on our report’s findings and the key lessons from emerging economies, we suggest the following measures to achieve nutritional security by 2030.
1. Synergy between Agricultural Programmes and Nutrition Sensitive InterventionsTargeted agricultural programmes with a stronger design that support livelihoods, improvehousehold food availability and diet quality and foster women’s empowerment need to bepromoted. The trade-off between promoting agricultural production and nutrition needs tobe confronted. Leveraging agricultural policies and programmes to be more “nutritionsensitive” and reinforcing diet diversification will help focus on both nutrition anddevelopment. On the demand side, the central government should implement schemes thatencourage a diversified food basket by mapping food consumption patterns and nutritionlevels.
On the supply side, the focus should be on increasing diversification of production towardscoarse cereals, pulses, and fruits and vegetables. To tackle the problem of malnutrition andmicro-nutrient deficiencies, the central government has proposed the promotion of milletsunder the public distribution system. Niti Aayog has been formed a committee torecommend strategies to increase the availability of millets to ensure nutritional security.However, this scheme needs to be put on a fast track mode.
Bio-fortification not only improves the diet of households effectively but also improves thenutritional status of children. India’s premier agricultural institute, Indian Council ofAgricultural Research (ICAR) along with the Consultative Group of International

77
Agricultural Research (CGIAR) can implement cost-effective and sustainable programmes to grow new nutrient rich staple food crops through bio-fortification under their Harvest Plus programme.
2. Food Grain Security to Nutritional SecurityThe food based safety nets in India are biased in favour of staples (rice and wheat) againstarguably more nutritious foods such as coarse grains, pulses, and fruits and vegetables.Calories adequacy cannot address a household’s nutritional security without includingprotein rich food in the food consumption basket. The high prevalence of micronutrientdeficiency and anaemia among Indian women and children cannot be solved by just giving5 kg of grains per person per month. Food-based safety nets such as PDS should provide amore diversified food basket, including bio-fortified staples.
TDPS over the years has also been criticised for targeting errors and deliberate diversion.This requires strengthening of PDS functioning by reducing leakages. In the long term,these food-based safety nets should shift towards cash payment to beneficiaries throughdirect benefit transfers (DBT) in a phased manner depending on the population density,geographical location, banking infrastructure and financial inclusiveness of the particularstate. This will encourage beneficiaries to use the cash grant according to their consumptionneeds and give them greater autonomy to decide on their diet plans.
Besides, diverting a part of the subsidy on wheat and rice towards nutritious food can helpreduce food insecurity.
3. Investment in Women’s Education, Particularly Higher EducationWomen’s educational status has been increasing in India as a result of various centralgovernment programmes, although the share of women in higher education was only 13.7per cent in 2015-16. Our findings suggest that women’s education has a multiplier effecton household food security, awareness regarding nutrient rich diets, more equitable intra-household distribution of food, child health care, sanitation facility and personal hygiene.Nutritional education programmes should be incorporated into the school curriculum.Liberal scholarships for women’s education, particularly for higher education in missionmode, should be given high priority.
As mentioned earlier, the distance between school and home is a factor leading toincreasing dropouts rates among girls, which can addressed through initiatives likedistribution of bicycles to girls in secondary and higher schools.
Lack of basic facilities in school infrastructure, particularly toilets, is one of the manybarriers to girls’ school enrolment and participation. In 2018, around 66 per cent of schoolsin rural areas of India had separate toilet facilities for girls (Table 7). State governmentsneed to promote programmes to increase schooling via provision of sanitation and drinkingwater facilities in schools, especially in rural areas.

78
Table 7: Percentage of Schools with Selected Basic Facilities (Rural India) Basic Facilities (%) 2010 2014 2018
Drinking Water No facility for drinking water 17.0 13.9 13.9 Drinking water available 72.7 75.6 74.8
Toilet No toilet facility 11.0 6.3 3.0 Facility but toilet not useable 41.8 28.5 22.8 Toilet useable 47.2 65.2 74.2
Girls’ Toilet
No separate provision for girls’ toilet 31.2 18.8 11.5
Separate provision but locked 18.7 12.9 10.5 Separate provision, unlocked but not useable 17.2 12.6 11.7
Separate provision, unlocked and useable
32.9 55.7 66.4
Source: Annual Status of Education Report (ASER) 2018
4. Maternal Health and Child Care PracticesOur findings show how low maternal BMI, inequalities in access to antenatal care, earlychild bearing, higher birth order and low institutional deliveries can lead to the poornutritional status of children and increase infant mortality. A high proportion ofunderweight women (with low BMI index) in the reproductive age is one of the significantfactors leading to malnutrition in children. Investments in maternal health, provision ofquality ANC and women’s nutrition are likely to have a significant effect in improvingnutritional outcomes among children. Focused and evidence-based initiatives such as IndiaNewBorn Action, which was launched in 2014, are needed to achieve nutritional security.The initiative aims to reduce low birth weight in infants through ANC, health services foradolescents, nutritional counselling and micronutrient supplementation (CHD and GoI,2019).
The India State-level Disease Burden Initiative Malnutrition Collaborators report (2019) found that India will not be able to meet the WHO and UNICEF 2030 target of 70 per cent exclusive breastfeeding. Our finding also highlights that breastfeeding for the first six months is crucial for optimal growth and survival of infants; however, only 55 per cent of children in India were exclusive breastfed in 2015-16. The government needs to strengthen its regulation on breast milk substitutes through infant and young child feeding guidelines, ICDS and National Breastfeeding Promotion Programmes (UNICEF, 2019). Only 9.6 per cent children in India were fed a minimum acceptable diet according to NFHS (2015-16). Promotion of exclusive breastfeeding and the introduction of complementary food and a diversified diet after the first six months is essential to meet the nutritional needs of infants and ensure appropriate growth and development of children. State governments need to prioritise their focus on improving health care facilities and increase investment to enable

79
institutional deliveries at primary health centres, district hospitals and government run hospitals to make it inclusive for the poor.
The regression analysis did not capture the effect of immunisation on malnutrition and mortality rates except its effects on reducing the prevalence of wasting in 2005-06; however, earlier studies have shown the significant impact of immunisation coverage on child malnutrition. Given that one-third of children in India still do not have access to basic vaccination, tough monitoring is required to ensure routine vaccination coverage.
5. Integrated Nutrition Policy against Multi-Dimensional Indicators of MalnutritionConsiderable improvement across all child malnutrition indicators is evident from ourstudy, although more than one-third of children were malnourished in 2015-16. Lack ofiron and other micro-nutrients, and low intake of a diversified diet escalate the risk of under-nutrition and micronutrient deficiencies in India. The high burden of anaemia amongwomen and children increases the risk of mortality and child under-nutrition. This requiresnutritional interventions such as the Comprehensive Programme on Anaemia Preventionand Control, National Iron Plus Initiatives (2013) and Anaemia Mukt Bharat, underPOSHAN Abhiyan for children at a young age. These interventions include provision ofsupervised iron folic acid (IFA) supplements for children, deworming of children as wellas adolescents and treatment for in-school adolescents and pregnant women. Anganwadiworkers and community participation can bring about significant improvement withcomprehensive awareness programmes.
Our spatial analysis found a pronounced geographical clustering of underweight and stunted children in certain districts. These were mainly in the central, eastern and western regions of India. The spatial clustering of child malnutrition is observed in regions with poor wealth index, high poverty, low women’s education and high prevalence of open defecation. There needs to be a targeted approach towards these high risk districts to track gaps in nutritional intervention programmes.
6. WASH for Nutritional SecurityThe major ongoing central government programme, Swachh Bharat Abhiyan, aims to pushthe safe drinking water, universal sanitation coverage and hygiene (WASH) agenda of theSustainable Development Goals. The remarkable achievement of Swachh Bharat Abhiyanis expected to contribute to a reduction in child mortality and malnutrition rates. Thesynergy between WASH initiatives and nutritional intervention will have a multiplier effecton nutritional outcomes.
The success of water and sanitation infrastructure programmes depends on a core aspect of the WASH initiative, which is spreading awareness of basic sanitation and hygiene to community and school children, with special focus on behavioural change, capacity building; it needs to be implemented at both the national and grass roots level.

80
Reference
• Alderman, H. Chiappori, P. A. Haddad, L., Hoddinott, J. Kanbur, R. (1995). Unitary versus collective models of the household: is it time to shift the burden of proof? Washington, D.C.: World Bank Group. Retrieved from http://documents.worldbank.org/curated/en/233181468739240149/Unitary-versus-collective-models-of-the-household-is-it-time-to-shift-the-burden-of-proof (accessed on February 18, 2020).
• Alderman, H., & Headey, D. D. (2017). How Important is Parental Education for Child Nutrition?. World development, 94, 448–464. Retrieved from https://doi.org/10.1016/j.worlddev.2017.02.007 (accessed on February 28, 2020)
• Annual Status of Education Report (Rural) (2019). Annual report 2018. Retrieved from https://img.asercentre.org/docs/ASER%202018/Release%20Material/aserreport2018.pdf (accessed on April 14th 2020). - (2017). ASER 2017: Beyond Basics. Retrieved from
http://img.asercentre.org/docs/Publications/ASER%20Reports/ASER%202017/aser2017pressreleasenationalenglishfinalrevisedjan23.pdf (accessed on July, 29, 2020)
• Arimond, M and Ruel M.T. (2004). Dietary Diversity Is Associated with Child Nutritional Status: Evidence from 11 Demographic and Health Surveys. Journal of Nutrition, Vol. 134, pp 2579-85
• Banerjee, S. (2018). Major Determinants of Infant Mortality: District-level Evidences from Odisha, Journal of Health Management. Vol. 20(3) pp1–18. Retrieved from DOI: 10.1177/0972063418779912 (accessed Feb 28, 2020).
• Basumatary R (2012). School Dropout across Indian States and UTs: An Econometric Study. International Research Journal of Social Sciences. Vol. 1(4), 28-35.
• Bezanson K, Isenman P. (2010). Scaling up nutrition: a framework for action. Food Nutrition Bulletin. 2010;31(1):178-186. Retrieved from doi:10.1177/156482651003100118 (accessed on June, 12, 2020)
• Bhagowalia, P; Kadiyala, S. Headey D. (2012) Agriculture, Income, and Nutrition Linkages in India Insights from a Nationally Representative Survey. IFPRI Discussion Paper 01195
• Bhavani, R.V. and Rampal, P. (2018). Review of agriculture – nutrition linkages in South Asia. Retrieved from http://www.cabi.org/cabreviews (accessed on April 25, 2020)
• Bhutta Z.A, Das J.K and Rizvi A. (2013). Evidence-based interventions for improvement of maternal and child nutrition: what can be done and at what cost? The Lancet Vol. 382: e452–77
• Binns, C. W., & Lee, M. K. (2014). Exclusive breastfeeding for six months: The WHO six months recommendation in the Asia Pacific region. Asia Pacific Journal of Clinical Nutrition, 23(3), pp. 344–350. Retrieved from https://doi.org/doi.org/10.6133/apjcn.2014.23.3.21(accessed March 13, 2020).
81
• Black, R. E., L. H. Allen, Z. A. Bhutta, L. E. Caulfeld, M. de Onis, M. Ezzati, C. Mathers, and J. Rivera. (2008). Maternal and Child Under-nutrition: Global and Regional Exposures and Health Consequences. Lancet 371 (9608): 243–60. http://linkinghub.elsevier.com/retrieve/pii/S0140673607616900(accessed March 22, 2020).
• Black R.E., Victora C.G., Walker S.P., Bhutta Z.A., Christian P., De Onis M., Ezzati M., Grantham-McGregor S., Katz J., Martorell R. (2013). Maternal and child under-nutrition and overweight in low-income and middle-income countries. Lancet. Vol. 382(9890):pp 427 –51
• Bora, J.K. and Saikia, N. (2018). Neonatal and under-five mortality rate in Indian districts with reference to Sustainable Development Goal 3: An analysis of the National Family Health Survey of India (NFHS), 2015–2016. PLoS ONE 13(7): e0201125. Retrieved from https://doi.org/10.1371/journal.pone.0201125 (accessed on April 14, 2020)
• Bouis, H. E., Eozenou, P., & Rahman, A. (2011). Food Prices, Household Income, and Resource Allocation: Socioeconomic Perspectives on Their Effects on Dietary Quality and Nutritional Status. Sage Journal. Food and Nutrition Bulletin, 32(1_suppl1), S14–S23. https://doi.org/10.1177/15648265110321S103.
• Brauw, A., Gilligan, D., Hoddinott, J and Roy, S (2014). The impact of Bolsa Familia on Women’s Decision making power. International Food Policy Research Institute, Washington, USA. Vol. 59, pp 487-504.
• CACP (2012), “Report of the Commission on Agricultural Costs and Prices, Kharif, 2012”, Government of India.
• Child Health Division, Ministry of Health and Family Welfare, Government of India. 2014. India newborn action plan. New Delhi: WHO and Collaborating Center for Training and Research in Newborn Care Retrieved from https://www.newbornwhocc.org/INAP_Final.pdf (accessed April 4, 2020).
• Coffey, D. (2015). Pre-pregnancy body mass and weight gain during pregnancy in India and sub-Saharan Africa. Proceedings of the National Academy of Sciences of the United States of America, Vol. 112, pp 3302–3307
• Cox, D. R. (1972). Regression models and life-tables (with discussion). Journal of the Royal Statistical Society, Series B 34: 187–220.
• Cox, D. R., and D. Oakes. (1984). Analysis of Survival Data. London: Chapman & Hall/CRC.
• CRY (2019). Educating the Girl Child- National and State Factsheet- 2018-19. Retrieved from https://www.cry.org/wp-content/uploads/2019/11/GCE-Factsheet-CRY.pdf (accessed on July 29, 2020).
• Cumming, O., & Cairncross, S. (2016). Can water, sanitation and hygiene help eliminate stunting? Current evidence and policy implications. Maternal & child nutrition. 12(Suppl 1), 91–105. https://doi.org/10.1111/mcn.12258.
• Datt, G., and M., Ravallion, (1997). Why have some Indian states performed better than others at reducing rural poverty? Food Consumption and Nutrition Division, Discussion Paper, 26, International Food Policy Research Institute, Washington, D.C.

82
• Deaton, A., and Dreze J. (2009). Food and Nutrition in India: Facts and Interpretation. Economic & Political Weekly, Vol. XLVI No. 7, pp 42-65
• Delisle. H.E. (2008). Poverty – The Double Burden of malnutrition in mothers and the Intergenerational Impact. Ann. N.Y. Acad. Sci. 1136: 172–184. New York Academy of Sciences. Retrieved from doi: 10.1196/annals.1425.026 (accessed April 5, 2020).
• Desai, S. and Vanneman, R. (2015). Enhancing Nutrition Security via India's National Food Security Act: Using an Axe instead of a Scalpel? India Policy Forum. Vol. (5)11: pp 67–113
• Dodos, Jovana & Mattern, Blanche & Lapegue, Jean & Altmann, Mathias & Aït-Aïssa, Myriam. (2017). Relationship between water, sanitation, hygiene, and nutrition: What do Link NCA nutrition causal analyses say? Waterlines. 36(4). 284-304. Retrieved from DOI. 10.3362/1756-3488.17-00005. (accessed on April 23, 2020)
• Drèze, J and Khera, R (2015), Understanding leakages in the Public Distribution System. Economic and Political Weekly.Vol.50, No 7, February 2015. Retrieved from https://www.epw.in/journal/2015/7/insight/understanding-leakages-public-distribution-system.html
• Economic Survey (2017-18). Universal Basic Income: A conversation with and within the Mahatma. India Budget. GoI.
• FAO. (2012). World agriculture towards 2030/2050: The 2012 revision. Rome, Italy: FAO. Retrieved from http://www.fao.org/economic/esa/esag/en (accessed on May 20 2020)
• Fears R, Cananles, C., ter Meulen V., von Braun J. (2019). Transforming food systems to deliver healthy, sustainable diets – the view from the world’s science academies. Lancet Planet Health; Vol. 3(4): e163-165. Retrieved from https://doi.org/10.1016/S2542-5196(19)30038-5 (accessed on 20 April 2020).
• Fears R, ter Meulen V, von Braun J. Scientific opportunities for food and nutrition security. (2018). Lancet Planet Health 2018; Vol. 2: pp. 2–3.
• Food and Agriculture Organization of the United Nations (2015). Strengthening the links between resilience and nutrition in food and agriculture. FAO, Rome. Retrieved from http://www.fao.org/3/a-i3777e.pdf (accessed on July 7, 2020).
• Food and Agriculture Organization of the United Nations, International Fund for Agricultural Development, and World Food Programme (FAO, IFAD, and WFP). (2014). The state of food security and nutrition in the world 2014. Retrieved from https://reliefweb.int/sites/reliefweb.int/files/resources/a-i4030e.pdf (accessed on February 7, 2020). - (2015). The State of Food Insecurity in the World 2015. Strengthening the Enabling
Environment for Food Security and Nutrition. FAO, Rome • Food and Agriculture Organization, International Fund for Agricultural Development,
The United Nations International Children’s Emergency Fund, World Food Programme, and WHO. The state of food security and nutrition in the world 2018. 2018. http://www.fao.org/3/I9553EN/ i9553en.pdf (accessed February 20, 2020).
• Food and Agriculture Organization of the United Nations, International Fund for Agricultural Development, United Nations Children's Fund, World Food Programme and

83
World Health Organisation (FAO, IFAD,UNICEF, WFP and WHO). (2019). The State of Food Insecurity in the World 2019. Strengthening the Enabling Environment for Food Security and Nutrition. FAO: Rome
• Food and Agriculture Organization (2018). Nations urged to accelerate efforts to wipe out hunger and malnutrition. FAO, Rome. Retrieved from http://www.fao.org/news/story/pt/item/1171993/icode/ (accessed on July 7, 2020).
• Gillespie, S. and Haddad, L. (2001). Attacking the double burden of malnutrition in Asia and the Pacific. Washington D.C: Asian Development Bank Press and International Food Policy Research Institute.
• Gillespie, S. and Haddad, L. (2003). The Double Burden of Malnutrition in Asia. Causes, Consequences and Solutions. Washington D.C: International Food Policy Research Institute and Sage Publications.
• Government of India (GoI) (2016). National Scheme of Incentives to Girls for Secondary Education. Ministry of Human Resource and Development, GoI. Retrieved from https://mhrd.gov.in/incentives (accessed on April 17, 2020). - (2016a). National Scheme of Incentives to Girls for Secondary Education. Ministry
of Human Resource and Development, GoI. Retrieved from https://mhrd.gov.in/incentives (accessed on April 17, 2020).
- (2017a). National Nutrition Mission. Poshan Abhiyaan. New Delhi: Ministry of Women and Child Development, GoI. Retrieved from https://icds-wcd.nic.in/nnm/NNM-Web-Contents/UPPER-MENU/AboutNNM/PIB_release_NationalNutritionMission.pdf (accessed Feb 1, 2020).
- (2018a). Beti Bachao Beti Padhao: Achievements and Progress. Press Information Bureau, GoI. Retrieved from Press Information Bureau (PIB) https://pib.gov.in/newsite/PrintRelease.aspx?relid=177109 (accessed on April 25th 2020).
- (2018b). Lok Sabha Unstarred Question No 271 regarding “School Dropout”. New Delhi: Ministry of Human Resource Development, GoI.
- (2019a). Lok Sabha Unstarred Question No 4522 regarding “Restructuring of ICDS”. New Delhi: Ministry of Women and Child Development, GoI.
- (2019b). Salient features of AB-PMJAY. Ministry of Health and Family Welfare, GoI. Retrieved from https://pib.gov.in/PressReleaseIframePage.aspx?PRID=1592159 (accessed on April 17, 2020).
- (2019c) Food and Nutrition Security Analysis, India, 2019. MOSPI and WFP. New Delhi: GoI.
- (2020a).Government is running ‘Samagra Shiksha’ Scheme to ensure equitable and inclusive education -HRD Minister. Press Information Bureau, GoI. Retrieved from Press Information Bureau (PIB) https://pib.gov.in/PressReleseDetailm.aspx?PRID=1606557 (accessed on April 3rd 2020).
84
- (2020b). Lok Sabha Unstarred Question No 2322 regarding “Households without Piped Water Connections”. New Delhi: Ministry of Jal Shakti, GoI.
• George, N. A., & McKay, F. H. (2019). The Public Distribution System and Food Security in India. International journal of environmental research and public health, 16(17), 3221. https://doi.org/10.3390/ijerph16173221.
• Gulati, A., Kumar, A. G., Sreedhar G., and Nandkumar. T. (2012). Agriculture and Malnutrition in India. Food and Nutrition Bulletin, Vol. 33 (1), pp 74-86.
• Gulati, A. and Saini, S. (2015). Leakages from Public Distribution System (PDS) and the Way Forward. ICRIER Working Paper No 294. New Delhi: ICRIER
• Gulati, A., Khurana, K (2020, March 2). How India can overcome malnutrition. Financial Express. Retrieved from https://www.financialexpress.com/opinion/from-plate-to-plough-how-india-can-overcome-malnutrition/1885637 / (accessed on June 28, 2020).
• Haddad L. (2000). A conceptual framework for assessing agriculture-nutrition linkages. Food Nutrition Bulletin. Vol (21):367–73
• Haddad L, Alderman H, Simon A, Song L, Yohannes Y. (2003). Reducing Child Malnutrition: How far does Income Growth Take Us? The World Bank Economic Review. Vol. 17(1):107–131
• Hala, A (2003). The effect of water and sanitation on child mortality in Egypt. Working Papers in Economics, No. 112. Göteborg University, Department of Economics.
• Headey, D. (2011). Turning Economic Growth into Nutrition-Sensitive Growth. Paper presented at "2020 Conference: Leveraging Agriculture for Improving Nutrition and Health," February 10-12, 2011, New Delhi, India.
• Headey, D., A. Chiu, and S. Kadiyala. (2012). Agriculture’s Role in the Indian Enigma: Help or Hindrance to the Malnutrition Crisis? Food Security. Vol. 4(1): pp 87–102.
• Headey, D., Palloni, G. (2019). Water, Sanitation, and Child Health: Evidence from Sub-national Panel Data in 59 Countries. Demography. Vol (56): pp 729-752. Retrieved from https://doi.org/10.1007/s13524-019-00760-y (accessed April 14, 2020).
• Herforth, H., Jones, A., and Pinstrup-Andersen, P. (2012). Prioritizing Nutrition in Agriculture and Rural Development: Guiding Principles for Operational Investments.HNP Discussion Paper Series. Washington DC: The World Bank.
• Hoddinott J, Rosegrant M, Torero M. (2013) Investments to reduce hunger and under-nutrition. In: Lomborg B, ed. Copenhagen Consensus, 2012. Cambridge: Cambridge University Press.
• Hotz C, Loechl C, De Brauw A. (2012). A large-scale intervention to introduce orange sweet potato in rural Mozambique increases vitamin A intakes among children and women. British Journal of Nutrition. Vol. 108: pp 163–76
• India State-Level Disease Burden Initiative Malnutrition Collaborators. (2019). The burden of child and maternal malnutrition and trends in its indicators in the states of India: the Global Burden of Disease Study 1990–2017. Lancet Child Adolescent Health. Retrieved from https://doi.org/10.1016/S2352-4642(19)30273-1.2 (accessed March 19, 2020).

85
• Johnston, D.; Stevano, S; Malapit, Hazel J.; Hull, E; Kadiyala, S. (2015). Agriculture, gendered time use, and nutritional outcomes: A systematic review. IFPRI Discussion Paper 1456. Washington, D.C.: International Food Policy Research Institute (IFPRI). http://ebrary.ifpri.org/cdm/ref/collection/p15738coll2/id/129389 (accessed on June, 15, 2020).
• Jose, S. (2016). Economic growth, poverty and malnutrition in India. Ekonomik Yaklasim 27(99): pp165–202
• Khan, J. and Mohanty S.K. (2018). Spatial heterogeneity and correlates of child malnutrition in districts of India. BMC Public Health, Vol. (18:1027). Retrieved from https://doi.org/10.1186/s12889-018-5873-z(accessed Feb 8, 2020).
• Kharas H., McArthur J.W. and Rasmussen K. (2018). How many people will the world leave behind? Assessing current trajectories on the Sustainable Development Goals. Brookings Global Economy and Development. Working Paper No. 123. Retrieved from www.brookings.edu/research/how-many-people-will-the-world-leave-behind(accessed March 8, 2020).
• Khera, R (2016). Lessons from Brazil. Frontline. Retrieved from https://reetikakhera.blogspot.com/2016/03/44-lessons-from-brazil-frontline-17-30.html (accessed on July 2, 2020).
• Kochar, A. (2005). Can Targeted Food Programs Improve Nutrition? An Empirical Analysis of India’s Public Distribution System. Economic Development and Cultural Change. Vol. 54(1): pp 203-235.
• Kumar, A., Bantilan, M.C.S., Kumar, P., Kumar, S & Jee, S (2012). Food Security in India: Trends, Patterns and Determinants. Indian Journal of Agriculture Economics. Vol 67, no 3, pp 56-79.
• Kumar, P., Joshi P.K and Mittal, S (2016). Demand vs Supply of Food in India-Futuristic Projection. Indian National Science Academy. Vol 82, No 5, pp 1579-1586.
• Kumar, P., Mruthyunjaya and Dey, M. M. (2007). Long-term Changes in Indian Food Basket and Nutrition. Economic & Political Weekly. Vol. 42(35), pp 3567-72.
• Lokshin, M., Das Gupta, M., Gragnolati M., Ivaschenko O (2005). Improving Child Nutrition? The Integrated Child Development Services in India. Development & Change. Vol. 36(4): pp 613–640. Retrieved from https://doi.org/10.1111/j.0012-155X.2005.00427.x (accessed on June 8, 2020).
• Martins, V. J., Toledo Florêncio, T. M., Grillo, L. P., do Carmo P Franco, M., Martins, P. A., Clemente, A. P., Santos, C. D., de Fatima A Vieira, M., & Sawaya, A. L. (2011). Long-lasting effects of undernutrition. International journal of environmental research and public health, Vol. 8(6), pp 1817–1846. https://doi.org/10.3390/ijerph8061817 (accessed February 15, 2020).
• Menon, P., Heady D., Avula, R. Nguyen, P.H. (2018). Understanding the geographical burden of stunting in India: A regression-decomposition analysis of district-level data from 2015–16. Maternal Child Nutrition. Vol. 14:e12620.Retrieved from https://doi.org/10.1111/mcn.12620 (accessed February 16, 2020).
• Ministry of Health of Brazil (2013). National Food and Nutrition Policy (PNAN). Brasilia: Ministry of Health of Brazil
• Mittal, S. (2007). What affect changes in cereal consumption? Economic and Political weekly Vol. 42, No 05. Retrieved from

86
https://www.epw.in/journal/2007/05/notes/what-affects-changes-cereal-consumption.html. (Accessed on June 5, 2020).
• National Sample Survey Organisation. Nutritional Intake in India 2009-10. NSSO. Government of India; New Delhi: 2012. Report No. 540
• OECD (2018). Economic Survey of Brazil, OECD Publishing, Paris. Retrieved from http://www.oecd.org/economy/surveys/Brazil-2018-OECD-economic-survey-overview.pdf (accessed on July 5, 2020).
• Pinstrup-Andersen P. (2006). Agricultural Research and Policy to Achieve Nutrition Goals. In: de Janvry A., Kanbur R. (eds.) Poverty, Inequality and Development. Economic Studies in Inequality, Social Exclusion and Well-Being, Vol. 1. Boston, MA: Springer
• Pinstrup-Andersen P. (2011). The food system and its interaction with human health nutrition. Leveraging agriculture for improved nutrition in health. 2020 Conference: Leveraging Agriculture for Improving Nutrition and Health. Brief 13. International Food Policy Research Institute, Washington, DC.
• Pinstrup-Andersen, P. (2013). Can Agriculture Meet Future Nutrition Challenges? European Journal of Development Research Vol. 25(1): pp 5-12. Retrieved from doi:10.1057/ejdr.2012.44 (accessed Feb 22, 2020).
• Pradhan, J., and Aroikasamy, P. (2006). High Infant and Child Mortality Rates in Orissa: An Assessment of Major Reasons. Population Space Place Vol. 12 (3), pp 187–200.
• Radhakrishna, R and C Ravi. (2004). Malnutrition in India: Trends and Determinants. Economic and Political Weekly, Vol. XXXIV, No 7, pp 14-20
• Radhakrishna, R., Rao, C.H., Ravi. C. And Reddy B. S. (2004). Chronic poverty and malnutrition in 1990s. Economic and Political Weekly, Retrieved from DOI: 10.2307/4415257 (accessed on March 23, 2020)
• Ravallion, M. (2013). How long will it take to lift one billion people out of poverty? World Bank Policy Research. Working Paper WPS 6325.Washington DC: The World Bank
• Republic of South Africa (2002). The Integrated Food Security Strategy for South Africa. Retrieved from http://extwprlegs1.fao.org/docs/pdf/saf149624.pdf (Accessed on May, 25 2020).
• Ruel, M. T., and H. Alderman. (2013). Nutrition-sensitive Interventions and Programmes: How Can They Help to Accelerate Progress in Improving Maternal and Child Nutrition? Lancet Vol. 382(9891): 536–51. http://www.thelancet.com/pdfs/journals/lancet/PIIS0140-6736(13)60843-0.pdf(accessed Feb 15, 2020).
• Ruel, T.M., Levin, C., Armar-Klemesu, M., Maxwell, D. and S. Morris. (1999). Good care practices can mitigate the negative effect of poverty and low maternal schooling on children’s nutritional status: Evidence from Acrra. World Development. Vol. 27(11), pp 1993-2009.
• Schmitz, B., Moreira, E., Freitas, M., Fiates, G., Gabriel, C and Fagundes R (2011). Public intervention in food and nutrition in Brazil. Archivos latinoamericanos de nutrición, 61(4): pp 361-6.

87
• Scott, S. P., Chen-Edinboro, L. P., Caulfield, L. E., & Murray-Kolb, L. E. (2014). The impact of anemia on child mortality: an updated review. Nutrients, 6(12), 5915–5932. https://doi.org/10.3390/nu6125915 (accessed on May 30, 2020)
• Shao, J. (2019). Early child development: a challenge in China. World Journal of Pediatrics 15, 1–3 (2019). Retrieved from https://doi.org/10.1007/s12519-018-0216-9
• Sharma, P and Gulati, A (2012). Approaches to Food Security in Brazil, China, India, Malaysia, Mexico and Nigeria: Lessons for Developing Countries. ICRIER Policy Series No 14. March 2012.
• Smith, L.C., and Haddad, L. (2000). Explaining child malnutrition in developing countries: a cross-country analysis. IFPRI: Washington D.C.
• de Sousa, L. R. M.., Segall-Corrêa, A. M., Ville, A. S. & Melgar-Quiñonez, H. (2019). Food security status in times of financial and political crisis in Brazil. Cadernos de Saúde Pública. 35(7), e00084118. Epub July 29, 2019.https://doi.org/10.1590/0102-311x00084118.
• Spears, D., Ghosh, A., and Cumming O. (2013). Correction: Open Defecation and Childhood Stunting in India: An Ecological Analysis of New Data from 112 Districts. Retrieved from https://doi.org/10.1371/annotation/9ffcb740-f394-41af-bbbc-800c7cc25ea8 (accessed on April 19, 2020)
• Taneja, A. (2018, January 31). The high dropout rate of girls in India. Livemint. Retrieved from https://www.livemint.com/Opinion/iXWvKng7uU4L8vo5XbDn9I/The-high-dropout-rate-of-girls-in-India.html (accessed on July 20, 2020).
• Tette, E. M., Sifah, E. K., & Nartey, E. T. (2015). Factors affecting malnutrition in children and the uptake of interventions to prevent the condition. BMC paediatrics, Vol. 15(189), pp 1-11. Retrieved from https://doi.org/10.1186/s12887-015-0496-3 (accessed Feb 10, 2020).
• Thow, A. M, Kadiyala, S., Kandelwal, S. Menon, P. Downs S. and Reddy K.S. (2016). Toward Food Policy for the Dual Burden of Malnutrition: An Exploratory Policy Space Analysis in India. Food and Nutrition Bulletin. Vol. 37(3): 261-274
• Tontisirin, K. and Gillespie, S. (2001). Linking Community-based Programs and Service Delivery for Improving Maternal and Child Nutrition, Asian Development Review, Vol. 17(1,2) pp. 33-65.
• UN System Standing Committee (2013). Country Policy Analysis: Nutrition Impact of Agriculture and Food System Brazil.
• UNICEF. (1998). State of the World’s Children. New York: UNICEF • UNICEF (2012). On World Toilet Day, ending open defecation is possible. United
Nations Children’s Fund. New York. • UNICEF (2015). UNICEF’S approach to scaling up nutrition. For mothers and their
children. United Nations Children’s Fund. Retrieved from https://www.unicef.org/nutrition/files/Unicef_Nutrition_Strategy.pdf (accessed March 29, 2020)

88
• UNICEF. (2019). MAA-National Breastfeeding Programme. United Nations Children’s Fund – India, May 28. Retrieved from http://unicef.in/AddNewPage/PreView/19 (accessed March 28, 2020)
• UNICEF (2019). The State of the World’s Children 2019. Children, Food and Nutrition: Growing well in a changing world. UNICEF, New York.
• Vollmer, S., K. Harttgen, M. A. Subramanyam, J. Finlay, S. Klasen, and S. V. Subramanian. (2014). Association between Economic Growth and Early Childhood Under-nutrition: Evidence from 121 Demographic and Health Surveys from 36 Low-income and Middle income Countries. Lancet Global Health. Vol. 2(4): e225–e234. Retrieved from http://www.thelancet.com/article/S2214109X14700257/fulltext (accessed March 1, 2020).
• Vollmer, S., K. Harttgen, M. A. Subramanyam, J. Finlay, S. Klasen, and S. V. Subramanian (2016). Economic growth and child malnutrition. Retrieved from https://doi.org/10.1016/S2214-109X(16)30249-2 (accessed on May 29, 2020).
• von Braun, J. (2010). Food insecurity, hunger and malnutrition: necessary policy and technology changes. New Biotechnology Vol. 27(5), pp 449-452
• Welthungerhilfe, Concern Worldwide and IFPRI. (2014). Global Hunger Index 2014. Dublin/Bonn: IFPRI
• Welthungerhilfe, Concern Worldwide and IFPRI. (2019). Global Hunger Index 2019. Dublin/Bonn: IFPRI
• World Bank. (2009). Investing in the future. GLOBAL REPORT 2009. Retrieved from https://www.who.int/vmnis/publications/investing_in_the_future.pdf https://www.who.int/vmnis/publications/investing_in_the_future.pdf (accessed on July 23, 2020).
• World Bank. (2011). Inadequate Sanitation Costs India Equivalent of 6.4% of GDP. Retrieved from https://www.worldbank.org/en/news/feature/2011/01/13/india-cost-of-inadequate-sanitation (accessed on May 22, 2020).
• World Health organisation (WHO). (2015). Global Targets 2025. To improve maternal, infant and young child nutrition. Geneva: World Health Organization. Retrieved from https://www.who.int/nutrition/global-target-2025/en/ (accessed March 1, 2020).
• World Health Organization (2017). Policy- The National Nutrition Plan (Year 2017-2030). Switzerland: WHO

89
Annexure Table A1: Summary of Recommended Dietary Allowances (RDA) for Energy, Protein, Fat and Minerals for Indians – 2010
Group Category/Age Body Weight (Kg)
Net Energy (Kcal/day)
Protein (g/day)
Visible Fat (g/day)
Calcium (mg/day) Iron (mg/day) Zinc
(mg/day) Magnesium
(mg/day)
Men
Sedentary Work
60
2320
60
25
600 17 12 340 Moderate Work 2730 30
Heavy Work 3490 40
Women
Sedentary Work 55 1900
55
20
600 21 10
310
Moderate Work 2230 25
Heavy Work 2850 30
Pregnant +350 78 30 1200 35
12 Lactating (0-6 m) +600 74 30 1200 21
(6-12 m) +520 68 30
Infants (0-6 months) 5.4 92 kcal/kg/day 1.16
gram/kg/day - 500
46ug/kg/day - 30
(6-12 months) 8.4 80 kcal/kg/day 1.69 gram/kg/day 19 05 - 45
Children
1-3 years 12.9 1060 16.7 17
600
09 5 50
4-6 years 18.0 1350 20.1 25 13 7 70
7-9 years 25.1 1690 29.5 30 16 8 100
Boy 10-12 years 34.3 2190 39.9 35 800 21 9 120
Girl 10-12 years 35.0 2010 40.4 35 800 27 9 160
Boy 13-15 years 47.6 2750 54.3 45 800 32 11 165
Girl 13-15 years 46.6 2330 51.9 40 800 27 11 210
Boy 16-17 years 55.4 3020 61.5 50 800 28 12 195
Girl 16-17 years 52.1 2440 55.5 35 800 26 12 235
Source: Indian Council of Medical Research (ICMR)

90
Figure A1: Proportion of Underweight, Stunted, and Wasted Children under Five Years of Age, NFHS
Source: International Institute for Population Sciences (2007, 2016), NFHS- III, IV
35.8
010203040506070
Mad
hya
Prad
esh
Jhar
khan
d
Biha
r
Meg
hala
ya
Chha
ttisg
arh
Guja
rat
All I
ndia
Utt
ar P
rade
sh
Odi
sha
Raja
stha
n
Hary
ana
Wes
t Ben
gal
Utt
arak
hand
Karn
atak
a
Mah
aras
htra
Him
acha
l Pra
desh
Assa
m
Arun
acha
l Pra
desh
Tam
il N
adu
Delh
i
Jam
mu
and
Kash
mir
Nag
alan
d
Goa
Punj
ab
Kera
la
Man
ipur
Mizo
ram
Sikk
im
Und
erw
eigh
t und
er 5
yrs
(%) NFHS 3 (2005-06) NFHS 4 (2015-16)
38.4
010203040506070
Utt
ar P
rade
sh
Biha
r
Meg
hala
ya
Chha
ttisg
arh
Guja
rat
Mad
hya
Prad
esh
Jhar
khan
d
All I
ndia
Assa
m
Mah
aras
htra
Hary
ana
Odi
sha
Wes
t Ben
gal
Utt
arak
hand
Karn
atak
a
Raja
stha
n
Arun
acha
l Pra
desh
Delh
i
Mizo
ram
Nag
alan
d
Him
acha
l Pra
desh
Sikk
im
Punj
ab
Man
ipur
Jam
mu
and
Kash
mir
Tam
il N
adu
Goa
Kera
la
Stun
ting
unde
r 5 y
rs (%
)
NFHS 3 (2005-06) NFHS 4 (2015-16)
21
05
10152025303540
Mad
hya
Prad
esh
Jhar
khan
d
Meg
hala
ya
Biha
r
Tam
il N
adu
Raja
stha
n
All I
ndia
Chha
ttisg
arh
Odi
sha
Him
acha
l Pra
desh
Hary
ana
Utt
arak
hand
Guja
rat
Karn
atak
a
Wes
t Ben
gal
Mah
aras
htra
Kera
la
Delh
i
Arun
acha
l Pra
desh
Jam
mu
and
Kash
mir
Utt
ar P
rade
sh
Goa
Assa
m
Nag
alan
d
Sikk
im
Punj
ab
Man
ipur
Mizo
ram
Was
ting
unde
r 5 y
rs (%
)
NFHS 3 (2005-06) NFHS 4 (2015-16)

91
Figure A2: Child Mortality Indicators (per 1000 live births) across States, NFHS
Source: International Institute for Population Sciences (2000, 2007, 2016), NFHS-II, III, IV
020406080
100120140160
Utt
ar P
rade
shM
adhy
a…Ch
hatt
isgar
hBi
har
Assa
mJh
arkh
and
Raja
stha
nAl
l Ind
iaO
dish
aU
ttar
akha
ndG
ujar
atHa
ryan
aHi
mac
hal…
Jam
mu
&…
Punj
abW
est B
enga
lKa
rnat
aka
Mah
aras
htra
Tam
il N
adu
Kera
laAr
unan
chal
…De
lhi
Goa
Man
ipur
Meg
hala
yaM
izora
mN
agal
and
Sikk
imTr
ipur
a
Und
er fi
ve m
orta
lity
rate
(per
10
00 li
ve b
irths
)
NFHS 2 (1998-99) NFHS 3 (2005-06) NFHS 4 (2015-16)
0
20
40
60
80
100
Meg
hala
yaU
ttar
Pra
desh
Mad
hya
Prad
esh
Odi
sha
Chha
ttisg
arh
Raja
stha
nBi
har
Assa
mAl
l Ind
iaJa
mm
u &
…Ar
unan
chal
…G
ujar
atPu
njab
Hary
ana
Jhar
khan
dKa
rnat
aka
Wes
t Ben
gal
Tam
il N
adu
NCT
of D
elhi
Trip
ura
Sikk
imM
ahar
asht
raN
agal
and
Utt
arak
hand
Man
ipur
Mizo
ram
Goa
Him
acha
l…Ke
rala
IMR
(per
100
0 liv
e bi
rths
)
NFHS 2 (1998-99) NFHS 3 (2005-06) NFHS4 (2015-16)
0102030405060
Mad
hya
Prad
esh
Chha
ttisg
arh*
Utt
ar P
rade
shM
egha
laya
Raja
stha
nO
dish
aBi
har
Assa
mAl
l Ind
iaW
est B
enga
lAr
unan
chal
…Ja
mm
u &
…G
ujar
atKa
rnat
aka
Jhar
khan
d*Ha
ryan
aTa
mil
Nad
uPu
njab
Mah
aras
htra
Goa
Delh
iSi
kkim
Utt
arak
hand
*Hi
mac
hal…
Nag
alan
dM
izora
mM
anip
urKe
rala
NM
R (p
er 1
000
live
birt
h)
NFHS 2 (1998-99) NFHS 3 (2005-06) NFHS4 (2015-16)

92
Figure A3: Prevalence of Anaemia among Children Aged 6-35 Months, Women (15-49 Years) and Men (15-49 Years) in India (Using WHO Classification), 1998-99, 2005-06 and 2015-16
Source: International Institute of Population Science (2000, 2007, 2017), National Family Health Survey-II, III, IV
Figure A4: Monthly Ratio of Food to Non-Food Prices
Source: Labour Bureau, Ministry of Labour and Employment, Government of India. Note: IW - Industrial workers, AL- Agricultural labourers. Base: 2001=100 for CPI (IW) and CPI-AL. We have taken two sets of rice, i.e., CPI-AL food to CPI-AL general and CPI-IW food to CPI-IW general price index.
0
20
40
60
80
100
NFHS-2 (1998-99) NFHS-3 (2005-06) NFHS-4 (2015-16)Prev
alen
ce o
f ana
emia
(%)
Children (6-35 months) Women (15-49 years) Men (15-49 years)
0.840.870.900.930.960.991.021.051.081.111.141.17
1995
-96
2000
-01
2005
-06
2010
-11
2015
-16
2017
-18
2018
-19
2019
-20
Ratio
of f
ood
to g
ener
al p
rice
inde
x
CPI-IW CPI-AL

93
Figure A5: Prevalence of Low BMI among Women aged 15-49 years in India (using WHO Classification), 2005-06 and 2015-16
Source: International Institute of Population Science (2000, 2007, 2017), National Family Health Survey-II, III, IV
Figure A6: Percentage of Women (Age 15-49) Who Received Four or More Antenatal Care (ANC) Visits during Pregnancy and Institutional Deliveries (Percentage of Live Birth in the Five Years before the Survey), 2015-16
Source: International Institute of Population Science (2017), National Family Health Survey- IV
0102030405060
Jhar
khan
dBi
har
Mad
hya
Prad
esh
Guj
arat
Raja
stha
nCh
hatt
isgar
hO
dish
aAs
sam
Utt
ar P
rade
shM
ahar
asht
raAl
l Ind
iaW
est B
enga
lKa
rnat
aka
Trip
ura
Utt
arak
hand
Andh
ra P
rade
shHi
mac
hal P
rade
shHa
ryan
aN
CT o
f Del
hiG
oaTa
mil
Nad
uN
agal
and
Jam
mu
& K
ashm
irM
egha
laya
Punj
abKe
rala
Man
ipur
Arun
anch
al P
rade
shM
izora
mSi
kkim
Perc
ent
NFHS 2 (1998-99) NFHS 3 (2005-06)
020406080
100120
Kera
laGo
aJa
mm
u &
Kas
hmir
Tam
il N
adu
Wes
t Ben
gal
Andh
ra P
rade
shTe
lang
ana
Sikk
imM
ahar
asht
raGu
jara
tKa
rnat
aka
Him
acha
l Pra
desh
Man
ipur
Punj
abDe
lhi
Trip
ura
Odi
sha
Mizo
ram
Chha
ttisg
arh
Indi
aM
egha
laya
Assa
mHa
ryan
aRa
jast
han
Mad
hya
Prad
esh
Utt
arak
hand
Jhar
khan
dAr
unac
hal P
rade
shU
ttar
Pra
desh
Nag
alan
dBi
har
Four
or m
ore
ANC
visi
ts (%
) &
Inst
itutio
nal d
eliv
ery
(%)
Four or more ANC visits Institutional Delivery

94
Figure A7: Percentage of Women (Age 15-49) Who Received IFA Supplements under Antenatal Care, 2015-16
Source: International Institute of Population Science (2017), National Family Health Survey- IV
Figure A8: Percentage of Children Aged 12-23 Months Who Received Basic Vaccination and Children 6-59 Months Who Were Given Vitamin A Supplements, 2015-16
Source: International Institute of Population Science (2017), National Family Health Survey- IV Note: Basic vaccination includes BCG, measles, and three doses each of DPT and polio vaccines for children age 12-23 months at any time before the survey (according to a vaccination card or the mother's report)
020406080
100120
Kera
laG
oaJa
mm
u &
Kas
hmir
Tam
il N
adu
Wes
t Ben
gal
Andh
ra P
rade
shTe
lang
ana
Sikk
imM
ahar
asht
raG
ujar
atKa
rnat
aka
Him
acha
l Pra
desh
Man
ipur
Punj
abDe
lhi
Trip
ura
Odi
sha
Mizo
ram
Chha
ttisg
arh
Indi
aM
egha
laya
Assa
mHa
ryan
aRa
jast
han
Mad
hya
Prad
esh
Utt
arak
hand
Jhar
khan
dAr
unac
hal P
rade
shU
ttar
Pra
desh
Nag
alan
dBi
har
Wom
en a
ged
15-4
9 yr
s (%
)
Were given IFA tablets Took IFA tablets for at least 100 days
020406080
100
Punj
abGo
aW
est B
enga
lSi
kkim
Kera
laCh
andi
garh
Odi
sha
Chha
ttisg
arh
Jam
mu
&…
Tam
il N
adu
Him
acha
l…De
lhi
Tela
ngan
aM
anip
urAn
dhra
Pra
desh
Karn
atak
aHa
ryan
aIn
dia
Jhar
khan
dBi
har
Meg
hala
yaU
ttar
akha
ndM
ahar
asht
raRa
jast
han
Trip
ura
Mad
hya…
Utt
ar P
rade
shM
izora
mGu
jara
tAs
sam
Arun
acha
l…N
agal
and
Child
ren
who
reci
eved
vita
min
A
supp
lem
ents
& B
asic
vac
cina
tion
(%)
Vitamin A supplements Basic vacination

95
Figure A9: Percentage of Household Reporting Access to Toilet Facility, NFHS
Source: International Institute of Population Science (2000, 2007, 2017), National Family Health Survey- II, III, IV
Figure A10: Percentage of Household Reporting Safe/Improved Source of Drinking Water, NFHS
Source: International Institute of Population Science (2000, 2007, 2017), National Family Health Survey- II, III, IV Note: Improved source of drinking water includes piped water into dwelling; tube well, public tap or standpipe
020406080
100120
Kera
la
Punj
ab
Hary
ana
Assa
m
Him
acha
l…
Utt
arak
hand
Jam
mu
and…
Wes
t Ben
gal
Mah
aras
htra
Guj
arat
Karn
atak
a
Tam
il N
adu
Andh
ra…
All I
ndia
Raja
stha
n
Utt
ar P
rade
sh
Mad
hya…
Chha
ttisg
arh
Odi
sha
Biha
r
Jhar
khan
d
Hous
ehol
ds w
ith sa
nita
tion
faci
lity(
%)
NFHS 2 (1998-99) NFHS 3 (2005-06) NFHS 4 (2015-16)
020406080
100120
Punj
ab
Biha
r
Utt
ar P
rade
sh
Him
acha
l…
Wes
t Ben
gal
Kera
la
Utt
arak
hand
Hary
ana
Mah
aras
htra
Chha
ttisg
arh
Tam
il N
adu
Guja
rat
All I
ndia
Karn
atak
a
Jam
mu
and…
Odi
sha
Raja
stha
n
Mad
hya
Prad
esh
Assa
m
Jhar
khan
d
Andh
ra P
rade
sh
Impr
oved
sou
rce
of d
rinki
ng
wat
er (%
)
NFHS 2 (1998-99) NFHS 3 (2005-06) NFHS 4 (2015-16)

96
Table A2: Logit Estimates for Children below Three Years of Age who are Stunted, Underweight and Wasted against Determinants, 2015-16 (NFHS-4)
Variables Underweight Stunting Wasting Immediate determinants:
Mother’s BMI (Reference: BMI lower than 18.5) BMI >18.5 -0.50*** -0.20*** -0.33***Duration of breastfeeding (Ref: Never breastfed) 0-6 months -0.28*** -0.62***
7-12 months -0.15*** -0.40***
13 and above months 0.20*** 0.34*** Consumption of nutritious food * by child (Ref : did not consume) Consumed -0.11***
Nutritional Interventions:
Antenatal visits (Ref: No visits) 1-4 visits -0.05*** -0.09***5-10 -0.18*** -0.25***10 above -0.26*** -0.19***Taken Iron Folic Supplements during pregnancy (Ref: not taken) Taken supplements -0.05*** -0.08***Received Vitamin A in last six months (Ref: yes) Not received 0.05*** Basic Vaccinations **(Ref: Not received) Received -0.24***Place of delivery (Ref: at home) Institution (Private or Govt. health care facility) -0.09*** -0.06***
Underlying factors:
Mother’s Educational status (Ref: No Education) Primary -0.18*** -0.14*** -0.05**Secondary -0.30*** -0.34*** 0.00 Higher -0.64*** -0.64*** 0.01 Wealth Index ( Ref: poorest) Poorer -0.20*** -0.10*** -0.14***Middle -0.38*** -0.22*** -0.24***Richer -0.50*** -0.34*** -0.28***Richest -0.70*** -0.53*** -0.34***Caste (Ref: Scheduled population) OBCs or Others -0.16*** -0.12*** -0.11***
Constant 0.57*** 0.36*** -0.59***Number of observations 112894 112894 125125

97
Pseudo R square 0.06 0.07 0.01
Source: Author’s calculation Note: *Nutritious food includes green leafy vegetable, fruits, milk and milk products **Basic vaccination include BCG, measles, and three doses each of DPT and polio vaccine (excluding polio vaccine given at birth) ***the results are based on WHO standards Table A3: Logit Estimates for Children below Three Years of Age who are Stunted, Underweight and Wasted against Determinants, 2005-06 (NFHS-3)
Variables Underweight Stunting Wasting
Immediate determinants:
Mother’s BMI (Reference: BMI lower than 18.5) BMI >18.5 -0.46*** -0.16*** -0.42***Duration of breastfeeding (Ref: Never breastfed) 0-6 months -0.38** -1.28***7-12 months -0.03 -0.66***13 and above months 0.36** 0.21
Nutritional Interventions:
Antenatal visits (Ref: No visits) 1-4 visits -0.27*** -0.13*** -0.16***5-10 -0.47*** -0.31*** -0.31***10 above -0.65*** -0.49*** -0.40***Basic Vaccinations **(Ref: Not received)Received -0.31***Place of delivery (Ref: at home)Institution (Private or Govt. health care facility) -0.10*** -0.11***
Underlying factors:
Mother’s Educational status (Ref: No Education) Primary -0.12*** -0.09*** -0.03Secondary -0.25*** -0.28*** -0.13***Higher -0.58*** -0.68*** -0.11Wealth Index ( Ref: poorest) Poorer -0.19*** -0.11*** -0.13***Middle -0.44*** -0.25*** -0.26***Richer -0.58*** -0.34*** -0.33***Richest -1.04*** -0.71*** -0.49***Caste (Ref: Scheduled population) OBCs or Others -0.39*** -0.18*** -0.36***
Constant 0.56*** 0.69*** -0.43***Number of observations 21635 21635 19217Pseudo R square 0.09 0.10 0.03
Source: Author’s calculation Note: **Basic vaccination includes BCG, measles, and three doses each of DPT and polio vaccine (excluding polio vaccine given at birth) ***the results are based on WHO standards

98
Table A4: Logit Estimates for Children below Three Years of Age who are Stunted, Underweight and Wasted against Determinants, 1998-99 (NFHS-2)*
Variables Underweight Stunting Wasting
Immediate determinants:
Mother’s BMI (Reference: BMI lower than 18.5) BMI >18.5 -0.50*** -0.12*** -0.39***Duration of breastfeeding (Ref: Never breastfed) 0-6 months -1.88*** -1.73*** -0.47***7-12 months -0.45*** -0.60*** -0.0913 and above months 0.07 0.06 0.15
Nutritional Interventions:
Antenatal visits (Ref: No visits) 1-4 visits -0.10*** -0.22***5-10 -0.39*** -0.53***10 above -0.57*** -0.77***Basic Vaccinations **(Ref: Not received)Received -0.12***Place of delivery (Ref: at home)Institution (Private or Govt. health care facility) -0.11*** -0.20***
Underlying factors:
Mother’s Educational status (Ref: No Education) Primary -0.05 -0.19***Secondary -0.32*** -0.41***Higher -0.55*** -0.75***Wealth Index ( Ref: poorest) Poorer -0.21*** -0.12*** -0.26***Middle -0.31*** -0.17*** -0.33***Richer -0.53*** -0.26*** -0.46***Richest -0.81*** -0.42*** -0.75***Caste (Ref: Scheduled population) OBCs or Others -0.13*** -0.11*** -0.08**
Constant 1.39*** 1.17*** -1.04***Number of observations 24691 21726 24831 Pseudo R square 0.15 0.13 0.03
Source: Author’s calculation Note: * Results of underweight, stunting and wasting are based on NCHS standards **Basic vaccination include BCG, measles, and three doses each of DPT and polio vaccine (excluding polio vaccine given at birth) ***Based on NCHS standard

99
Table A5: Logit Estimates for Children below Three Years of Age who are of Stunted, Underweight and Wasted against its Determinants, 1993-94 (NFHS-1) Variables Underweight Stunting Wasting Immediate determinants:
Duration of breastfeeding (Ref: Never breastfed) 0-6 months -1.46*** -1.38*** -0.63***7-12 months -0.19* -0.45*** -0.1713 and above months 0.35*** 0.14 0.21
Nutritional Interventions:
Antenatal visits (Ref: No visits) 1-4 visits 0.01 -0.10***5-10 -0.21*** -0.28***10 above -0.26*** -0.48***Received Vitamin A in last six months (Ref: Not received) Received -0.07**Basic Vaccinations **(Ref: Not received) Received Place of delivery (Ref: at home) Institution (Private or Govt. health care facility) -0.14*** -0.16***
Underlying factors:
Mother’s Education status (Ref: No Education) Primary -0.14*** -0.17*** -0.08Secondary -0.44*** -0.50*** -0.22***Higher -0.75*** -0.63*** -0.55***Wealth Index ( Ref: poorest) Poorer -0.03 -0.04 -0.05Middle -0.13*** -0.13*** -0.12*Richer -0.41*** -0.24*** -0.25***Richest -0.57*** -0.43*** -0.28***Caste (Ref: Scheduled population) OBCs or Others -0.12*** -0.16*** -0.11**
Constant 0.75*** 0.75*** -1.17***Number of observations 25849 20190 20266 Pseudo R square 0.12 0.10 0.02
Source: Author’s calculation Note: *Nutritious food includes green leafy vegetable, fruits, milk and milk products **Basic vaccination include BCG, measles, and three doses each of DPT and polio vaccine (excluding polio vaccine given at birth) ***Based on NCHS standard

100
Table A6: Expenditure by the Government on Nutrition Sensitive Programmes (In Rs. Crore) Programmes 2018-19
(Actual) 2019-20
(RE) 2020-21 (BE)
Food Security Programmes 1. National Food Security Act 101327 108688.4 115569.7
Health Programmes 1. National Health Mission 31044.89 33789.6 33400 2. Ayushman Bharat 1997.92 3200 6400 3. Umbrella ICDS (Anganwadi Services,
Pradhan Mantri Matru Vandana Yojana,Scheme for Adolescent Girls, NationalCrèche Scheme, Child Protection Services,National Nutrition Mission )
21642.44 24954.5 28557.4
4. Mid-day Meal Scheme 9514.34 9912.21 11000 Educational Programmes
1. National Scheme for Incentive to Girl Childfor Secondary Education
164.58 87.67 110
2. National Education Mission (SamagraShiksha, Sarva Shiksha Abhiyan, RashtriyaMadhyamik Shiksha Abhiyan, TeachersTraining and Adult Education)
29436.9 36292.3 38860.5
3. Beti Bachao Beti Padhao 244.73 200 220 Water and Sanitation Programmes
1. Jal Jeevan Mission (JJM)/National RuralDrinking Water Mission
5484.15 10000.66 11500
2. Swachh Bharat Mission (Rural) 12912.66 8338.22 9994.1
3. Swachh Bharat Mission (Urban) 2461.61 1300 2300 Poverty Alleviation Programmes
1. National Social Assistance Programme(Indira Gandhi National Old Age PensionScheme, National Family Benefit Scheme,Indira Gandhi National Widow PensionScheme, Indira Gandhi National DisabilityPension Scheme, Annapurna Scheme)
8418.47 9200 9196.92
2. Mahatma Gandhi National RuralEmployment Guarantee Programme
61815.09 71001.81 61500
3. National Livelihood Mission - Ajeevika(Rural)
5783.47 9024 9210.04
4. National Livelihood Mission - Ajeevika(Urban)
432.12 750 795
5. Pradhan Mantri Awas Yojna (PMAY)-Rural
19307.94 18475 19500
6. Pradhan Mantri Awas Yojna (PMAY)-Urban
6134.62 6853.26 8000
Source: Union Budgets, GoI (Various Years)

101
NABARD Research Study Series
Sl. No. Title Agency Year 1. Whether Graduation of SHG
Members? An exploration in Karnataka and Odisha
National Bank for Agriculture and Rural Development, Mumbai
2014
2. Study on Strengthening the value chain of TDF Wadi Projects in Andhra Pradesh
Administrative Staff College of India, Hyderabad
2020
3. Developing a roadmap of Social Enterprise Ecosystem- as a precursor for a viable Social Stock Exchange in India
Grassroots Research and Advocacy Movement (GRAAM)
2020
4. Sustainability of Old Self Help Groups in Telangana
Mahila Abhivrudhi Society, Telangana
2020
5. Impact Assessment of RuPay Card on Weaker and Marginalized Sections in Bihar and Uttar Pradesh
Rambhau Mhalgi Prabodhini, Mumbai
2020
6. Getting More from Less: Story of India’s Shrinking Water Resources
Indian Council for Research on International Economic Relations (ICRIER)
2020
7. Identifying the Most Remunerative Crop-Combinations Regions in Haryana: A Spatial- Temporal Analysis
Centre for Research in Rural and Industrial Development (CRRID)
2020
8. Climate Change Impact, Adaption and mitigation: Gender perspective in Indian Context
ICAR- National Institute of Agricultural Economics and Policy Research (ICAR-NIAP)
2020
9. Achieving Nutritional Security in India: Vision 2030
Indian Council for Research on International Economic Relations (ICRIER)
2020


NATIONAL BANK FOR AGRICULTURE AND RURAL DEVELOPMENT
Plot No. C-24, 'G' Block, Bandra Kurla Complex Rd, Bandra East, Mumbai, Maharashtra 400051
Core 6A, 4th Floor, India Habitat Center, Lodhi Road, New Delhi 110003,Phone: (91-11) 43 112400 (91-11) 24620180, 24618941
ISBN 978-81-937769-4-0