achieving sustainable savings in purchased services through best practices
TRANSCRIPT

SSM Health and MD BuylineAchieving Sustainable Savings in Purchased Services through Best
Practices

Presenters
David RodriguezSVP Marketing
• 15 years of experience in healthcare product marketing for revenue cycle, supply chain and payer solutions
• Previous positions held at Trizetto, Interpoint, Concuity and The Advisory Board
Cris O’NealSystem Contract Manager – Purchased Services
SSM Health Care Corporation
• Manager of SSM System-wide Purchased Services • Appointed member -Premier National Purchased Services Strategic Planning
Committee• Active Member of CCG Purchased Services Committee • Active Member of AHRMM Education Committee

Agenda
• Introductions to MD Buyline and SSM Health Systems
• Overview of Purchased Services
• SSM – Transcription and Laundry Services
• Purchased Services Best Practices
• SSM – Transcription and Laundry Services Results
• Q&A

SSM Health - The FactsMission-Through our exceptional health care services, we reveal the healing presence of God.
• 1st Health-care Organization to receive Malcolm Baldridge Quality Award
• 19 Hospitals in 4 States• 30,000 Employees• 3,900 Licensed Beds
Annual Spend on Purchased Services• $300 million • 20% of system’s annual
expenditures

MD Buyline – The Facts
Industry-Leading and Proprietary Data
• 500,000+ unique products and services tracked
• 100+ clinical specialty areas covered
• 60,000+ quotes, contract reviews, and analyses annually
• 30+ years of historical data
Clinical and Financial Research
• 600 years of collective experience, averaging over 20 years of experience each
• Broad collective expertise across a range of specialties
• Over 3,700 research reports and surveys published annually
Technology Solutions
• Capital: Proprietary product configurator analyzes thousands of possible configurations
• Consumables: Item-level benchmarking and sophisticated analysis capabilities
• Purchased Services: Sophisticated data and service contract analysis

Our Research: How to Outperform the Market• Challenge: Growing non-labor costs, increased risk, compliance
mandatesThe CAGR for all healthcare expenditures is projected to grow at 6% annually from 2013 to 2022, according to a 2014 HSCA report.
• Process: Identifying opportunities: 3 keys – cost, risk, processUnderstand your spend (AP review). Evaluate the ROI. Align stakeholders to ensure utilization. Manage the contract. Reduce your exposure.
• Savings: Equipping hospitals with actionable data and researchVendors on GPO contracts are offered at a discount, but healthcare providers achieve greater savings when applying industry-leading benchmarks and
research.
medical devices15% healthcare IT14% purchased services30% medical/surgical11%
% S
AV
ING
S
GPO
10% Medical Capital
15% PPI/Consumables
30% Purchased
Services
Status Quo Savings

Our Research: How to Outperform the Market• Execution: Managing contracts, risk and performance
Centralize contracts and establish a formalized contracting process with transparency and accountability. Leverage healthcare subject-matter experts.
• Alignment: Bridging the clinical, savings and contracting gap between stakeholdersComing together like never before, clinicians, physicians, department heads, supply chain, vendors, finance, compliance, audit and legal teams will be able to collaborate and use data to improve decision making and reduce risk for their health system and patients.
financial
accountability
contract
repository
manage
risk
financial
accountability

25%
20%
15%
10%
5%
0%
Save more every month5% sustainable improvement to operating margins
10% to 30%average savings in a purchased services
category
savings before after
experience the direct impact
purchased services savings fallstraight to the bottom line.
before after
20%
15%
4%
9%
PURCHASED SERVICES OPERATING MARGIN
Hospitals implementing Purchased Services’ best practices
spend 25% less on purchased services.
Hospitals with a defined Purchased Services Program quickly realize a
5% sustainable improvement in their operating margins.

Poll Question #1
Q. Do you have clinical outsourced services that have not been re-evaluated or re-contracted in 3 or more years?
A. Yes
B. No
C. Unsure

SSM Purchased Services
Transcription and Laundry Services – Strategic Services that needed a facelift
HOW TO FIND THE RIGHT FOCUS
Immediate, high-impact savings
• Look at top 10
• Then top 50
Best Practice
1. Set our goals2. Formulate the plan3. Implement
Price is only one factor
• Strategic Services• Regional Providers• Optimize Technology • Regulatory Compliance
Implications• Risk

Transcription – Current State
MModal
• Is the incumbent the best choice?
• How is the current pricing?
• What do the clinicians think of the vendor?
• How do we build a solid contract?

Laundry Services – Current State
Seven Vendors
• What are existing obligations (e.g. Expire dates, Termination clauses)?
• What is the current linen/laundry model?
– On-Premise Laundry– Customer Owned Goods– Rental Service – Cooperative– Other – Vocational Services
• What is price Unit Of Measure (UOM)
– Clean or Dirty – Poundage or piece rates
• What does regional stakeholders think of incumbent vendor?
• Do we source for system agreement or leverage locally?

Purchased Services Categories Addressed
Transcription
• Identified as Top Spend
• Negotiated on System level
• Challenges beyond price
• New Technology
• Clinical Improvements
Annual Spend
$3.8M
Laundry Services
• Identified as Top Spend
• Identified as Strategic Importance
• Negotiated on local level
• Challenges beyond price
• Regulatory Compliance
• Existing Relationships
Annual Spend
$7.2M
LeveragedExisting
Relationships

Best Practice Approach
• Analyze spend
• Rank the opportunities
• Analyze T&C
• Service performance
• Utilization
• Identify stakeholders
• Perform interviews
• Gather requirements
• Many points of data
• Scenario driven pricing
• Service-based pricing
• Engage incumbents
• Bid the service
• Pick the vendor
• Define the contract terms
• Monitor the spend
• Monitor the service
• Monitor the users
• Monitor the quality
Opportunity Identification
Analyze the data
Research CategoryPricing
BenchmarksBid the Service
Implement and Manage the Contract

The Opportunity AssessmentBuilt a database with our contracts, AP and PCard data, centralizing our purchased services.
Categorized the data, then prioritize projects based on our initiatives and our identified opportunities.

Gathering Requirements
Understanding the Needs
1. Meet with key stakeholders
2. Utilize MD Buyline’s resources to identify action items for service category
3. Review payment history
4. Agree upon goals andexpectations
Transcription
• Physicians
• Health Information Management (HIM)
• CIO/IHT
• Supply chain
• Quality
• Legal
Laundry
• Environmental Services
• Operations
• Supply chain
• Accounts Payable
• Quality
• Legal

Dialysis
C-SUITE
CONSULTANT DIALYSIS PROVIDER
• Relationship with the dialysis provider since 2001
• Contracted: hemodialysis, CAPD, CRRT and apheresis
• Parallon initially involved to negotiate contract
• Could not achieve maximum savings
SUPPLY CHAIN
$$
MEMBER FACILITY
• Benchmarked the contract • Identified $132K annual savings
• Empowered the supply chain to achieve greater savings with MD Buyline’s recommendation
• Believed in MD Buyline’s recommendation
• Contracting achieved $142K savings annually
• $10k over MDB• Achieved
$71Ksavings over the contract term
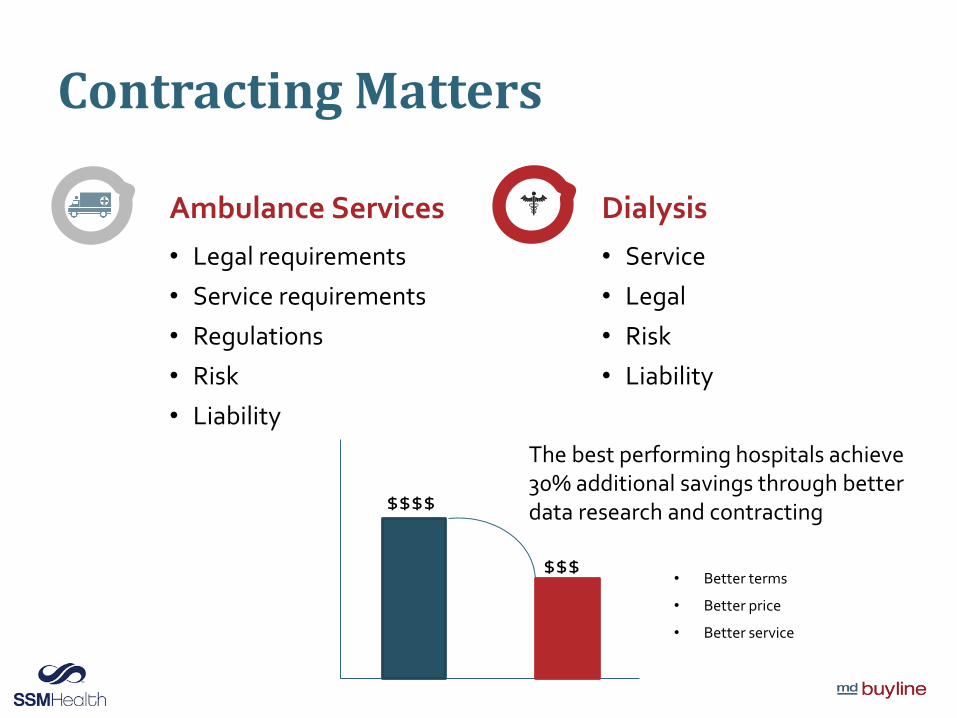
Contracting Matters
Dialysis
• Service
• Legal
• Risk
• Liability
The best performing hospitals achieve 30% additional savings through better data research and contracting$$$$
$$$• Better terms
• Better price
• Better service
Ambulance Services
• Legal requirements
• Service requirements
• Regulations
• Risk
• Liability
Poll Question #2
Q. Do you have local or regional outsourced services that have not been re-evaluated or re-contracted in 3 or more years due to local or regional regulatory issues?
A. Yes
B. No
C. Unsure

Duration of Projects
5months
5 -12months
Opportunity Identification
Analyze the data
Research CategoryPricing
BenchmarksBid the Service
Implement and Manage the Contract
Opportunity Identification
Analyze the data
Research CategoryPricing
BenchmarksBid the Service
Implement and Manage the Contract
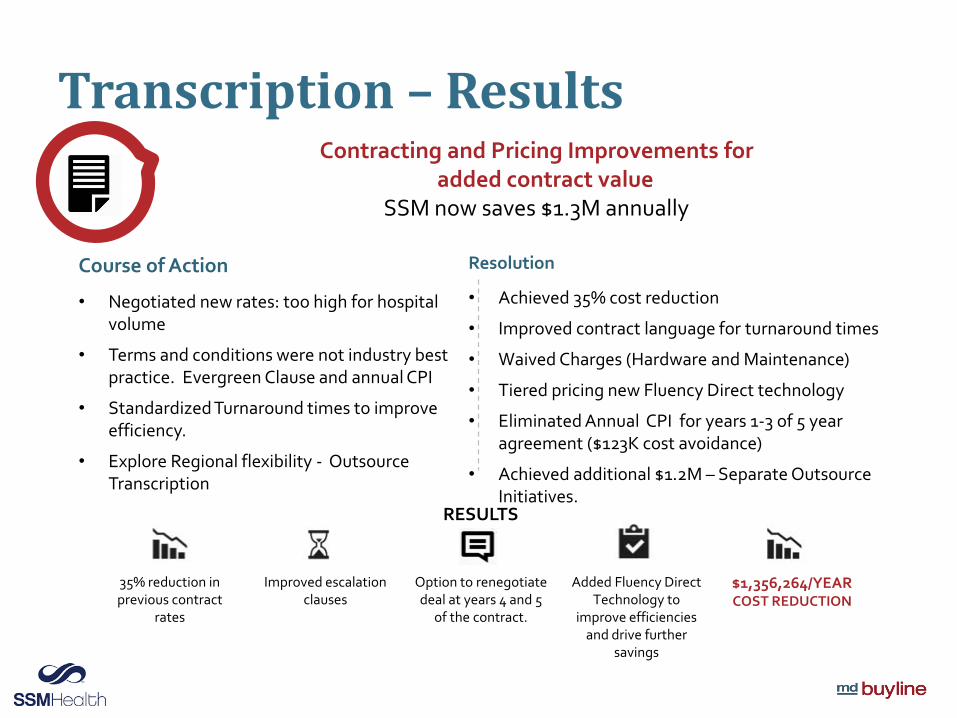
Transcription – ResultsContracting and Pricing Improvements for
added contract valueSSM now saves $1.3M annually
Course of Action
• Negotiated new rates: too high for hospital volume
• Terms and conditions were not industry best practice. Evergreen Clause and annual CPI
• Standardized Turnaround times to improve efficiency.
• Explore Regional flexibility - Outsource Transcription
Resolution
• Achieved 35% cost reduction
• Improved contract language for turnaround times
• Waived Charges (Hardware and Maintenance)
• Tiered pricing new Fluency Direct technology
• Eliminated Annual CPI for years 1-3 of 5 year agreement ($123K cost avoidance)
• Achieved additional $1.2M – Separate Outsource Initiatives.
RESULTS
35% reduction in previous contract
rates
Improved escalation clauses
Option to renegotiate deal at years 4 and 5
of the contract.
Added Fluency DirectTechnology to
improve efficiencies and drive further
savings
$1,356,264/YEAR COST REDUCTION

Laundry Services – ResultsContracting and Pricing Improvements for added contract value
SSM now saves $1.1M annually
Course of Action
• Negotiated benchmarked rates. (STL/JC)
• Renegotiated billing method : soiled wet linen to clean dry (WI)
• Regionalize 9 separate contracts with 4 vendors to 1 vendor.(WI)
• Source for new Laundry supplier due to incumbent sale of market and Assess CBA of COG vs. Rental. (SOIL)
• Renegotiate T & Cs – Strong language, penalties, rates too high, auto increases and change per piece UOM. (MV)
Resolution
• Achieved reduced rates. $291K
• Achieved savings of $240K
• Achieved Aggregate contract savings of $322K
• Reduced Vendor Pool from 4 to 1. Awarded new Supplier and transitioned from COG model to Rental model. Achieved $170K savings.
• Achieved new contract terms and changed per piece UOM to clean poundage. $110K
RESULTS
Achieved 16%Annual Cost Reduction
Contract terms improvements
ImprovedCompetitive rates
per pound
Added SLAs for quality
$1,132,341 AnnualCost Reduction

Questions and Answers