achieving transparency in the public reporting of 2006
TRANSCRIPT
Technical Report 53
Achieving Transparency in the Public Reporting of 2006-2007 Assessment Results
N A T I O N A L
C E N T E R O N
E D U C AT I O N A L
O U T C O M E S
In collaboration with:Council of Chief State School Officers (CCSSO)
National Association of State Directors of Special Education (NASDSE)
Supported by:U.S. Office of Special Education Programs
Technical Report 53
Achieving Transparency in the Public Reporting of 2006-2007 Assessment Results
Debra Albus • Martha Thurlow • Chris Bremer
July 2009
All rights reserved. Any or all portions of this document may be reproduced and distributed without prior permission, provided the source is cited as:
Albus, D., Thurlow, M., & Bremer, C. (2009). Achieving transparency in the public reporting of 2006-2007 assessment results (Technical Report 53). Minneapolis, MN: University of Minnesota, National Center on Educational Outcomes.
N A T I O N A L
C E N T E R O N
E D U C AT I O N A L
O U T C O M E S
National Center on Educational OutcomesUniversity of Minnesota • 207 Pattee Hall150 Pillsbury Dr. SE • Minneapolis, MN 55455Phone 612/624-8561 • Fax 612/624-0879http://www.nceo.info
The University of Minnesota is committed to the policy that all persons shall have equal access to its programs, facilities, and employment without regard to race, color, creed, religion, national origin, sex, age, marital status, disability, public assistance status, veteran status, or sexual orientation.
This document is available in alternative formats upon request.
NCEO Core Staff
The Center is supported through a Cooperative Agreement (#H326G050007) with the Research to Practice Division, Office of Special Education Programs, U.S. Department of Education. Additional support for targeted projects, including those on English language learners, is provided by other federal and state agencies. The Center is affiliated with the Institute on Community Integration at the College of Education and Human Development, University of Minnesota. Opinions expressed herein do not necessarily reflect those of the U.S. Department of Education or Offices within it.
Martha L. Thurlow, Director Deb A. Albus Jason R. AltmanManuel T. BarreraLaurene L. ChristensenChristopher J. JohnstoneJane L. Krentz Sheryl S. Lazarus
Kristi K. LiuRoss E. MoenMichael L. MooreRachel F. QuenemoenChristopher RogersDorene L. ScottMiong VangYi-Chen Wu
Executive Summary
States report on the participation and performance of students with disabilities by (a) submit-ting annual performance reports (APRs) to the U.S. Department of Education, and (b) publicly reporting state assessment data via their Web sites and other communication avenues. Both APRs and public reports provide important information, although the two may be slightly different in how the data are presented.
This is the eleventh report analyzing the public reporting of disaggregated data for students with disabilities by the National Center on Educational Outcomes. This analysis, for school year 2006-2007, also marks the fifth data cycle since the passage of the No Child Left Behind Act (NCLB) of 2001.
For the 2006-2007 year, there were increases in the number of the states publicly reporting disaggregated data for students with disabilities for regular assessments and alternate assess-ments based on alternate achievement standards (AA-AAS). The number of states reporting participation and performance online for students with disabilities for all regular assessments within NCLB accountability increased from 39 to 46 states. This means that states reported disaggregated participation and performance data online for 92% of all regular assessments within NCLB accountability systems. Two states reported only performance. One state reported participation and performance for some assessments, and one state was not counted as publicly reporting because data were not reported in a manner similar to those of other students.
For AA-AAS, the number of states reporting participation and performance also increased, from 24 states to 36. States with no data reported online for AA-AAS dropped by about half, from 13 states for the 2005-2006 school year to 7 for 2006-2007. Five states reported only performance, and two states reported only participation.
For unique states, including special territories, the reporting of online disaggregated data de-creased compared to the previous year for both regular assessments and AA-AAS. Unique states reporting participation and performance for regular assessments slipped from two states to one, and no unique states reported online for AA-AAS. One unique state e-mailed reports for both the regular assessment and AA-AAS, but because these appeared to be tables for the federal Annual Performance Report (APR) requirements, these were not counted in this analysis.
The most common approaches used by states to communicate participation and performance data for 2006-2007 regular assessments and AA-AAS remained the same as for 2005-2006, with some changes within the less common categories of reporting. Across assessments, the most common way to report participation was by number assessed (34 states for regular assess-ment, and 29 states for AA-AAS). The most common way of reporting performance was by the percent of students in each achievement level (34 states for regular assessment and 28 states for AA-AAS). As in previous years, data for reading and mathematics showed that performance
for students with disabilities was lower in most states compared to general education students. However, we observed slightly smaller average gaps between the two groups for the data sets available in 2006-2007 compared to 2005-2006 at each representative grade level.”
The number of states reporting disaggregated data for students who used accommodations on state assessments increased to 16 states for 2006-2007 over 10 states for 2005-2006. Information on accommodations spanned different state assessments, including AA-AAS (n=1), norm and criterion referenced regular assessments (n=16), and an alternate assessment based on modified achievement standards (AA-MAS). One state did not identify the assessments included in its accommodations data.
Table of ContentsOverview ....................................................................................................................................1
Method .......................................................................................................................................1
Results ........................................................................................................................................3
Characteristics of State Assessment Systems ....................................................................3
States That Reported Disaggregated Regular Assessment Data for Students with Disabilities .................................................................................................................5
Unique That Reported Disaggregated Regular Assessment Data for Students
with Disabilities .................................................................................................................7
States That Reported Disaggregated Alternate Assessment Data for Students
with Disabilities .................................................................................................................9
Communicating Participation in 2006-2007 ............................................................................12
Regular Assessment Participation Approaches and Select Results ..................................12
Alternate Assessment Disaggregated Participation Results for Students with
Disabilities .......................................................................................................................14
Communicating Performance in 2006-2007 ............................................................................15
Regular Assessment Performance and Select Results .....................................................15
Selected Disaggregated Results of Regular Assessment Performance ....................................17
Reading Performance .......................................................................................................17
Mathematics Performance ...............................................................................................22
Alternate Assessment Performance Results .............................................................................26
Other Information Collected for 2006-2007 ............................................................................27
Accommodations .............................................................................................................27
“Click” Analysis of Web-based Reporting .......................................................................29
Summary and Discussion .........................................................................................................30
Recommendations for Reporting .....................................................................................32
References ................................................................................................................................34
Appendix A: Sample Letter Sent to Assessment Directors ......................................................35
Appendix B: Sample Letter Sent to Special Education Directors ...........................................39
Appendix C: Status of Disaggregated Data (Participation and Performance) for Students with Disabilities on Regular State Tests in the Fifty States and Unique States for 2006-07 ....................................................................................................................................43
Appendix D: Status of Disaggregated Data (Participation and Performance) for Students with Disabilities on Alternate State Tests in the Fifty States and Unique States for 2006-07 ...............................................................................................................................51
Appendix E: Disaggregated Participation Information for Students with Disabilities on Regular State Tests for the Fifty States and Unique States for 2006-07 ..................................57
Appendix F: Disaggregated Alternate Assessment Participation Information for Students with Disabilities on Regular State Tests for the Fifty States and Unique States for 2006-2007 ...........................................................................................................................63
Appendix G: Disaggregated Regular Assessment Performance Information for Students with Disabilities for the Fifty States and Unique States for 2006-07 ......................................69
Appendix H: Disaggregated Alternate Assessment Performance Information for Students with Disabilities for the Fifty States and Unique States for 2006-07 ......................................75
Appendix I: Participation and Performance for Students Tested with Accommodations ........79
1NCEO
Overview
The 2006-2007 school year was the eighth annual reporting period since disaggregating the performance of students with disabilities on state and district-wide assessments was required by the Individuals with Disabilities Education Act (IDEA). It is the fifth reporting period since the enactment of the No Child Left Behind Act (NCLB), and the eleventh in a series of National Center on Educational Outcomes (NCEO) reports documenting state public reporting practices.
Historically, the number of states publicly reporting disaggregated participation and perfor-mance data for all regular assessments has increased from 28 states before the passage of NCLB (2000-2001), to 39 states for assessments within NCLB accountability systems in 2005-2006 (Thurlow, Bremer, & Albus, 2008). In the intervening years, the number has fluctuated some, from 36, 35, and 36 in 2002-2003, 2003-2004, and 2004-2005, respectively (Klein, Wiley, & Thurlow, 2006; Thurlow & Wiley, 2004; Thurlow, Wiley, & Bielinski, 2003; Wiley, Thurlow, & Klein, 2005; VanGetson & Thurlow, 2007).
The number of states reporting disaggregated participation and performance data for all alter-nate assessments had decreased from the high reported in 2004-2005 of 42 states to 28 states in 2005-2006. This change in reporting may be related to changes in federal policies for reporting to the U.S. Department of Education and to our procedures, in which we did not count Annual Performance Report (APR) data as publicly reported data (see Thurlow, Bremer, & Albus, 2008).
Method
In January 2008, project staff began searching state education Web sites for posted reports with disaggregated data for students with disabilities for school year 2006-2007. States are required to report their data in the fall, following the assessment year (e.g., 2006-2007 data are reported in fall, 2007), but states often revise data through the end of the year. Thus, January of the year after the school year in which assessments are administered is the month when almost all states have their corrected and verified data on their Web sites.
States included the 50 “regular” states and 11 “unique” states (American Samoa, Bureau of Indian Education, Commonwealth of Northern Mariana Islands, U.S. Department of Defense Education Affairs, District of Columbia, Federated States of Micronesia, Territory of Guam, Republic of Palau, Commonwealth of Puerto Rico, Republic of the Marshall Islands, and U.S. Virgin Islands). During this time, information was collected both on the actual participation and performance data reported by states for students with disabilities and descriptive informa-tion on how the states reported those data. The data collection included all regular and alternate
2 NCEO
state assessments within and outside the NCLB accountability systems, with the exception of assessments designed specifically for bilingual or English language learners.
After data were collected, individual state summary tables were created for verification in mid February. These summaries included only the descriptive information on how the state reported participation and performance. See Appendix A for a sample letter and summary table used in the verification process with state assessment directors.
The verification process occurred in two waves between March and May of 2008. In the first wave, letters and summary tables were mailed to state assessment directors. Twenty-one regular states responded to our request for verification in the first wave. In the second wave, after data tables were revised based on feedback, letters were sent to all state directors of Special Educa-tion (see Appendix B). Twenty-one regular states and one unique state responded to the second request for help in verification, with some of the same states from the first wave confirming data a second time. We continued to follow-up with checks of state Web sites into the summer and fall for states that might have posted later. Finally, we completed data entry and double checks for accuracy.
In this analysis of states’ publicly reported data, we clarify whether reporting was on assess-ments used for NCLB accountability purposes. Also, in presenting participation rate data in this report, we sometimes counted a state as reporting rates when the state provided numbers that allowed rates to be calculated; at other times we used a stricter criterion and counted states as reporting rates only if they reported percentages. We are clear when reporting these counts which criterion we used.
State assessments administered to students with disabilities who are also English language learn-ers or bilingual students (e.g., SABE/2 in California, IMAGE in Illinois, etc.) are not addressed in this report. The public reporting of these data will be included in a separate report focusing on English language learners with disabilities. It will cover all state assessments for 2006-2007.
As noted by Thurlow et al. (2008), the definition for what is counted as public reporting has been adjusted from earlier years of reporting. Starting with the 2005-2006 school year, state Annual Performance Reports (APRs) and State Performance Plans (SPPs) are not considered typical public reports that a state creates to meet the requirement to report to the public data on students with disabilities in the same manner and with the same frequency as it reports for all students.
The definition of regular students and students with disabilities is the same as in previous reports. “Regular student” refers to a population that might include all students assessed or a further disaggregation to all students without disabilities, depending on the state. The definition should be considered in interpreting the data, because we compare “regular student” data with data for students with disabilities. Further, the term “students with disabilities” may also vary by
3NCEO
state, with some states reporting only students with IEPs, and others reporting a combination of students with IEPs and 504 Plans.
When we examined gaps between all students and students with disabilities, we employed the same procedures as in the past, choosing representative grades to present data for elementary, middle, and high school. For our examination of gaps, we chose grades 4, 8, and 10. If a state did not have data for a grade, we chose one grade below. If that grade was not available, we chose the grade above. Further, we focused on reading and mathematics content areas, consistent with previous analyses. Information on how states reported other content areas is in the appendices.
Results
Characteristics of State Assessment Systems
A list of general state assessments for 2006-2007 is located in Appendix C. It includes all 50 regular states and the 11 unique states, with information on the name of each assessment, grades and content areas assessed, whether the state had publicly available disaggregated participation or performance data for students with disabilities for 2006-2007, and whether the results of each assessment are used for NCLB purposes.
We identified 106 statewide assessments for the 50 regular states for 2006-2007. Of the 11 states that indicated they had administered a norm-referenced test (NRT), five states used the ITBS (Arkansas, Iowa, Montana, Nevada, and Utah), three states used TerraNova/Cat/6 (Alaska, Ari-zona, and California), two used the SAT 10 (Alabama and Florida), and two states used other less common assessments such as EXPLORE, PLAN (Kentucky) and Direct Writing Assess-ment (DWA) (Utah). Nine other states used NRTs augmented with criterion referenced items (Arizona, Delaware, Florida, Indiana, Louisiana, Maine, Missouri, North Dakota, and South Dakota). All other assessments were EXIT and criterion-referenced tests (CRTs) unique to each state, except for a few that were used commonly across a small group of states such as the NECAP assessment used by three states (New Hampshire, Rhode Island, and Vermont). Utah administered five state assessments in 2006-2007, which was the highest number of any state.
In addition to the 50 regular states, we also included the 11 unique states. For these 11, we had specific names for 9 state assessments. The Stanford Achievement Test (SAT-9 or SAT-10) was used by four states (American Samoa, Commonwealth of the Northern Mariana Islands, District of Columbia, and Guam). Although the unique states predominantly used NRTs, some also indicated CRTs. Only one unique state (Commonwealth of the Northern Mariana Islands) used more than one regular assessment, employing both an NRT and a CRT. For the Bureau of
4 NCEO
Indian Education, students participate in assessments in their state of residence and thus should be included in the reporting systems in the state in which they reside.
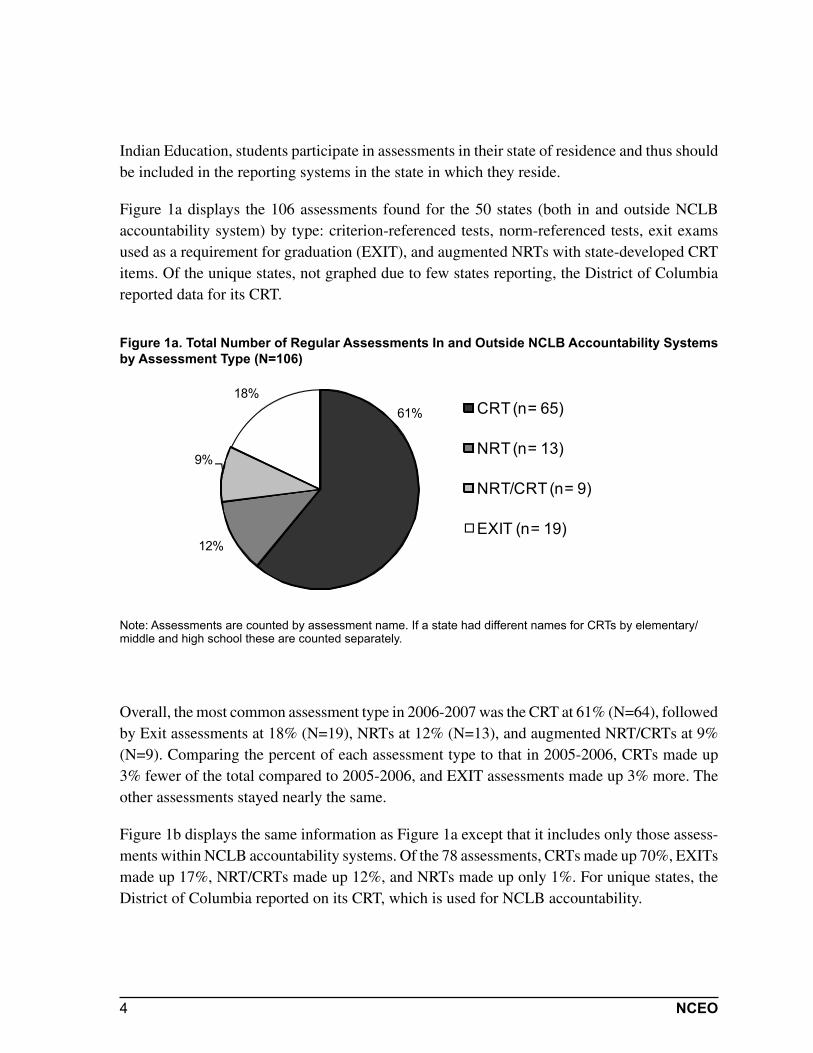
Figure 1a displays the 106 assessments found for the 50 states (both in and outside NCLB accountability system) by type: criterion-referenced tests, norm-referenced tests, exit exams used as a requirement for graduation (EXIT), and augmented NRTs with state-developed CRT items. Of the unique states, not graphed due to few states reporting, the District of Columbia reported data for its CRT.
Figure 1a. Total Number of Regular Assessments In and Outside NCLB Accountability Systems by Assessment Type (N=106)
61%
12%
9%
18%CRT (n= 65)
NRT (n= 13)
NRT/CRT (n= 9)
EXIT (n= 19)
Note: Assessments are counted by assessment name. If a state had different names for CRTs by elementary/middle and high school these are counted separately.
Overall, the most common assessment type in 2006-2007 was the CRT at 61% (N=64), followed by Exit assessments at 18% (N=19), NRTs at 12% (N=13), and augmented NRT/CRTs at 9% (N=9). Comparing the percent of each assessment type to that in 2005-2006, CRTs made up 3% fewer of the total compared to 2005-2006, and EXIT assessments made up 3% more. The other assessments stayed nearly the same.
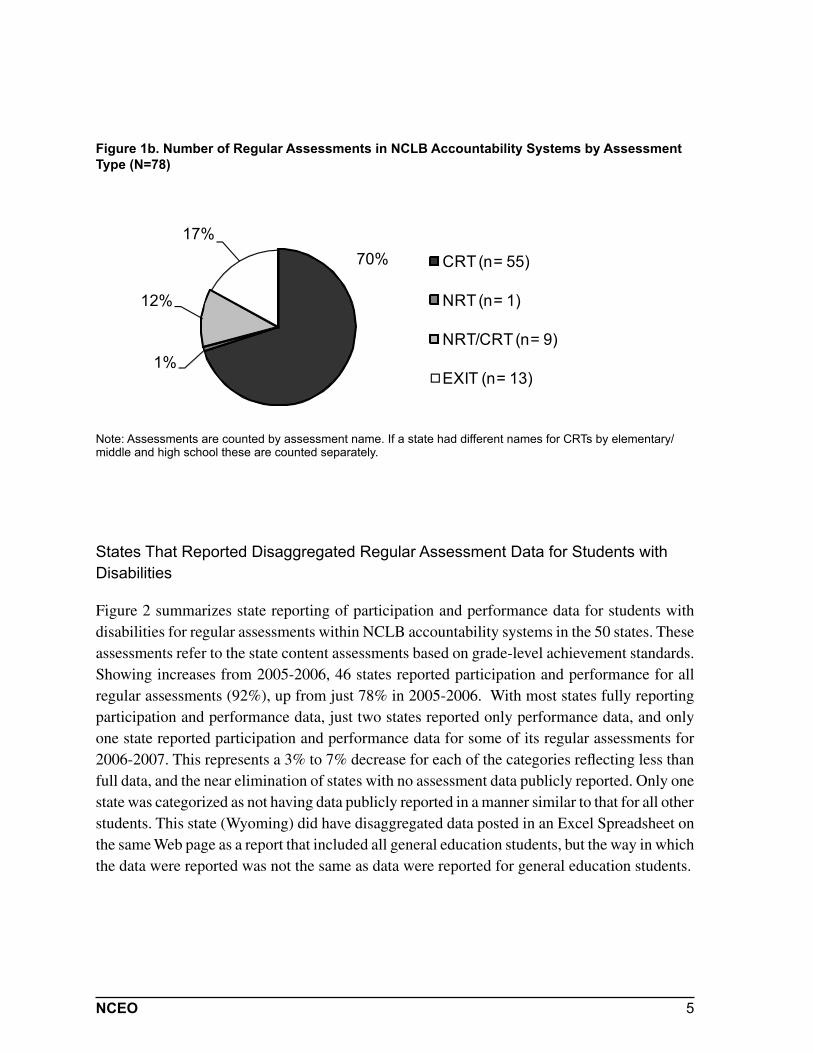
Figure 1b displays the same information as Figure 1a except that it includes only those assess-ments within NCLB accountability systems. Of the 78 assessments, CRTs made up 70%, EXITs made up 17%, NRT/CRTs made up 12%, and NRTs made up only 1%. For unique states, the District of Columbia reported on its CRT, which is used for NCLB accountability.
5NCEO
Figure 1b. Number of Regular Assessments in NCLB Accountability Systems by Assessment Type (N=78)
70%
1%
12%
17%
CRT (n= 55)
NRT (n= 1)
NRT/CRT (n= 9)
EXIT (n= 13)
Note: Assessments are counted by assessment name. If a state had different names for CRTs by elementary/middle and high school these are counted separately.
States That Reported Disaggregated Regular Assessment Data for Students with Disabilities
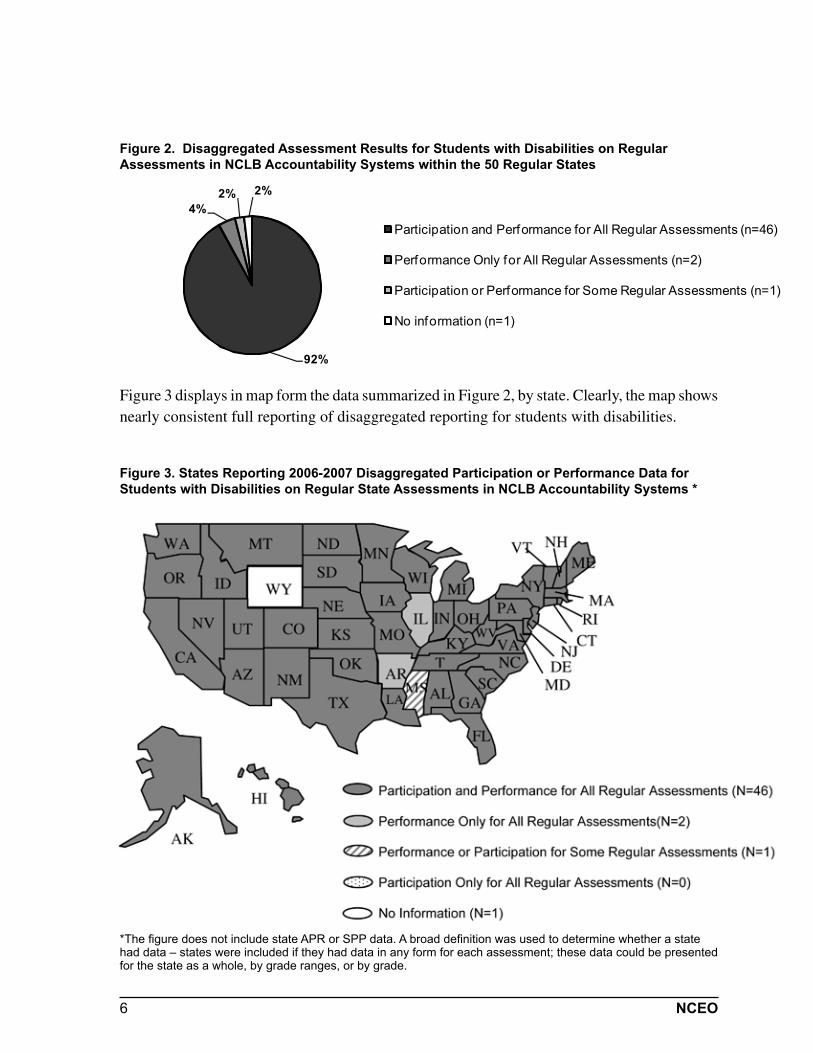
Figure 2 summarizes state reporting of participation and performance data for students with disabilities for regular assessments within NCLB accountability systems in the 50 states. These assessments refer to the state content assessments based on grade-level achievement standards. Showing increases from 2005-2006, 46 states reported participation and performance for all regular assessments (92%), up from just 78% in 2005-2006. With most states fully reporting participation and performance data, just two states reported only performance data, and only one state reported participation and performance data for some of its regular assessments for 2006-2007. This represents a 3% to 7% decrease for each of the categories reflecting less than full data, and the near elimination of states with no assessment data publicly reported. Only one state was categorized as not having data publicly reported in a manner similar to that for all other students. This state (Wyoming) did have disaggregated data posted in an Excel Spreadsheet on the same Web page as a report that included all general education students, but the way in which the data were reported was not the same as data were reported for general education students.
6 NCEO
Figure 2. Disaggregated Assessment Results for Students with Disabilities on Regular Assessments in NCLB Accountability Systems within the 50 Regular States
92%
4%2% 2%
Participation and Performance for All Regular Assessments (n=46)
Performance Only for All Regular Assessments (n=2)
Participation or Performance for Some Regular Assessments (n=1)
No information (n=1)
Figure 3 displays in map form the data summarized in Figure 2, by state. Clearly, the map shows nearly consistent full reporting of disaggregated reporting for students with disabilities.
Figure 3. States Reporting 2006-2007 Disaggregated Participation or Performance Data for Students with Disabilities on Regular State Assessments in NCLB Accountability Systems *
*The figure does not include state APR or SPP data. A broad definition was used to determine whether a state had data – states were included if they had data in any form for each assessment; these data could be presented for the state as a whole, by grade ranges, or by grade.
7NCEO
Figure 2. Disaggregated Assessment Results for Students with Disabilities on Regular Assessments in NCLB Accountability Systems within the 50 Regular States
92%
4%2% 2%
Participation and Performance for All Regular Assessments (n=46)
Performance Only for All Regular Assessments (n=2)
Participation or Performance for Some Regular Assessments (n=1)
No information (n=1)
Figure 3 displays in map form the data summarized in Figure 2, by state. Clearly, the map shows nearly consistent full reporting of disaggregated reporting for students with disabilities.
Figure 3. States Reporting 2006-2007 Disaggregated Participation or Performance Data for Students with Disabilities on Regular State Assessments in NCLB Accountability Systems *
*The figure does not include state APR or SPP data. A broad definition was used to determine whether a state had data – states were included if they had data in any form for each assessment; these data could be presented for the state as a whole, by grade ranges, or by grade.
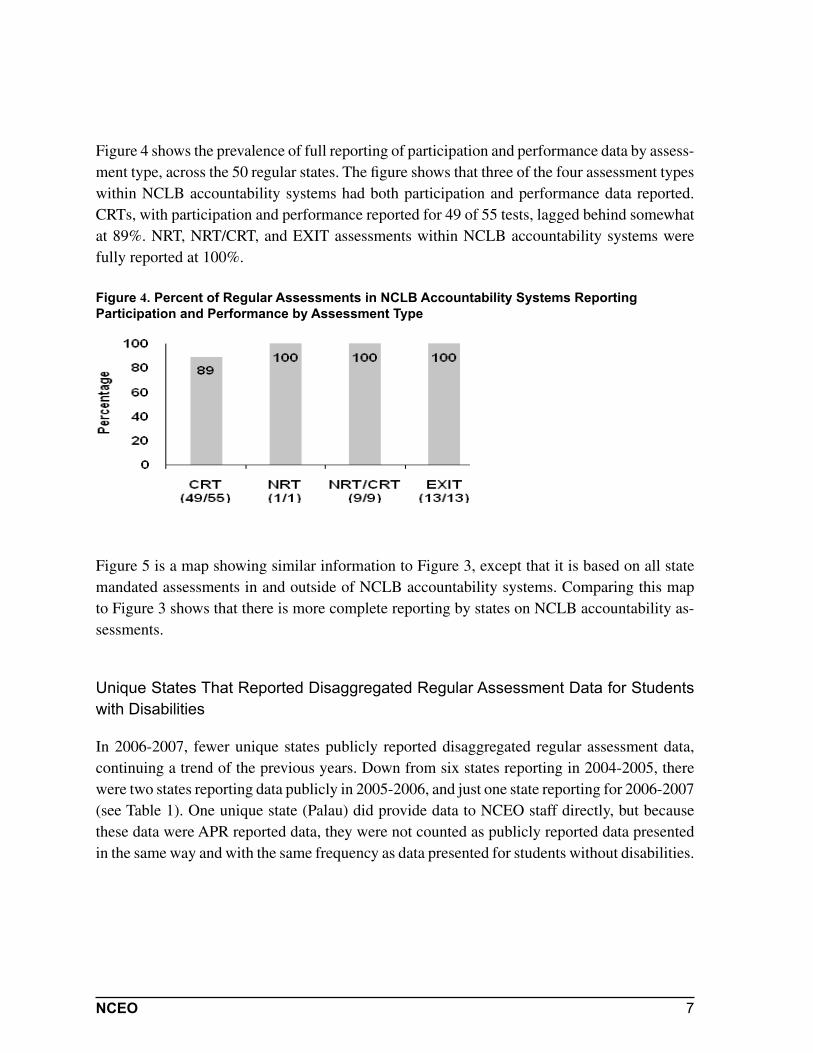
Figure 4 shows the prevalence of full reporting of participation and performance data by assess-ment type, across the 50 regular states. The figure shows that three of the four assessment types within NCLB accountability systems had both participation and performance data reported. CRTs, with participation and performance reported for 49 of 55 tests, lagged behind somewhat at 89%. NRT, NRT/CRT, and EXIT assessments within NCLB accountability systems were fully reported at 100%.
Figure 4. Percent of Regular Assessments in NCLB Accountability Systems Reporting Participation and Performance by Assessment Type
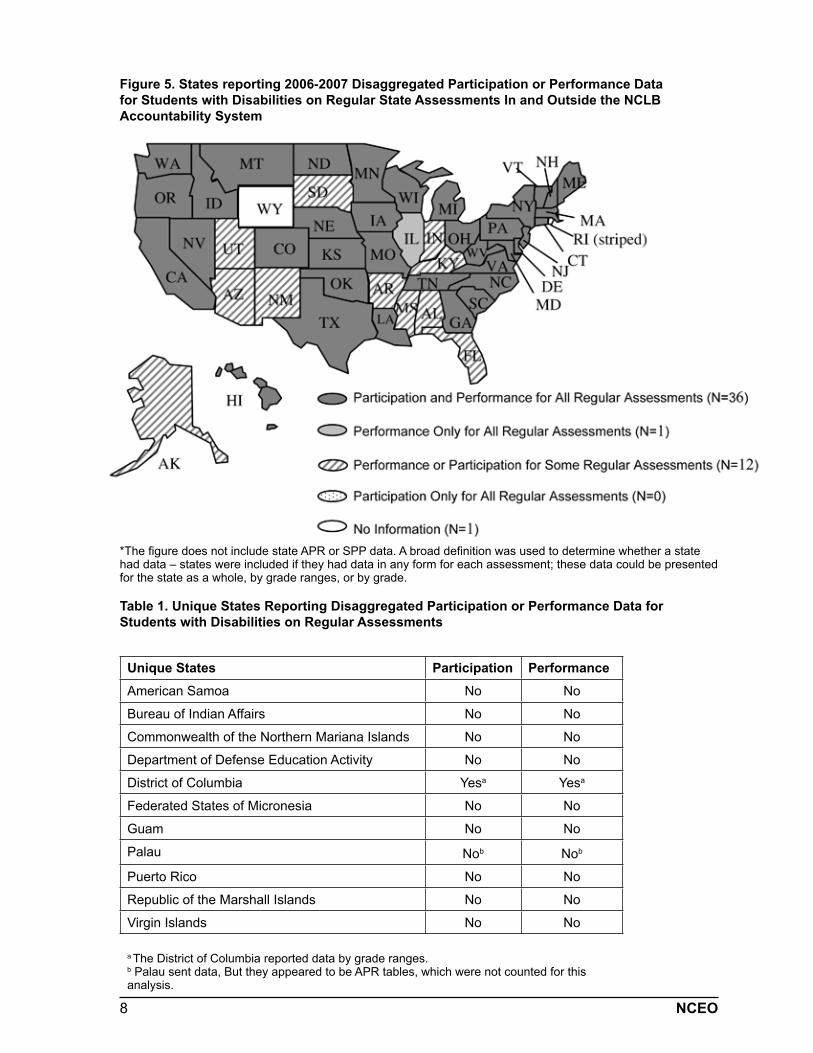
Figure 5 is a map showing similar information to Figure 3, except that it is based on all state mandated assessments in and outside of NCLB accountability systems. Comparing this map to Figure 3 shows that there is more complete reporting by states on NCLB accountability as-sessments.
Unique States That Reported Disaggregated Regular Assessment Data for Students with Disabilities
In 2006-2007, fewer unique states publicly reported disaggregated regular assessment data, continuing a trend of the previous years. Down from six states reporting in 2004-2005, there were two states reporting data publicly in 2005-2006, and just one state reporting for 2006-2007 (see Table 1). One unique state (Palau) did provide data to NCEO staff directly, but because these data were APR reported data, they were not counted as publicly reported data presented in the same way and with the same frequency as data presented for students without disabilities.
8 NCEO
Figure 5. States reporting 2006-2007 Disaggregated Participation or Performance Data for Students with Disabilities on Regular State Assessments In and Outside the NCLB Accountability System
*The figure does not include state APR or SPP data. A broad definition was used to determine whether a state had data – states were included if they had data in any form for each assessment; these data could be presented for the state as a whole, by grade ranges, or by grade.
Table 1. Unique States Reporting Disaggregated Participation or Performance Data for Students with Disabilities on Regular Assessments
Unique States Participation PerformanceAmerican Samoa No No
Bureau of Indian Affairs No No
Commonwealth of the Northern Mariana Islands No No
Department of Defense Education Activity No No
District of Columbia Yesa Yesa
Federated States of Micronesia No No
Guam No No
Palau Nob Nob Puerto Rico No No
Republic of the Marshall Islands No No
Virgin Islands No No
a The District of Columbia reported data by grade ranges.b Palau sent data, But they appeared to be APR tables, which were not counted for this analysis.
9NCEO
States That Reported Disaggregated Alternate Assessment Data for Students with Disabilities
All 50 regular states indicated using at least one alternate assessment based on alternate achieve-ment standards. Some states had additional alternate assessments, including alternate assessments based on modified achievement standards (Kansas, North Carolina, and Oklahoma) and those based on grade level achievement standards (Louisiana, North Carolina, and Virginia). As the criteria for various alternate assessments became clearer, some alternate assessments were re-classified (e.g., Louisiana’s LAA2 alternate was later considered an alternate based on modified achievement standards). One alternate assessment (Washington) was classified as “other” because it was unclear as to what type of achievement standards were used. All alternate assessments, except Washington’s, were categorized as used within NCLB accountability systems. The state with the highest number of alternate assessments was North Carolina (N=4); this is consistent with the findings for 2005-2006. Also, the eight states using two alternate assessments remained the same as for 2005-2006 (Arizona, Kansas, Louisiana, Montana, Oklahoma, Oregon, Virginia, and Washington). All of the remaining 41 states had one alternate assessment.
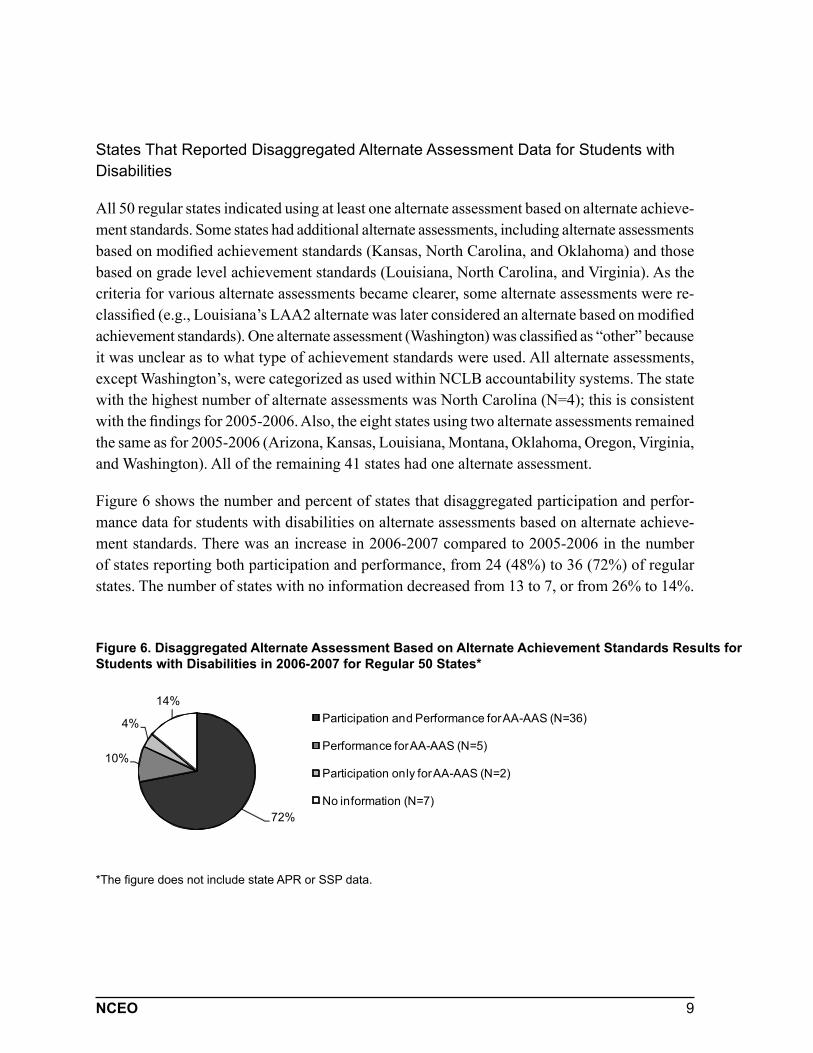
Figure 6 shows the number and percent of states that disaggregated participation and perfor-mance data for students with disabilities on alternate assessments based on alternate achieve-ment standards. There was an increase in 2006-2007 compared to 2005-2006 in the number of states reporting both participation and performance, from 24 (48%) to 36 (72%) of regular states. The number of states with no information decreased from 13 to 7, or from 26% to 14%.
Figure 6. Disaggregated Alternate Assessment Based on Alternate Achievement Standards Results for Students with Disabilities in 2006-2007 for Regular 50 States*
72%
10%
4%
14%Participation and Performance for AA-AAS (N=36)
Performance for AA-AAS (N=5)
Participation only for AA-AAS (N=2)
No information (N=7)
*The figure does not include state APR or SSP data.
10 NCEO
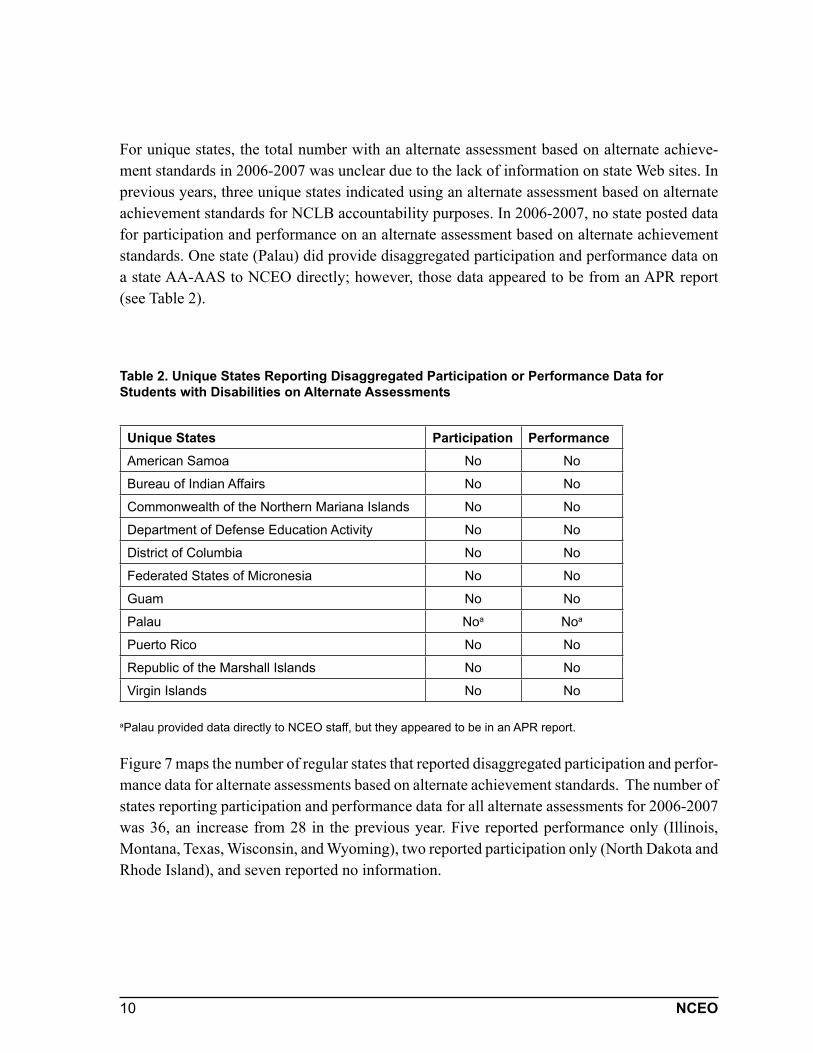
For unique states, the total number with an alternate assessment based on alternate achieve-ment standards in 2006-2007 was unclear due to the lack of information on state Web sites. In previous years, three unique states indicated using an alternate assessment based on alternate achievement standards for NCLB accountability purposes. In 2006-2007, no state posted data for participation and performance on an alternate assessment based on alternate achievement standards. One state (Palau) did provide disaggregated participation and performance data on a state AA-AAS to NCEO directly; however, those data appeared to be from an APR report (see Table 2).
Table 2. Unique States Reporting Disaggregated Participation or Performance Data for Students with Disabilities on Alternate Assessments
Unique States Participation PerformanceAmerican Samoa No No
Bureau of Indian Affairs No No
Commonwealth of the Northern Mariana Islands No No
Department of Defense Education Activity No No
District of Columbia No No
Federated States of Micronesia No No
Guam No No
Palau Noa Noa
Puerto Rico No No
Republic of the Marshall Islands No No
Virgin Islands No No
aPalau provided data directly to NCEO staff, but they appeared to be in an APR report.
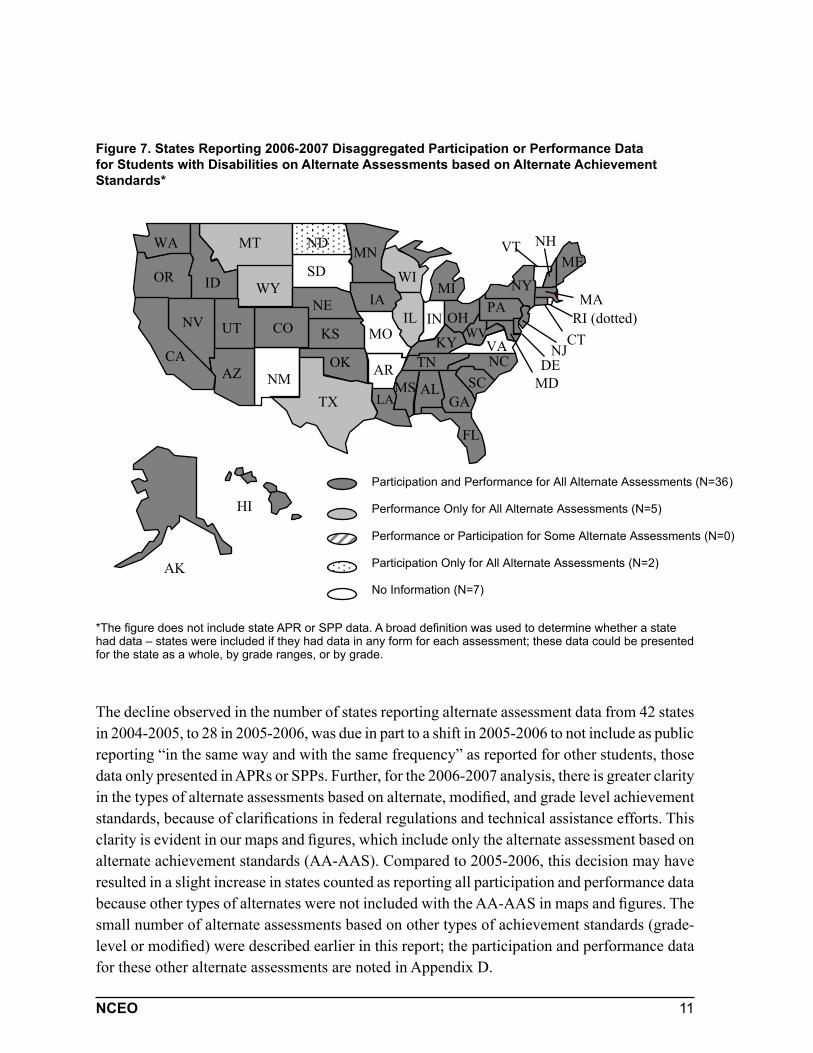
Figure 7 maps the number of regular states that reported disaggregated participation and perfor-mance data for alternate assessments based on alternate achievement standards. The number of states reporting participation and performance data for all alternate assessments for 2006-2007 was 36, an increase from 28 in the previous year. Five reported performance only (Illinois, Montana, Texas, Wisconsin, and Wyoming), two reported participation only (North Dakota and Rhode Island), and seven reported no information.
11NCEO
Figure 7. States Reporting 2006-2007 Disaggregated Participation or Performance Data for Students with Disabilities on Alternate Assessments based on Alternate Achievement Standards*
*The figure does not include state APR or SPP data. A broad definition was used to determine whether a state had data – states were included if they had data in any form for each assessment; these data could be presented for the state as a whole, by grade ranges, or by grade.
The decline observed in the number of states reporting alternate assessment data from 42 states in 2004-2005, to 28 in 2005-2006, was due in part to a shift in 2005-2006 to not include as public reporting “in the same way and with the same frequency” as reported for other students, those data only presented in APRs or SPPs. Further, for the 2006-2007 analysis, there is greater clarity in the types of alternate assessments based on alternate, modified, and grade level achievement standards, because of clarifications in federal regulations and technical assistance efforts. This clarity is evident in our maps and figures, which include only the alternate assessment based on alternate achievement standards (AA-AAS). Compared to 2005-2006, this decision may have resulted in a slight increase in states counted as reporting all participation and performance data because other types of alternates were not included with the AA-AAS in maps and figures. The small number of alternate assessments based on other types of achievement standards (grade-level or modified) were described earlier in this report; the participation and performance data for these other alternate assessments are noted in Appendix D.
[Figure 7]
WA MT ND
OR
NV
CA
ID WY
UT
AZ
CO
NM
SD
NE
KS
TX
OK
MN
IA
MO
AR
LA
WI
IL
MI
OH
KY
MS
TN
FL
GA SC
NC VA
PA NY
ME
WV
AK
HI
VT NH
CT NJ
DE
IN MA
RI (dotted)
AL MD
Participation and Performance for All Alternate Assessments (N=36)
Performance Only for All Alternate Assessments (N=5)
Performance or Participation for Some Alternate Assessments (N=0)
Participation Only for All Alternate Assessments (N=2)
No Information (N=7)
12 NCEO
None of the 11 unique states reported data on an alternate assessment. As mentioned previously, Palau did send participation and performance data to NCEO staff directly, but these data ap-peared to be from an APR, and was not a document prepared for the public.
Communicating Participation in 2006-2007
Regular Assessment Participation Approaches and Select Results
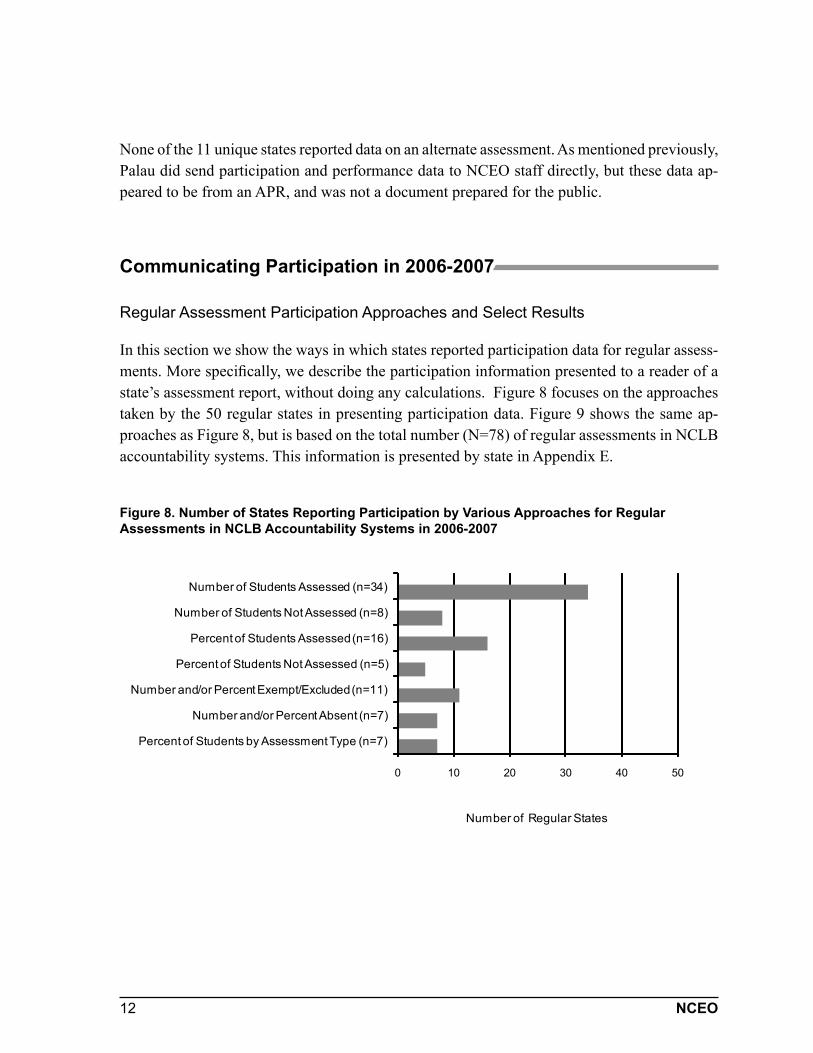
In this section we show the ways in which states reported participation data for regular assess-ments. More specifically, we describe the participation information presented to a reader of a state’s assessment report, without doing any calculations. Figure 8 focuses on the approaches taken by the 50 regular states in presenting participation data. Figure 9 shows the same ap-proaches as Figure 8, but is based on the total number (N=78) of regular assessments in NCLB accountability systems. This information is presented by state in Appendix E.
Figure 8. Number of States Reporting Participation by Various Approaches for Regular Assessments in NCLB Accountability Systems in 2006-2007
0 10 20 30 40 50
Percent of Students by Assessment Type (n=7)
Number and/or Percent Absent (n=7)
Number and/or Percent Exempt/Excluded (n=11)
Percent of Students Not Assessed (n=5)
Percent of Students Assessed (n=16)
Number of Students Not Assessed (n=8)
Number of Students Assessed (n=34)
Number of Regular States
13NCEO
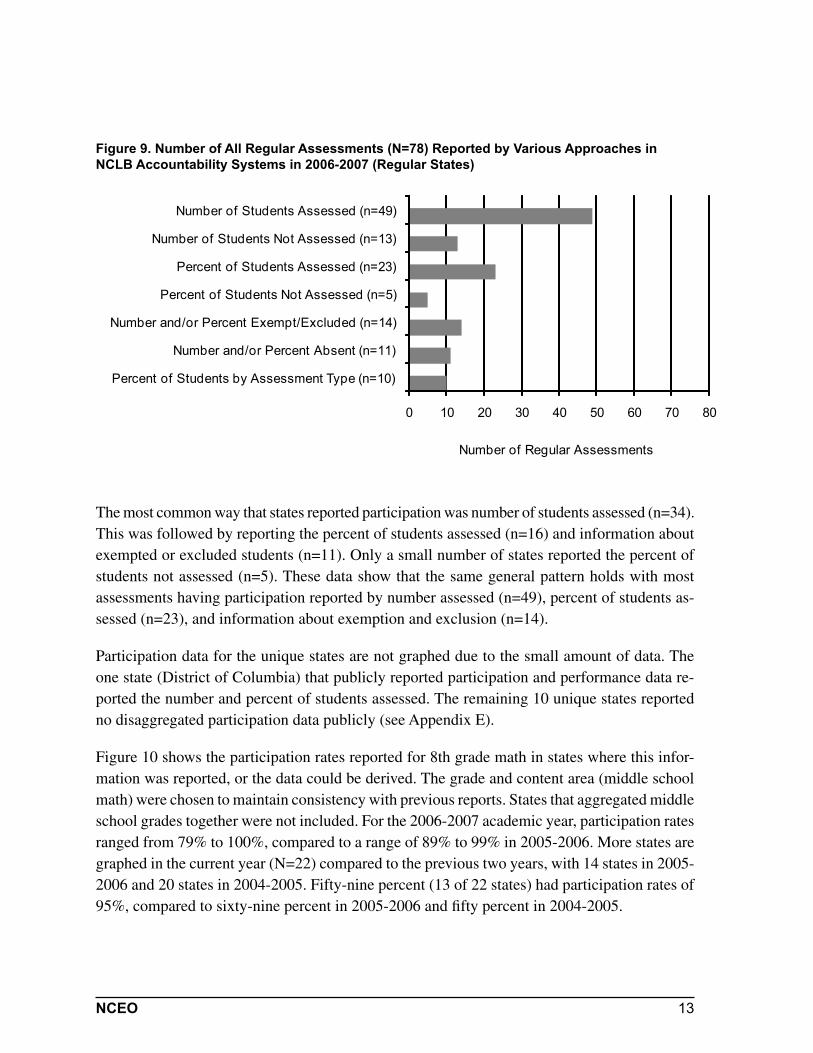
Figure 9. Number of All Regular Assessments (N=78) Reported by Various Approaches in NCLB Accountability Systems in 2006-2007 (Regular States)
0 10 20 30 40 50 60 70 80
Percent of Students by Assessment Type (n=10)
Number and/or Percent Absent (n=11)
Number and/or Percent Exempt/Excluded (n=14)
Percent of Students Not Assessed (n=5)
Percent of Students Assessed (n=23)
Number of Students Not Assessed (n=13)
Number of Students Assessed (n=49)
Number of Regular Assessments
The most common way that states reported participation was number of students assessed (n=34). This was followed by reporting the percent of students assessed (n=16) and information about exempted or excluded students (n=11). Only a small number of states reported the percent of students not assessed (n=5). These data show that the same general pattern holds with most assessments having participation reported by number assessed (n=49), percent of students as-sessed (n=23), and information about exemption and exclusion (n=14).
Participation data for the unique states are not graphed due to the small amount of data. The one state (District of Columbia) that publicly reported participation and performance data re-ported the number and percent of students assessed. The remaining 10 unique states reported no disaggregated participation data publicly (see Appendix E).
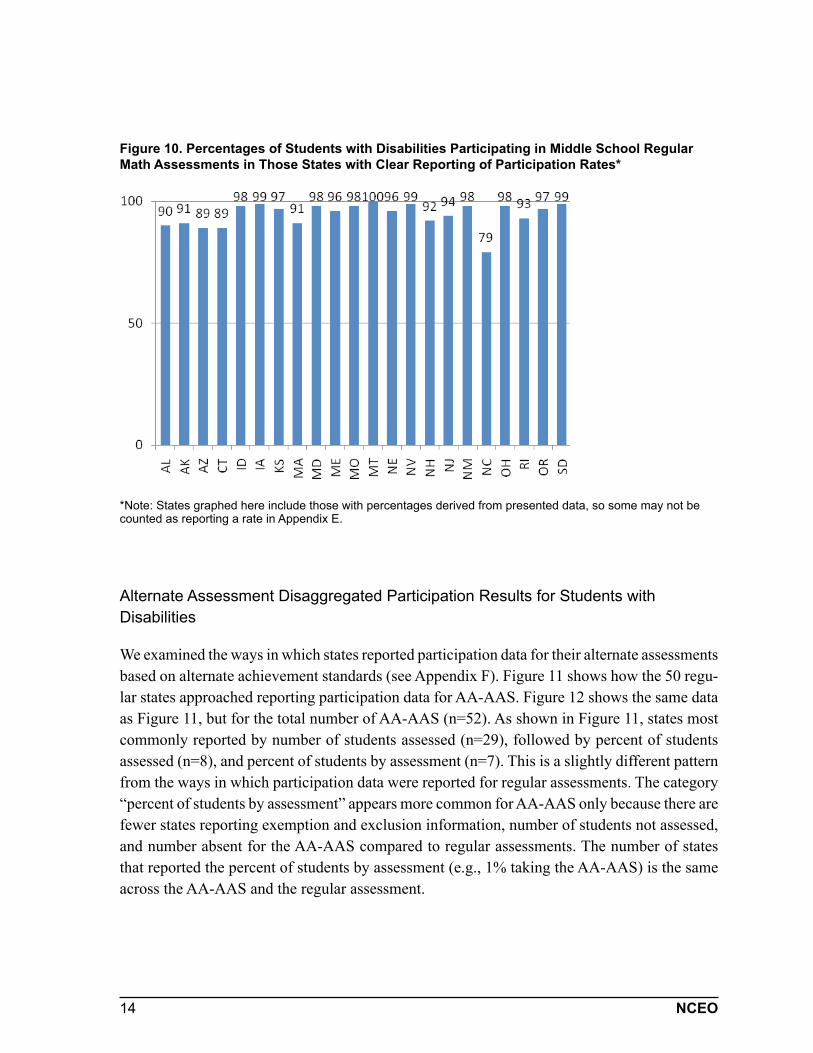
Figure 10 shows the participation rates reported for 8th grade math in states where this infor-mation was reported, or the data could be derived. The grade and content area (middle school math) were chosen to maintain consistency with previous reports. States that aggregated middle school grades together were not included. For the 2006-2007 academic year, participation rates ranged from 79% to 100%, compared to a range of 89% to 99% in 2005-2006. More states are graphed in the current year (N=22) compared to the previous two years, with 14 states in 2005-2006 and 20 states in 2004-2005. Fifty-nine percent (13 of 22 states) had participation rates of 95%, compared to sixty-nine percent in 2005-2006 and fifty percent in 2004-2005.
14 NCEO
Figure 10. Percentages of Students with Disabilities Participating in Middle School Regular Math Assessments in Those States with Clear Reporting of Participation Rates*
*Note: States graphed here include those with percentages derived from presented data, so some may not be counted as reporting a rate in Appendix E.
Alternate Assessment Disaggregated Participation Results for Students with Disabilities
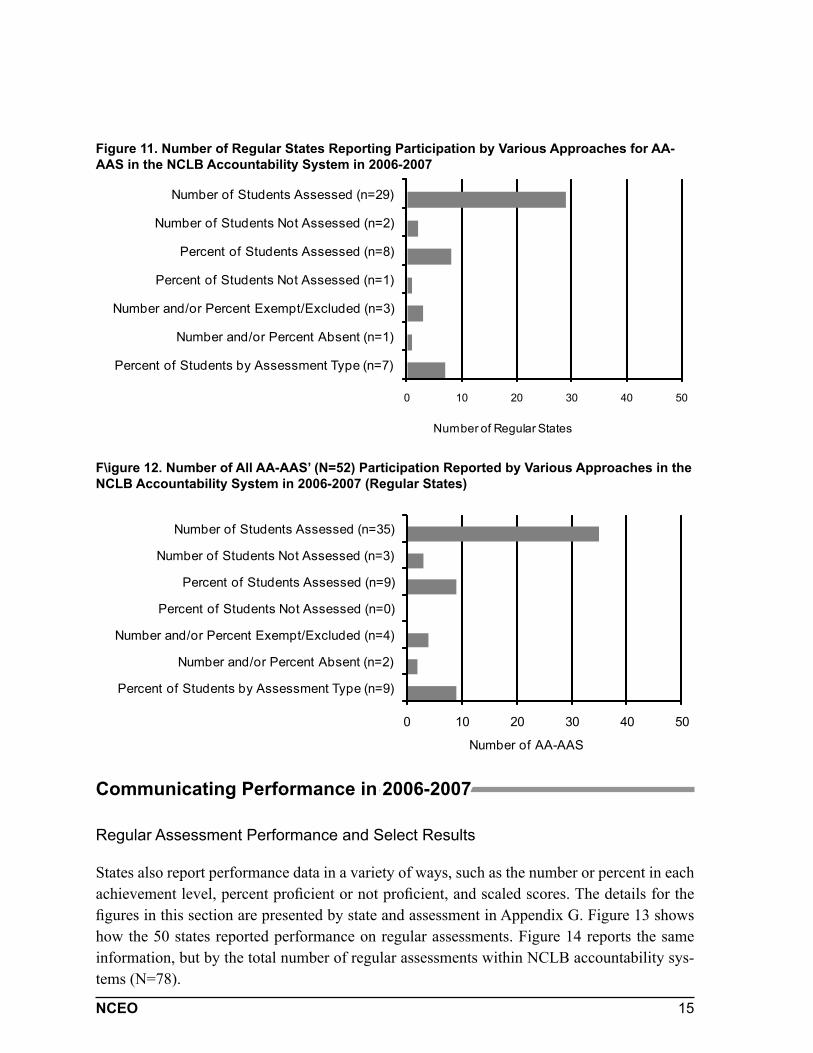
We examined the ways in which states reported participation data for their alternate assessments based on alternate achievement standards (see Appendix F). Figure 11 shows how the 50 regu-lar states approached reporting participation data for AA-AAS. Figure 12 shows the same data as Figure 11, but for the total number of AA-AAS (n=52). As shown in Figure 11, states most commonly reported by number of students assessed (n=29), followed by percent of students assessed (n=8), and percent of students by assessment (n=7). This is a slightly different pattern from the ways in which participation data were reported for regular assessments. The category “percent of students by assessment” appears more common for AA-AAS only because there are fewer states reporting exemption and exclusion information, number of students not assessed, and number absent for the AA-AAS compared to regular assessments. The number of states that reported the percent of students by assessment (e.g., 1% taking the AA-AAS) is the same across the AA-AAS and the regular assessment.
15NCEO
Figure 11. Number of Regular States Reporting Participation by Various Approaches for AA-AAS in the NCLB Accountability System in 2006-2007
0 10 20 30 40 50
Percent of Students by Assessment Type (n=7)
Number and/or Percent Absent (n=1)
Number and/or Percent Exempt/Excluded (n=3)
Percent of Students Not Assessed (n=1)
Percent of Students Assessed (n=8)
Number of Students Not Assessed (n=2)
Number of Students Assessed (n=29)
Number of Regular States
F\igure 12. Number of All AA-AAS’ (N=52) Participation Reported by Various Approaches in the NCLB Accountability System in 2006-2007 (Regular States)
0 10 20 30 40 50
Percent of Students by Assessment Type (n=9)
Number and/or Percent Absent (n=2)
Number and/or Percent Exempt/Excluded (n=4)
Percent of Students Not Assessed (n=0)
Percent of Students Assessed (n=9)
Number of Students Not Assessed (n=3)
Number of Students Assessed (n=35)
Number of AA-AAS
Communicating Performance in 2006-2007
Regular Assessment Performance and Select Results
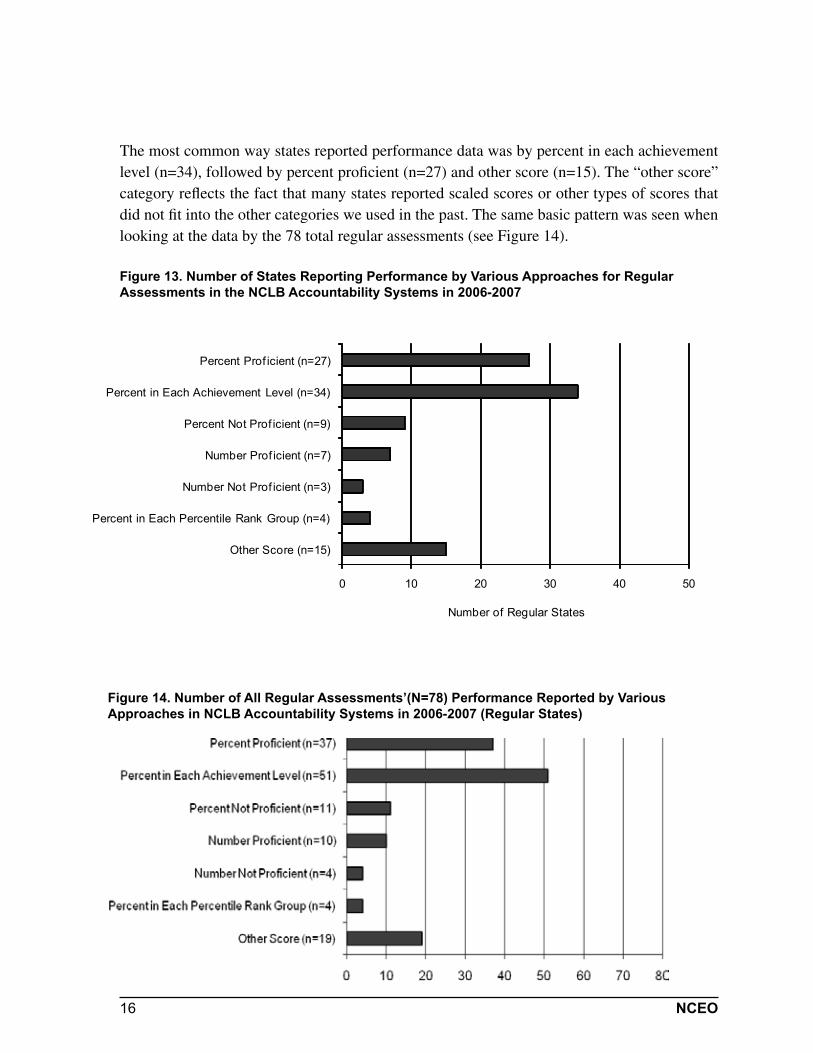
States also report performance data in a variety of ways, such as the number or percent in each achievement level, percent proficient or not proficient, and scaled scores. The details for the figures in this section are presented by state and assessment in Appendix G. Figure 13 shows how the 50 states reported performance on regular assessments. Figure 14 reports the same information, but by the total number of regular assessments within NCLB accountability sys-tems (N=78).
16 NCEO
The most common way states reported performance data was by percent in each achievement level (n=34), followed by percent proficient (n=27) and other score (n=15). The “other score” category reflects the fact that many states reported scaled scores or other types of scores that did not fit into the other categories we used in the past. The same basic pattern was seen when looking at the data by the 78 total regular assessments (see Figure 14).
Figure 13. Number of States Reporting Performance by Various Approaches for Regular Assessments in the NCLB Accountability Systems in 2006-2007
0 10 20 30 40 50
Other Score (n=15)
Percent in Each Percentile Rank Group (n=4)
Number Not Prof icient (n=3)
Number Prof icient (n=7)
Percent Not Prof icient (n=9)
Percent in Each Achievement Level (n=34)
Percent Prof icient (n=27)
Number of Regular States
Figure 14. Number of All Regular Assessments’(N=78) Performance Reported by Various Approaches in NCLB Accountability Systems in 2006-2007 (Regular States)
17NCEO
Selected Disaggregated Results of Regular Assessment Performance
This section compares the performance of general education students and students with disabilities for those states reporting disaggregated data. It is important to keep in mind that each state determines the specific content of its assessments and establishes its own proficiency levels. Thus it is unwise to compare proficiency rates focusing on individual states, or to similarly compare gaps between general education versus special education across states. Regular assessments in this section include predominantly state CRTs, though Exit assessments were also used when states had no other assessment for 10th grade for NCLB accountability. One state, Iowa, used an NRT.
As noted in the method, the comparison group of general education students may include all students assessed or all students without disabilities assessed, due to the variety in how states report. This can influence how gap comparisons are interpreted, slightly, depending on the percentage of students with disabilities in the assessment.
Reading Performance
For 2006-07 we note that more states had data available for gap analyses than in 2005-06. Figures 15-17 show the reading performance of students by state for those reporting data in 2006-07. As in previous years, the performance of students with disabilities in reading was considerably lower in most states than the performance of general education students. However, there are smaller average gaps between the two groups for the data sets available in 2006-2007 compared to 2005-2006 at each representative grade level in both Reading and Math (Table 3a). Similarly, the data set for the current year showed slightly more states with gaps of 25 points or less in both Reading and Math (Table 3b).
18 NCEO
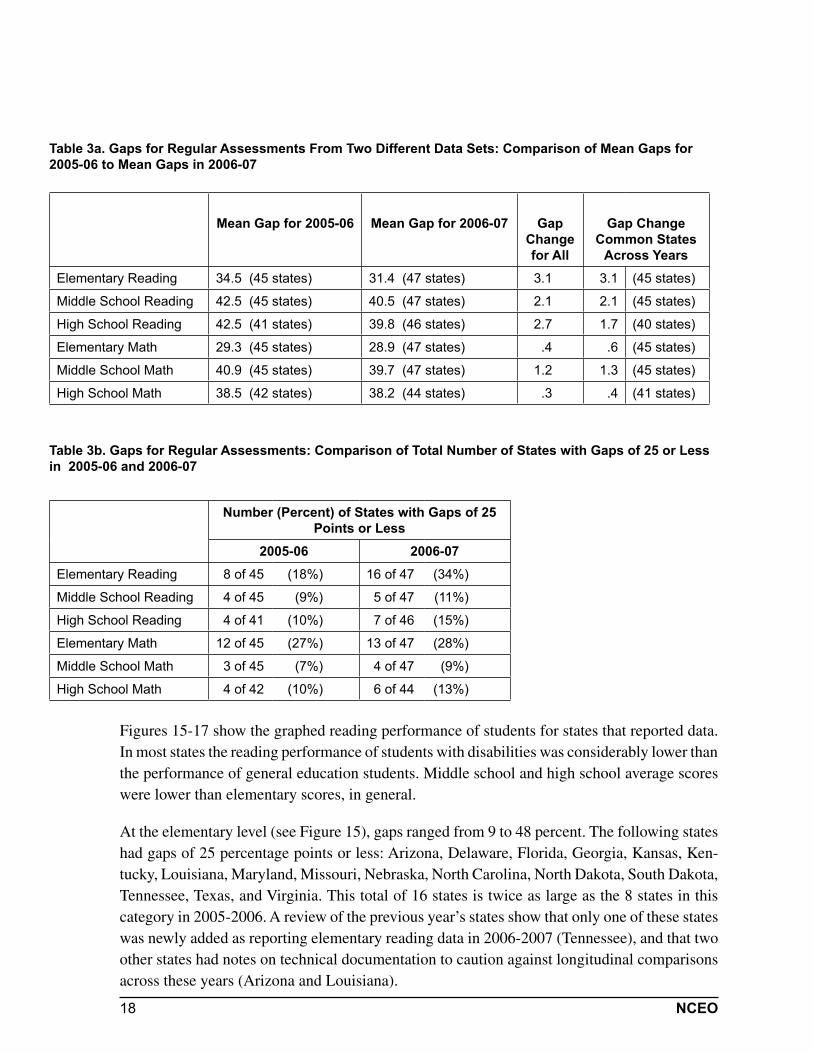
Table 3a. Gaps for Regular Assessments From Two Different Data Sets: Comparison of Mean Gaps for 2005-06 to Mean Gaps in 2006-07
Mean Gap for 2005-06 Mean Gap for 2006-07 Gap Change for All
Gap Change Common States
Across YearsElementary Reading 34.5 (45 states) 31.4 (47 states) 3.1 3.1 (45 states)
Middle School Reading 42.5 (45 states) 40.5 (47 states) 2.1 2.1 (45 states)
High School Reading 42.5 (41 states) 39.8 (46 states) 2.7 1.7 (40 states)
Elementary Math 29.3 (45 states) 28.9 (47 states) .4 .6 (45 states)
Middle School Math 40.9 (45 states) 39.7 (47 states) 1.2 1.3 (45 states)
High School Math 38.5 (42 states) 38.2 (44 states) .3 .4 (41 states)
Table 3b. Gaps for Regular Assessments: Comparison of Total Number of States with Gaps of 25 or Less in 2005-06 and 2006-07
Number (Percent) of States with Gaps of 25 Points or Less
2005-06 2006-07Elementary Reading 8 of 45 (18%) 16 of 47 (34%)
Middle School Reading 4 of 45 (9%) 5 of 47 (11%)
High School Reading 4 of 41 (10%) 7 of 46 (15%)
Elementary Math 12 of 45 (27%) 13 of 47 (28%)
Middle School Math 3 of 45 (7%) 4 of 47 (9%)
High School Math 4 of 42 (10%) 6 of 44 (13%)
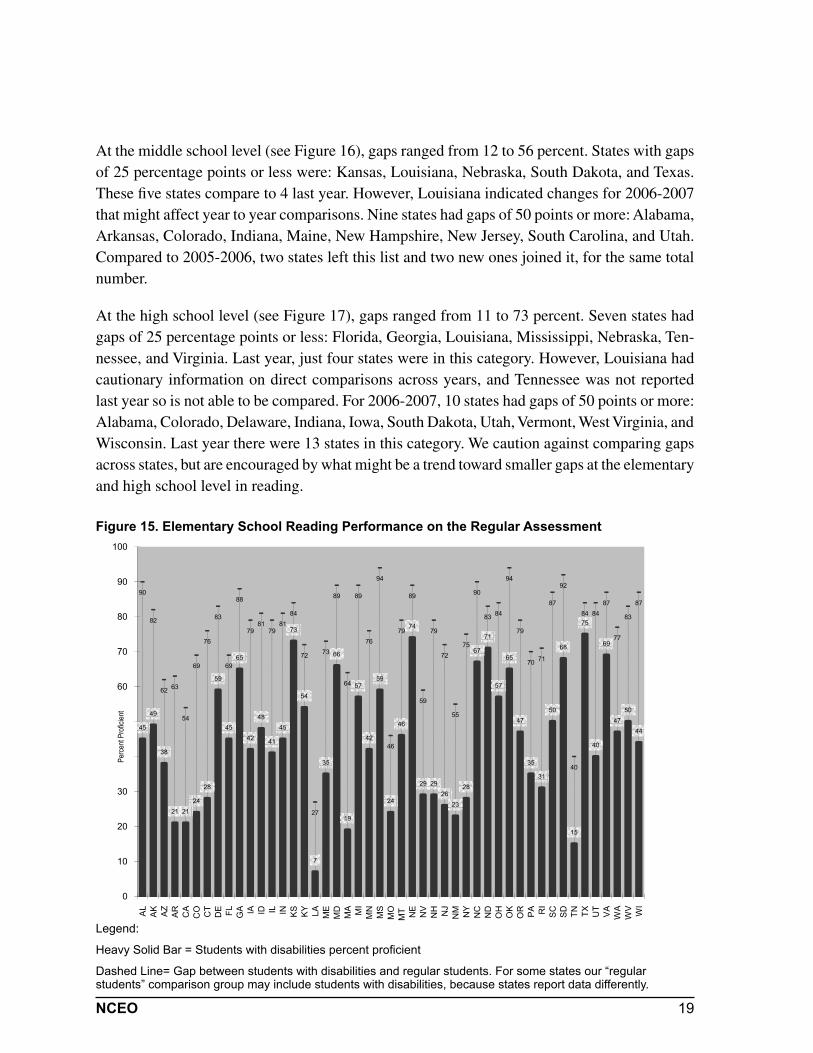
Figures 15-17 show the graphed reading performance of students for states that reported data. In most states the reading performance of students with disabilities was considerably lower than the performance of general education students. Middle school and high school average scores were lower than elementary scores, in general.
At the elementary level (see Figure 15), gaps ranged from 9 to 48 percent. The following states had gaps of 25 percentage points or less: Arizona, Delaware, Florida, Georgia, Kansas, Ken-tucky, Louisiana, Maryland, Missouri, Nebraska, North Carolina, North Dakota, South Dakota, Tennessee, Texas, and Virginia. This total of 16 states is twice as large as the 8 states in this category in 2005-2006. A review of the previous year’s states show that only one of these states was newly added as reporting elementary reading data in 2006-2007 (Tennessee), and that two other states had notes on technical documentation to caution against longitudinal comparisons across these years (Arizona and Louisiana).
19NCEO
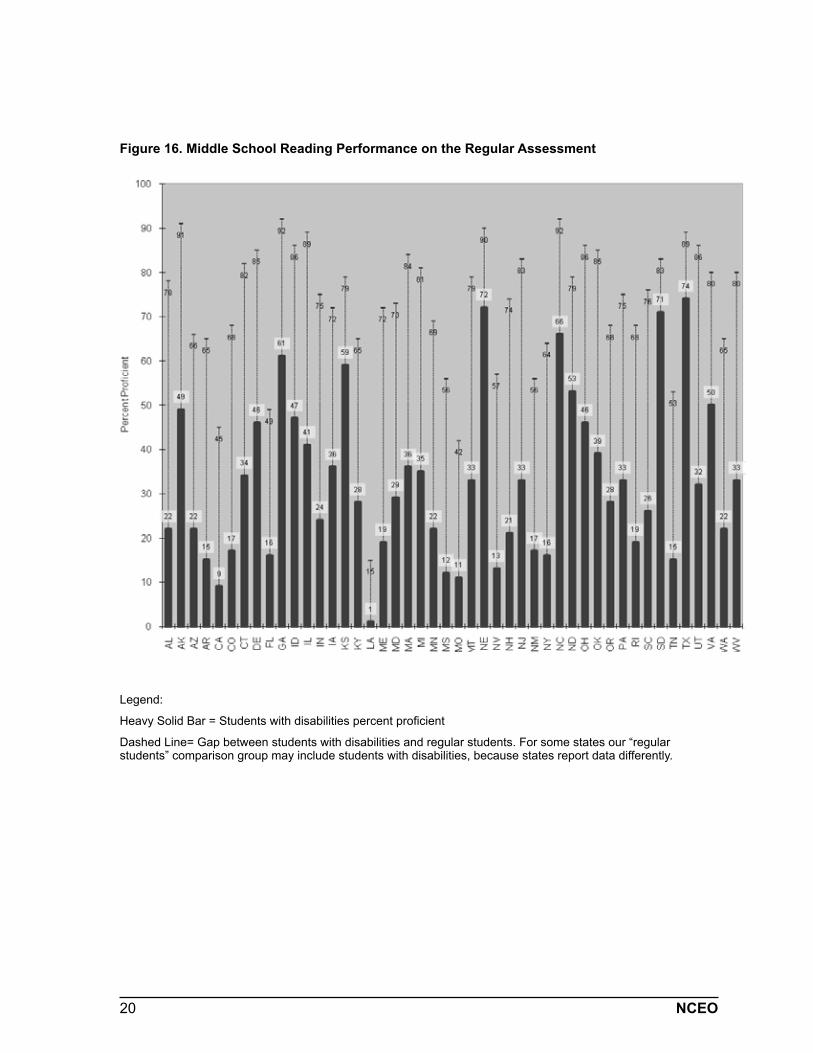
At the middle school level (see Figure 16), gaps ranged from 12 to 56 percent. States with gaps of 25 percentage points or less were: Kansas, Louisiana, Nebraska, South Dakota, and Texas. These five states compare to 4 last year. However, Louisiana indicated changes for 2006-2007 that might affect year to year comparisons. Nine states had gaps of 50 points or more: Alabama, Arkansas, Colorado, Indiana, Maine, New Hampshire, New Jersey, South Carolina, and Utah. Compared to 2005-2006, two states left this list and two new ones joined it, for the same total number.
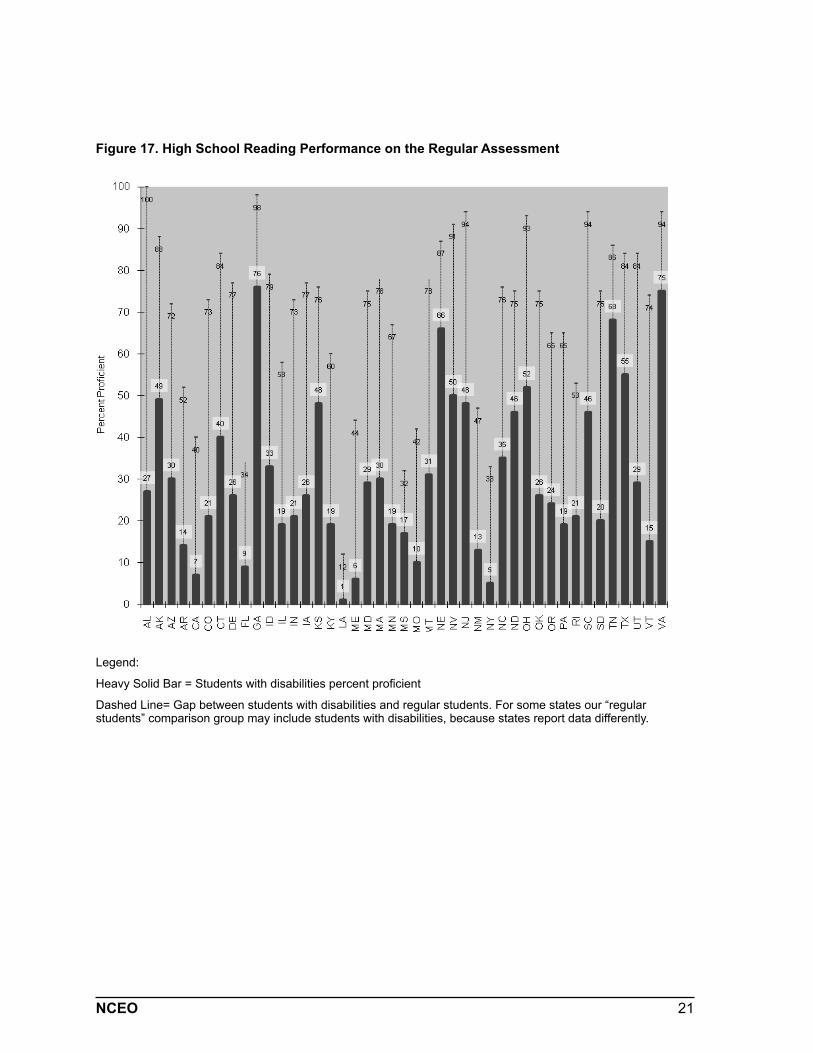
At the high school level (see Figure 17), gaps ranged from 11 to 73 percent. Seven states had gaps of 25 percentage points or less: Florida, Georgia, Louisiana, Mississippi, Nebraska, Ten-nessee, and Virginia. Last year, just four states were in this category. However, Louisiana had cautionary information on direct comparisons across years, and Tennessee was not reported last year so is not able to be compared. For 2006-2007, 10 states had gaps of 50 points or more: Alabama, Colorado, Delaware, Indiana, Iowa, South Dakota, Utah, Vermont, West Virginia, and Wisconsin. Last year there were 13 states in this category. We caution against comparing gaps across states, but are encouraged by what might be a trend toward smaller gaps at the elementary and high school level in reading.
Figure 15. Elementary School Reading Performance on the Regular Assessment
Legend:
Heavy Solid Bar = Students with disabilities percent proficient
Dashed Line= Gap between students with disabilities and regular students. For some states our “regular students” comparison group may include students with disabilities, because states report data differently.
10
Figure 15 Elementary School Reading Performance on the Regular Assessment
Legend: Heavy Solid Bar = Students with Disabilities
Light Bar = May be Students without Disabilities or Total Students
90
82
62 63
54
69
76
83
69
88
7981
7981
84
72
27
73
89
64
89
76
94
46
79
89
59
79
72
55
75
90
83 84
94
79
70 71
87
92
40
84 8487
77
83
87
45
49
38
21 2124
28
59
45
65
42
48
41
45
73
54
7
35
66
19
57
42
59
24
46
74
29 2926
23
28
67
71
57
65
47
35
31
50
68
15
75
40
69
4750
44
0
10
20
30
40
50
60
70
80
90
100
AL
AK AZ
AR
CA
CO CT
DE FL GA IA ID IL IN KS KY LA ME
MD
MA MI
MN
MS
MO
MT NE
NV
NH NJ
NM NY
NC
ND
OH
OK
OR PA RI
SC
SD TN TX UT
VA
WA
WV WI
Per
cent
Pro
ficie
ntPe
rcent
Profi
cient
20 NCEO
Figure 16. Middle School Reading Performance on the Regular Assessment
Legend:
Heavy Solid Bar = Students with disabilities percent proficient
Dashed Line= Gap between students with disabilities and regular students. For some states our “regular students” comparison group may include students with disabilities, because states report data differently.
21NCEO
Figure 17. High School Reading Performance on the Regular Assessment
Legend:
Heavy Solid Bar = Students with disabilities percent proficient
Dashed Line= Gap between students with disabilities and regular students. For some states our “regular students” comparison group may include students with disabilities, because states report data differently.
22 NCEO
Mathematics Performance
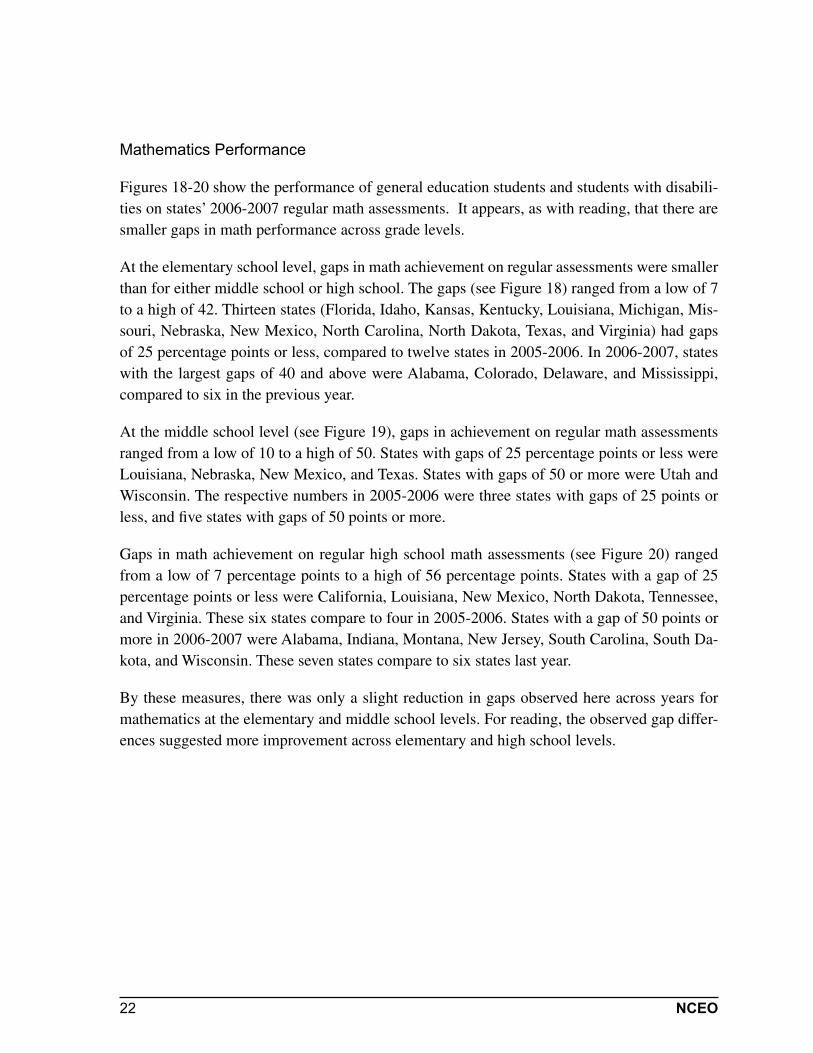
Figures 18-20 show the performance of general education students and students with disabili-ties on states’ 2006-2007 regular math assessments. It appears, as with reading, that there are smaller gaps in math performance across grade levels.
At the elementary school level, gaps in math achievement on regular assessments were smaller than for either middle school or high school. The gaps (see Figure 18) ranged from a low of 7 to a high of 42. Thirteen states (Florida, Idaho, Kansas, Kentucky, Louisiana, Michigan, Mis-souri, Nebraska, New Mexico, North Carolina, North Dakota, Texas, and Virginia) had gaps of 25 percentage points or less, compared to twelve states in 2005-2006. In 2006-2007, states with the largest gaps of 40 and above were Alabama, Colorado, Delaware, and Mississippi, compared to six in the previous year.
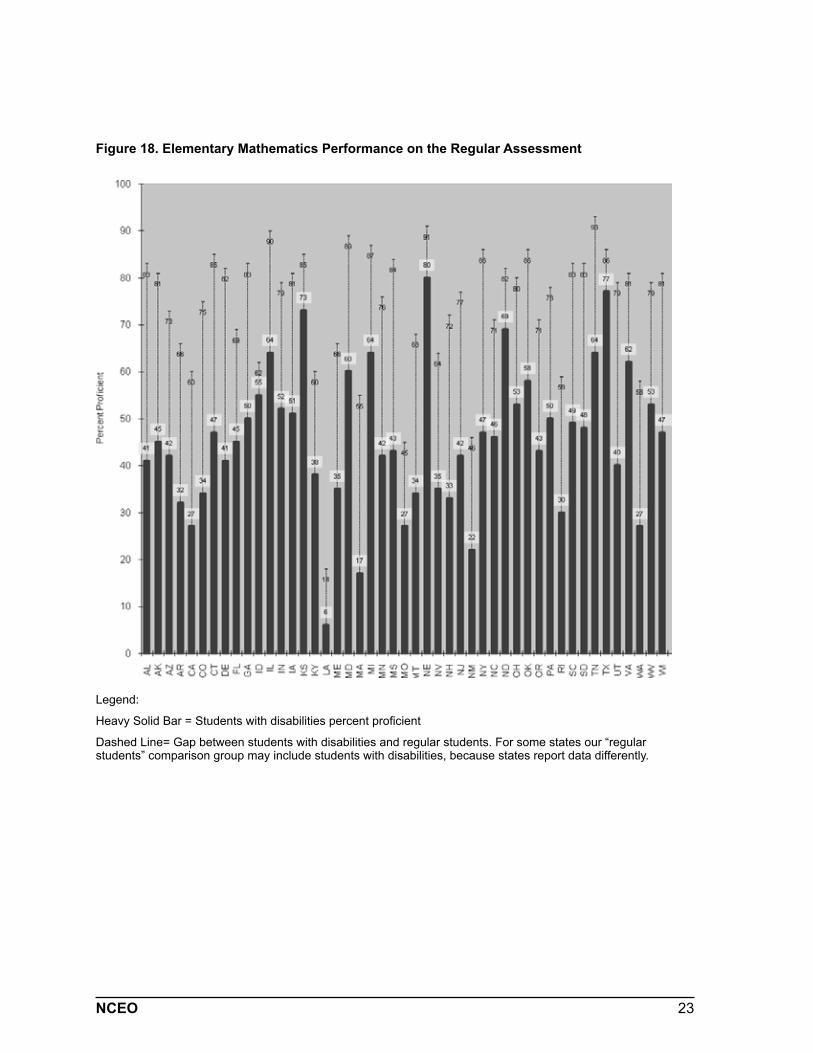
At the middle school level (see Figure 19), gaps in achievement on regular math assessments ranged from a low of 10 to a high of 50. States with gaps of 25 percentage points or less were Louisiana, Nebraska, New Mexico, and Texas. States with gaps of 50 or more were Utah and Wisconsin. The respective numbers in 2005-2006 were three states with gaps of 25 points or less, and five states with gaps of 50 points or more.
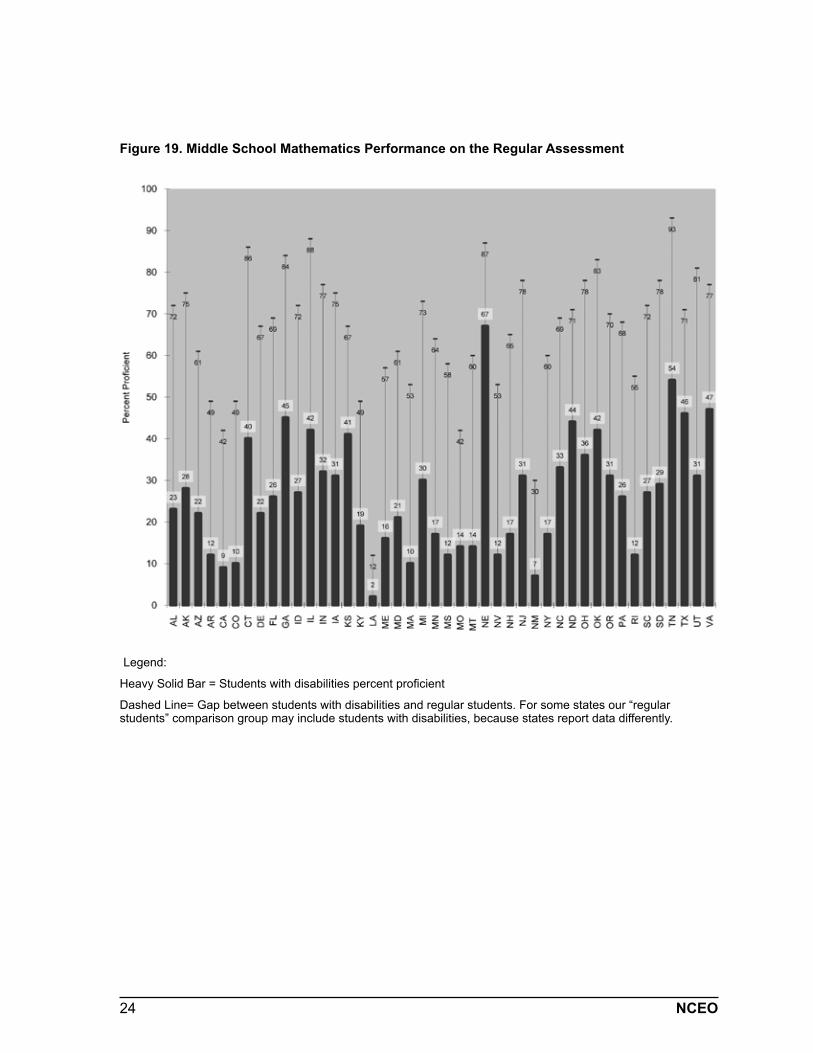
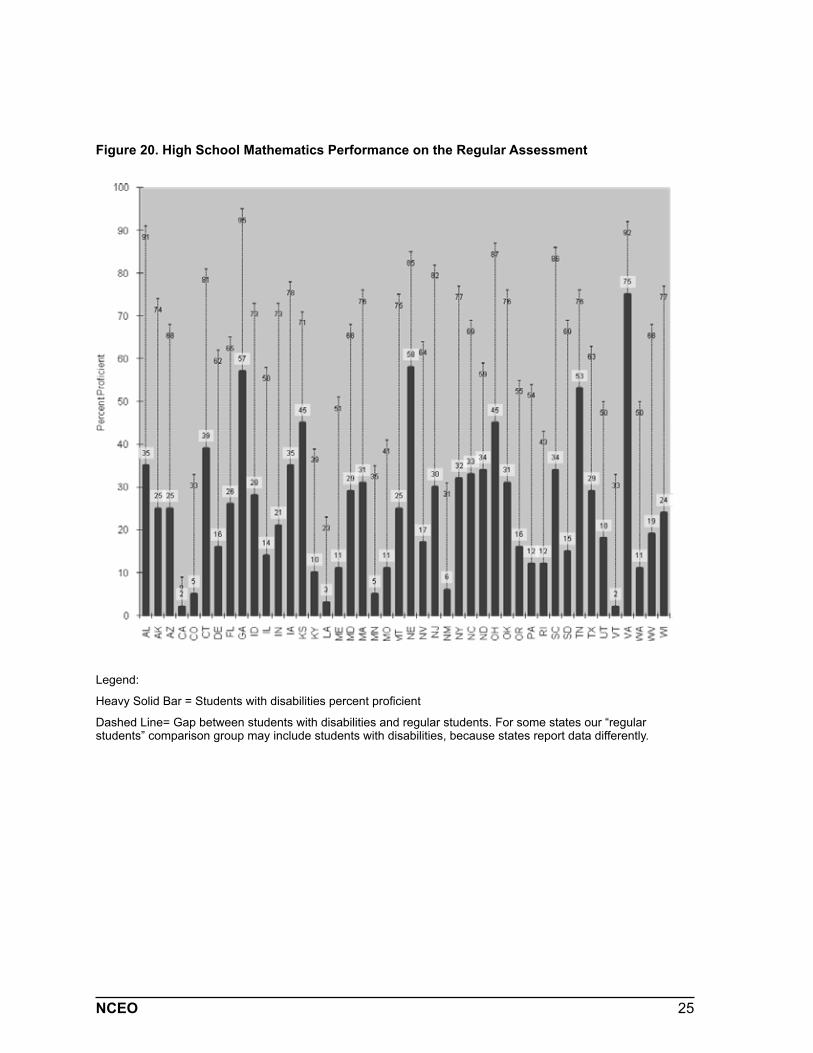
Gaps in math achievement on regular high school math assessments (see Figure 20) ranged from a low of 7 percentage points to a high of 56 percentage points. States with a gap of 25 percentage points or less were California, Louisiana, New Mexico, North Dakota, Tennessee, and Virginia. These six states compare to four in 2005-2006. States with a gap of 50 points or more in 2006-2007 were Alabama, Indiana, Montana, New Jersey, South Carolina, South Da-kota, and Wisconsin. These seven states compare to six states last year.
By these measures, there was only a slight reduction in gaps observed here across years for mathematics at the elementary and middle school levels. For reading, the observed gap differ-ences suggested more improvement across elementary and high school levels.
23NCEO
Figure 18. Elementary Mathematics Performance on the Regular Assessment
Legend:
Heavy Solid Bar = Students with disabilities percent proficient
Dashed Line= Gap between students with disabilities and regular students. For some states our “regular students” comparison group may include students with disabilities, because states report data differently.
24 NCEO
Figure 19. Middle School Mathematics Performance on the Regular Assessment
Legend:
Heavy Solid Bar = Students with disabilities percent proficient
Dashed Line= Gap between students with disabilities and regular students. For some states our “regular students” comparison group may include students with disabilities, because states report data differently.
25NCEO
Figure 20. High School Mathematics Performance on the Regular Assessment
Legend:
Heavy Solid Bar = Students with disabilities percent proficient
Dashed Line= Gap between students with disabilities and regular students. For some states our “regular students” comparison group may include students with disabilities, because states report data differently.
26 NCEO
Alternate Assessment Performance Results
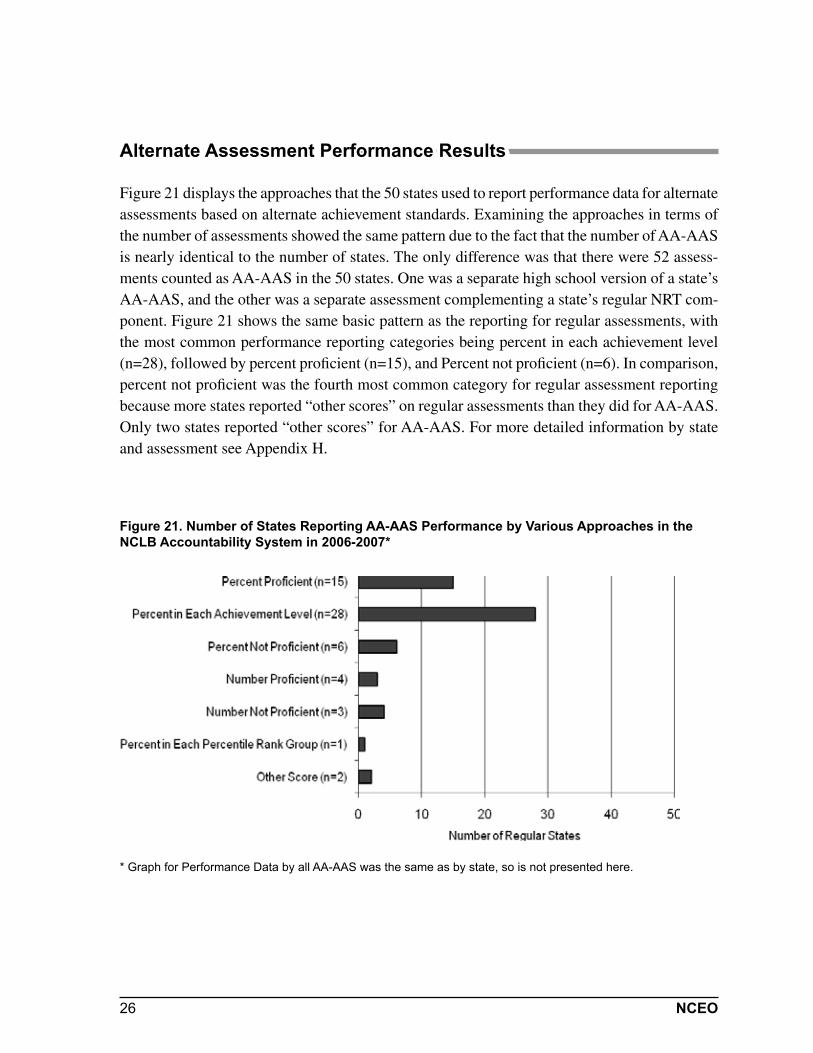
Figure 21 displays the approaches that the 50 states used to report performance data for alternate assessments based on alternate achievement standards. Examining the approaches in terms of the number of assessments showed the same pattern due to the fact that the number of AA-AAS is nearly identical to the number of states. The only difference was that there were 52 assess-ments counted as AA-AAS in the 50 states. One was a separate high school version of a state’s AA-AAS, and the other was a separate assessment complementing a state’s regular NRT com-ponent. Figure 21 shows the same basic pattern as the reporting for regular assessments, with the most common performance reporting categories being percent in each achievement level (n=28), followed by percent proficient (n=15), and Percent not proficient (n=6). In comparison, percent not proficient was the fourth most common category for regular assessment reporting because more states reported “other scores” on regular assessments than they did for AA-AAS. Only two states reported “other scores” for AA-AAS. For more detailed information by state and assessment see Appendix H.
Figure 21. Number of States Reporting AA-AAS Performance by Various Approaches in the NCLB Accountability System in 2006-2007*
* Graph for Performance Data by all AA-AAS was the same as by state, so is not presented here.
27NCEO
Other Information Collected for 2006-2007
Accommodations
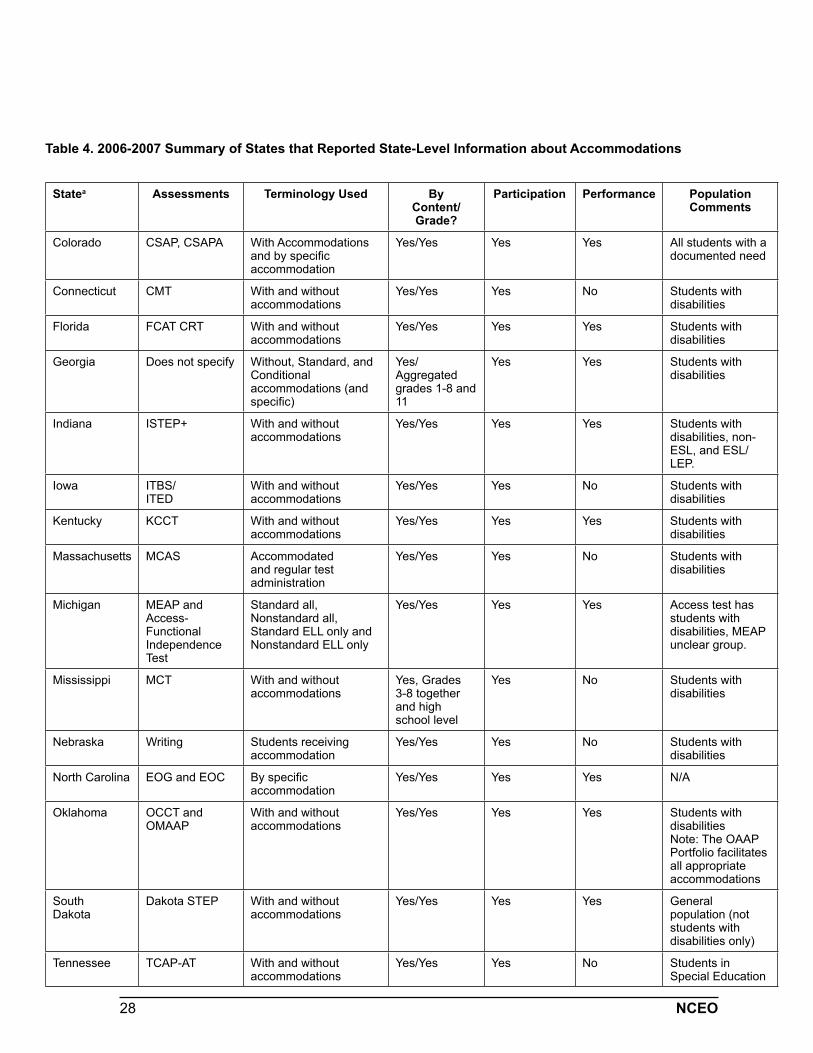
Sixteen states reported participation or performance data for students taking state assessments with or without accommodations. This number was up from 10 in 2005-06, and equaled the number of states reporting this information in 2004-05.
In this year, of sixteen states with data on accommodated participation, 14 states reported ac-commodated students’ participation, performance, or both, disaggregating by grade. Four states reported participation and performance by specific type of accommodation used by students (Colorado, Georgia, North Carolina, and Texas). Three states reported participation and perfor-mance for accommodations based on levels of approval for their use: nonapproved/modification (Colorado), standard and conditional accommodation (Georgia), and standard and non-standard accommodation (Michigan). Although these three reported the performance for those with nonstandard accommodations, the numbers were too low to report for privacy considerations. One state reported accommodation use by whether a student was “significantly cognitively disabled (SCD)” (Mississippi), and another state reported accommodation use disaggregated by its assessment based on modified achievement standards (Oklahoma). Another state reported linguistically accommodated testing (LAT) administration for students with disabilities, as well as a “bundled” set of accommodations for students with dyslexia (Texas).
Of all 16 states reporting data on accommodated administrations of a state assessment, 6 states reported participation only (either the number or percent participating) with accommodations (Connecticut, Iowa, Massachusetts, Mississippi, Nebraska, and Tennessee). For actual participa-tion and performance data for accommodated administration of assessments, see the summary in Table 4 and Appendix I.
28 NCEO
Table 4. 2006-2007 Summary of States that Reported State-Level Information about Accommodations
Statea Assessments Terminology Used By Content/Grade?
Participation Performance Population Comments
Colorado CSAP, CSAPA With Accommodations and by specific accommodation
Yes/Yes Yes Yes All students with a documented need
Connecticut CMT With and without accommodations
Yes/Yes Yes No Students with disabilities
Florida FCAT CRT With and without accommodations
Yes/Yes Yes Yes Students with disabilities
Georgia Does not specify Without, Standard, and Conditional accommodations (and specific)
Yes/Aggregated grades 1-8 and 11
Yes Yes Students with disabilities
Indiana ISTEP+ With and without accommodations
Yes/Yes Yes Yes Students with disabilities, non-ESL, and ESL/LEP.
Iowa ITBS/ITED
With and without accommodations
Yes/Yes Yes No Students with disabilities
Kentucky KCCT With and without accommodations
Yes/Yes Yes Yes Students with disabilities
Massachusetts MCAS Accommodated and regular test administration
Yes/Yes Yes No Students with disabilities
Michigan MEAP and Access-Functional Independence Test
Standard all, Nonstandard all, Standard ELL only and Nonstandard ELL only
Yes/Yes Yes Yes Access test has students with disabilities, MEAP unclear group.
Mississippi MCT With and without accommodations
Yes, Grades 3-8 together and high school level
Yes No Students with disabilities
Nebraska Writing Students receiving accommodation
Yes/Yes Yes No Students with disabilities
North Carolina EOG and EOC By specific accommodation
Yes/Yes Yes Yes N/A
Oklahoma OCCT and OMAAP
With and without accommodations
Yes/Yes Yes Yes Students with disabilities Note: The OAAP Portfolio facilitates all appropriate accommodations
SouthDakota
Dakota STEP With and without accommodations
Yes/Yes Yes Yes General population (not students with disabilities only)
Tennessee TCAP-AT With and without accommodations
Yes/Yes Yes No Students in Special Education
29NCEO
Statea Assessments Terminology used By content/grade?
Participation Performance Population Comments
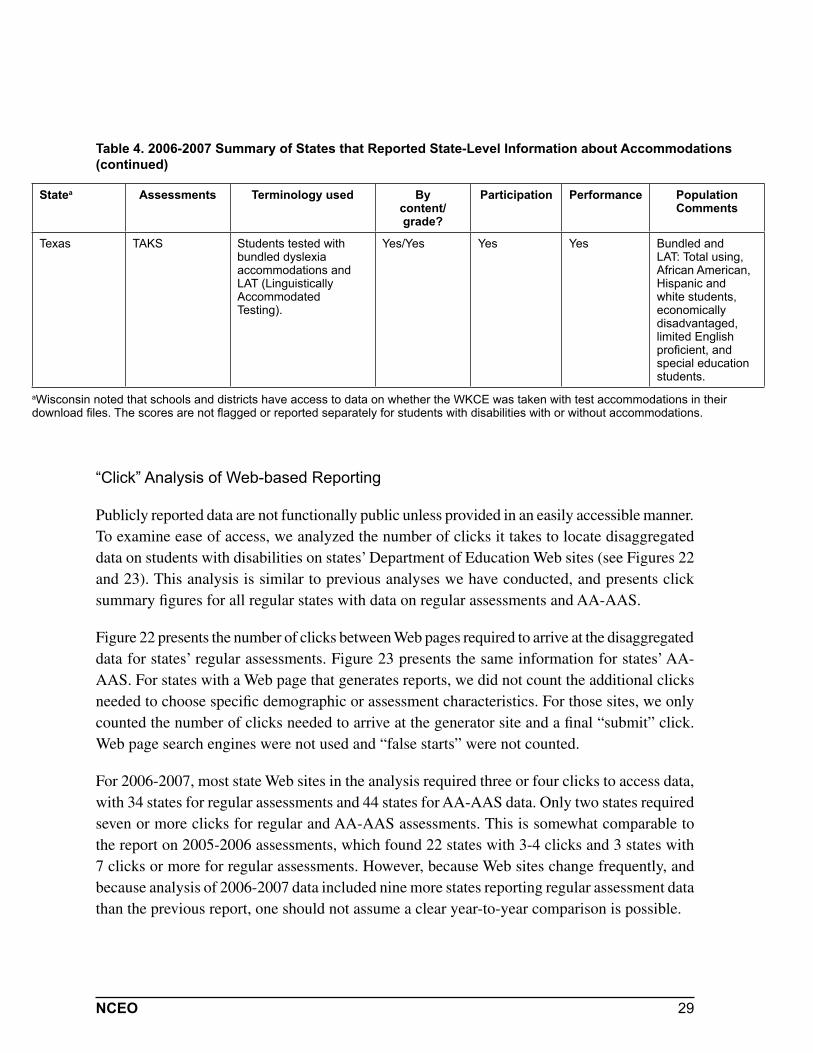
Texas TAKS Students tested with bundled dyslexia accommodations and LAT (Linguistically Accommodated Testing).
Yes/Yes Yes Yes Bundled and LAT: Total using, African American, Hispanic and white students, economically disadvantaged, limited English proficient, and special education students.
aWisconsin noted that schools and districts have access to data on whether the WKCE was taken with test accommodations in their download files. The scores are not flagged or reported separately for students with disabilities with or without accommodations.
Table 4. 2006-2007 Summary of States that Reported State-Level Information about Accommodations (continued)
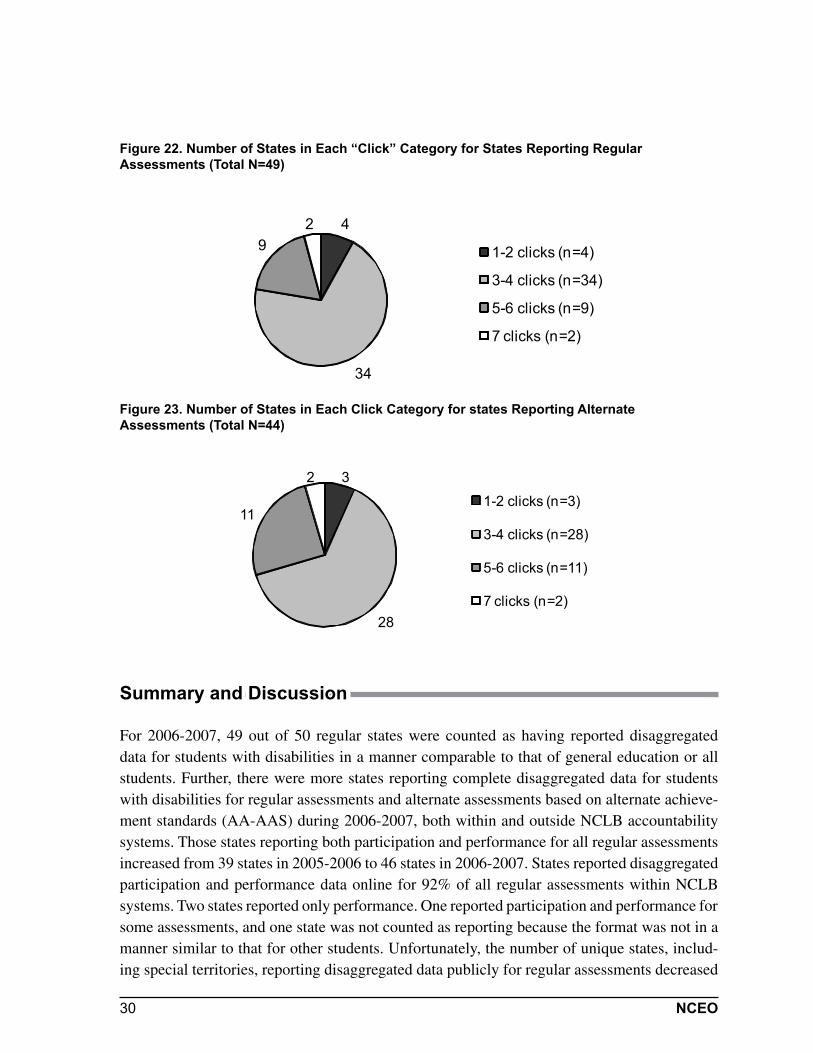
“Click” Analysis of Web-based Reporting
Publicly reported data are not functionally public unless provided in an easily accessible manner. To examine ease of access, we analyzed the number of clicks it takes to locate disaggregated data on students with disabilities on states’ Department of Education Web sites (see Figures 22 and 23). This analysis is similar to previous analyses we have conducted, and presents click summary figures for all regular states with data on regular assessments and AA-AAS.
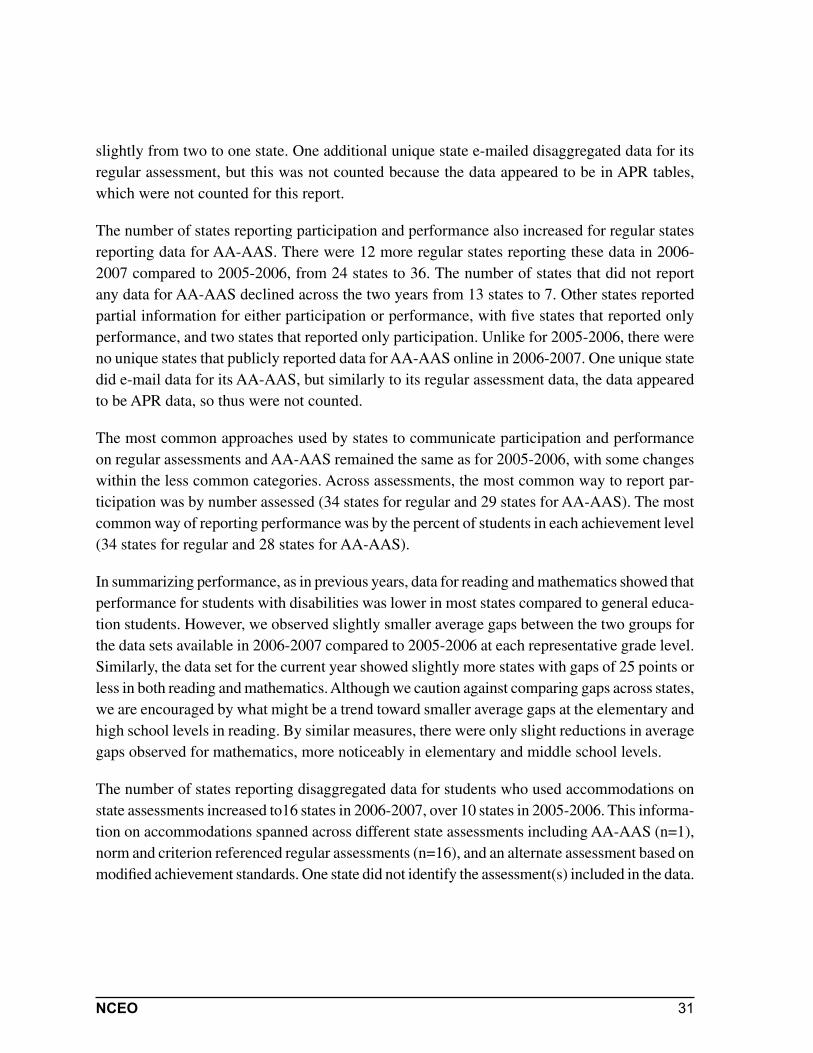
Figure 22 presents the number of clicks between Web pages required to arrive at the disaggregated data for states’ regular assessments. Figure 23 presents the same information for states’ AA-AAS. For states with a Web page that generates reports, we did not count the additional clicks needed to choose specific demographic or assessment characteristics. For those sites, we only counted the number of clicks needed to arrive at the generator site and a final “submit” click. Web page search engines were not used and “false starts” were not counted.
For 2006-2007, most state Web sites in the analysis required three or four clicks to access data, with 34 states for regular assessments and 44 states for AA-AAS data. Only two states required seven or more clicks for regular and AA-AAS assessments. This is somewhat comparable to the report on 2005-2006 assessments, which found 22 states with 3-4 clicks and 3 states with 7 clicks or more for regular assessments. However, because Web sites change frequently, and because analysis of 2006-2007 data included nine more states reporting regular assessment data than the previous report, one should not assume a clear year-to-year comparison is possible.
30 NCEO
Figure 22. Number of States in Each “Click” Category for States Reporting Regular Assessments (Total N=49)
4
34
92
1-2 clicks (n=4)
3-4 clicks (n=34)
5-6 clicks (n=9)
7 clicks (n=2)
Figure 23. Number of States in Each Click Category for states Reporting Alternate Assessments (Total N=44)
3
28
11
21-2 clicks (n=3)
3-4 clicks (n=28)
5-6 clicks (n=11)
7 clicks (n=2)
Summary and Discussion
For 2006-2007, 49 out of 50 regular states were counted as having reported disaggregated data for students with disabilities in a manner comparable to that of general education or all students. Further, there were more states reporting complete disaggregated data for students with disabilities for regular assessments and alternate assessments based on alternate achieve-ment standards (AA-AAS) during 2006-2007, both within and outside NCLB accountability systems. Those states reporting both participation and performance for all regular assessments increased from 39 states in 2005-2006 to 46 states in 2006-2007. States reported disaggregated participation and performance data online for 92% of all regular assessments within NCLB systems. Two states reported only performance. One reported participation and performance for some assessments, and one state was not counted as reporting because the format was not in a manner similar to that for other students. Unfortunately, the number of unique states, includ-ing special territories, reporting disaggregated data publicly for regular assessments decreased
31NCEO
slightly from two to one state. One additional unique state e-mailed disaggregated data for its regular assessment, but this was not counted because the data appeared to be in APR tables, which were not counted for this report.
The number of states reporting participation and performance also increased for regular states reporting data for AA-AAS. There were 12 more regular states reporting these data in 2006-2007 compared to 2005-2006, from 24 states to 36. The number of states that did not report any data for AA-AAS declined across the two years from 13 states to 7. Other states reported partial information for either participation or performance, with five states that reported only performance, and two states that reported only participation. Unlike for 2005-2006, there were no unique states that publicly reported data for AA-AAS online in 2006-2007. One unique state did e-mail data for its AA-AAS, but similarly to its regular assessment data, the data appeared to be APR data, so thus were not counted.
The most common approaches used by states to communicate participation and performance on regular assessments and AA-AAS remained the same as for 2005-2006, with some changes within the less common categories. Across assessments, the most common way to report par-ticipation was by number assessed (34 states for regular and 29 states for AA-AAS). The most common way of reporting performance was by the percent of students in each achievement level (34 states for regular and 28 states for AA-AAS).
In summarizing performance, as in previous years, data for reading and mathematics showed that performance for students with disabilities was lower in most states compared to general educa-tion students. However, we observed slightly smaller average gaps between the two groups for the data sets available in 2006-2007 compared to 2005-2006 at each representative grade level. Similarly, the data set for the current year showed slightly more states with gaps of 25 points or less in both reading and mathematics. Although we caution against comparing gaps across states, we are encouraged by what might be a trend toward smaller average gaps at the elementary and high school levels in reading. By similar measures, there were only slight reductions in average gaps observed for mathematics, more noticeably in elementary and middle school levels.
The number of states reporting disaggregated data for students who used accommodations on state assessments increased to16 states in 2006-2007, over 10 states in 2005-2006. This informa-tion on accommodations spanned across different state assessments including AA-AAS (n=1), norm and criterion referenced regular assessments (n=16), and an alternate assessment based on modified achievement standards. One state did not identify the assessment(s) included in the data.
32 NCEO
Recommendations for Reporting
Based on findings in previous reports and in this current analysis, recommendations are made for reporting data:
Report participation and performance results for each assessment, content area and grade level. States’ annual performance reports (APRs) and state performance plans (SPPs) are now often posted on state education Web sites. However, these reports are not always presented in a way that is accessible to public audiences as are regular public reports. A few states do incor-porate these data into regular reports that are designed to consider a public audience, but most do not. States doing so should consider whether the data for students with disabilities are being presented in a manner comparable to regular reporting for students without disabilities, and are geared to a public audience. States should report data for each content area by grade level as-sessed. Although NCLB does not require states to report data by grade, many states have done so in previous public reports and the data are useful for analysis. We noted in the appendices where reporting was unclear (e.g., reported by grade ranges rather than individual grades), and these data could not be used in most of our analyses. For example, although these data were used for generally describing the number of states that reported participation and performance, they could not be used for the gap analyses.
As mentioned in previous reports, the confidentiality issue is often a factor for reporting par-ticipation for alternate assessments. Yet, our practice remained the same; we counted states as reporting this information if they used a symbol such as a dash or asterisk due to the minimum N privacy policy. We recommend that states report the total participation and performance of students with disabilities by grade and content area, because when a state only reports data by further categorical breakdowns (e.g., alternate assessment participation by disability category), often the number is too small to report the data.
Clearly label preliminary and final data with dates posted. It continues to be important for the public to be able to clearly identify what the most recent and reliable data are for a given year. Many states do note when data posted are preliminary, whether the reports are PDF files or other formats. But, this needs to be done consistently across states. Also, sometimes a state will post data in two different final reports that were created for different purposes. In these cases the purpose should be clearly indicated as well. The documents we collect to analyze for this and similar reports are regular state reports usually located on one Web page or accessible through one page for report generators. Thus, documents not located together or in similar format to the regular assessment report for general education students are not considered. For this reason, and for the benefit of general users, states should present disaggregated data for students with disabilities in a similar manner, and that are located near or integrated with data for general students.
33NCEO
Report participation with accommodations. The number of states that reported participation of students with accommodations increased from the previous report, from 10 states to 16. We encourage this practice because it helps to understand how students are participating overall, and how accommodations may figure into their participation in either regular or alternate as-sessments. It is also important to report these data in order to see the extent that there may be students excluded from the performance data being reported. Thus, states that report these data by grade and content area should continue to do so because it provides useful information for interpreting participation and performance more clearly.
Percentage reporting. States should consider reporting participation rates, disaggregated by grade. This information is useful for interpreting data such as achievement gaps between stu-dents with and without disabilities. In addition to reporting these general participation rates, reporting the percentage of students with disabilities in each type of state assessment by grade level would also be beneficial for interpreting performance data. For example, one state may have more students with disabilities in its regular assessment with or without accommodations compared to another state that may have a higher percentage of its students with disabilities in alternate assessments based on grade level or modified achievement standards. Being able to clearly compare percentages by assessment type and by participation within each grade level would be useful for interpretation and analysis.
Make data accessible. From our analysis of the number of mouse clicks it took to reach state assessment reports from a state education home page, almost half of the states’ data could be reasonably found in four clicks or less. We encourage more states to make the path to assessment data clear for users. Other factors related to accessibility, already mentioned, are clear labeling of the status and purpose of data and ensuring public accessibility in how data are presented.
We conclude by recognizing the increase in numbers of regular states reporting disaggregated assessment data for students with disabilities, particularly online. This reflects greater trans-parency for regular states than in the previous year. We encourage more states to report by grade level. Not only will this allow us to include more data in a wider range of analyses, but it will also make the data even more transparent for the public. Although the public reporting of disaggregated data for students with disabilities in unique states decreased this year, we hope to see increased public reporting practices among these states in subsequent years.
34 NCEO
References
Klein, J.A., Wiley, H.I., & Thurlow, M.L. (2006). Uneven transparency: NCLB tests take pre-cedence in public assessment reporting for students with disabilities (Technical Report 43). Minneapolis, MN: University of Minnesota, National Center on Educational Outcomes.
Thurlow, M.L., & Bremer, C., Albus, D. (2008). Good news bad news in disaggregated subgroup reporting to the public on 2005-2006 assessment results (Technical Report 52). Minneapolis, MN: University of Minnesota, National Center on Educational Outcomes.
Thurlow, M.L., & Wiley, H.I. (2004). Almost there is public reporting of assessment results for students with disabilities (Technical Report 39). Minneapolis, MN: University of Minnesota, National Center on Educational Outcomes.
Thurlow, M.L., Wiley, H.I., & Bielinski, J. (2003). Going public: What 2000-2001 reports tell us about the performance of students with disabilities (Technical Report 35). Minneapolis, MN: University of Minnesota, National Center on Educational Outcomes.
VanGetson, G.R., & Thurlow, M.L. (2007). Nearing the target in disaggregated subgroup reporting to the public on 2004-2005 assessment results (Technical Report 46). Minneapolis, MN: University of Minnesota, National Center on Educational Outcomes.
Wiley, H.I., Thurlow, M.L., & Klein, J.A. (2005). Steady progress: State public reporting prac-tices for students with disabilities after the first year of NCLB (2002-2003) (Technical Report 40). Minneapolis, MN: University of Minnesota, National Center on Educational Outcomes.
35NCEO
Appendix A
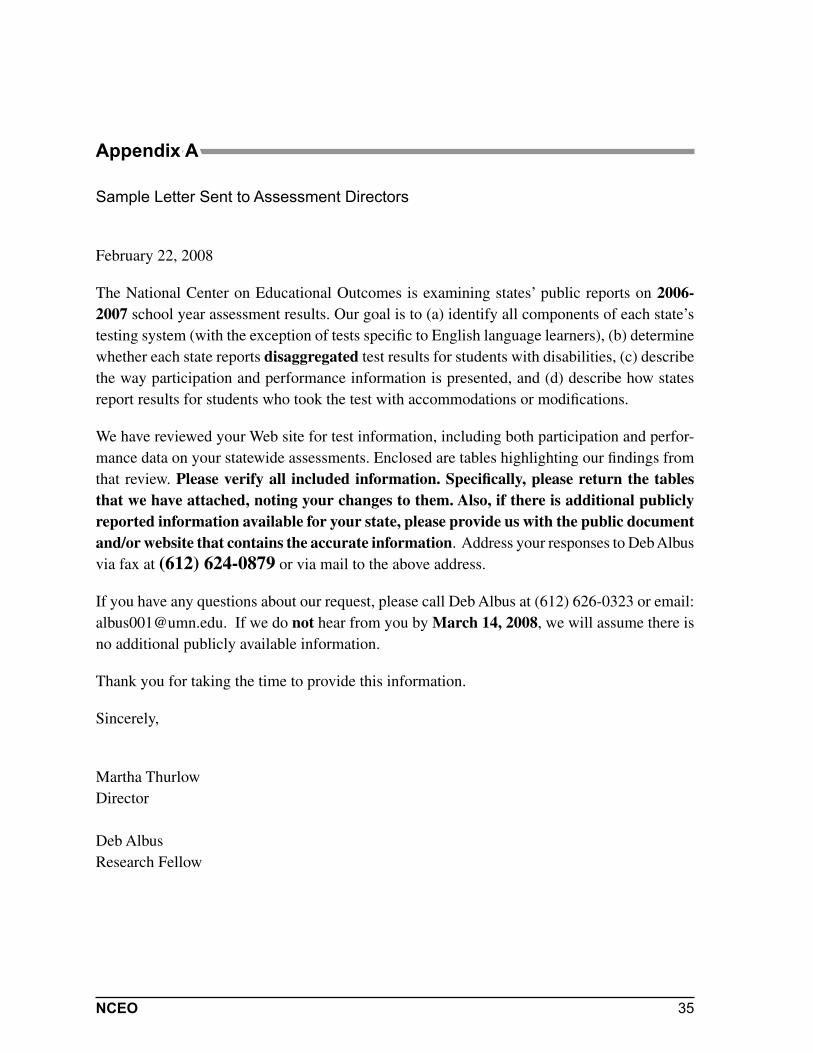
Sample Letter Sent to Assessment Directors
February 22, 2008
The National Center on Educational Outcomes is examining states’ public reports on 2006-2007 school year assessment results. Our goal is to (a) identify all components of each state’s testing system (with the exception of tests specific to English language learners), (b) determine whether each state reports disaggregated test results for students with disabilities, (c) describe the way participation and performance information is presented, and (d) describe how states report results for students who took the test with accommodations or modifications.
We have reviewed your Web site for test information, including both participation and perfor-mance data on your statewide assessments. Enclosed are tables highlighting our findings from that review. Please verify all included information. Specifically, please return the tables that we have attached, noting your changes to them. Also, if there is additional publicly reported information available for your state, please provide us with the public document and/or website that contains the accurate information. Address your responses to Deb Albus via fax at (612) 624-0879 or via mail to the above address.
If you have any questions about our request, please call Deb Albus at (612) 626-0323 or email: [email protected]. If we do not hear from you by March 14, 2008, we will assume there is no additional publicly available information.
Thank you for taking the time to provide this information.
Sincerely,
Martha ThurlowDirector
Deb AlbusResearch Fellow
36 NCEO
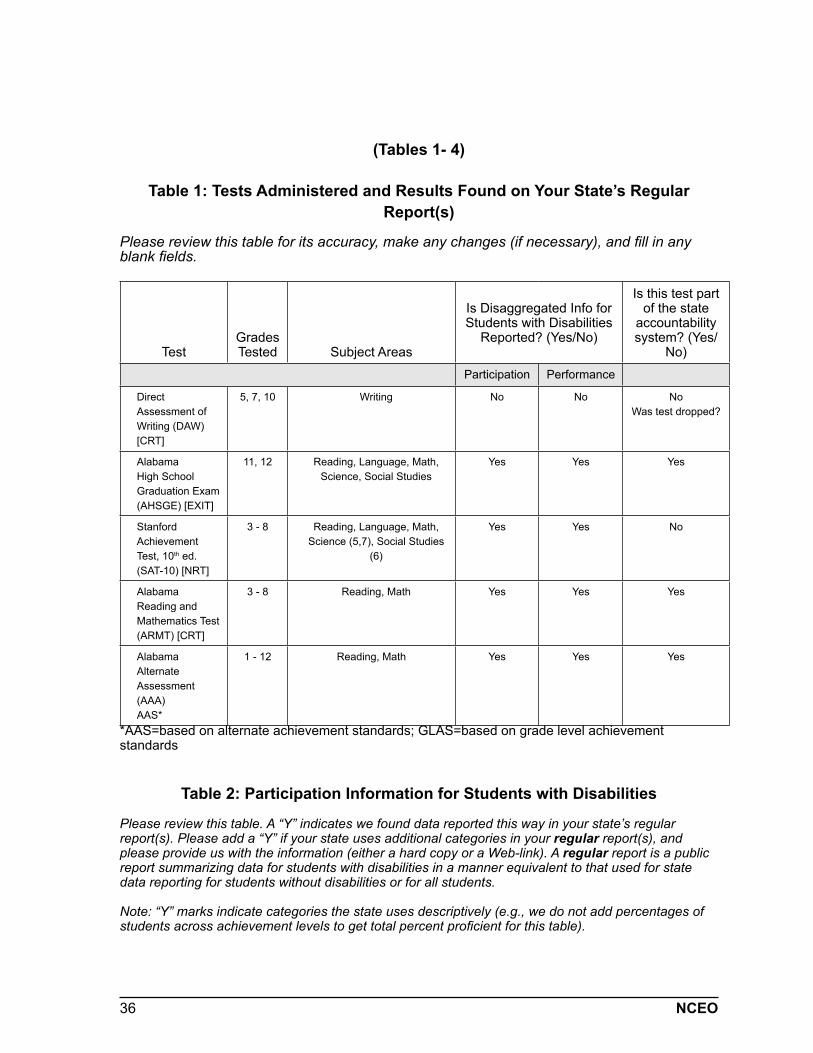
(Tables 1- 4)
Table 1: Tests Administered and Results Found on Your State’s Regular Report(s)
Please review this table for its accuracy, make any changes (if necessary), and fill in any blank fields.
TestGrades Tested Subject Areas
Is Disaggregated Info for Students with Disabilities
Reported? (Yes/No)
Is this test part of the state
accountability system? (Yes/
No)Participation Performance
Direct Assessment of Writing (DAW) [CRT]
5, 7, 10 Writing No No NoWas test dropped?
Alabama High School Graduation Exam (AHSGE) [EXIT]
11, 12 Reading, Language, Math, Science, Social Studies
Yes Yes Yes
Stanford Achievement Test, 10th ed. (SAT-10) [NRT]
3 - 8 Reading, Language, Math, Science (5,7), Social Studies
(6)
Yes Yes No
Alabama Reading and Mathematics Test (ARMT) [CRT]
3 - 8 Reading, Math Yes Yes Yes
Alabama Alternate Assessment (AAA)AAS*
1 - 12 Reading, Math Yes Yes Yes
*AAS=based on alternate achievement standards; GLAS=based on grade level achievement standards
Table 2: Participation Information for Students with Disabilities
Please review this table. A “Y” indicates we found data reported this way in your state’s regular report(s). Please add a “Y” if your state uses additional categories in your regular report(s), and please provide us with the information (either a hard copy or a Web-link). A regular report is a public report summarizing data for students with disabilities in a manner equivalent to that used for state data reporting for students without disabilities or for all students.
Note: “Y” marks indicate categories the state uses descriptively (e.g., we do not add percentages of students across achievement levels to get total percent proficient for this table).
37NCEO
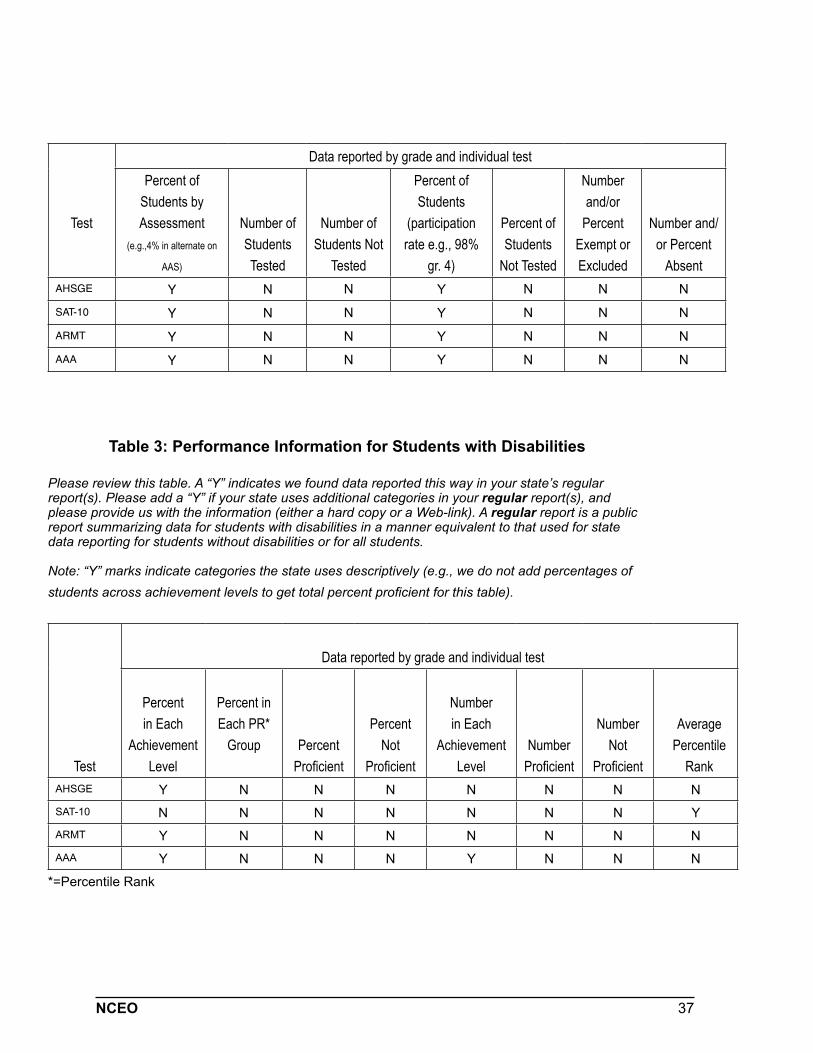
Test
Data reported by grade and individual testPercent of
Students by Assessment
(e.g.,4% in alternate on
AAS)
Number of StudentsTested
Number of Students Not
Tested
Percent of Students
(participation rate e.g., 98%
gr. 4)
Percent of Students
Not Tested
Number and/or
Percent Exempt or Excluded
Number and/or Percent
AbsentAHSGE Y N N Y N N N
SAT-10 Y N N Y N N N
ARMT Y N N Y N N N
AAA Y N N Y N N N
Table 3: Performance Information for Students with Disabilities
Please review this table. A “Y” indicates we found data reported this way in your state’s regular report(s). Please add a “Y” if your state uses additional categories in your regular report(s), and please provide us with the information (either a hard copy or a Web-link). A regular report is a public report summarizing data for students with disabilities in a manner equivalent to that used for state data reporting for students without disabilities or for all students.
Note: “Y” marks indicate categories the state uses descriptively (e.g., we do not add percentages of students across achievement levels to get total percent proficient for this table).
Test
Data reported by grade and individual test
Percent in Each
Achievement Level
Percent in Each PR*
Group Percent Proficient
Percent Not
Proficient
Number in Each
Achievement Level
Number Proficient
Number Not
Proficient
Average Percentile
RankAHSGE Y N N N N N N NSAT-10 N N N N N N N YARMT Y N N N N N N NAAA Y N N N Y N N N
*=Percentile Rank
38 NCEO
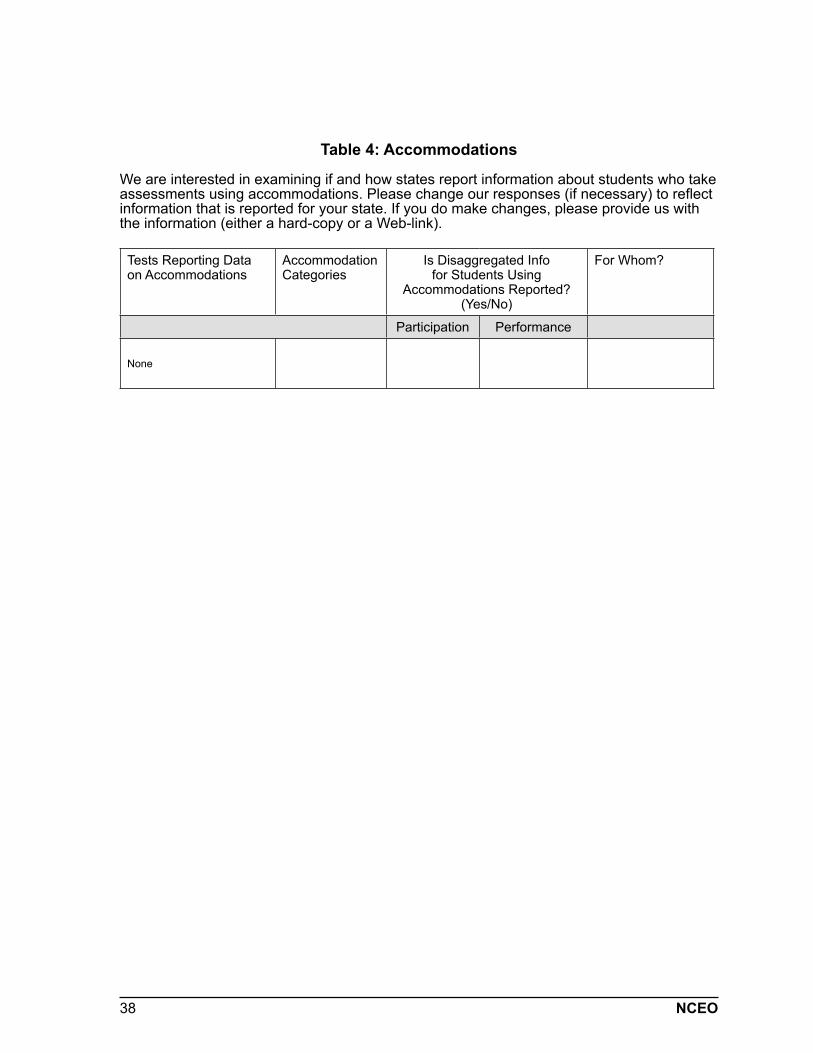
Table 4: Accommodations
We are interested in examining if and how states report information about students who take assessments using accommodations. Please change our responses (if necessary) to reflect information that is reported for your state. If you do make changes, please provide us with the information (either a hard-copy or a Web-link).
Tests Reporting Data on Accommodations
Accommodation Categories
Is Disaggregated Info for Students Using
Accommodations Reported? (Yes/No)
For Whom?
Participation Performance
None
39NCEO
April 28, 2008
The National Center on Educational Outcomes is examining states’ public reports on 2006-2007 school year assessment results. Our goal is to (a) identify all components of each state’s testing system (with the exception of tests specific to English language learners), (b) determine whether each state reports disaggregated test results for students with disabilities, (c) describe the way participation and performance information is presented, and (d) describe how states report results for students who took the test with accommodations or modifications.
We have reviewed your Web site for test information, including both participation and perfor-mance data on your statewide assessments in regular state reports. Enclosed are tables high-lighting our findings from that review. Please verify all included information. Specifically, please return the tables that we have attached, noting your changes to them. Also, if there is additional publicly reported information in regular reports available for your state, please provide us with the public document and/or website that contains the accurate information. Address your responses to Deb Albus via fax at (612) 624-0879 or via mail to the above address.
If you have any questions about our request, please call Deb Albus at (612) 626-0323 or email: [email protected]. If we do not hear from you by May 26, 2008, we will assume there is no additional publicly available information.
Thank you for taking the time to provide this information.
Sincerely,
Martha ThurlowDirector
Deb AlbusResearch Fellow
Appendix B
Sample Letter Sent to Special Education Directors
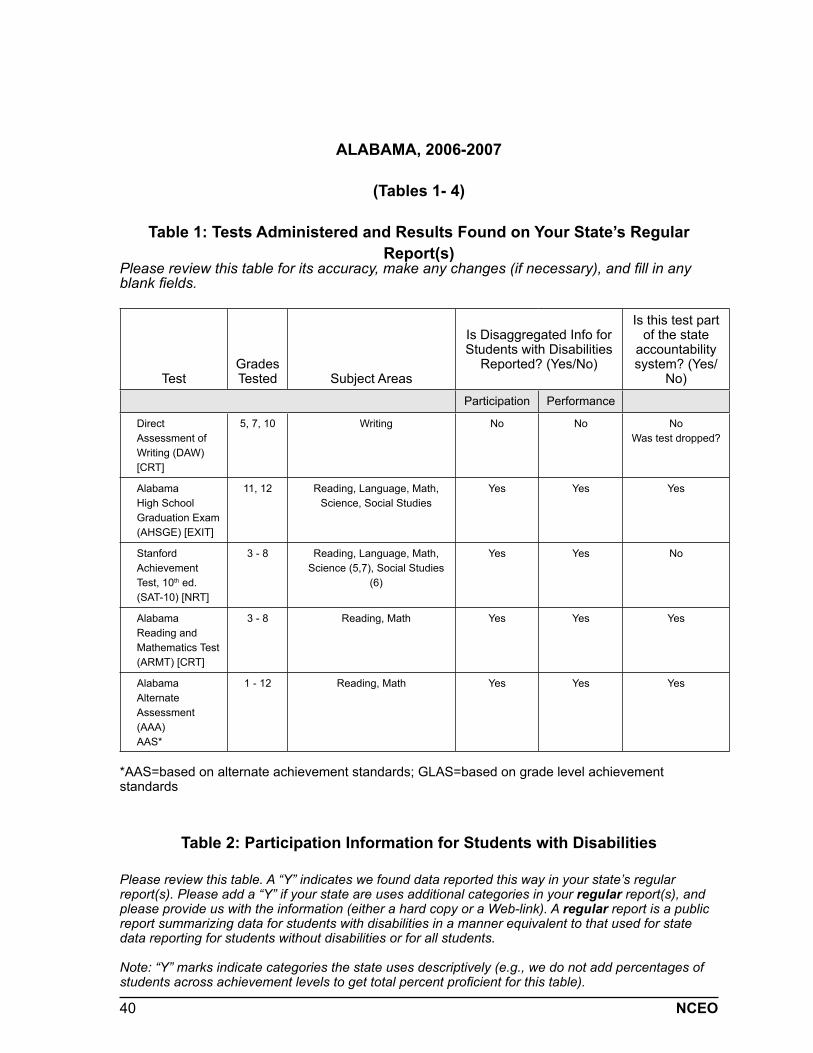
40 NCEO
ALABAMA, 2006-2007
(Tables 1- 4)
Table 1: Tests Administered and Results Found on Your State’s Regular Report(s)
Please review this table for its accuracy, make any changes (if necessary), and fill in any blank fields.
TestGrades Tested Subject Areas
Is Disaggregated Info for Students with Disabilities
Reported? (Yes/No)
Is this test part of the state
accountability system? (Yes/
No)Participation Performance
Direct Assessment of Writing (DAW) [CRT]
5, 7, 10 Writing No No NoWas test dropped?
Alabama High School Graduation Exam (AHSGE) [EXIT]
11, 12 Reading, Language, Math, Science, Social Studies
Yes Yes Yes
Stanford Achievement Test, 10th ed. (SAT-10) [NRT]
3 - 8 Reading, Language, Math, Science (5,7), Social Studies
(6)
Yes Yes No
Alabama Reading and Mathematics Test (ARMT) [CRT]
3 - 8 Reading, Math Yes Yes Yes
Alabama Alternate Assessment (AAA)AAS*
1 - 12 Reading, Math Yes Yes Yes
*AAS=based on alternate achievement standards; GLAS=based on grade level achievement standards
Table 2: Participation Information for Students with Disabilities
Please review this table. A “Y” indicates we found data reported this way in your state’s regular report(s). Please add a “Y” if your state are uses additional categories in your regular report(s), and please provide us with the information (either a hard copy or a Web-link). A regular report is a public report summarizing data for students with disabilities in a manner equivalent to that used for state data reporting for students without disabilities or for all students.
Note: “Y” marks indicate categories the state uses descriptively (e.g., we do not add percentages of students across achievement levels to get total percent proficient for this table).
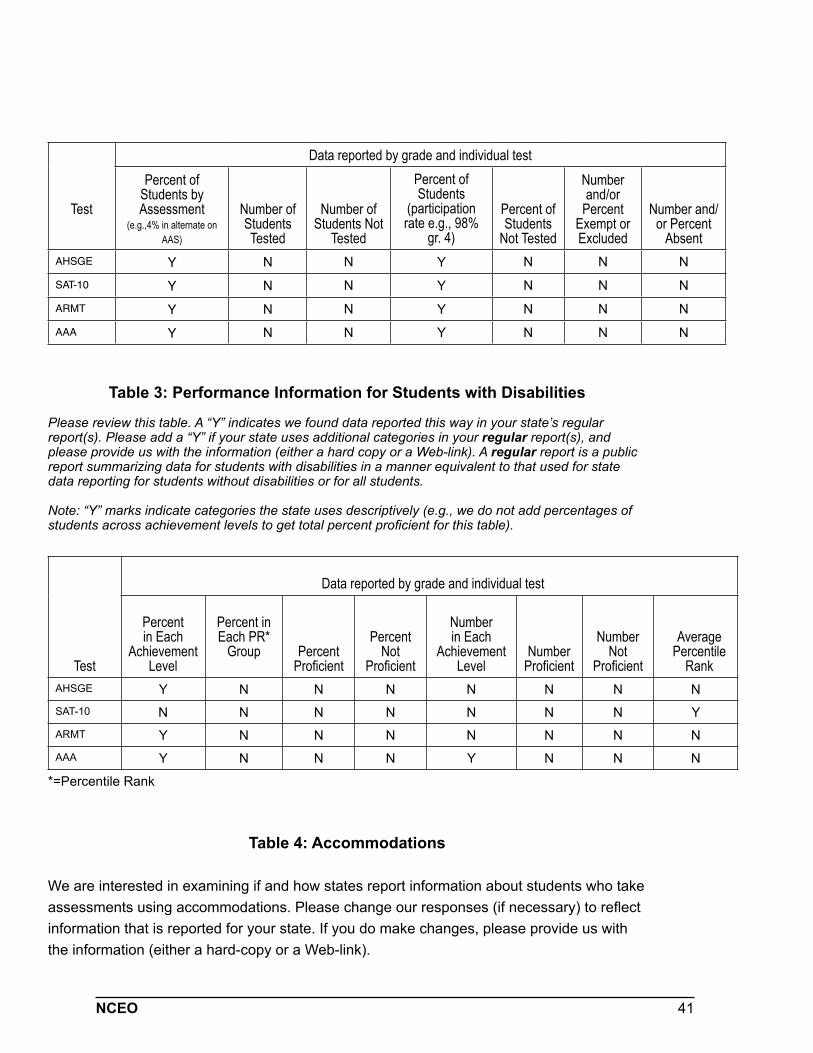
41NCEO
Test
Data reported by grade and individual testPercent of
Students by Assessment
(e.g.,4% in alternate on AAS)
Number of StudentsTested
Number of Students Not
Tested
Percent of Students
(participation rate e.g., 98%
gr. 4)
Percent of Students
Not Tested
Number and/or
Percent Exempt or Excluded
Number and/or Percent
AbsentAHSGE Y N N Y N N N
SAT-10 Y N N Y N N N
ARMT Y N N Y N N N
AAA Y N N Y N N N
Table 3: Performance Information for Students with Disabilities
Please review this table. A “Y” indicates we found data reported this way in your state’s regular report(s). Please add a “Y” if your state uses additional categories in your regular report(s), and please provide us with the information (either a hard copy or a Web-link). A regular report is a public report summarizing data for students with disabilities in a manner equivalent to that used for state data reporting for students without disabilities or for all students.
Note: “Y” marks indicate categories the state uses descriptively (e.g., we do not add percentages of students across achievement levels to get total percent proficient for this table).
Test
Data reported by grade and individual test
Percent in Each
Achievement Level
Percent in Each PR*
Group Percent Proficient
Percent Not
Proficient
Number in Each
Achievement Level
Number Proficient
Number Not
Proficient
Average Percentile
RankAHSGE Y N N N N N N NSAT-10 N N N N N N N YARMT Y N N N N N N NAAA Y N N N Y N N N
*=Percentile Rank
Table 4: Accommodations
We are interested in examining if and how states report information about students who take assessments using accommodations. Please change our responses (if necessary) to reflect information that is reported for your state. If you do make changes, please provide us with the information (either a hard-copy or a Web-link).
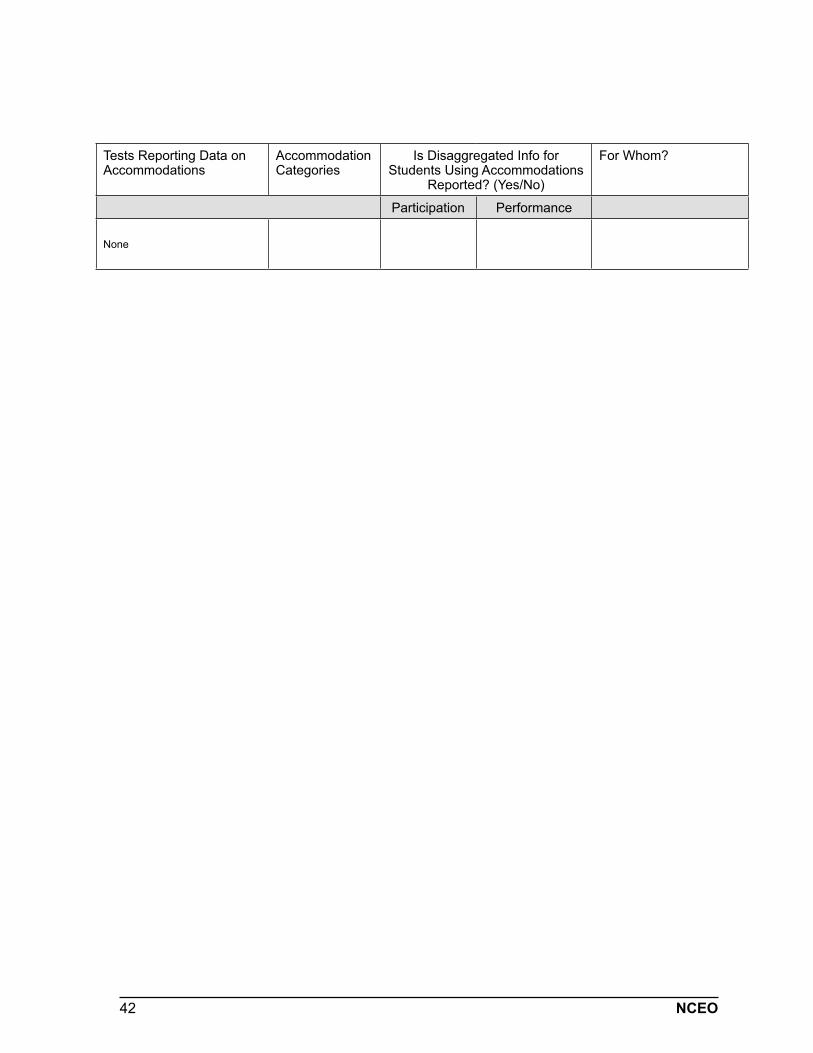
42 NCEO
Tests Reporting Data on Accommodations
Accommodation Categories
Is Disaggregated Info for Students Using Accommodations
Reported? (Yes/No)
For Whom?
Participation Performance
None
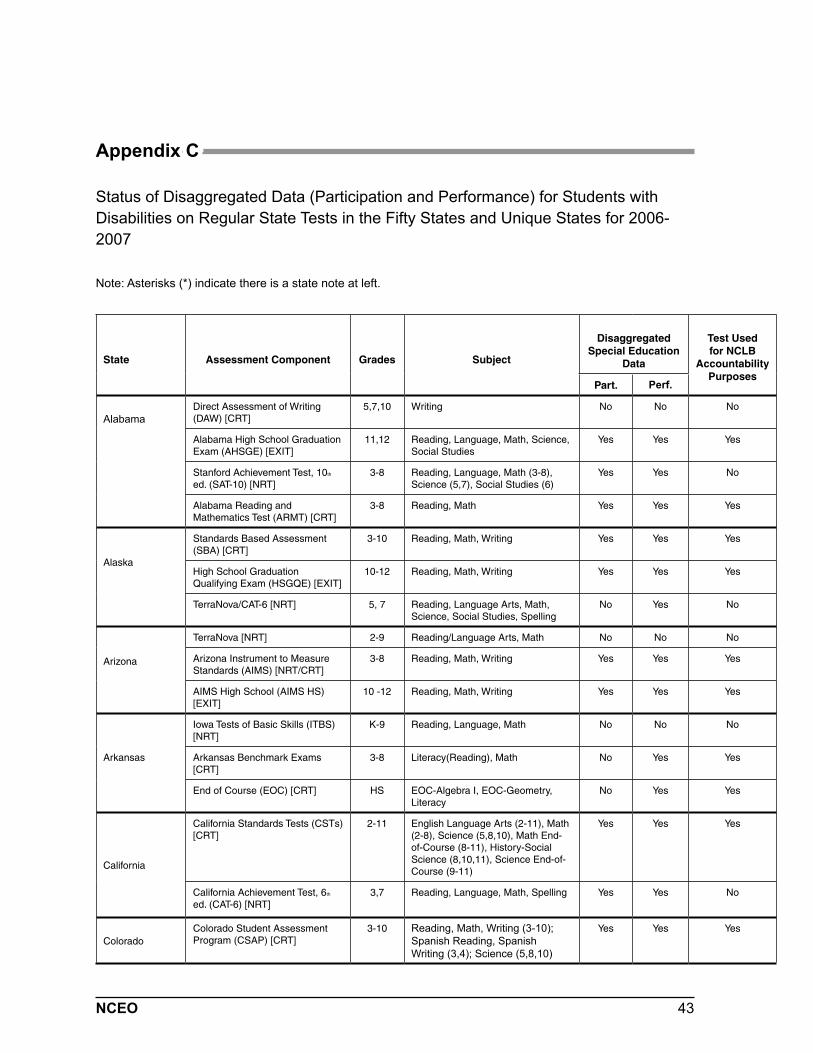
43NCEO
Appendix C
Status of Disaggregated Data (Participation and Performance) for Students with Disabilities on Regular State Tests in the Fifty States and Unique States for 2006-2007
Note: Asterisks (*) indicate there is a state note at left.
State Assessment Component Grades Subject
Disaggregated Special Education
Data
Test Used for NCLB
Accountability Purposes
Part. Perf.
AlabamaDirect Assessment of Writing (DAW) [CRT]
5,7,10 Writing No No No
Alabama High School Graduation Exam (AHSGE) [EXIT]
11,12 Reading, Language, Math, Science, Social Studies
Yes Yes Yes
Stanford Achievement Test, 10th
ed. (SAT-10) [NRT] 3-8 Reading, Language, Math (3-8),
Science (5,7), Social Studies (6) Yes Yes No
Alabama Reading and Mathematics Test (ARMT) [CRT]
3-8 Reading, Math Yes Yes Yes
Alaska
Standards Based Assessment (SBA) [CRT]
3-10 Reading, Math, Writing Yes Yes Yes
High School Graduation Qualifying Exam (HSGQE) [EXIT]
10-12 Reading, Math, Writing Yes Yes Yes
TerraNova/CAT-6 [NRT] 5, 7 Reading, Language Arts, Math, Science, Social Studies, Spelling
No Yes No
Arizona
TerraNova [NRT] 2-9 Reading/Language Arts, Math No No No
Arizona Instrument to Measure Standards (AIMS) [NRT/CRT]
3-8 Reading, Math, Writing Yes Yes Yes
AIMS High School (AIMS HS) [EXIT]
10 -12 Reading, Math, Writing Yes Yes Yes
Arkansas
Iowa Tests of Basic Skills (ITBS) [NRT]
K-9 Reading, Language, Math No No No
Arkansas Benchmark Exams [CRT]
3-8 Literacy(Reading), Math No Yes Yes
End of Course (EOC) [CRT] HS EOC-Algebra I, EOC-Geometry, Literacy
No Yes Yes
California
California Standards Tests (CSTs) [CRT]
2-11 English Language Arts (2-11), Math (2-8), Science (5,8,10), Math End-of-Course (8-11), History-Social Science (8,10,11), Science End-of-Course (9-11)
Yes Yes Yes
California Achievement Test, 6th
ed. (CAT-6) [NRT] 3,7 Reading, Language, Math, Spelling Yes Yes No
ColoradoColorado Student Assessment Program (CSAP) [CRT]
3-10 Reading, Math, Writing (3-10); Spanish Reading, Spanish Writing (3,4); Science (5,8,10)
Yes Yes Yes
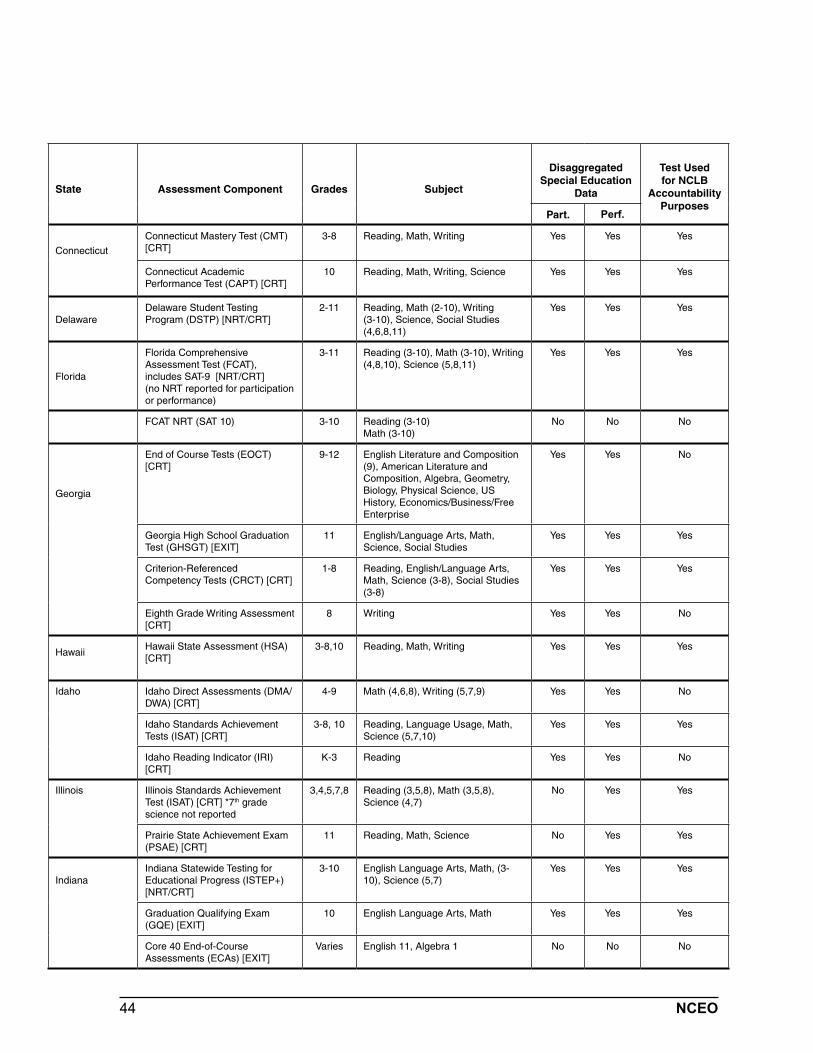
44 NCEO
State Assessment Component Grades Subject
Disaggregated Special Education
Data
Test Used for NCLB
Accountability Purposes
Part. Perf.
Connecticut
Connecticut Mastery Test (CMT) [CRT]
3-8 Reading, Math, Writing Yes Yes Yes
Connecticut Academic Performance Test (CAPT) [CRT]
10 Reading, Math, Writing, Science Yes Yes Yes
DelawareDelaware Student Testing Program (DSTP) [NRT/CRT]
2-11 Reading, Math (2-10), Writing (3-10), Science, Social Studies (4,6,8,11)
Yes Yes Yes
Florida
Florida Comprehensive Assessment Test (FCAT), includes SAT-9 [NRT/CRT] (no NRT reported for participation or performance)
3-11 Reading (3-10), Math (3-10), Writing (4,8,10), Science (5,8,11)
Yes Yes Yes
FCAT NRT (SAT 10) 3-10 Reading (3-10)Math (3-10)
No No No
Georgia
End of Course Tests (EOCT) [CRT]
9-12 English Literature and Composition (9), American Literature and Composition, Algebra, Geometry, Biology, Physical Science, US History, Economics/Business/Free Enterprise
Yes Yes No
Georgia High School Graduation Test (GHSGT) [EXIT]
11 English/Language Arts, Math, Science, Social Studies
Yes Yes Yes
Criterion-Referenced Competency Tests (CRCT) [CRT]
1-8 Reading, English/Language Arts, Math, Science (3-8), Social Studies (3-8)
Yes Yes Yes
Eighth Grade Writing Assessment [CRT]
8 Writing Yes Yes No
HawaiiHawaii State Assessment (HSA) [CRT]
3-8,10 Reading, Math, Writing Yes Yes Yes
Idaho Idaho Direct Assessments (DMA/DWA) [CRT]
4-9 Math (4,6,8), Writing (5,7,9) Yes Yes No
Idaho Standards Achievement Tests (ISAT) [CRT]
3-8, 10 Reading, Language Usage, Math, Science (5,7,10)
Yes Yes Yes
Idaho Reading Indicator (IRI) [CRT]
K-3 Reading Yes Yes No
Illinois Illinois Standards Achievement Test (ISAT) [CRT] *7th grade science not reported
3,4,5,7,8 Reading (3,5,8), Math (3,5,8), Science (4,7)
No Yes Yes
Prairie State Achievement Exam (PSAE) [CRT]
11 Reading, Math, Science No Yes Yes
IndianaIndiana Statewide Testing for Educational Progress (ISTEP+) [NRT/CRT]
3-10 English Language Arts, Math, (3-10), Science (5,7)
Yes Yes Yes
Graduation Qualifying Exam (GQE) [EXIT]
10 English Language Arts, Math Yes Yes Yes
Core 40 End-of-Course Assessments (ECAs) [EXIT]
Varies English 11, Algebra 1 No No No
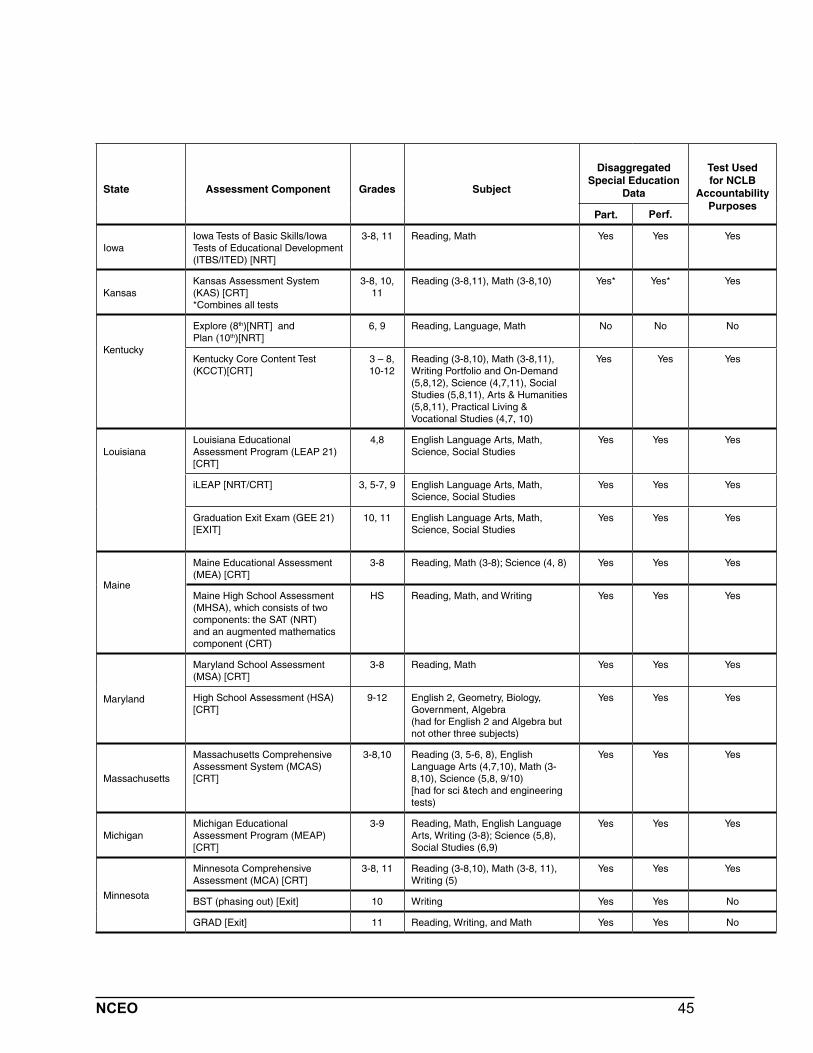
45NCEO
State Assessment Component Grades Subject
Disaggregated Special Education
Data
Test Used for NCLB
Accountability Purposes
Part. Perf.
IowaIowa Tests of Basic Skills/Iowa Tests of Educational Development (ITBS/ITED) [NRT]
3-8, 11 Reading, Math Yes Yes Yes
KansasKansas Assessment System (KAS) [CRT]*Combines all tests
3-8, 10, 11
Reading (3-8,11), Math (3-8,10) Yes* Yes* Yes
Kentucky
Explore (8th)[NRT] and Plan (10th)[NRT]
6, 9 Reading, Language, Math No No No
Kentucky Core Content Test (KCCT)[CRT]
3 – 8, 10-12
Reading (3-8,10), Math (3-8,11), Writing Portfolio and On-Demand (5,8,12), Science (4,7,11), Social Studies (5,8,11), Arts & Humanities (5,8,11), Practical Living & Vocational Studies (4,7, 10)
Yes Yes Yes
LouisianaLouisiana Educational Assessment Program (LEAP 21) [CRT]
4,8 English Language Arts, Math, Science, Social Studies
Yes Yes Yes
iLEAP [NRT/CRT] 3, 5-7, 9 English Language Arts, Math, Science, Social Studies
Yes Yes Yes
Graduation Exit Exam (GEE 21) [EXIT]
10, 11 English Language Arts, Math, Science, Social Studies
Yes Yes Yes
Maine
Maine Educational Assessment (MEA) [CRT]
3-8 Reading, Math (3-8); Science (4, 8) Yes Yes Yes
Maine High School Assessment (MHSA), which consists of two components: the SAT (NRT) and an augmented mathematics component (CRT)
HS Reading, Math, and Writing Yes Yes Yes
Maryland
Maryland School Assessment (MSA) [CRT]
3-8 Reading, Math Yes Yes Yes
High School Assessment (HSA) [CRT]
9-12 English 2, Geometry, Biology, Government, Algebra (had for English 2 and Algebra but not other three subjects)
Yes Yes Yes
Massachusetts
Massachusetts Comprehensive Assessment System (MCAS) [CRT]
3-8,10 Reading (3, 5-6, 8), English Language Arts (4,7,10), Math (3-8,10), Science (5,8, 9/10) [had for sci &tech and engineering tests)
Yes Yes Yes
MichiganMichigan Educational Assessment Program (MEAP) [CRT]
3-9 Reading, Math, English Language Arts, Writing (3-8); Science (5,8), Social Studies (6,9)
Yes Yes Yes
Minnesota
Minnesota Comprehensive Assessment (MCA) [CRT]
3-8, 11 Reading (3-8,10), Math (3-8, 11), Writing (5)
Yes Yes Yes
BST (phasing out) [Exit] 10 Writing Yes Yes No
GRAD [Exit] 11 Reading, Writing, and Math Yes Yes No
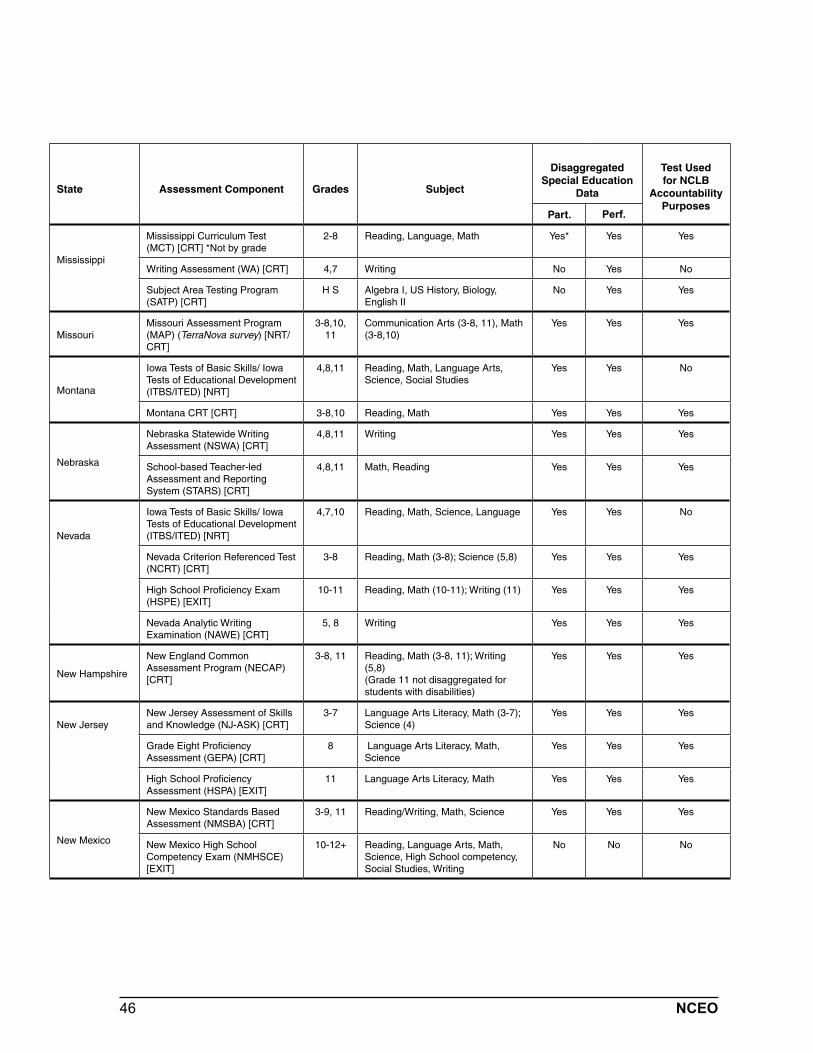
46 NCEO
State Assessment Component Grades Subject
Disaggregated Special Education
Data
Test Used for NCLB
Accountability Purposes
Part. Perf.
Mississippi
Mississippi Curriculum Test (MCT) [CRT] *Not by grade
2-8 Reading, Language, Math Yes* Yes Yes
Writing Assessment (WA) [CRT] 4,7 Writing No Yes No
Subject Area Testing Program (SATP) [CRT]
H S Algebra I, US History, Biology, English II
No Yes Yes
MissouriMissouri Assessment Program (MAP) (TerraNova survey) [NRT/CRT]
3-8,10, 11
Communication Arts (3-8, 11), Math (3-8,10)
Yes Yes Yes
Montana
Iowa Tests of Basic Skills/ Iowa Tests of Educational Development (ITBS/ITED) [NRT]
4,8,11 Reading, Math, Language Arts, Science, Social Studies
Yes Yes No
Montana CRT [CRT] 3-8,10 Reading, Math Yes Yes Yes
Nebraska
Nebraska Statewide Writing Assessment (NSWA) [CRT]
4,8,11 Writing Yes Yes Yes
School-based Teacher-led Assessment and Reporting System (STARS) [CRT]
4,8,11 Math, Reading Yes Yes Yes
Nevada
Iowa Tests of Basic Skills/ Iowa Tests of Educational Development (ITBS/ITED) [NRT]
4,7,10 Reading, Math, Science, Language Yes Yes No
Nevada Criterion Referenced Test (NCRT) [CRT]
3-8 Reading, Math (3-8); Science (5,8) Yes Yes Yes
High School Proficiency Exam (HSPE) [EXIT]
10-11 Reading, Math (10-11); Writing (11) Yes Yes Yes
Nevada Analytic Writing Examination (NAWE) [CRT]
5, 8 Writing Yes Yes Yes
New Hampshire
New England Common Assessment Program (NECAP) [CRT]
3-8, 11 Reading, Math (3-8, 11); Writing (5,8)(Grade 11 not disaggregated for students with disabilities)
Yes Yes Yes
New JerseyNew Jersey Assessment of Skills and Knowledge (NJ-ASK) [CRT]
3-7 Language Arts Literacy, Math (3-7); Science (4)
Yes Yes Yes
Grade Eight Proficiency Assessment (GEPA) [CRT]
8 Language Arts Literacy, Math, Science
Yes Yes Yes
High School Proficiency Assessment (HSPA) [EXIT]
11 Language Arts Literacy, Math Yes Yes Yes
New Mexico
New Mexico Standards Based Assessment (NMSBA) [CRT]
3-9, 11 Reading/Writing, Math, Science Yes Yes Yes
New Mexico High School Competency Exam (NMHSCE) [EXIT]
10-12+ Reading, Language Arts, Math, Science, High School competency, Social Studies, Writing
No No No
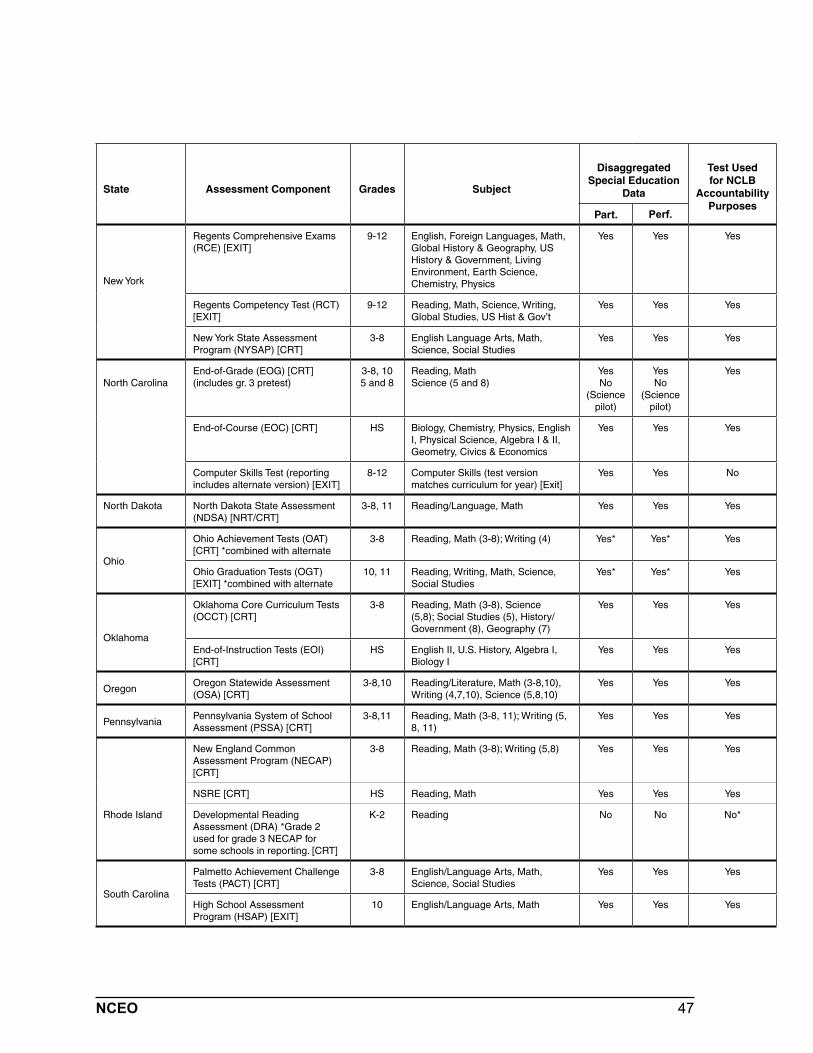
47NCEO
State Assessment Component Grades Subject
Disaggregated Special Education
Data
Test Used for NCLB
Accountability Purposes
Part. Perf.
New York
Regents Comprehensive Exams (RCE) [EXIT]
9-12 English, Foreign Languages, Math, Global History & Geography, US History & Government, Living Environment, Earth Science, Chemistry, Physics
Yes Yes Yes
Regents Competency Test (RCT) [EXIT]
9-12 Reading, Math, Science, Writing, Global Studies, US Hist & Gov’t
Yes Yes Yes
New York State Assessment Program (NYSAP) [CRT]
3-8 English Language Arts, Math, Science, Social Studies
Yes Yes Yes
North CarolinaEnd-of-Grade (EOG) [CRT] (includes gr. 3 pretest)
3-8, 105 and 8
Reading, Math Science (5 and 8)
YesNo
(Science pilot)
YesNo
(Science pilot)
Yes
End-of-Course (EOC) [CRT] HS Biology, Chemistry, Physics, English I, Physical Science, Algebra I & II, Geometry, Civics & Economics
Yes Yes Yes
Computer Skills Test (reporting includes alternate version) [EXIT]
8-12 Computer Skills (test version matches curriculum for year) [Exit]
Yes Yes No
North Dakota North Dakota State Assessment (NDSA) [NRT/CRT]
3-8, 11 Reading/Language, Math Yes Yes Yes
Ohio
Ohio Achievement Tests (OAT) [CRT] *combined with alternate
3-8 Reading, Math (3-8); Writing (4) Yes* Yes* Yes
Ohio Graduation Tests (OGT) [EXIT] *combined with alternate
10, 11 Reading, Writing, Math, Science, Social Studies
Yes* Yes* Yes
Oklahoma
Oklahoma Core Curriculum Tests (OCCT) [CRT]
3-8 Reading, Math (3-8), Science (5,8); Social Studies (5), History/Government (8), Geography (7)
Yes Yes Yes
End-of-Instruction Tests (EOI) [CRT]
HS English II, U.S. History, Algebra I, Biology I
Yes Yes Yes
OregonOregon Statewide Assessment (OSA) [CRT]
3-8,10 Reading/Literature, Math (3-8,10), Writing (4,7,10), Science (5,8,10)
Yes Yes Yes
PennsylvaniaPennsylvania System of School Assessment (PSSA) [CRT]
3-8,11 Reading, Math (3-8, 11); Writing (5, 8, 11)
Yes Yes Yes
Rhode Island
New England Common Assessment Program (NECAP)[CRT]
3-8 Reading, Math (3-8); Writing (5,8) Yes Yes Yes
NSRE [CRT] HS Reading, Math Yes Yes Yes
Developmental Reading Assessment (DRA) *Grade 2 used for grade 3 NECAP for some schools in reporting. [CRT]
K-2 Reading No No No*
South Carolina
Palmetto Achievement Challenge Tests (PACT) [CRT]
3-8 English/Language Arts, Math, Science, Social Studies
Yes Yes Yes
High School Assessment Program (HSAP) [EXIT]
10 English/Language Arts, Math Yes Yes Yes
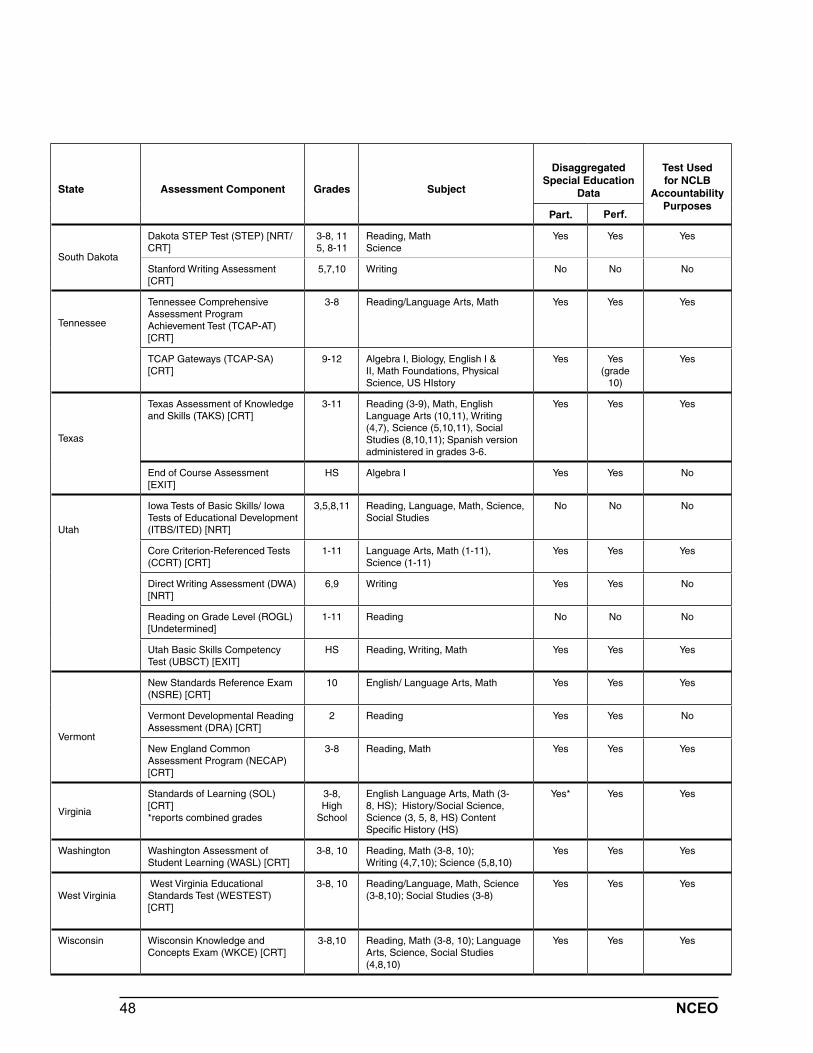
48 NCEO
State Assessment Component Grades Subject
Disaggregated Special Education
Data
Test Used for NCLB
Accountability Purposes
Part. Perf.
South Dakota
Dakota STEP Test (STEP) [NRT/CRT]
3-8, 115, 8-11
Reading, Math Science
Yes Yes Yes
Stanford Writing Assessment [CRT]
5,7,10 Writing No No No
Tennessee
Tennessee Comprehensive Assessment Program Achievement Test (TCAP-AT) [CRT]
3-8 Reading/Language Arts, Math Yes Yes Yes
TCAP Gateways (TCAP-SA) [CRT]
9-12 Algebra I, Biology, English I & II, Math Foundations, Physical Science, US HIstory
Yes Yes(grade
10)
Yes
Texas
Texas Assessment of Knowledge and Skills (TAKS) [CRT]
3-11 Reading (3-9), Math, English Language Arts (10,11), Writing (4,7), Science (5,10,11), Social Studies (8,10,11); Spanish version administered in grades 3-6.
Yes Yes Yes
End of Course Assessment [EXIT]
HS Algebra I Yes Yes No
Utah
Iowa Tests of Basic Skills/ Iowa Tests of Educational Development (ITBS/ITED) [NRT]
3,5,8,11 Reading, Language, Math, Science, Social Studies
No No No
Core Criterion-Referenced Tests (CCRT) [CRT]
1-11 Language Arts, Math (1-11), Science (1-11)
Yes Yes Yes
Direct Writing Assessment (DWA) [NRT]
6,9 Writing Yes Yes No
Reading on Grade Level (ROGL)[Undetermined]
1-11 Reading No No No
Utah Basic Skills Competency Test (UBSCT) [EXIT]
HS Reading, Writing, Math Yes Yes Yes
Vermont
New Standards Reference Exam (NSRE) [CRT]
10 English/ Language Arts, Math Yes Yes Yes
Vermont Developmental Reading Assessment (DRA) [CRT]
2 Reading Yes Yes No
New England Common Assessment Program (NECAP) [CRT]
3-8 Reading, Math Yes Yes Yes
Virginia
Standards of Learning (SOL) [CRT] *reports combined grades
3-8,High
School
English Language Arts, Math (3-8, HS); History/Social Science, Science (3, 5, 8, HS) Content Specific History (HS)
Yes* Yes Yes
Washington Washington Assessment of Student Learning (WASL) [CRT]
3-8, 10 Reading, Math (3-8, 10);Writing (4,7,10); Science (5,8,10)
Yes Yes Yes
West Virginia West Virginia Educational Standards Test (WESTEST) [CRT]
3-8, 10 Reading/Language, Math, Science (3-8,10); Social Studies (3-8)
Yes Yes Yes
Wisconsin Wisconsin Knowledge and Concepts Exam (WKCE) [CRT]
3-8,10 Reading, Math (3-8, 10); Language Arts, Science, Social Studies (4,8,10)
Yes Yes Yes
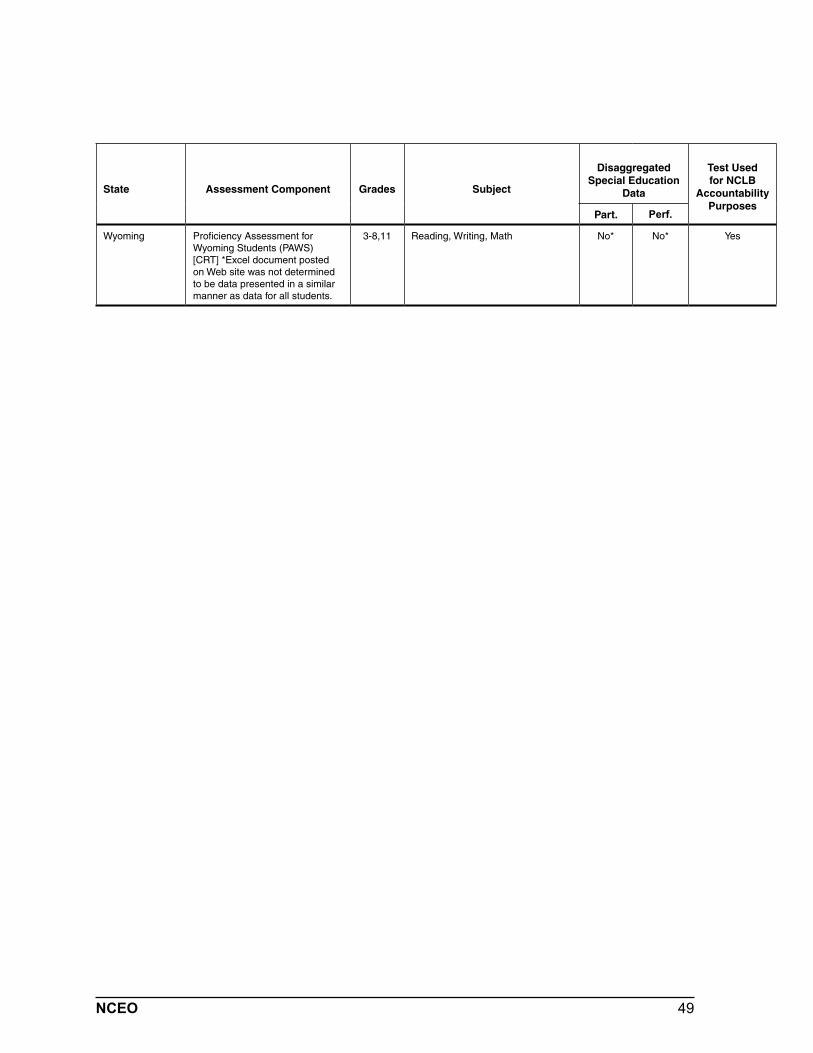
49NCEO
State Assessment Component Grades Subject
Disaggregated Special Education
Data
Test Used for NCLB
Accountability Purposes
Part. Perf.
Wyoming Proficiency Assessment for Wyoming Students (PAWS) [CRT] *Excel document posted on Web site was not determined to be data presented in a similar manner as data for all students.
3-8,11 Reading, Writing, Math No* No* Yes
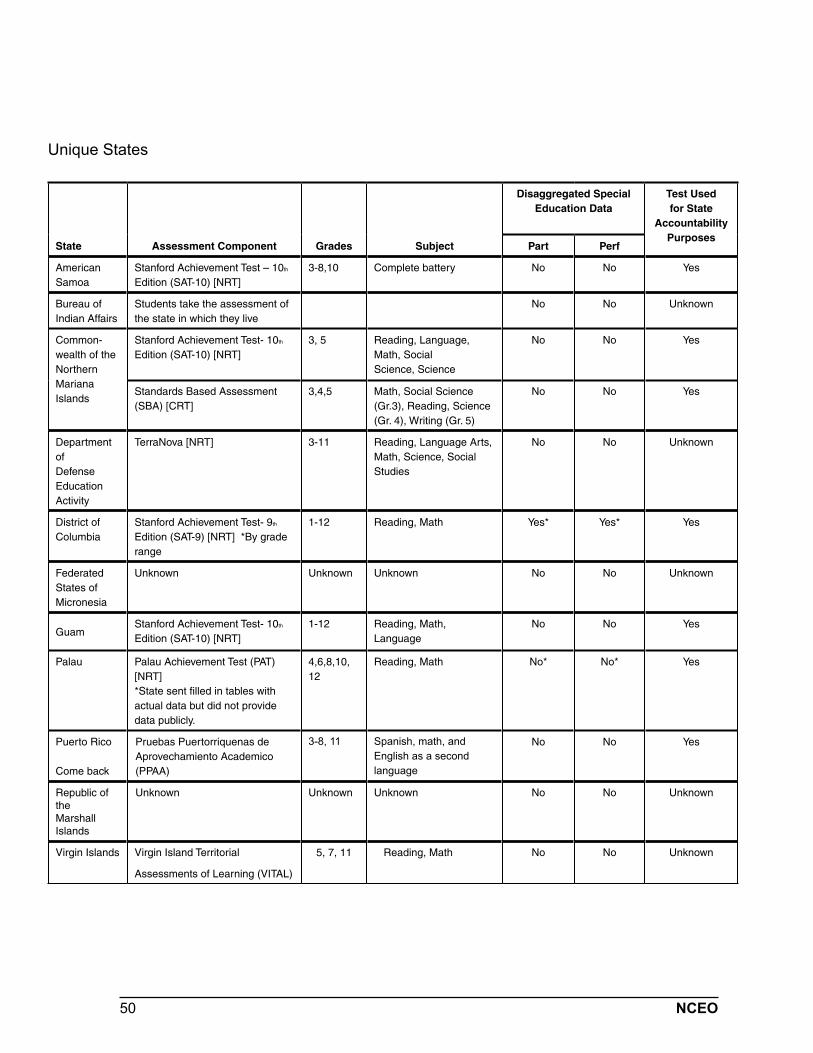
50 NCEO
Unique States
State Assessment Component Grades Subject
Disaggregated Special Education Data
Test Used for State
Accountability Purposes
Part Perf
American Samoa
Stanford Achievement Test – 10th
Edition (SAT-10) [NRT] 3-8,10 Complete battery No No Yes
Bureau of Indian Affairs
Students take the assessment of the state in which they live
No No Unknown
Common-wealth of the NorthernMariana Islands
Stanford Achievement Test- 10th
Edition (SAT-10) [NRT] 3, 5 Reading, Language,
Math, Social Science, Science
No No Yes
Standards Based Assessment (SBA) [CRT]
3,4,5 Math, Social Science (Gr.3), Reading, Science (Gr. 4), Writing (Gr. 5)
No No Yes
Department of Defense Education Activity
TerraNova [NRT] 3-11 Reading, Language Arts, Math, Science, Social Studies
No No Unknown
District of Columbia
Stanford Achievement Test- 9th
Edition (SAT-9) [NRT] *By grade range
1-12 Reading, Math Yes* Yes* Yes
Federated States of Micronesia
Unknown Unknown Unknown No No Unknown
Guam Stanford Achievement Test- 10th
Edition (SAT-10) [NRT] 1-12 Reading, Math,
Language No No Yes
Palau Palau Achievement Test (PAT)[NRT] *State sent filled in tables with actual data but did not provide data publicly.
4,6,8,10, 12
Reading, Math No* No* Yes
Puerto Rico
Come back
Pruebas Puertorriquenas de Aprovechamiento Academico (PPAA)
3-8, 11 Spanish, math, and English as a second language
No No Yes
Republic of the Marshall Islands
Unknown Unknown Unknown No No Unknown
Virgin Islands Virgin Island Territorial
Assessments of Learning (VITAL)
5, 7, 11 Reading, Math No No Unknown
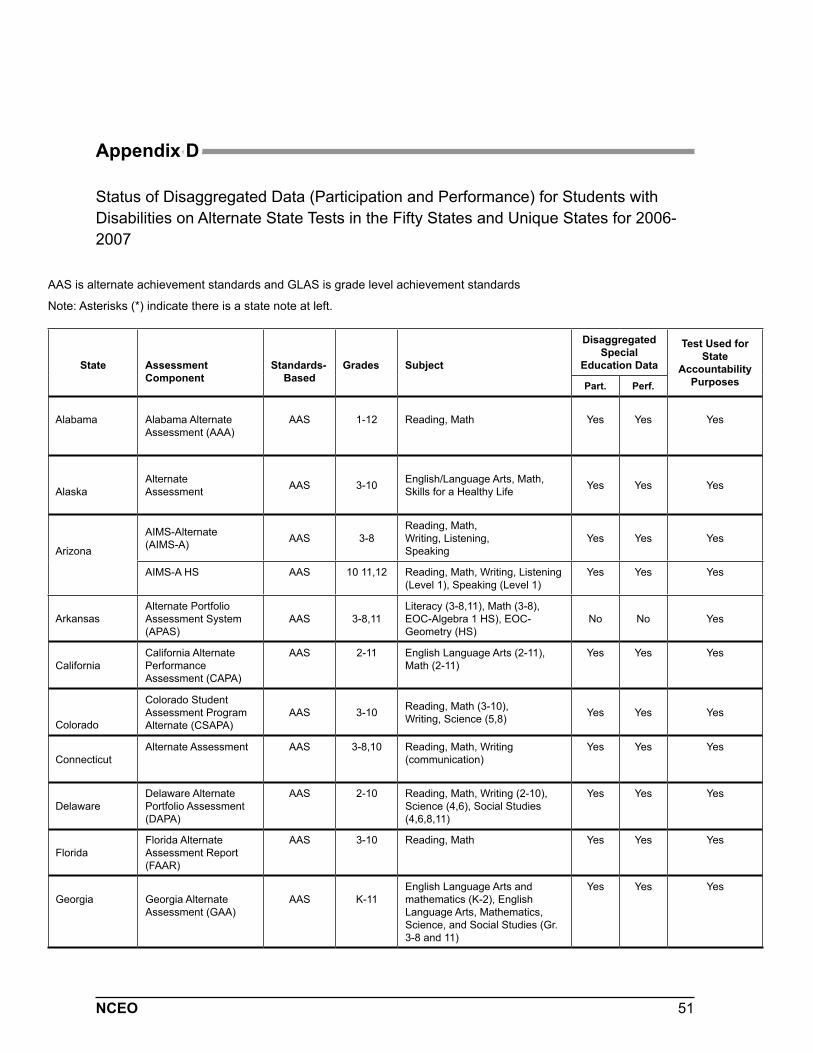
51NCEO
Appendix D
Status of Disaggregated Data (Participation and Performance) for Students with Disabilities on Alternate State Tests in the Fifty States and Unique States for 2006-2007
AAS is alternate achievement standards and GLAS is grade level achievement standards
Note: Asterisks (*) indicate there is a state note at left.
State Assessment Component
Standards-Based
Grades Subject
Disaggregated Special
Education Data
Test Used for State
Accountability PurposesPart. Perf.
Alabama Alabama Alternate Assessment (AAA)
AAS 1-12 Reading, Math Yes Yes Yes
Alaska Alternate Assessment AAS 3-10 English/Language Arts, Math,
Skills for a Healthy Life Yes Yes Yes
Arizona
AIMS-Alternate (AIMS-A) AAS 3-8
Reading, Math, Writing, Listening, Speaking
Yes Yes Yes
AIMS-A HS AAS 10 11,12 Reading, Math, Writing, Listening (Level 1), Speaking (Level 1)
Yes Yes Yes
Arkansas Alternate Portfolio Assessment System (APAS)
AAS 3-8,11 Literacy (3-8,11), Math (3-8), EOC-Algebra 1 HS), EOC-Geometry (HS)
No No Yes
California California Alternate Performance Assessment (CAPA)
AAS 2-11 English Language Arts (2-11), Math (2-11)
Yes Yes Yes
Colorado
Colorado Student Assessment Program Alternate (CSAPA)
AAS 3-10 Reading, Math (3-10), Writing, Science (5,8) Yes Yes Yes
Connecticut Alternate Assessment AAS 3-8,10 Reading, Math, Writing
(communication)Yes Yes Yes
Delaware Delaware Alternate Portfolio Assessment (DAPA)
AAS 2-10 Reading, Math, Writing (2-10), Science (4,6), Social Studies (4,6,8,11)
Yes Yes Yes
Florida Florida Alternate Assessment Report (FAAR)
AAS 3-10 Reading, Math Yes Yes Yes
Georgia Georgia Alternate Assessment (GAA)
AAS K-11 English Language Arts and mathematics (K-2), English Language Arts, Mathematics, Science, and Social Studies (Gr. 3-8 and 11)
Yes Yes Yes
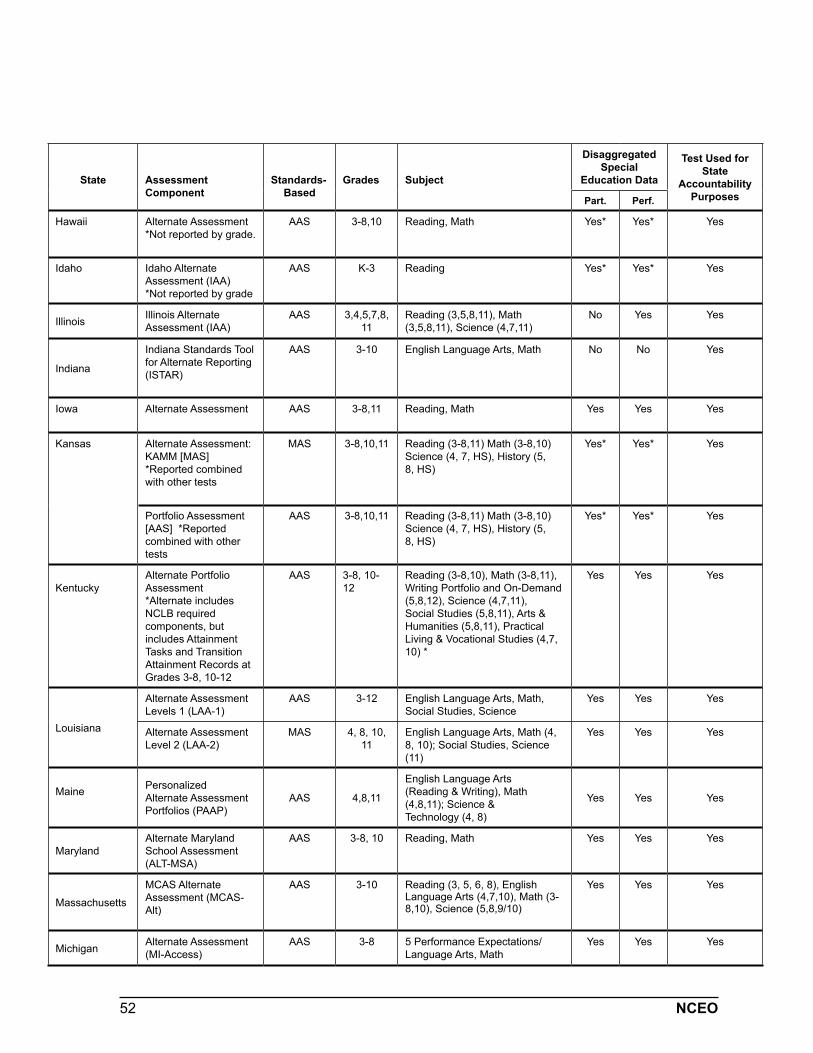
52 NCEO
State Assessment Component
Standards-Based
Grades Subject
Disaggregated Special
Education Data
Test Used for State
Accountability PurposesPart. Perf.
Hawaii Alternate Assessment *Not reported by grade.
AAS 3-8,10 Reading, Math Yes* Yes* Yes
Idaho Idaho Alternate Assessment (IAA) *Not reported by grade
AAS K-3 Reading Yes* Yes* Yes
Illinois Illinois Alternate Assessment (IAA)
AAS 3,4,5,7,8, 11
Reading (3,5,8,11), Math (3,5,8,11), Science (4,7,11)
No Yes Yes
Indiana
Indiana Standards Tool for Alternate Reporting (ISTAR)
AAS 3-10 English Language Arts, Math No No Yes
Iowa Alternate Assessment AAS 3-8,11 Reading, Math Yes Yes Yes
Kansas Alternate Assessment: KAMM [MAS] *Reported combined with other tests
MAS 3-8,10,11 Reading (3-8,11) Math (3-8,10) Science (4, 7, HS), History (5, 8, HS)
Yes* Yes* Yes
Portfolio Assessment [AAS] *Reported combined with other tests
AAS 3-8,10,11 Reading (3-8,11) Math (3-8,10) Science (4, 7, HS), History (5, 8, HS)
Yes* Yes* Yes
Kentucky Alternate Portfolio Assessment *Alternate includes NCLB required components, but includes Attainment Tasks and Transition Attainment Records at Grades 3-8, 10-12
AAS 3-8, 10-12
Reading (3-8,10), Math (3-8,11), Writing Portfolio and On-Demand (5,8,12), Science (4,7,11), Social Studies (5,8,11), Arts & Humanities (5,8,11), Practical Living & Vocational Studies (4,7, 10) *
Yes Yes Yes
Louisiana
Alternate Assessment Levels 1 (LAA-1)
AAS 3-12 English Language Arts, Math, Social Studies, Science
Yes Yes Yes
Alternate Assessment Level 2 (LAA-2)
MAS 4, 8, 10, 11
English Language Arts, Math (4, 8, 10); Social Studies, Science (11)
Yes Yes Yes
Maine
Personalized Alternate Assessment Portfolios (PAAP)
AAS 4,8,11
English Language Arts (Reading & Writing), Math (4,8,11); Science & Technology (4, 8)
Yes Yes Yes
Maryland Alternate Maryland School Assessment (ALT-MSA)
AAS 3-8, 10 Reading, Math Yes Yes Yes
Massachusetts
MCAS Alternate Assessment (MCAS-Alt)
AAS 3-10 Reading (3, 5, 6, 8), English Language Arts (4,7,10), Math (3-8,10), Science (5,8,9/10)
Yes Yes Yes
Michigan Alternate Assessment (MI-Access)
AAS 3-8 5 Performance Expectations/ Language Arts, Math
Yes Yes Yes
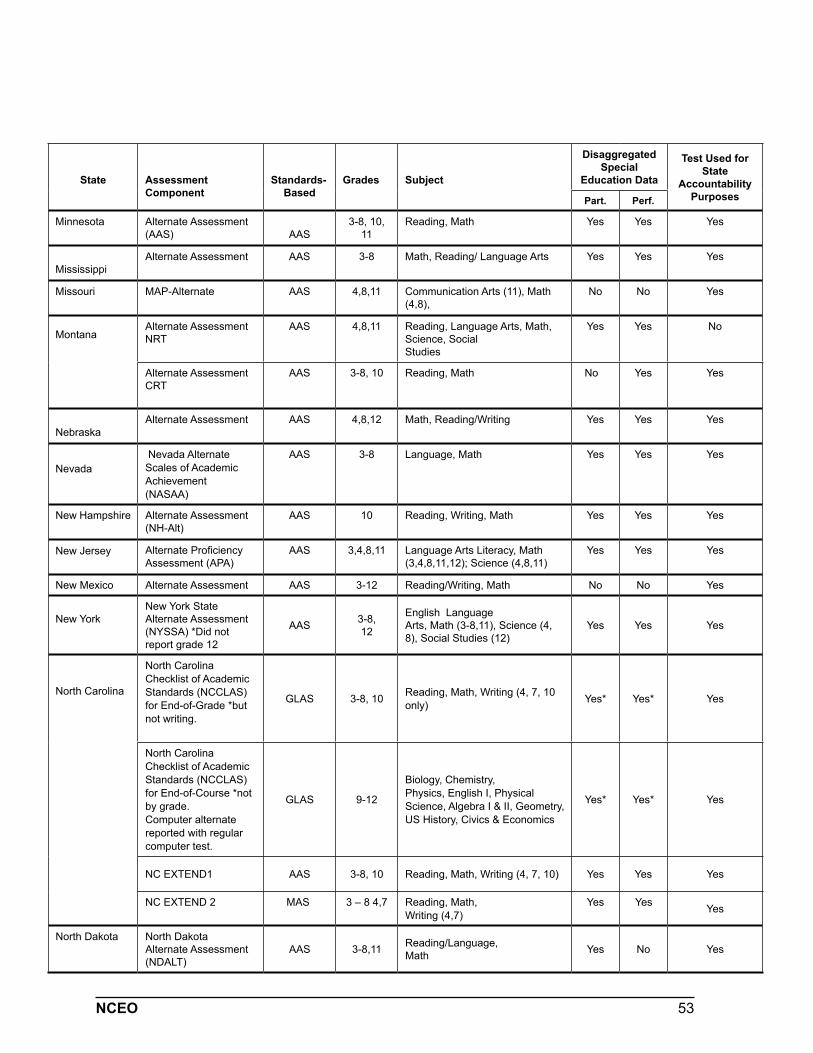
53NCEO
State Assessment Component
Standards-Based
Grades Subject
Disaggregated Special
Education Data
Test Used for State
Accountability PurposesPart. Perf.
Minnesota Alternate Assessment (AAS) AAS
3-8, 10, 11
Reading, Math Yes Yes Yes
Mississippi Alternate Assessment AAS 3-8 Math, Reading/ Language Arts Yes Yes Yes
Missouri MAP-Alternate AAS 4,8,11 Communication Arts (11), Math (4,8),
No No Yes
Montana Alternate Assessment NRT
AAS 4,8,11
Reading, Language Arts, Math, Science, Social Studies
Yes Yes No
Alternate Assessment CRT
AAS 3-8, 10 Reading, Math No Yes Yes
Nebraska Alternate Assessment AAS 4,8,12 Math, Reading/Writing Yes Yes Yes
Nevada Nevada Alternate Scales of Academic Achievement(NASAA)
AAS 3-8 Language, Math Yes Yes Yes
New Hampshire Alternate Assessment (NH-Alt)
AAS 10 Reading, Writing, Math Yes Yes Yes
New Jersey Alternate Proficiency Assessment (APA)
AAS 3,4,8,11 Language Arts Literacy, Math (3,4,8,11,12); Science (4,8,11)
Yes Yes Yes
New Mexico Alternate Assessment AAS 3-12 Reading/Writing, Math No No Yes
New York New York State Alternate Assessment (NYSSA) *Did not report grade 12
AAS 3-8, 12
English Language Arts, Math (3-8,11), Science (4, 8), Social Studies (12)
Yes Yes Yes
North Carolina
North Carolina Checklist of Academic Standards (NCCLAS) for End-of-Grade *but not writing.
GLAS 3-8, 10 Reading, Math, Writing (4, 7, 10 only) Yes* Yes* Yes
North Carolina Checklist of Academic Standards (NCCLAS) for End-of-Course *not by grade.Computer alternate reported with regular computer test.
GLAS 9-12
Biology, Chemistry, Physics, English I, Physical Science, Algebra I & II, Geometry, US History, Civics & Economics
Yes* Yes* Yes
NC EXTEND1 AAS 3-8, 10 Reading, Math, Writing (4, 7, 10) Yes Yes Yes
NC EXTEND 2 MAS 3 – 8 4,7 Reading, Math, Writing (4,7)
Yes Yes Yes
North Dakota North Dakota Alternate Assessment (NDALT)
AAS 3-8,11 Reading/Language, Math Yes No Yes
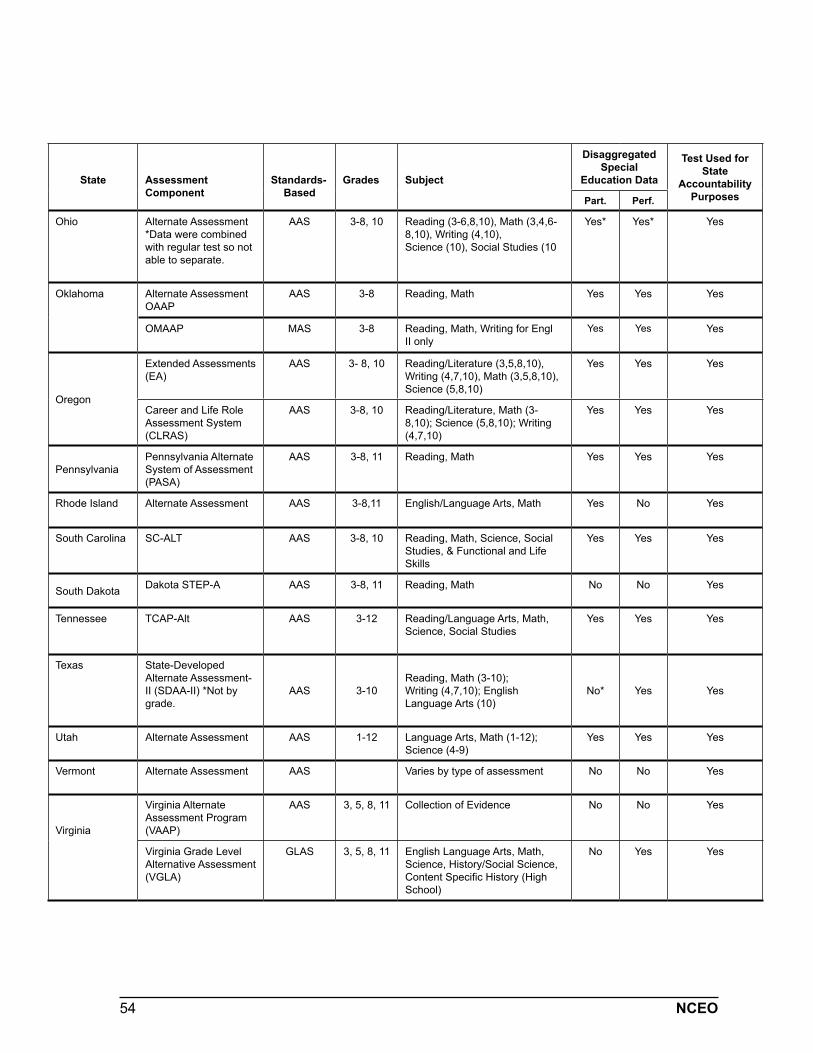
54 NCEO
State Assessment Component
Standards-Based
Grades Subject
Disaggregated Special
Education Data
Test Used for State
Accountability PurposesPart. Perf.
Ohio Alternate Assessment *Data were combined with regular test so not able to separate.
AAS 3-8, 10 Reading (3-6,8,10), Math (3,4,6-8,10), Writing (4,10), Science (10), Social Studies (10
Yes* Yes* Yes
Oklahoma Alternate AssessmentOAAP
AAS 3-8 Reading, Math Yes Yes Yes
OMAAP MAS 3-8 Reading, Math, Writing for Engl II only
Yes Yes Yes
Oregon
Extended Assessments (EA)
AAS 3- 8, 10 Reading/Literature (3,5,8,10), Writing (4,7,10), Math (3,5,8,10), Science (5,8,10)
Yes Yes Yes
Career and Life Role Assessment System (CLRAS)
AAS 3-8, 10 Reading/Literature, Math (3-8,10); Science (5,8,10); Writing (4,7,10)
Yes Yes Yes
Pennsylvania Pennsylvania Alternate System of Assessment (PASA)
AAS 3-8, 11 Reading, Math Yes Yes Yes
Rhode Island Alternate Assessment AAS 3-8,11 English/Language Arts, Math Yes No Yes
South Carolina SC-ALT AAS 3-8, 10 Reading, Math, Science, Social Studies, & Functional and Life Skills
Yes Yes Yes
South Dakota Dakota STEP-A AAS 3-8, 11 Reading, Math No No Yes
Tennessee TCAP-Alt AAS 3-12 Reading/Language Arts, Math, Science, Social Studies
Yes Yes Yes
Texas State-Developed Alternate Assessment-II (SDAA-II) *Not by grade.
AAS 3-10 Reading, Math (3-10); Writing (4,7,10); English Language Arts (10)
No* Yes Yes
Utah Alternate Assessment AAS 1-12 Language Arts, Math (1-12); Science (4-9)
Yes Yes Yes
Vermont Alternate Assessment AAS Varies by type of assessment No No Yes
Virginia
Virginia Alternate Assessment Program (VAAP)
AAS 3, 5, 8, 11 Collection of Evidence No No Yes
Virginia Grade Level Alternative Assessment (VGLA)
GLAS 3, 5, 8, 11 English Language Arts, Math, Science, History/Social Science, Content Specific History (High School)
No Yes Yes
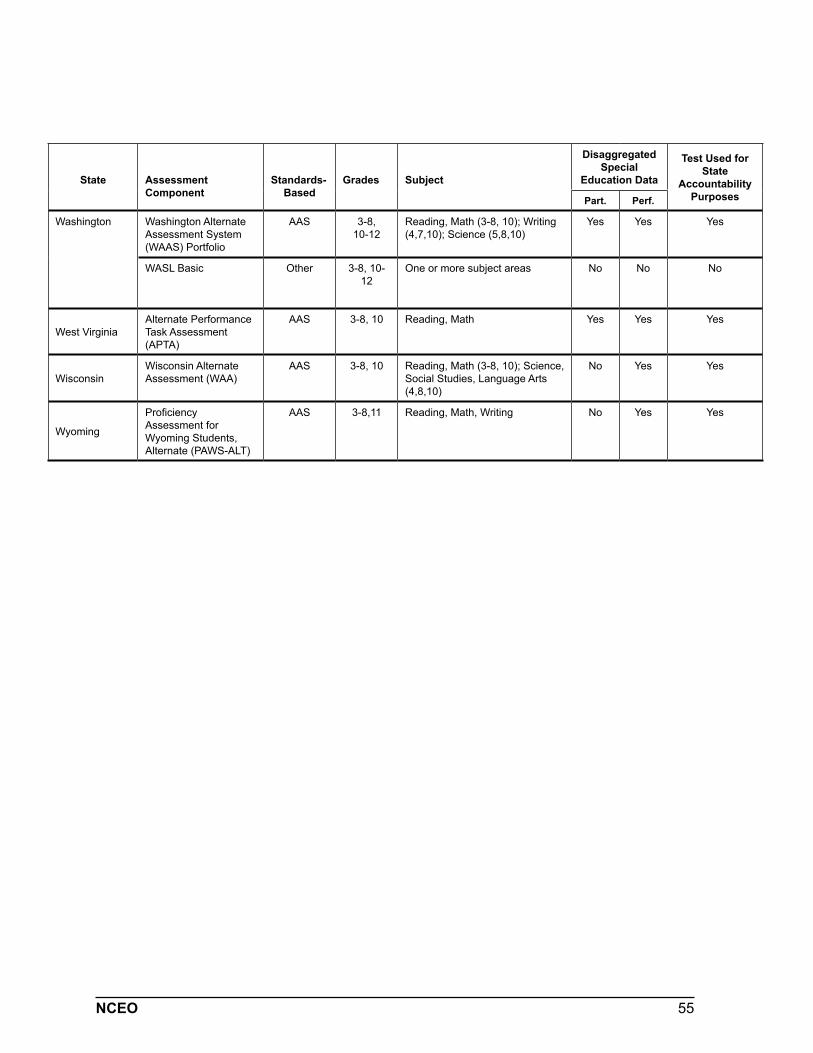
55NCEO
State Assessment Component
Standards-Based
Grades Subject
Disaggregated Special
Education Data
Test Used for State
Accountability PurposesPart. Perf.
Washington Washington Alternate Assessment System (WAAS) Portfolio
AAS 3-8, 10-12
Reading, Math (3-8, 10); Writing (4,7,10); Science (5,8,10)
Yes Yes Yes
WASL Basic Other 3-8, 10-12
One or more subject areas No No No
West Virginia Alternate Performance Task Assessment (APTA)
AAS 3-8, 10 Reading, Math Yes Yes Yes
Wisconsin Wisconsin Alternate Assessment (WAA)
AAS 3-8, 10 Reading, Math (3-8, 10); Science, Social Studies, Language Arts (4,8,10)
No Yes Yes
Wyoming
Proficiency Assessment for Wyoming Students, Alternate (PAWS-ALT)
AAS 3-8,11 Reading, Math, Writing No Yes Yes
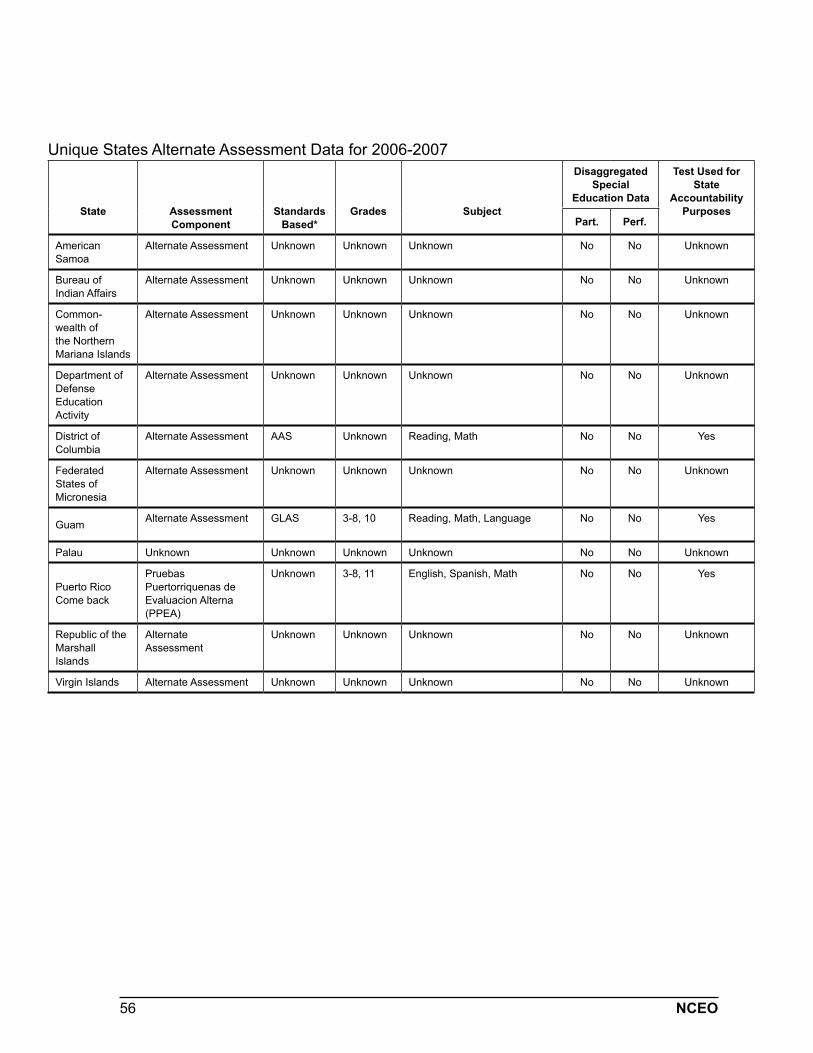
56 NCEO
Unique States Alternate Assessment Data for 2006-2007
State AssessmentComponent
StandardsBased*
Grades Subject
Disaggregated Special
Education Data
Test Used for State
Accountability Purposes
Part. Perf.
American Samoa
Alternate Assessment Unknown Unknown Unknown No No Unknown
Bureau of Indian Affairs
Alternate Assessment Unknown Unknown Unknown No No Unknown
Common-wealth of the Northern Mariana Islands
Alternate Assessment Unknown Unknown Unknown No No Unknown
Department of DefenseEducationActivity
Alternate Assessment Unknown Unknown Unknown No No Unknown
District of Columbia
Alternate Assessment AAS Unknown Reading, Math No No Yes
FederatedStates ofMicronesia
Alternate Assessment Unknown Unknown Unknown No No Unknown
Guam Alternate Assessment GLAS 3-8, 10 Reading, Math, Language No No Yes
Palau Unknown Unknown Unknown Unknown No No Unknown
Puerto RicoCome back
Pruebas Puertorriquenas de Evaluacion Alterna (PPEA)
Unknown 3-8, 11 English, Spanish, Math No No Yes
Republic of theMarshall Islands
Alternate Assessment
Unknown Unknown Unknown No No Unknown
Virgin Islands Alternate Assessment Unknown Unknown Unknown No No Unknown
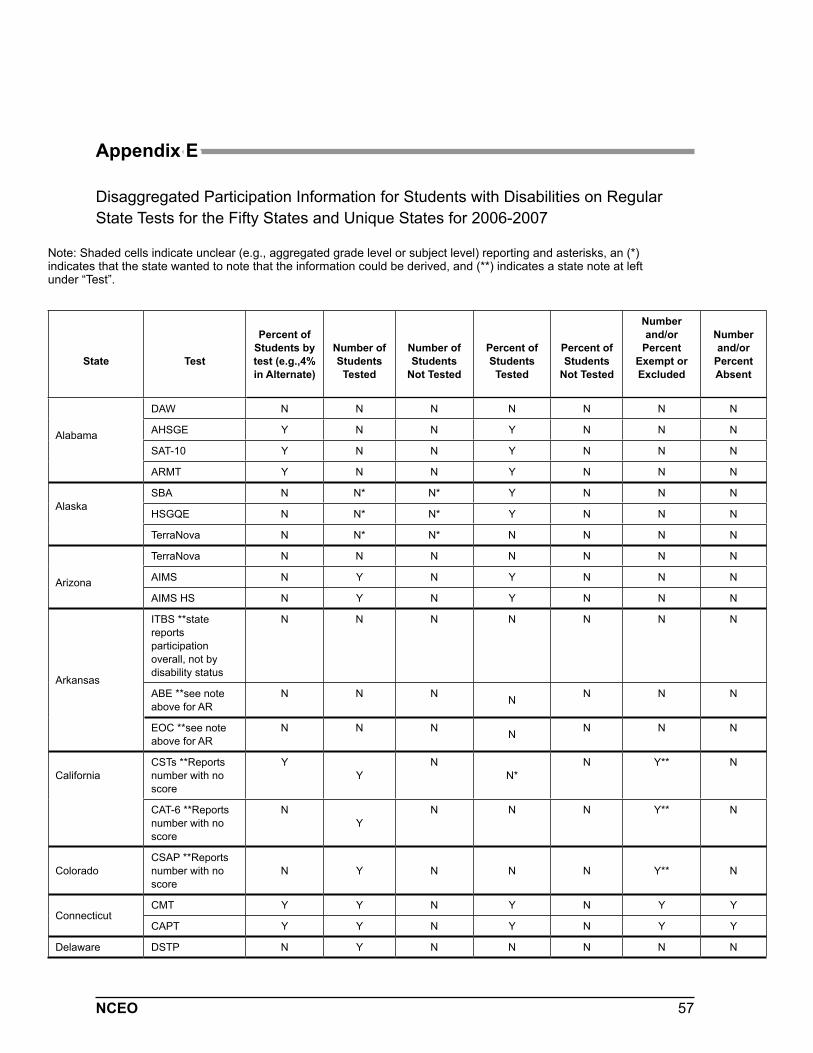
57NCEO
Appendix E
Disaggregated Participation Information for Students with Disabilities on Regular State Tests for the Fifty States and Unique States for 2006-2007
Note: Shaded cells indicate unclear (e.g., aggregated grade level or subject level) reporting and asterisks, an (*) indicates that the state wanted to note that the information could be derived, and (**) indicates a state note at left under “Test”.
State Test
Percent of Students by test (e.g.,4% in Alternate)
Number of Students
Tested
Number of Students
Not Tested
Percent of Students
Tested
Percent of Students
Not Tested
Number and/or
Percent Exempt or Excluded
Number and/or
Percent Absent
Alabama
DAW N N N N N N N
AHSGE Y N N Y N N N
SAT-10 Y N N Y N N N
ARMT Y N N Y N N N
AlaskaSBA N N* N* Y N N N
HSGQE N N* N* Y N N N
TerraNova N N* N* N N N N
Arizona
TerraNova N N N N N N N
AIMS N Y N Y N N N
AIMS HS N Y N Y N N N
Arkansas
ITBS **state reports participation overall, not by disability status
N N N N N N N
ABE **see note above for AR
N N N N N N N
EOC **see note above for AR
N N N N N N N
CaliforniaCSTs **Reports number with no score
YY
NN*
N Y** N
CAT-6 **Reports number with no score
NY
N N N Y** N
Colorado CSAP **Reports number with no score
N Y N N N Y** N
ConnecticutCMT Y Y N Y N Y Y
CAPT Y Y N Y N Y Y
Delaware DSTP N Y N N N N N
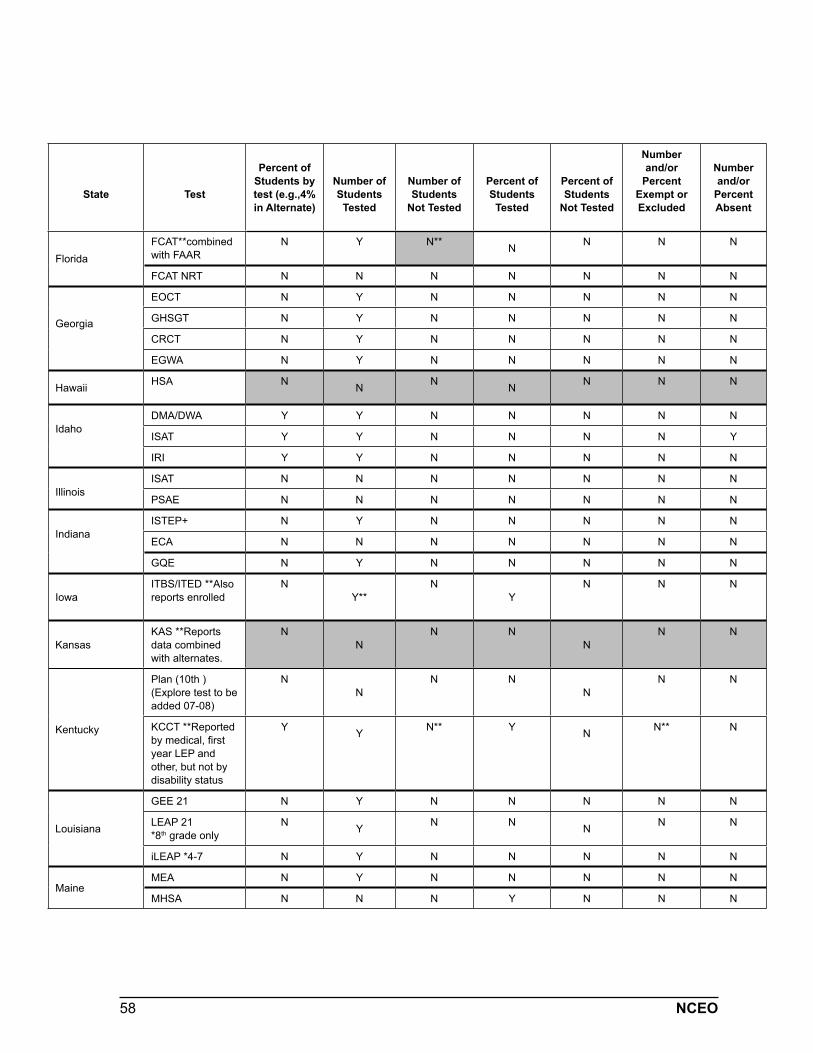
58 NCEO
State Test
Percent of Students by test (e.g.,4% in Alternate)
Number of Students
Tested
Number of Students
Not Tested
Percent of Students
Tested
Percent of Students
Not Tested
Number and/or
Percent Exempt or Excluded
Number and/or
Percent Absent
FloridaFCAT**combined with FAAR
N Y N** N N N N
FCAT NRT N N N N N N N
Georgia
EOCT N Y N N N N N
GHSGT N Y N N N N N
CRCT N Y N N N N N
EGWA N Y N N N N N
Hawaii HSA N N N N N N N
Idaho DMA/DWA Y Y N N N N N
ISAT Y Y N N N N Y
IRI Y Y N N N N N
Illinois ISAT N N N N N N N
PSAE N N N N N N N
Indiana ISTEP+ N Y N N N N N
ECA N N N N N N N
GQE N Y N N N N N
Iowa ITBS/ITED **Also reports enrolled
NY**
NY
N N N
Kansas KAS **Reports data combined with alternates.
NN
N NN
N N
Kentucky
Plan (10th )(Explore test to be added 07-08)
NN
N NN
N N
KCCT **Reported by medical, first year LEP and other, but not by disability status
Y Y N** Y N N** N
Louisiana
GEE 21 N Y N N N N N
LEAP 21*8th grade only
N Y N N N N N
iLEAP *4-7 N Y N N N N N
Maine MEA N Y N N N N N
MHSA N N N Y N N N
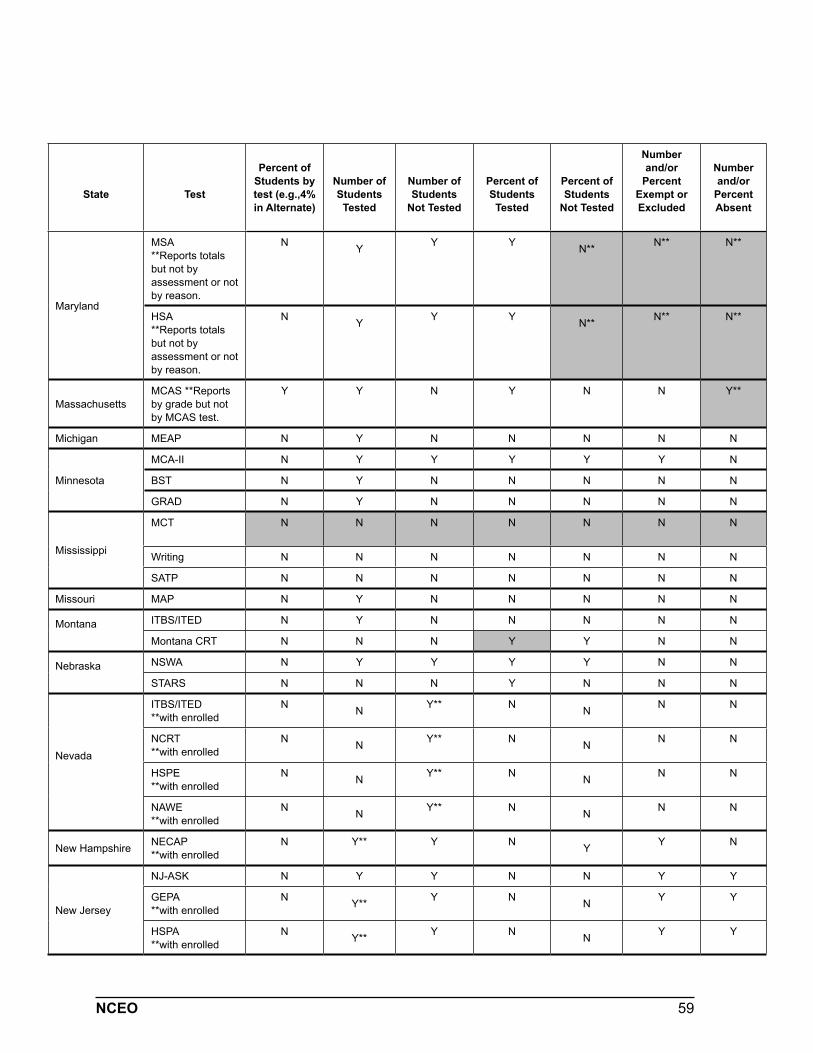
59NCEO
State Test
Percent of Students by test (e.g.,4% in Alternate)
Number of Students
Tested
Number of Students
Not Tested
Percent of Students
Tested
Percent of Students
Not Tested
Number and/or
Percent Exempt or Excluded
Number and/or
Percent Absent
Maryland
MSA**Reports totals but not by assessment or not by reason.
N Y Y Y N** N** N**
HSA**Reports totals but not by assessment or not by reason.
N Y Y Y N** N** N**
MassachusettsMCAS **Reports by grade but not by MCAS test.
Y Y N Y N N Y**
Michigan MEAP N Y N N N N N
Minnesota
MCA-II N Y Y Y Y Y N
BST N Y N N N N N
GRAD N Y N N N N N
Mississippi
MCT N N N N N N N
Writing N N N N N N N
SATP N N N N N N N
Missouri MAP N Y N N N N N
Montana ITBS/ITED N Y N N N N N
Montana CRT N N N Y Y N N
Nebraska NSWA N Y Y Y Y N N
STARS N N N Y N N N
Nevada
ITBS/ITED**with enrolled
N N Y** N N N N
NCRT **with enrolled
N N Y** N N N N
HSPE **with enrolled
N N Y** N N N N
NAWE **with enrolled
N N Y** N N N N
New Hampshire NECAP**with enrolled
N Y** Y N Y Y N
New Jersey
NJ-ASK N Y Y N N Y Y
GEPA**with enrolled
N Y** Y N N Y Y
HSPA**with enrolled
N Y** Y N N Y Y
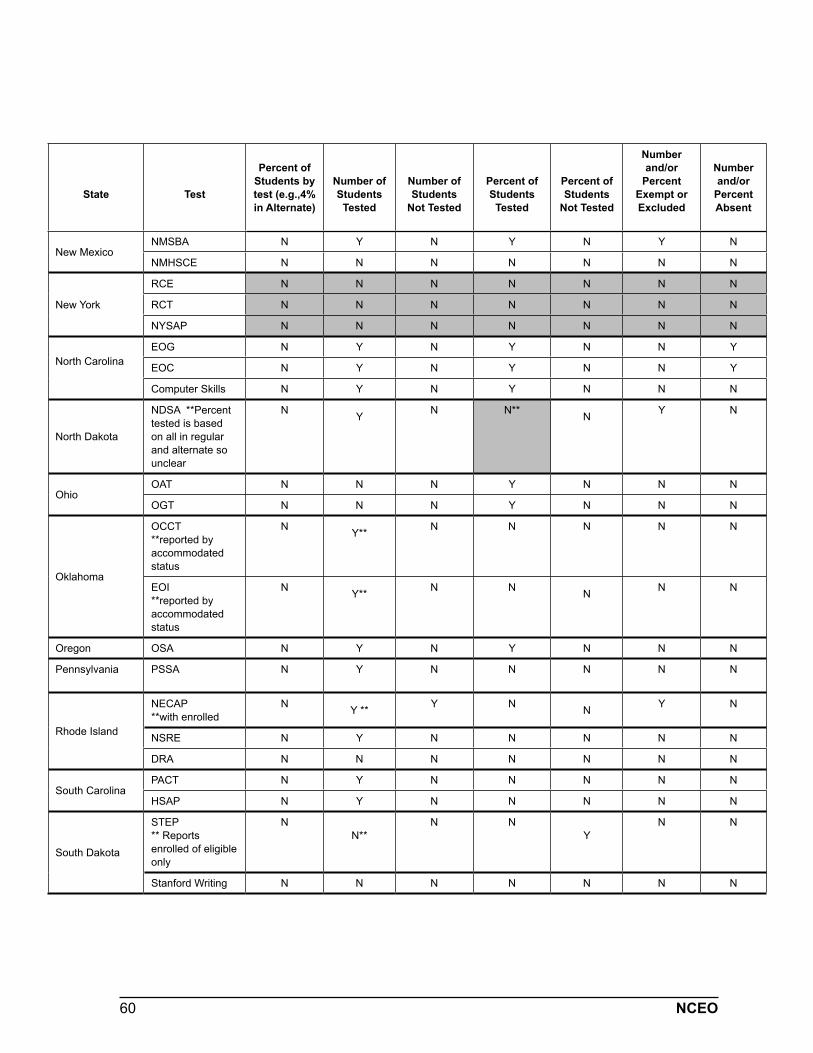
60 NCEO
State Test
Percent of Students by test (e.g.,4% in Alternate)
Number of Students
Tested
Number of Students
Not Tested
Percent of Students
Tested
Percent of Students
Not Tested
Number and/or
Percent Exempt or Excluded
Number and/or
Percent Absent
New MexicoNMSBA N Y N Y N Y N
NMHSCE N N N N N N N
New York
RCE N N N N N N N
RCT N N N N N N N
NYSAP N N N N N N N
North CarolinaEOG N Y N Y N N Y
EOC N Y N Y N N Y
Computer Skills N Y N Y N N N
North Dakota
NDSA **Percent tested is based on all in regular and alternate so unclear
N Y N N** N Y N
OhioOAT N N N Y N N N
OGT N N N Y N N N
Oklahoma
OCCT **reported by accommodated status
N Y** N N N N N
EOI **reported by accommodated status
N Y** N N N N N
Oregon OSA N Y N Y N N N
Pennsylvania PSSA N Y N N N N N
Rhode Island
NECAP**with enrolled
N Y ** Y N N Y N
NSRE N Y N N N N N
DRA N N N N N N N
South CarolinaPACT N Y N N N N N
HSAP N Y N N N N N
South Dakota
STEP ** Reports enrolled of eligible only
NN**
N NY
N N
Stanford Writing N N N N N N N
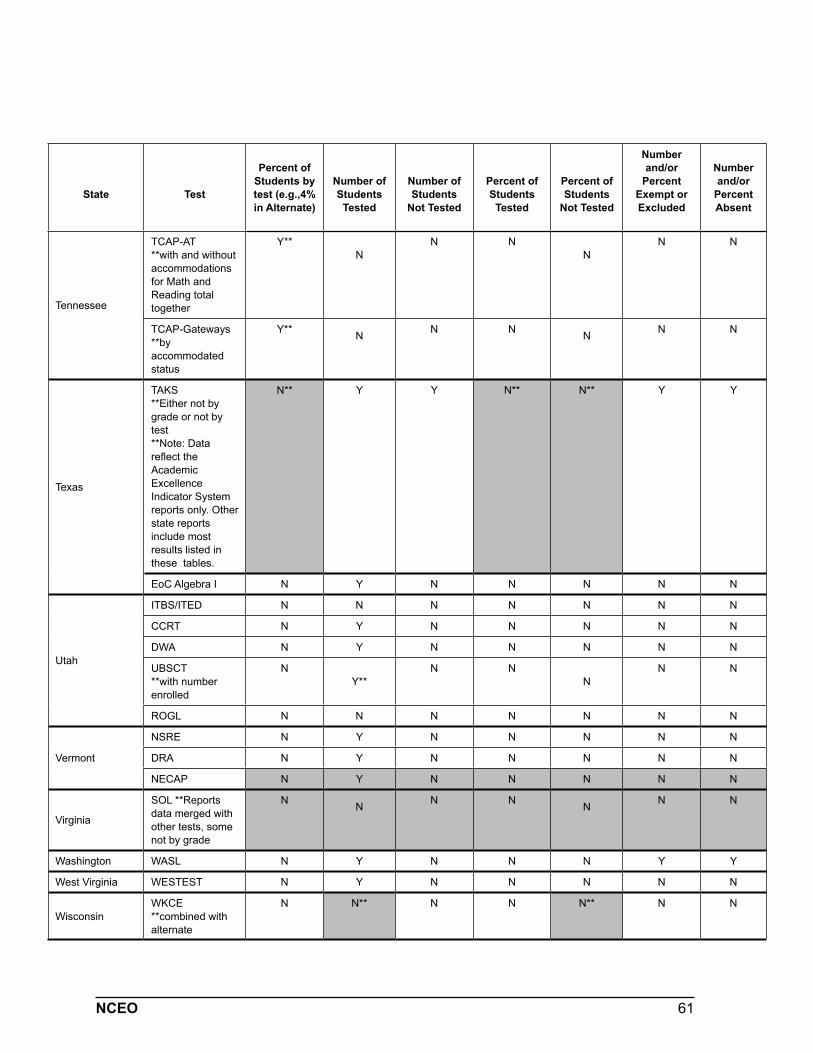
61NCEO
State Test
Percent of Students by test (e.g.,4% in Alternate)
Number of Students
Tested
Number of Students
Not Tested
Percent of Students
Tested
Percent of Students
Not Tested
Number and/or
Percent Exempt or Excluded
Number and/or
Percent Absent
Tennessee
TCAP-AT**with and without accommodations for Math and Reading total together
Y**N
N NN
N N
TCAP-Gateways**by accommodated status
Y** N N N N N N
Texas
TAKS**Either not by grade or not by test**Note: Data reflect the Academic Excellence Indicator System reports only. Other state reports include most results listed in these tables.
N** Y Y N** N** Y Y
EoC Algebra I N Y N N N N N
Utah
ITBS/ITED N N N N N N N
CCRT N Y N N N N N
DWA N Y N N N N N
UBSCT**with number enrolled
NY**
N NN
N N
ROGL N N N N N N N
Vermont
NSRE N Y N N N N N
DRA N Y N N N N N
NECAP N Y N N N N N
Virginia
SOL **Reports data merged with other tests, some not by grade
N N N N N N N
Washington WASL N Y N N N Y Y
West Virginia WESTEST N Y N N N N N
WisconsinWKCE**combined with alternate
N N** N N N** N N
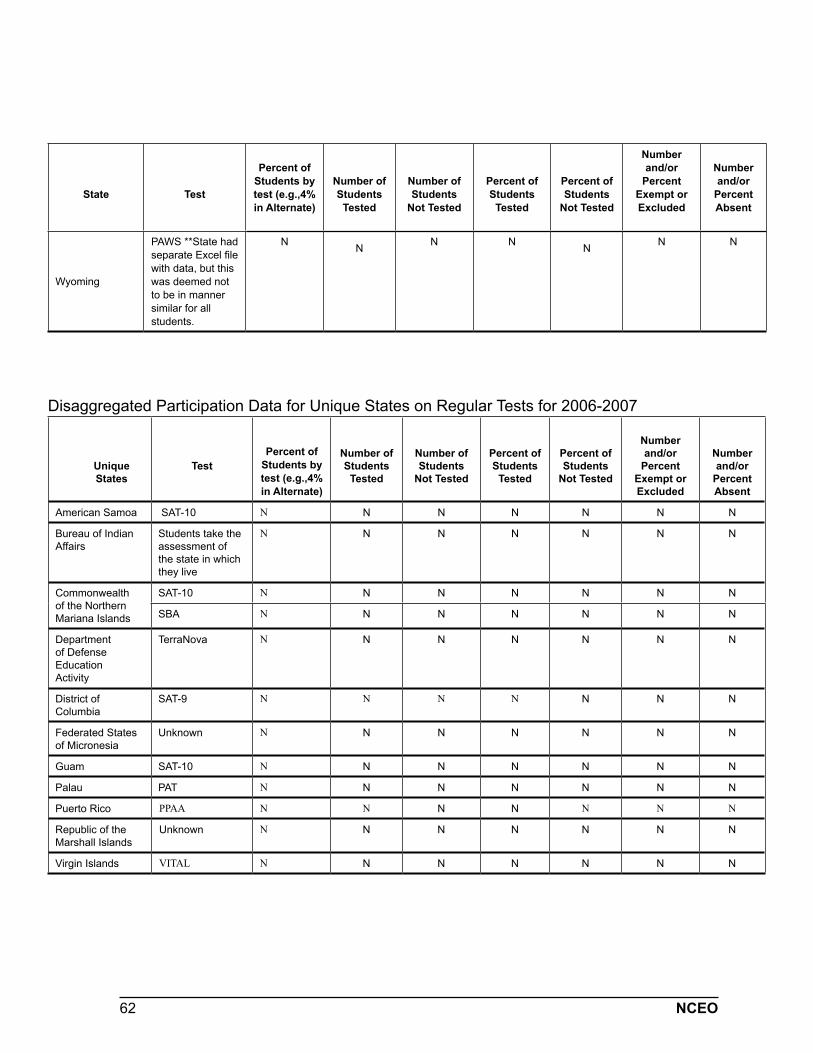
62 NCEO
State Test
Percent of Students by test (e.g.,4% in Alternate)
Number of Students
Tested
Number of Students
Not Tested
Percent of Students
Tested
Percent of Students
Not Tested
Number and/or
Percent Exempt or Excluded
Number and/or
Percent Absent
Wyoming
PAWS **State had separate Excel file with data, but this was deemed not to be in manner similar for all students.
N N N N N N N
Disaggregated Participation Data for Unique States on Regular Tests for 2006-2007
UniqueStates
TestPercent of
Students by test (e.g.,4% in Alternate)
Number of Students
Tested
Number of Students
Not Tested
Percent of Students
Tested
Percent of Students
Not Tested
Number and/or
Percent Exempt or Excluded
Number and/or
Percent Absent
American Samoa SAT-10 N N N N N N N
Bureau of Indian Affairs
Students take the assessment of the state in which they live
N N N N N N N
Commonwealth of the Northern Mariana Islands
SAT-10 N N N N N N N
SBA N N N N N N N
Department of Defense EducationActivity
TerraNova N N N N N N N
District of Columbia
SAT-9 N N N N N N N
Federated States of Micronesia
Unknown N N N N N N N
Guam SAT-10 N N N N N N N
Palau PAT N N N N N N N
Puerto Rico PPAA N N N N N N N
Republic of the Marshall Islands
Unknown N N N N N N N
Virgin Islands VITAL N N N N N N N
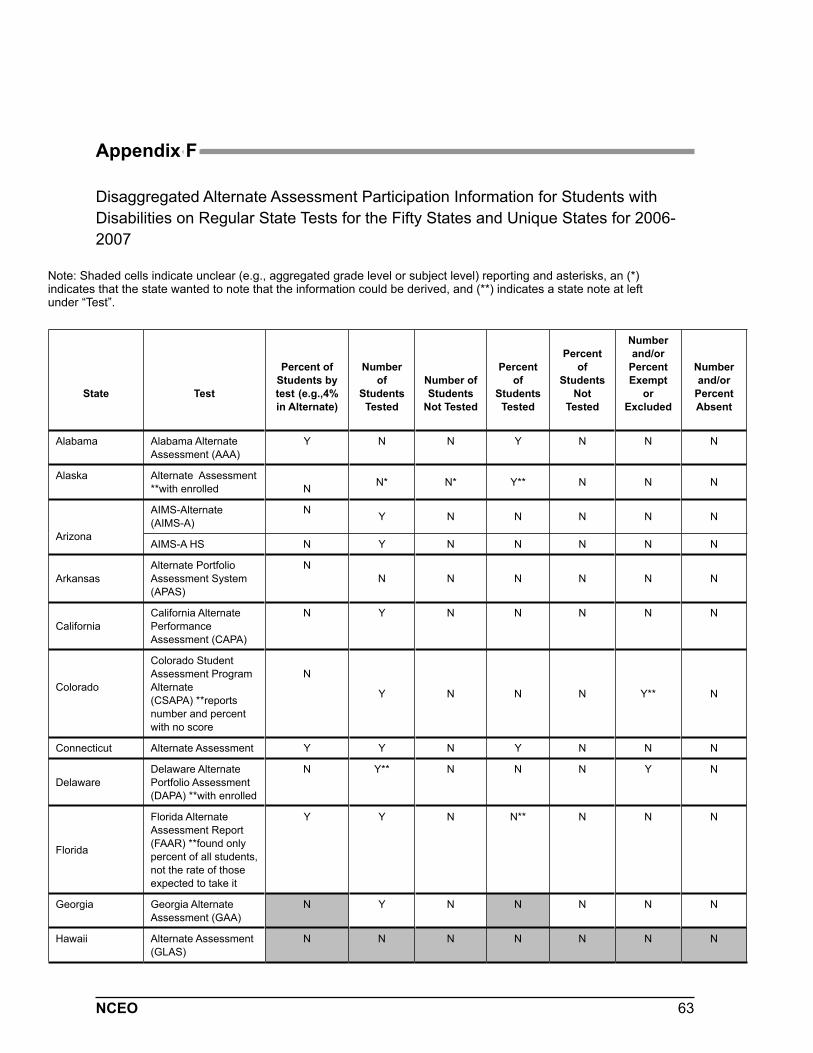
63NCEO
Appendix F
Disaggregated Alternate Assessment Participation Information for Students with Disabilities on Regular State Tests for the Fifty States and Unique States for 2006-2007
Note: Shaded cells indicate unclear (e.g., aggregated grade level or subject level) reporting and asterisks, an (*) indicates that the state wanted to note that the information could be derived, and (**) indicates a state note at left under “Test”.
State Test
Percent of Students by test (e.g.,4% in Alternate)
Number of
Students Tested
Number of Students
Not Tested
Percent of
Students Tested
Percent of
Students Not
Tested
Number and/or
Percent Exempt
or Excluded
Number and/or
Percent Absent
Alabama Alabama Alternate Assessment (AAA)
Y N N Y N N N
Alaska Alternate Assessment **with enrolled N N* N* Y** N N N
Arizona
AIMS-Alternate (AIMS-A)
N Y N N N N N
AIMS-A HS N Y N N N N N
Arkansas Alternate Portfolio Assessment System (APAS)
NN N N N N N
California California Alternate Performance Assessment (CAPA)
N Y N N N N N
Colorado
Colorado Student Assessment Program Alternate (CSAPA) **reports number and percent with no score
N
Y N N N Y** N
Connecticut Alternate Assessment Y Y N Y N N N
Delaware Delaware Alternate Portfolio Assessment (DAPA) **with enrolled
N Y** N N N Y N
Florida
Florida Alternate Assessment Report (FAAR) **found only percent of all students, not the rate of those expected to take it
Y Y N N** N N N
Georgia Georgia Alternate Assessment (GAA)
N Y N N N N N
Hawaii Alternate Assessment (GLAS)
N N N N N N N
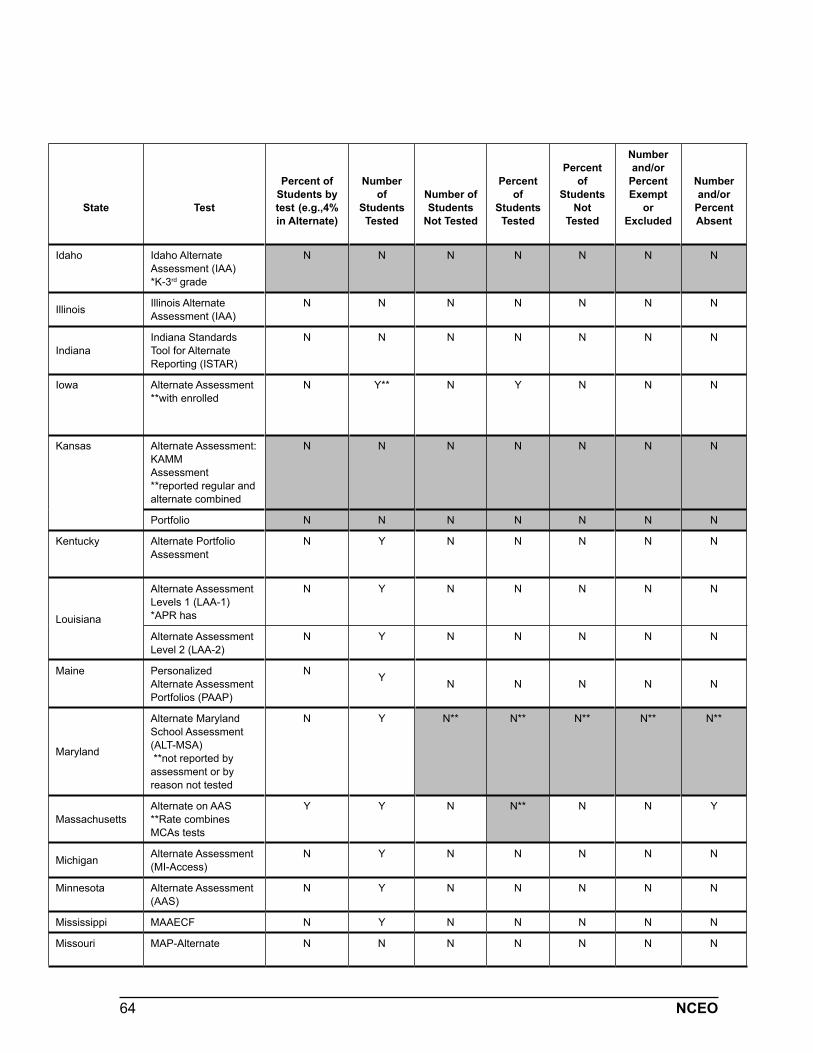
64 NCEO
State Test
Percent of Students by test (e.g.,4% in Alternate)
Number of
Students Tested
Number of Students
Not Tested
Percent of
Students Tested
Percent of
Students Not
Tested
Number and/or
Percent Exempt
or Excluded
Number and/or
Percent Absent
Idaho Idaho Alternate Assessment (IAA) *K-3rd grade
N N N N N N N
Illinois Illinois Alternate Assessment (IAA)
N N N N N N N
Indiana Indiana Standards Tool for Alternate Reporting (ISTAR)
N N N N N N N
Iowa Alternate Assessment**with enrolled
N Y** N Y N N N
Kansas Alternate Assessment: KAMM Assessment **reported regular and alternate combined
N N N N N N N
Portfolio N N N N N N N
Kentucky Alternate Portfolio Assessment
N Y N N N N N
Louisiana
Alternate Assessment Levels 1 (LAA-1) *APR has
N Y N N N N N
Alternate Assessment Level 2 (LAA-2)
N Y N N N N N
Maine Personalized Alternate Assessment Portfolios (PAAP)
N Y N N N N N
Maryland
Alternate Maryland School Assessment (ALT-MSA) **not reported by assessment or by reason not tested
N Y N** N** N** N** N**
Massachusetts Alternate on AAS**Rate combines MCAs tests
Y Y N N** N N Y
Michigan Alternate Assessment (MI-Access)
N Y N N N N N
Minnesota Alternate Assessment (AAS)
N Y N N N N N
Mississippi MAAECF N Y N N N N N
Missouri MAP-Alternate N N N N N N N
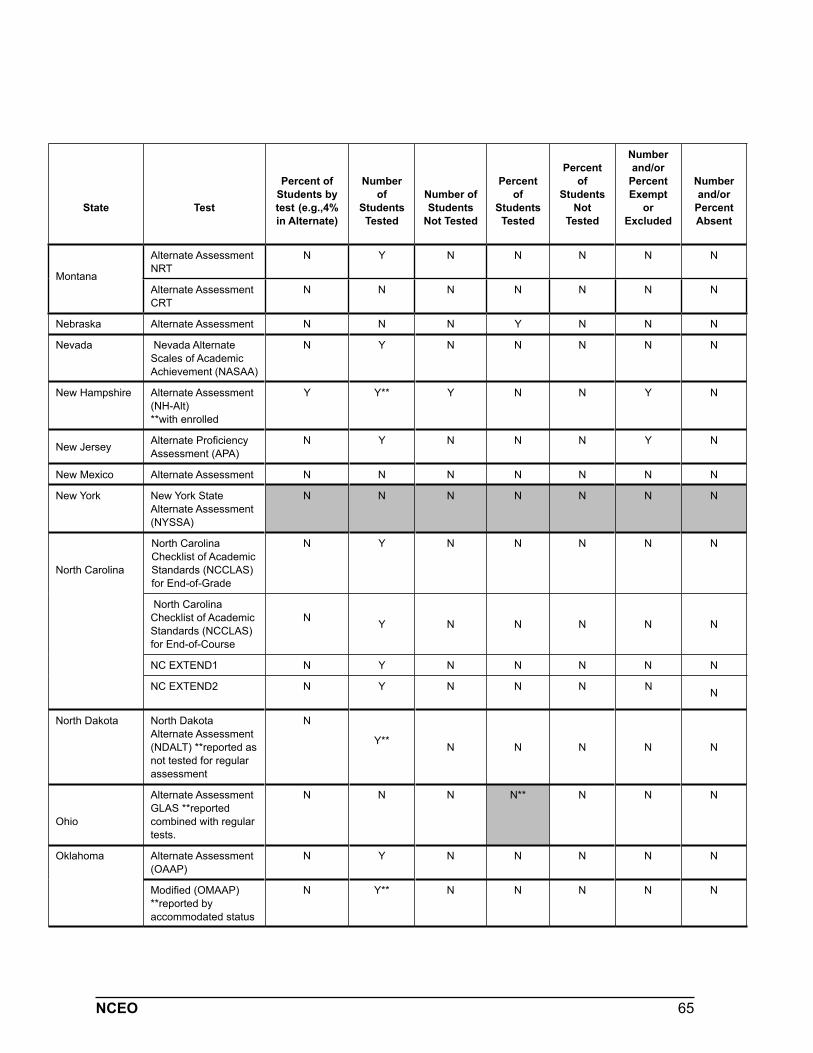
65NCEO
State Test
Percent of Students by test (e.g.,4% in Alternate)
Number of
Students Tested
Number of Students
Not Tested
Percent of
Students Tested
Percent of
Students Not
Tested
Number and/or
Percent Exempt
or Excluded
Number and/or
Percent Absent
Montana
Alternate Assessment NRT
N Y N N N N N
Alternate Assessment CRT
N N N N N N N
Nebraska Alternate Assessment N N N Y N N N
Nevada Nevada Alternate Scales of Academic Achievement (NASAA)
N Y N N N N N
New Hampshire Alternate Assessment (NH-Alt)**with enrolled
Y Y** Y N N Y N
New Jersey Alternate Proficiency Assessment (APA)
N Y N N N Y N
New Mexico Alternate Assessment N N N N N N N
New York New York State Alternate Assessment (NYSSA)
N N N N N N N
North Carolina
North Carolina Checklist of Academic Standards (NCCLAS) for End-of-Grade
N Y N N N N N
North Carolina Checklist of Academic Standards (NCCLAS) for End-of-Course
N Y N N N N N
NC EXTEND1 N Y N N N N N
NC EXTEND2 N Y N N N N N
North Dakota North Dakota Alternate Assessment (NDALT) **reported as not tested for regular assessment
N
Y** N N N N N
Ohio
Alternate Assessment GLAS **reported combined with regular tests.
N N N N** N N N
Oklahoma Alternate Assessment (OAAP)
N Y N N N N N
Modified (OMAAP)**reported by accommodated status
N Y** N N N N N
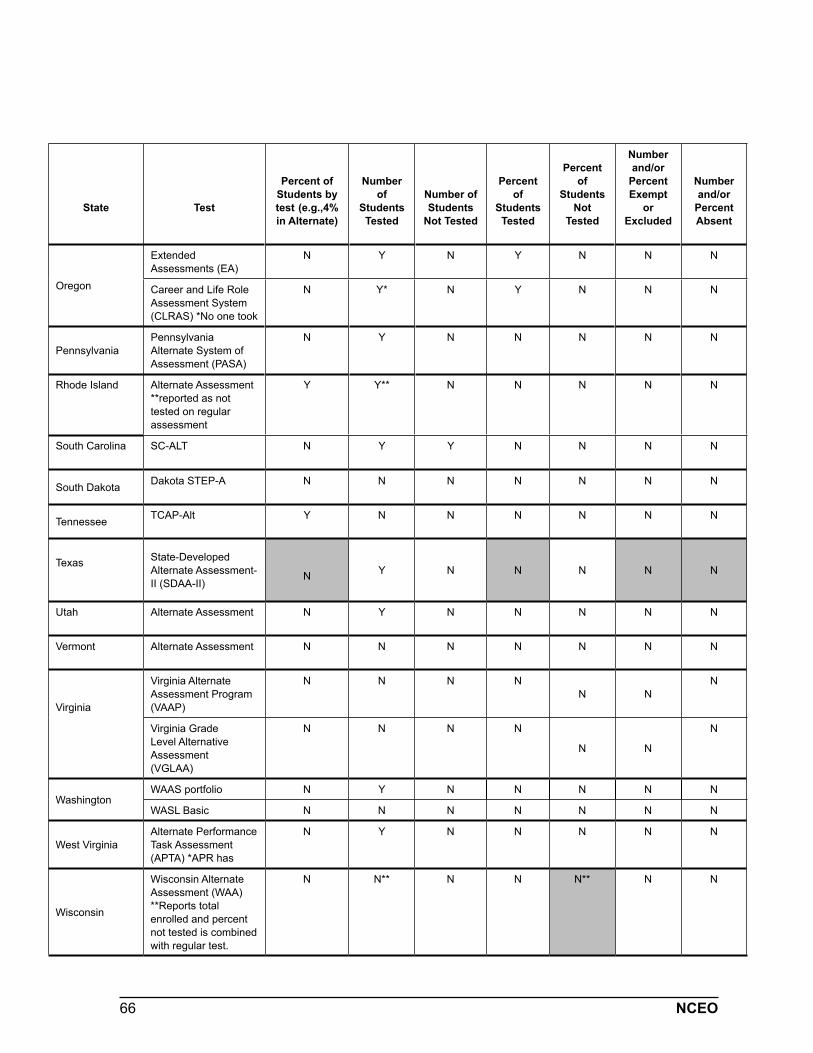
66 NCEO
State Test
Percent of Students by test (e.g.,4% in Alternate)
Number of
Students Tested
Number of Students
Not Tested
Percent of
Students Tested
Percent of
Students Not
Tested
Number and/or
Percent Exempt
or Excluded
Number and/or
Percent Absent
Oregon
Extended Assessments (EA)
N Y N Y N N N
Career and Life Role Assessment System (CLRAS) *No one took
N Y* N Y N N N
Pennsylvania Pennsylvania Alternate System of Assessment (PASA)
N Y N N N N N
Rhode Island Alternate Assessment **reported as not tested on regular assessment
Y Y** N N N N N
South Carolina SC-ALT N Y Y N N N N
South Dakota Dakota STEP-A N N N N N N N
Tennessee TCAP-Alt Y N N N N N N
Texas State-Developed Alternate Assessment-II (SDAA-II)
N Y N N N N N
Utah Alternate Assessment N Y N N N N N
Vermont Alternate Assessment N N N N N N N
Virginia
Virginia Alternate Assessment Program (VAAP)
N N N NN N
N
Virginia Grade Level Alternative Assessment (VGLAA)
N N N N
N N
N
Washington WAAS portfolio N Y N N N N N
WASL Basic N N N N N N N
West Virginia Alternate Performance Task Assessment (APTA) *APR has
N Y N N N N N
Wisconsin
Wisconsin Alternate Assessment (WAA)**Reports total enrolled and percent not tested is combined with regular test.
N N** N N N** N N
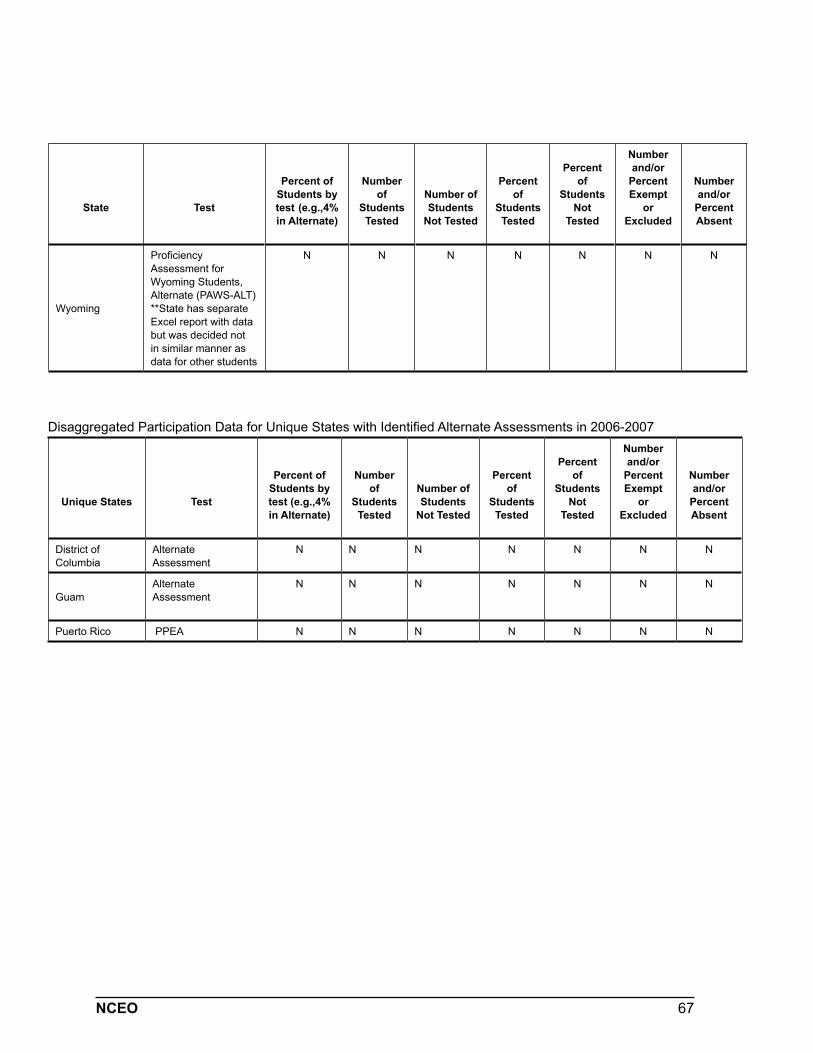
67NCEO
State Test
Percent of Students by test (e.g.,4% in Alternate)
Number of
Students Tested
Number of Students
Not Tested
Percent of
Students Tested
Percent of
Students Not
Tested
Number and/or
Percent Exempt
or Excluded
Number and/or
Percent Absent
Wyoming
Proficiency Assessment for Wyoming Students, Alternate (PAWS-ALT) **State has separate Excel report with data but was decided not in similar manner as data for other students
N N N N N N N
Disaggregated Participation Data for Unique States with Identified Alternate Assessments in 2006-2007
Unique States Test
Percent of Students by test (e.g.,4% in Alternate)
Number of
Students Tested
Number of Students
Not Tested
Percent of
Students Tested
Percent of
Students Not
Tested
Number and/or
Percent Exempt
or Excluded
Number and/or
Percent Absent
District of Columbia
Alternate Assessment
N N N N N N N
GuamAlternate Assessment
N N N N N N N
Puerto Rico PPEA N N N N N N N
68 NCEO
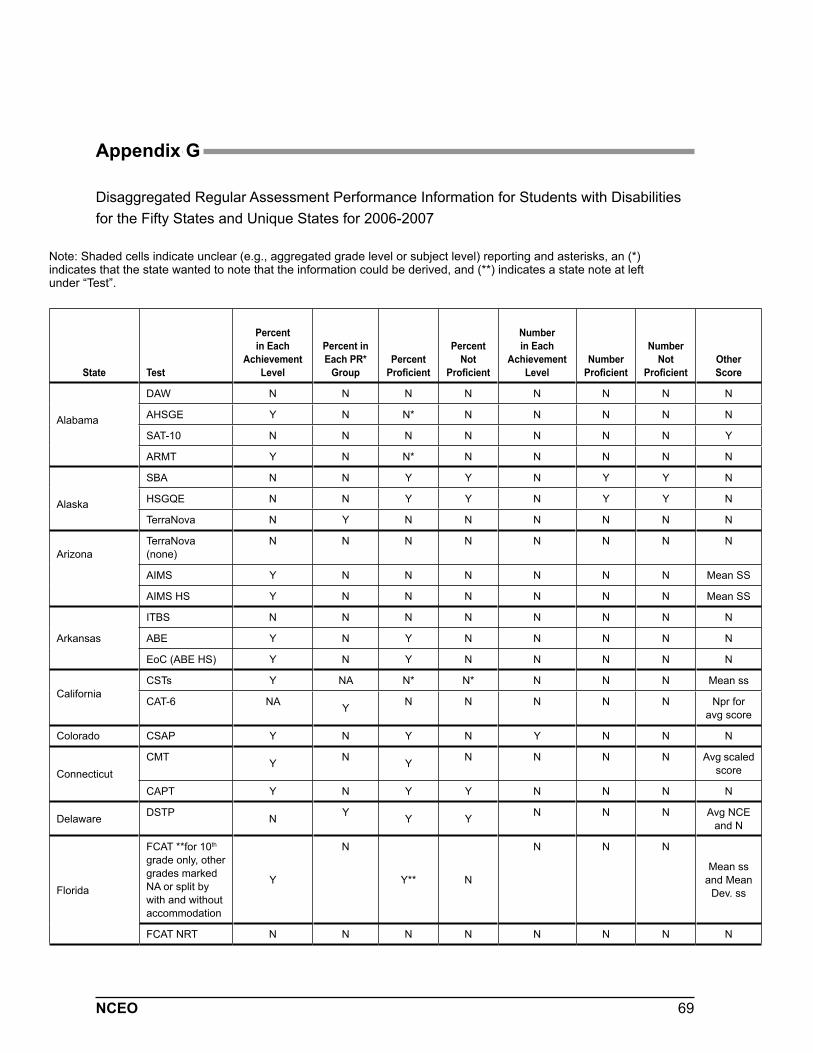
69NCEO
Appendix G
Disaggregated Regular Assessment Performance Information for Students with Disabilities for the Fifty States and Unique States for 2006-2007
Note: Shaded cells indicate unclear (e.g., aggregated grade level or subject level) reporting and asterisks, an (*) indicates that the state wanted to note that the information could be derived, and (**) indicates a state note at left under “Test”.
State Test
Percent in Each
Achievement Level
Percent in Each PR*
Group Percent
Proficient
Percent Not
Proficient
Number in Each
Achievement Level
Number Proficient
Number Not
Proficient Other Score
Alabama
DAW N N N N N N N N
AHSGE Y N N* N N N N N
SAT-10 N N N N N N N Y
ARMT Y N N* N N N N N
Alaska
SBA N N Y Y N Y Y N
HSGQE N N Y Y N Y Y N
TerraNova N Y N N N N N N
ArizonaTerraNova (none)
N N N N N N N N
AIMS Y N N N N N N Mean SS
AIMS HS Y N N N N N N Mean SS
Arkansas
ITBS N N N N N N N N
ABE Y N Y N N N N N
EoC (ABE HS) Y N Y N N N N N
CaliforniaCSTs Y NA N* N* N N N Mean ss
CAT-6 NA Y N N N N N Npr for avg score
Colorado CSAP Y N Y N Y N N N
ConnecticutCMT Y N Y N N N N Avg scaled
score
CAPT Y N Y Y N N N N
Delaware DSTP N Y Y Y N N N Avg NCE and N
Florida
FCAT **for 10th grade only, other grades marked NA or split by with and without accommodation
Y
N
Y** N
N N N
Mean ss and Mean
Dev. ss
FCAT NRT N N N N N N N N
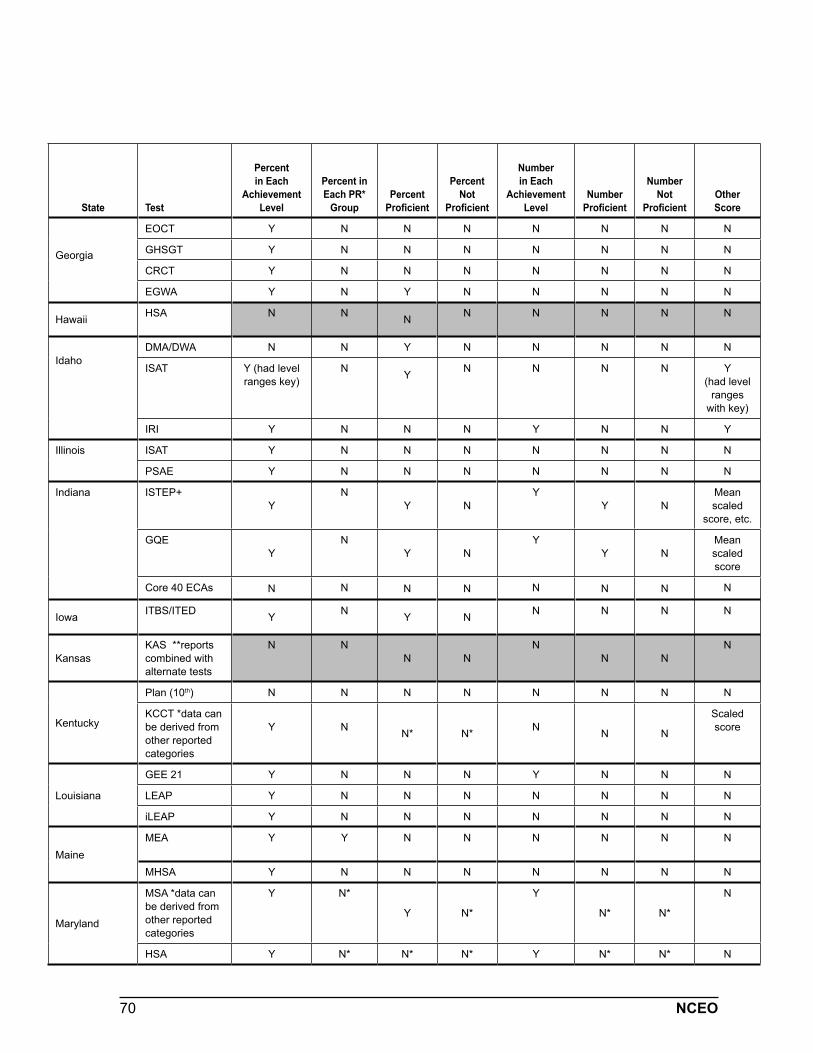
70 NCEO
State Test
Percent in Each
Achievement Level
Percent in Each PR*
Group Percent
Proficient
Percent Not
Proficient
Number in Each
Achievement Level
Number Proficient
Number Not
Proficient Other Score
Georgia
EOCT Y N N N N N N N
GHSGT Y N N N N N N N
CRCT Y N N N N N N N
EGWA Y N Y N N N N N
Hawaii HSA N N N N N N N N
IdahoDMA/DWA N N Y N N N N N
ISAT Y (had level ranges key)
N Y N N N N Y(had level
ranges with key)
IRI Y N N N Y N N Y
Illinois ISAT Y N N N N N N N
PSAE Y N N N N N N N
Indiana ISTEP+ Y
NY N
YY N
Mean scaled
score, etc.
GQE Y
NY N
YY N
Mean scaled score
Core 40 ECAs N N N N N N N N
Iowa ITBS/ITED Y N Y N N N N N
KansasKAS **reports combined with alternate tests
N NN N
NN N
N
Kentucky
Plan (10th) N N N N N N N N
KCCT *data can be derived from other reported categories
Y N N* N* N N N
Scaled score
Louisiana
GEE 21 Y N N N Y N N N
LEAP Y N N N N N N N
iLEAP Y N N N N N N N
MaineMEA Y Y N N N N N N
MHSA Y N N N N N N N
Maryland
MSA *data can be derived from other reported categories
Y N*
Y N*
Y
N* N*
N
HSA Y N* N* N* Y N* N* N
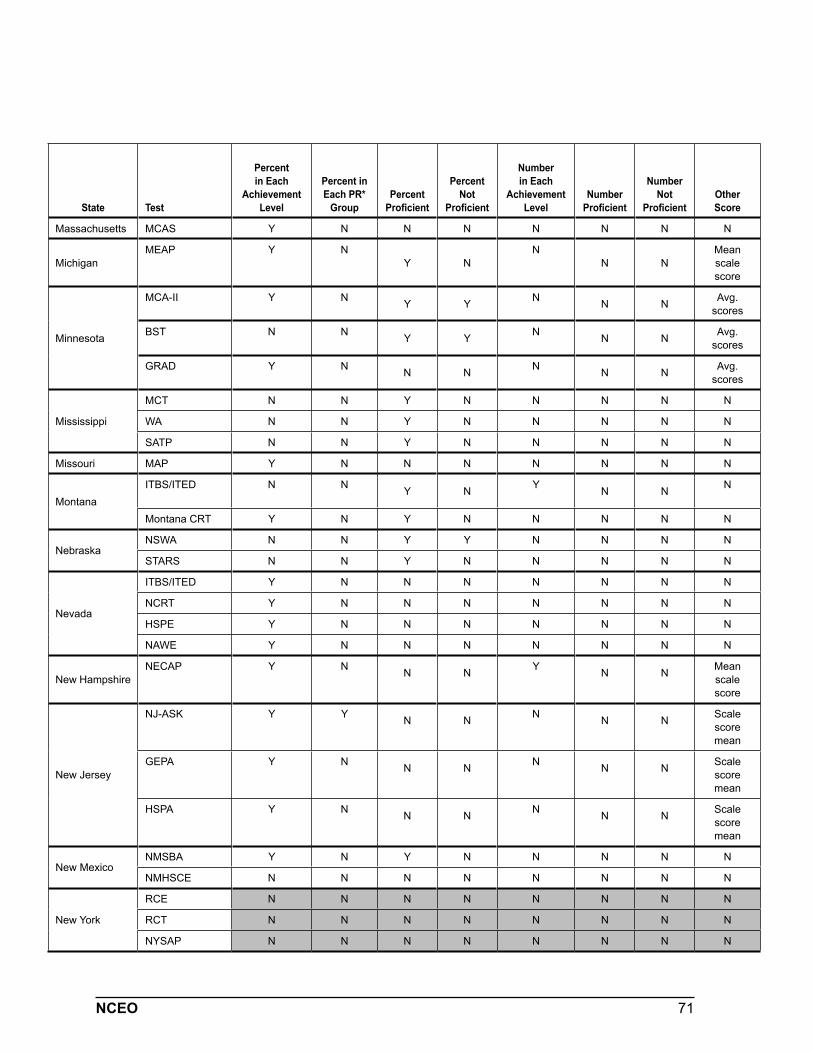
71NCEO
State Test
Percent in Each
Achievement Level
Percent in Each PR*
Group Percent
Proficient
Percent Not
Proficient
Number in Each
Achievement Level
Number Proficient
Number Not
Proficient Other Score
Massachusetts MCAS Y N N N N N N N
MichiganMEAP Y N
Y NN
N NMean scale score
Minnesota
MCA-II Y N Y Y N N N Avg. scores
BST N N Y Y N N N Avg. scores
GRAD Y N N N N N N Avg. scores
Mississippi
MCT N N Y N N N N N
WA N N Y N N N N N
SATP N N Y N N N N N
Missouri MAP Y N N N N N N N
MontanaITBS/ITED N N Y N Y N N N
Montana CRT Y N Y N N N N N
NebraskaNSWA N N Y Y N N N N
STARS N N Y N N N N N
Nevada
ITBS/ITED Y N N N N N N N
NCRT Y N N N N N N N
HSPE Y N N N N N N N
NAWE Y N N N N N N N
New HampshireNECAP Y N N N Y N N Mean
scale score
New Jersey
NJ-ASK Y Y N N N N N Scale score mean
GEPA Y N N N N N N Scale score mean
HSPA Y N N N N N N Scale score mean
New MexicoNMSBA Y N Y N N N N N
NMHSCE N N N N N N N N
New York
RCE N N N N N N N N
RCT N N N N N N N N
NYSAP N N N N N N N N
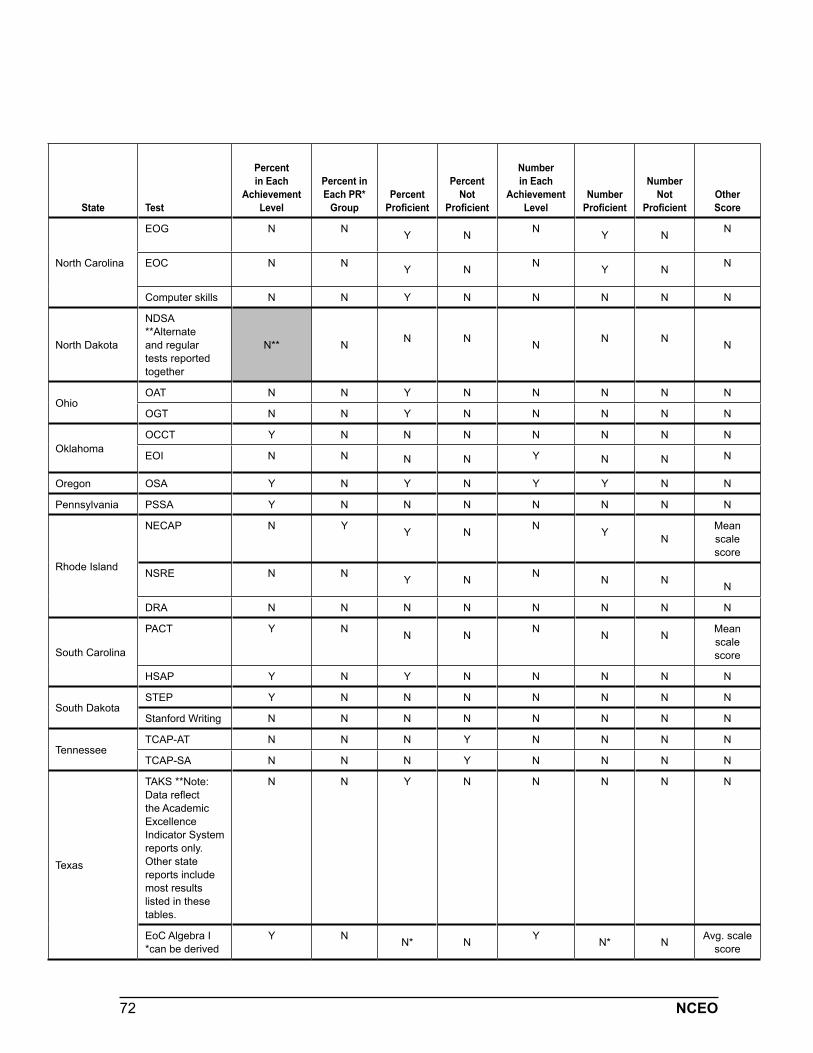
72 NCEO
State Test
Percent in Each
Achievement Level
Percent in Each PR*
Group Percent
Proficient
Percent Not
Proficient
Number in Each
Achievement Level
Number Proficient
Number Not
Proficient Other Score
North Carolina
EOG N N Y N N Y N N
EOC N N Y N N Y N N
Computer skills N N Y N N N N N
North Dakota
NDSA **Alternate and regular tests reported together
N** N N N N N N N
OhioOAT N N Y N N N N N
OGT N N Y N N N N N
OklahomaOCCT Y N N N N N N N
EOI N N N N Y N N N
Oregon OSA Y N Y N Y Y N N
Pennsylvania PSSA Y N N N N N N N
Rhode Island
NECAP N Y Y N N Y NMean scale score
NSRE N N Y N N N N N
DRA N N N N N N N N
South Carolina
PACT Y N N N N N N Mean scale score
HSAP Y N Y N N N N N
South DakotaSTEP Y N N N N N N N
Stanford Writing N N N N N N N N
TennesseeTCAP-AT N N N Y N N N N
TCAP-SA N N N Y N N N N
Texas
TAKS **Note: Data reflect the Academic Excellence Indicator System reports only. Other state reports include most results listed in these tables.
N N Y N N N N N
EoC Algebra I*can be derived
Y N N* N Y N* N Avg. scale score
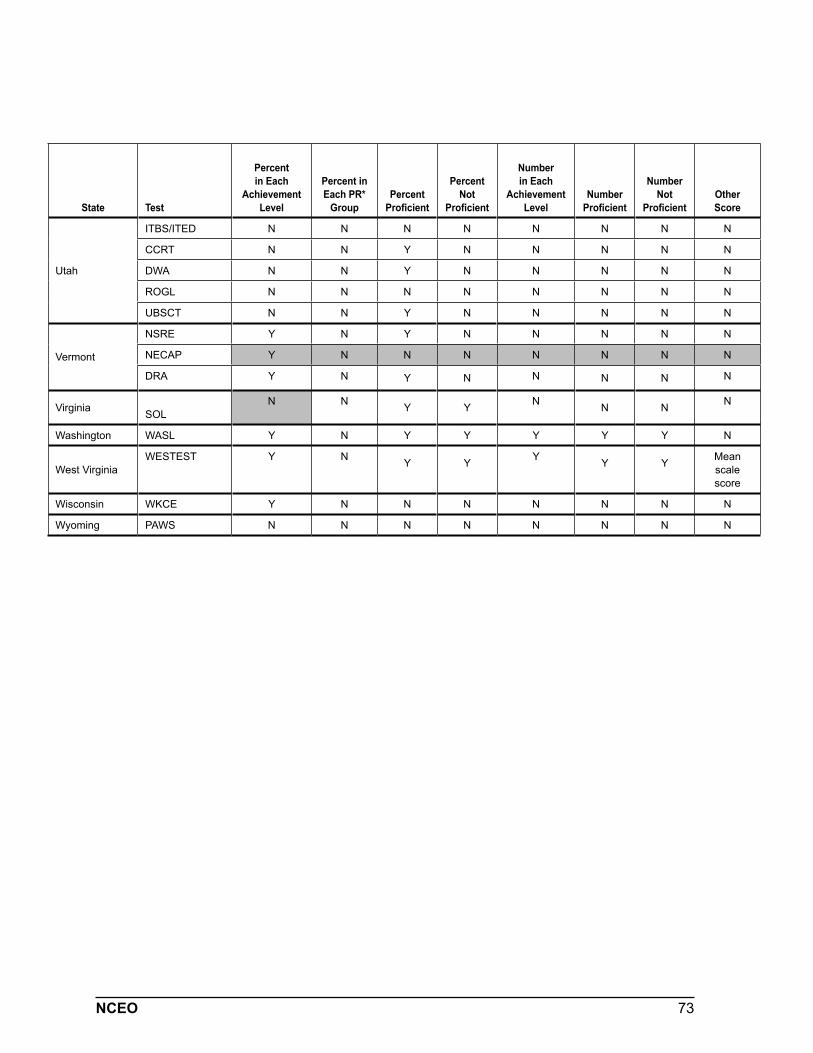
73NCEO
State Test
Percent in Each
Achievement Level
Percent in Each PR*
Group Percent
Proficient
Percent Not
Proficient
Number in Each
Achievement Level
Number Proficient
Number Not
Proficient Other Score
Utah
ITBS/ITED N N N N N N N N
CCRT N N Y N N N N N
DWA N N Y N N N N N
ROGL N N N N N N N N
UBSCT N N Y N N N N N
Vermont
NSRE Y N Y N N N N N
NECAP Y N N N N N N N
DRA Y N Y N N N N N
Virginia SOL N N Y Y N N N N
Washington WASL Y N Y Y Y Y Y N
West VirginiaWESTEST Y N Y Y Y Y Y Mean
scale score
Wisconsin WKCE Y N N N N N N N
Wyoming PAWS N N N N N N N N
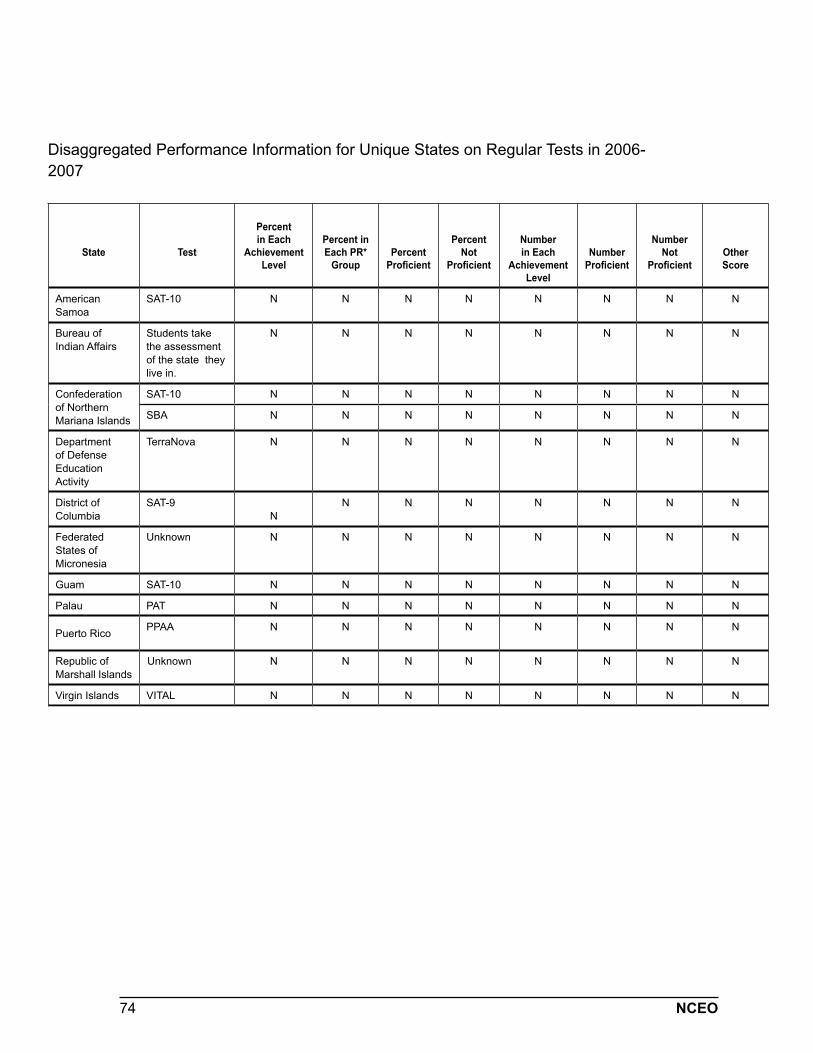
74 NCEO
Disaggregated Performance Information for Unique States on Regular Tests in 2006-2007
State Test
Percent in Each
Achievement Level
Percent in Each PR*
Group Percent
Proficient
Percent Not
Proficient
Number in Each
Achievement Level
Number Proficient
Number Not
Proficient
Other Score
American Samoa
SAT-10 N N N N N N N N
Bureau of Indian Affairs
Students take the assessment of the state they live in.
N N N N N N N N
Confederation of Northern Mariana Islands
SAT-10 N N N N N N N N
SBA N N N N N N N N
Department of Defense Education Activity
TerraNova N N N N N N N N
District of Columbia
SAT-9N
N N N N N N N
Federated States of Micronesia
Unknown N N N N N N N N
Guam SAT-10 N N N N N N N N
Palau PAT N N N N N N N N
Puerto Rico PPAA N N N N N N N N
Republic of Marshall Islands
Unknown N N N N N N N N
Virgin Islands VITAL N N N N N N N N
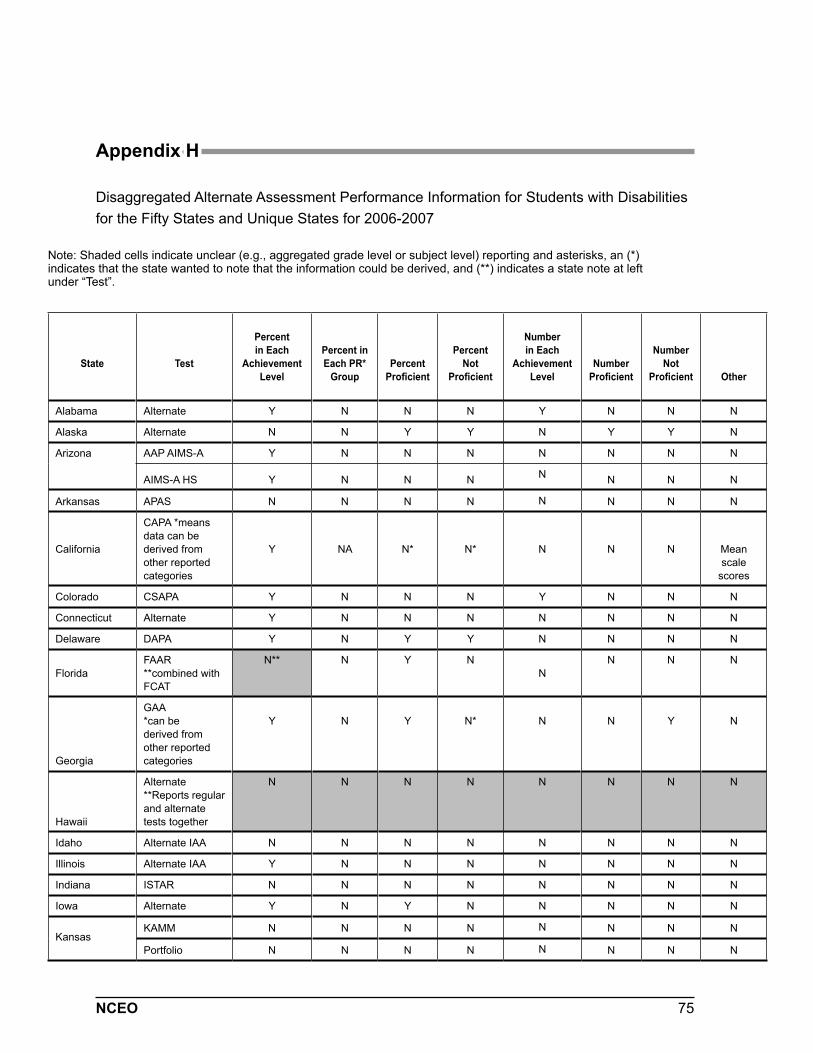
75NCEO
Appendix H
Disaggregated Alternate Assessment Performance Information for Students with Disabilities for the Fifty States and Unique States for 2006-2007
Note: Shaded cells indicate unclear (e.g., aggregated grade level or subject level) reporting and asterisks, an (*) indicates that the state wanted to note that the information could be derived, and (**) indicates a state note at left under “Test”.
State
Test
Percent in Each
Achievement Level
Percent in Each PR*
GroupPercent
Proficient
Percent Not
Proficient
Number in Each
Achievement Level
Number Proficient
Number Not
Proficient Other
Alabama Alternate Y N N N Y N N N
Alaska Alternate N N Y Y N Y Y N
Arizona AAP AIMS-A Y N N N N N N N
AIMS-A HS Y N N N N N N N
Arkansas APAS N N N N N N N N
California
CAPA *means data can be derived from other reported categories
Y NA N* N* N N N Mean scale
scores
Colorado CSAPA Y N N N Y N N N
Connecticut Alternate Y N N N N N N N
Delaware DAPA Y N Y Y N N N N
FloridaFAAR **combined with FCAT
N** N Y NN
N N N
Georgia
GAA*can be derived from other reported categories
Y N Y N* N N Y N
Hawaii
Alternate **Reports regular and alternate tests together
N N N N N N N N
Idaho Alternate IAA N N N N N N N N
Illinois Alternate IAA Y N N N N N N N
Indiana ISTAR N N N N N N N N
Iowa Alternate Y N Y N N N N N
KansasKAMM N N N N N N N N
Portfolio N N N N N N N N
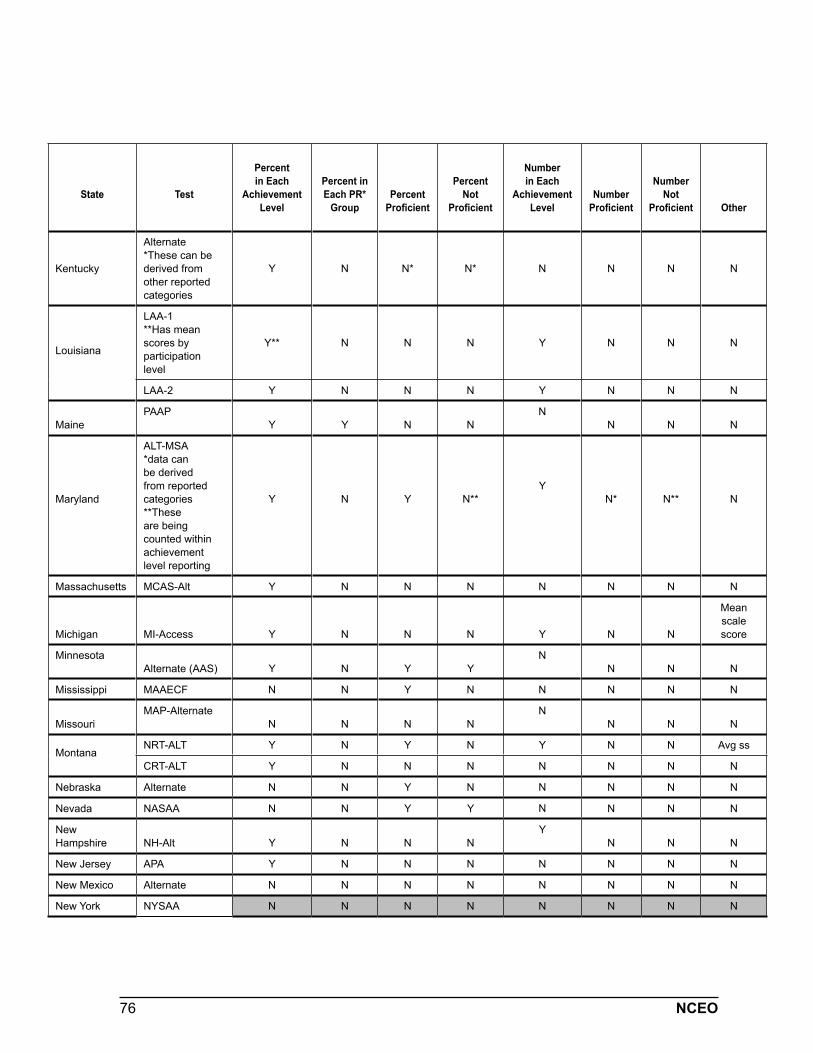
76 NCEO
State
Test
Percent in Each
Achievement Level
Percent in Each PR*
GroupPercent
Proficient
Percent Not
Proficient
Number in Each
Achievement Level
Number Proficient
Number Not
Proficient Other
Kentucky
Alternate*These can be derived from other reported categories
Y N N* N* N N N N
Louisiana
LAA-1**Has mean scores by participation level
Y** N N N Y N N N
LAA-2 Y N N N Y N N N
MainePAAP
Y Y N NN
N N N
Maryland
ALT-MSA*data can be derived from reported categories**These are being counted within achievement level reporting
Y N Y N**Y
N* N** N
Massachusetts MCAS-Alt Y N N N N N N N
Michigan MI-Access Y N N N Y N N
Mean scale score
MinnesotaAlternate (AAS) Y N Y Y
NN N N
Mississippi MAAECF N N Y N N N N N
MissouriMAP-Alternate
N N N NN
N N N
MontanaNRT-ALT Y N Y N Y N N Avg ss
CRT-ALT Y N N N N N N N
Nebraska Alternate N N Y N N N N N
Nevada NASAA N N Y Y N N N N
New Hampshire NH-Alt Y N N N
YN N N
New Jersey APA Y N N N N N N N
New Mexico Alternate N N N N N N N N
New York NYSAA N N N N N N N N
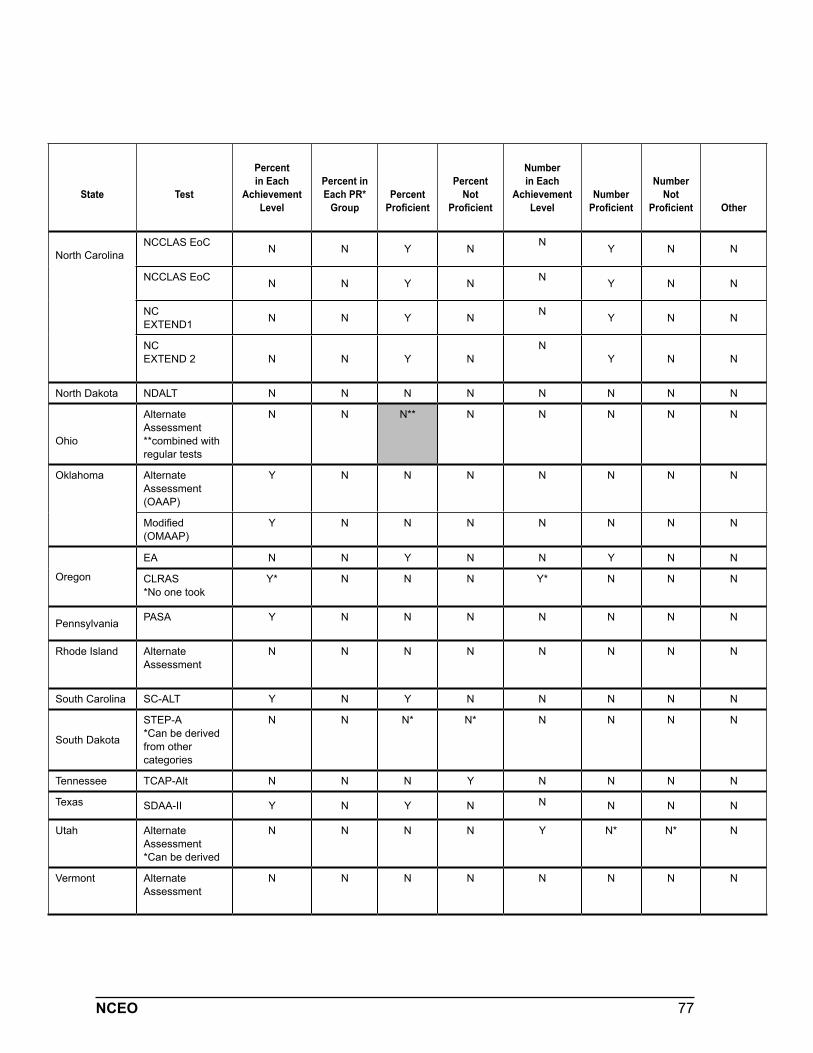
77NCEO
State
Test
Percent in Each
Achievement Level
Percent in Each PR*
GroupPercent
Proficient
Percent Not
Proficient
Number in Each
Achievement Level
Number Proficient
Number Not
Proficient Other
North CarolinaNCCLAS EoC N N Y N N Y N N
NCCLAS EoC N N Y N N Y N N
NCEXTEND1 N N Y N N Y N N
NCEXTEND 2 N N Y N
NY N N
North Dakota NDALT N N N N N N N N
Ohio
Alternate Assessment**combined with regular tests
N N N** N N N N N
Oklahoma Alternate Assessment (OAAP)
Y N N N N N N N
Modified(OMAAP)
Y N N N N N N N
Oregon
EA N N Y N N Y N N
CLRAS*No one took
Y* N N N Y* N N N
Pennsylvania PASA Y N N N N N N N
Rhode Island Alternate Assessment
N N N N N N N N
South Carolina SC-ALT Y N Y N N N N N
South Dakota
STEP-A*Can be derived from other categories
N N N* N* N N N N
Tennessee TCAP-Alt N N N Y N N N N
Texas SDAA-II Y N Y N N N N N
Utah Alternate Assessment*Can be derived
N N N N Y N* N* N
Vermont Alternate Assessment
N N N N N N N N
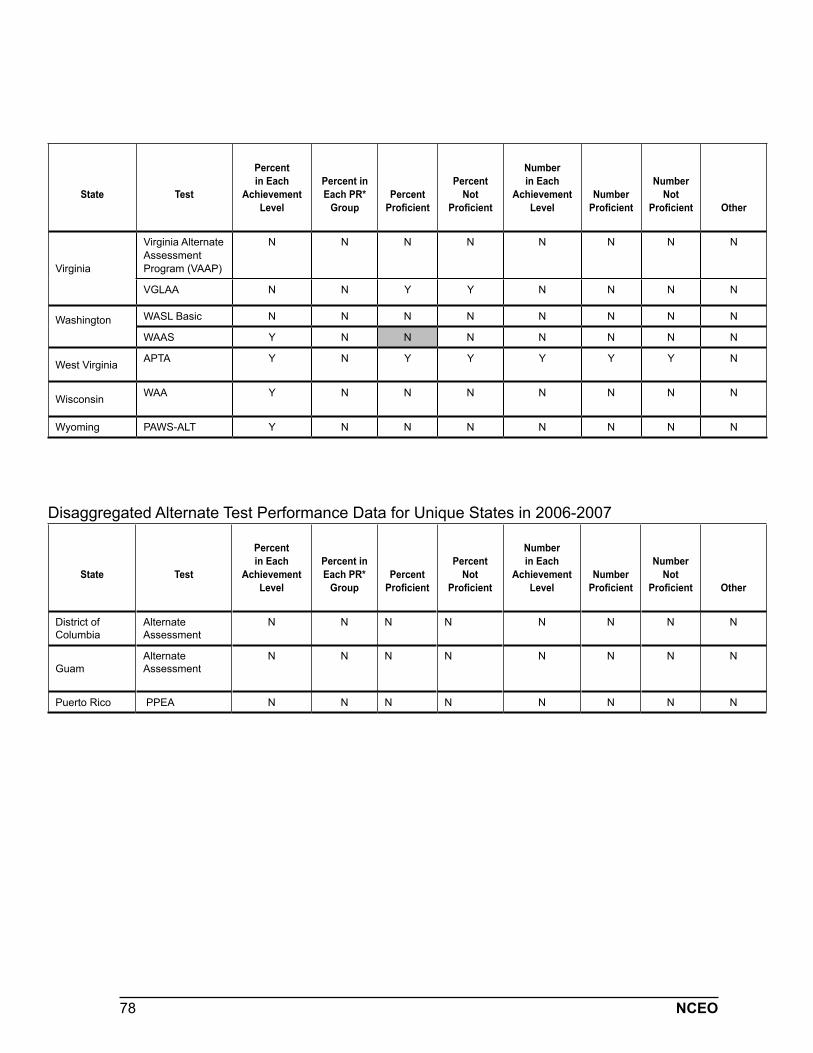
78 NCEO
State
Test
Percent in Each
Achievement Level
Percent in Each PR*
GroupPercent
Proficient
Percent Not
Proficient
Number in Each
Achievement Level
Number Proficient
Number Not
Proficient Other
Virginia
Virginia Alternate AssessmentProgram (VAAP)
N N N N N N N N
VGLAA N N Y Y N N N N
Washington WASL Basic N N N N N N N N
WAAS Y N N N N N N N
West Virginia APTA Y N Y Y Y Y Y N
Wisconsin WAA Y N N N N N N N
Wyoming PAWS-ALT Y N N N N N N N
Disaggregated Alternate Test Performance Data for Unique States in 2006-2007
State
Test
Percent in Each
Achievement Level
Percent in Each PR*
GroupPercent
Proficient
Percent Not
Proficient
Number in Each
Achievement Level
Number Proficient
Number Not
Proficient Other
District of Columbia
Alternate Assessment
N N N N N N N N
GuamAlternate Assessment
N N N N N N N N
Puerto Rico PPEA N N N N N N N N
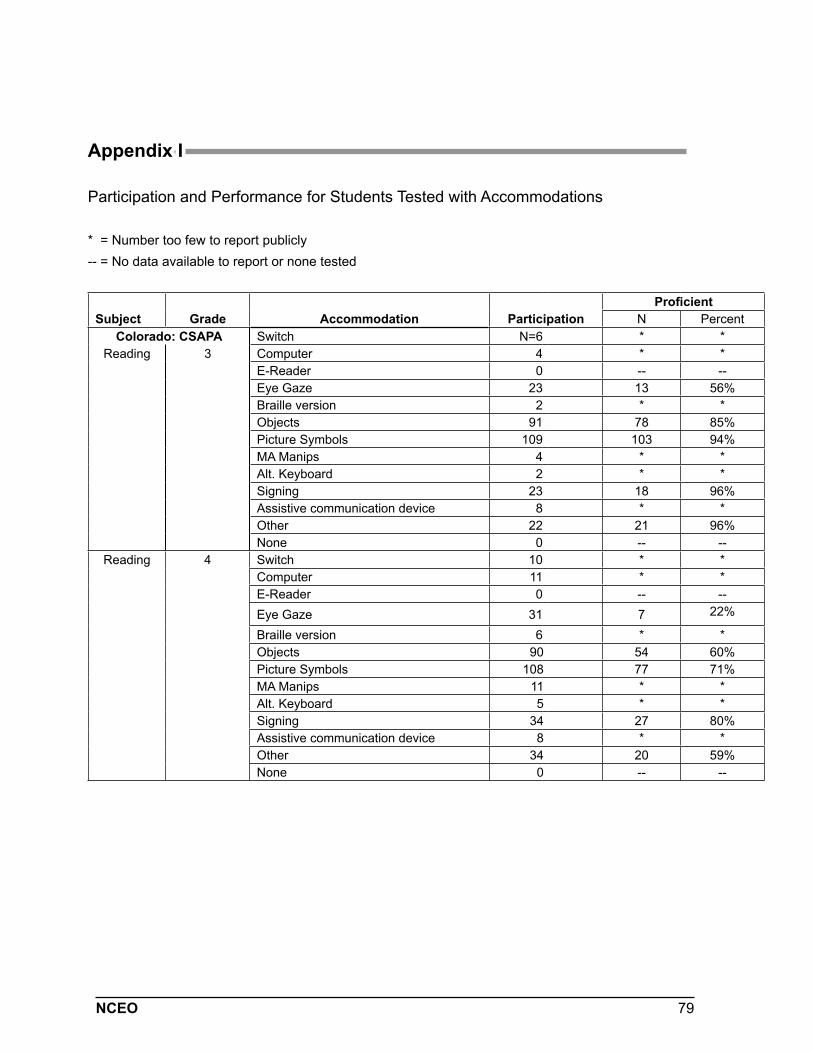
79NCEO
Appendix I
Participation and Performance for Students Tested with Accommodations
* = Number too few to report publicly-- = No data available to report or none tested
Subject Grade Accommodation ParticipationProficient
N PercentColorado: CSAPA Switch N=6 * *
Reading 3 Computer 4 * *E-Reader 0 -- --Eye Gaze 23 13 56%Braille version 2 * *Objects 91 78 85%Picture Symbols 109 103 94%MA Manips 4 * *Alt. Keyboard 2 * *Signing 23 18 96%Assistive communication device 8 * *Other 22 21 96%None 0 -- --
Reading 4 Switch 10 * *Computer 11 * *E-Reader 0 -- --Eye Gaze 31 7 22%
Braille version 6 * *Objects 90 54 60%Picture Symbols 108 77 71%MA Manips 11 * *Alt. Keyboard 5 * *Signing 34 27 80%Assistive communication device 8 * *Other 34 20 59%None 0 -- --
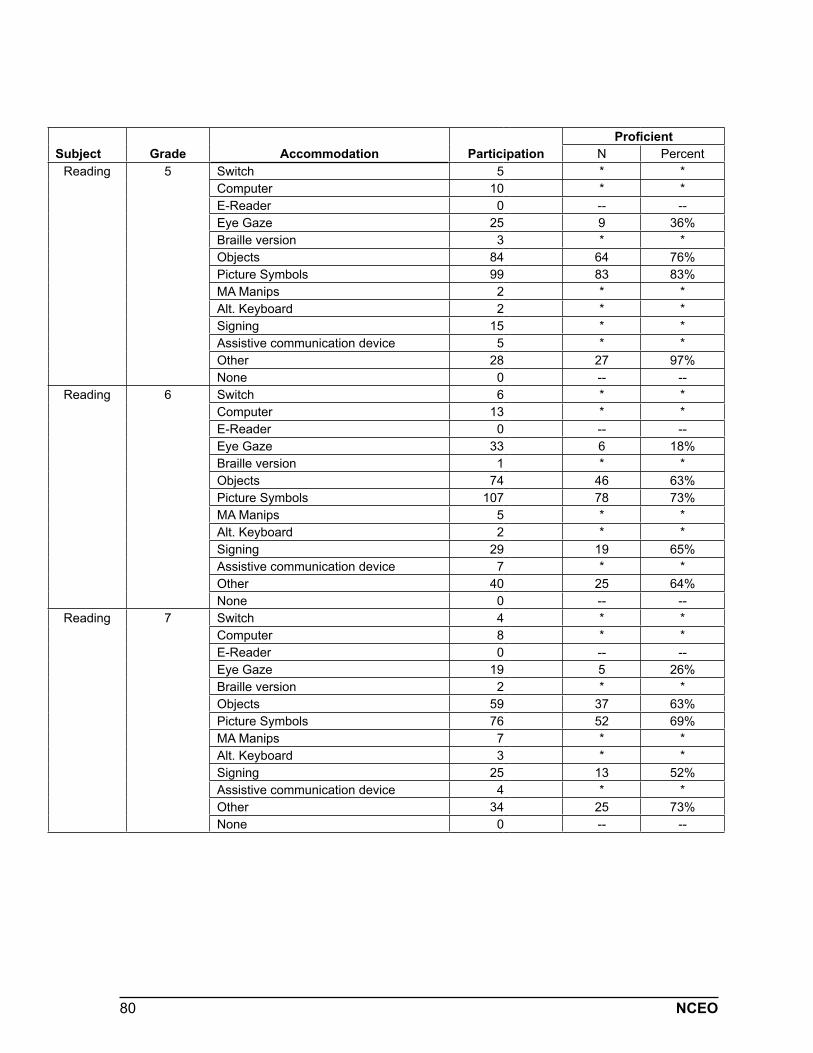
80 NCEO
Subject Grade Accommodation ParticipationProficient
N PercentReading 5 Switch 5 * *
Computer 10 * *E-Reader 0 -- --Eye Gaze 25 9 36%Braille version 3 * *Objects 84 64 76%Picture Symbols 99 83 83%MA Manips 2 * *Alt. Keyboard 2 * *Signing 15 * *Assistive communication device 5 * *Other 28 27 97%None 0 -- --
Reading 6 Switch 6 * *Computer 13 * *E-Reader 0 -- --Eye Gaze 33 6 18%Braille version 1 * *Objects 74 46 63%Picture Symbols 107 78 73%MA Manips 5 * *Alt. Keyboard 2 * *Signing 29 19 65%Assistive communication device 7 * *Other 40 25 64%None 0 -- --
Reading 7 Switch 4 * *Computer 8 * *E-Reader 0 -- --Eye Gaze 19 5 26%Braille version 2 * *Objects 59 37 63%Picture Symbols 76 52 69%MA Manips 7 * *Alt. Keyboard 3 * *Signing 25 13 52%Assistive communication device 4 * *Other 34 25 73%None 0 -- --
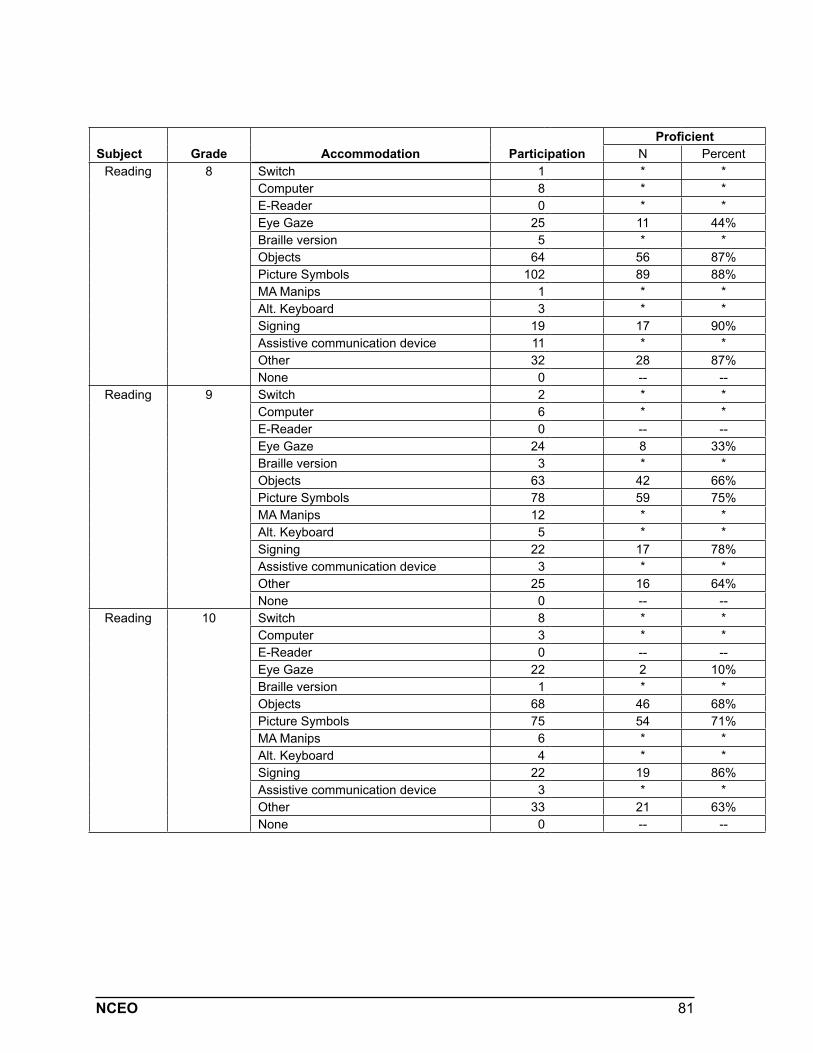
81NCEO
Subject Grade Accommodation ParticipationProficient
N PercentReading 8 Switch 1 * *
Computer 8 * *E-Reader 0 * *Eye Gaze 25 11 44%Braille version 5 * *Objects 64 56 87%Picture Symbols 102 89 88%MA Manips 1 * *Alt. Keyboard 3 * *Signing 19 17 90%Assistive communication device 11 * *Other 32 28 87%None 0 -- --
Reading 9 Switch 2 * *Computer 6 * *E-Reader 0 -- --Eye Gaze 24 8 33%Braille version 3 * *Objects 63 42 66%Picture Symbols 78 59 75%MA Manips 12 * *Alt. Keyboard 5 * *Signing 22 17 78%Assistive communication device 3 * *Other 25 16 64%None 0 -- --
Reading 10 Switch 8 * *Computer 3 * *E-Reader 0 -- --Eye Gaze 22 2 10%Braille version 1 * *Objects 68 46 68%Picture Symbols 75 54 71%MA Manips 6 * *Alt. Keyboard 4 * *Signing 22 19 86%Assistive communication device 3 * *Other 33 21 63%None 0 -- --
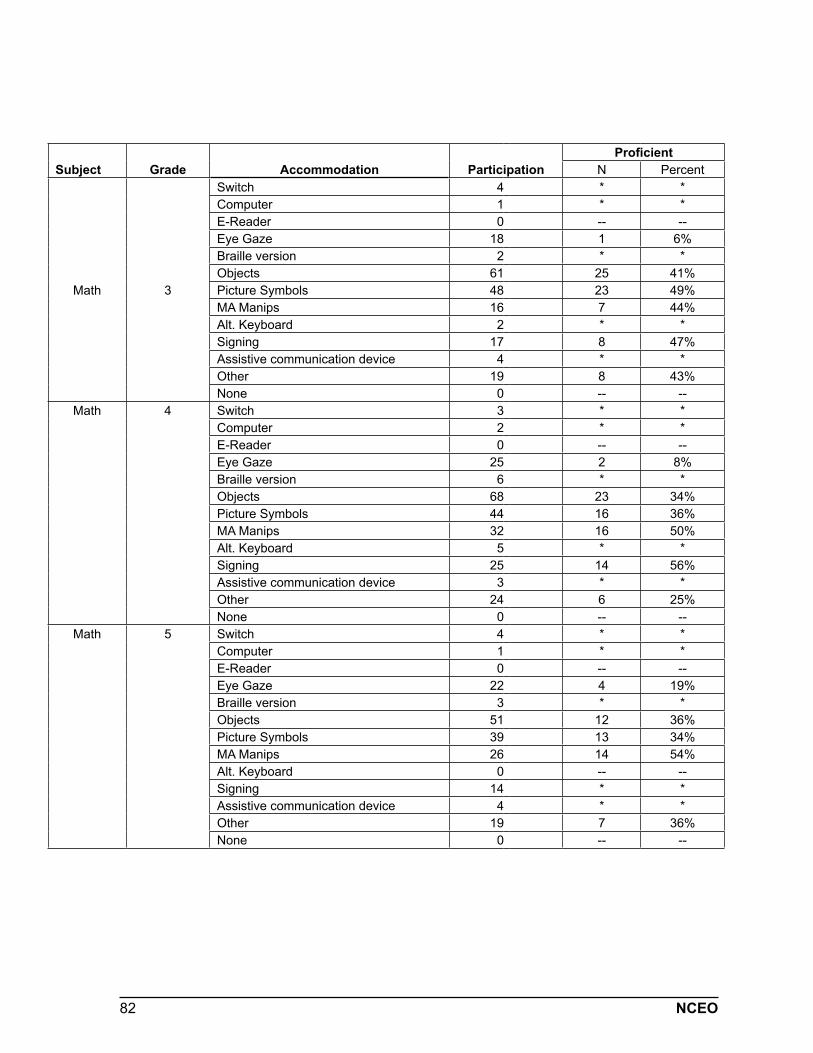
82 NCEO
Subject Grade Accommodation ParticipationProficient
N Percent
Math 3
Switch 4 * *Computer 1 * *E-Reader 0 -- --Eye Gaze 18 1 6%Braille version 2 * *Objects 61 25 41%Picture Symbols 48 23 49%MA Manips 16 7 44%Alt. Keyboard 2 * *Signing 17 8 47%Assistive communication device 4 * *Other 19 8 43%None 0 -- --
Math 4 Switch 3 * *Computer 2 * *E-Reader 0 -- --Eye Gaze 25 2 8%Braille version 6 * *Objects 68 23 34%Picture Symbols 44 16 36%MA Manips 32 16 50%Alt. Keyboard 5 * *Signing 25 14 56%Assistive communication device 3 * *Other 24 6 25%None 0 -- --
Math 5 Switch 4 * *Computer 1 * *E-Reader 0 -- --Eye Gaze 22 4 19%Braille version 3 * *Objects 51 12 36%Picture Symbols 39 13 34%MA Manips 26 14 54%Alt. Keyboard 0 -- --Signing 14 * *Assistive communication device 4 * *Other 19 7 36%None 0 -- --
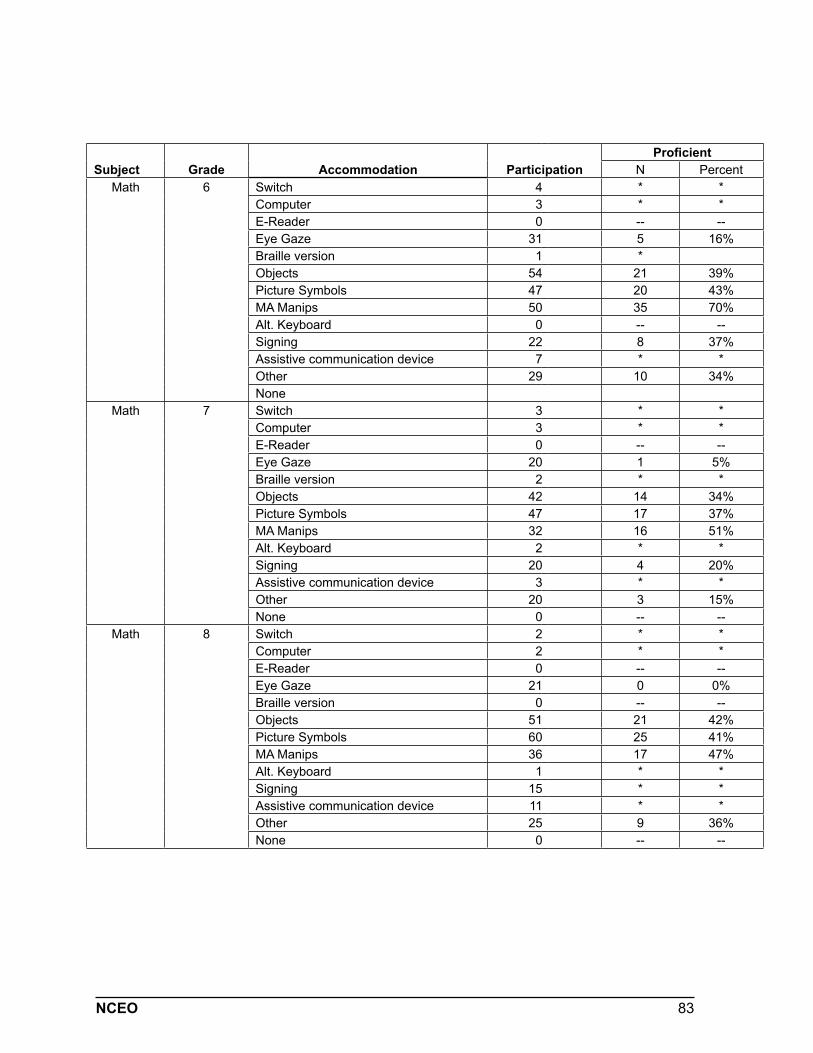
83NCEO
Subject Grade Accommodation ParticipationProficient
N PercentMath 6 Switch 4 * *
Computer 3 * *E-Reader 0 -- --Eye Gaze 31 5 16%Braille version 1 *Objects 54 21 39%Picture Symbols 47 20 43%MA Manips 50 35 70%Alt. Keyboard 0 -- --Signing 22 8 37%Assistive communication device 7 * *Other 29 10 34%None
Math 7 Switch 3 * *Computer 3 * *E-Reader 0 -- --Eye Gaze 20 1 5%Braille version 2 * *Objects 42 14 34%Picture Symbols 47 17 37%MA Manips 32 16 51%Alt. Keyboard 2 * *Signing 20 4 20%Assistive communication device 3 * *Other 20 3 15%None 0 -- --
Math 8 Switch 2 * *Computer 2 * *E-Reader 0 -- --Eye Gaze 21 0 0%Braille version 0 -- --Objects 51 21 42%Picture Symbols 60 25 41%MA Manips 36 17 47%Alt. Keyboard 1 * *Signing 15 * *Assistive communication device 11 * *Other 25 9 36%None 0 -- --
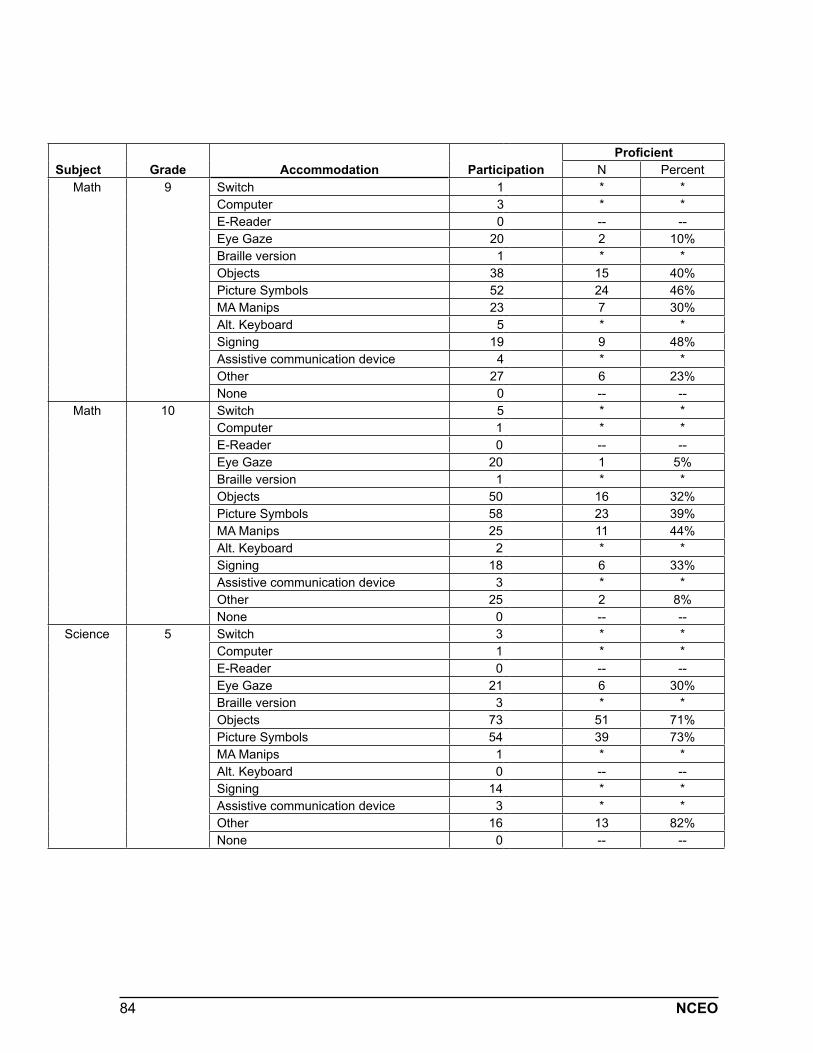
84 NCEO
Subject Grade Accommodation ParticipationProficient
N PercentMath 9 Switch 1 * *
Computer 3 * *E-Reader 0 -- --Eye Gaze 20 2 10%Braille version 1 * *Objects 38 15 40%Picture Symbols 52 24 46%MA Manips 23 7 30%Alt. Keyboard 5 * *Signing 19 9 48%Assistive communication device 4 * *Other 27 6 23%None 0 -- --
Math 10 Switch 5 * *Computer 1 * *E-Reader 0 -- --Eye Gaze 20 1 5%Braille version 1 * *Objects 50 16 32%Picture Symbols 58 23 39%MA Manips 25 11 44%Alt. Keyboard 2 * *Signing 18 6 33%Assistive communication device 3 * *Other 25 2 8%None 0 -- --
Science 5 Switch 3 * *Computer 1 * *E-Reader 0 -- --Eye Gaze 21 6 30%Braille version 3 * *Objects 73 51 71%Picture Symbols 54 39 73%MA Manips 1 * *Alt. Keyboard 0 -- --Signing 14 * *Assistive communication device 3 * *Other 16 13 82%None 0 -- --

85NCEO
Subject Grade Accommodation ParticipationProficient
N PercentScience 8 Switch 1 * *
Computer 2 * *E-Reader 0 -- --Eye Gaze 19 6 31%Braille version 2 * *Objects 52 41 79%Picture Symbols 72 60 83%MA Manips 4 * *Alt. Keyboard 1 * *Signing 17 14 83%Assistive communication device 10 * *Other 24 19 79%None 0 -- --
Science 10 Switch 6 * *Computer 0 -- --E-Reader 0 -- --Eye Gaze 19 0 0%Braille version 1 * *Objects 34 7 21%Picture Symbols 61 24 40%MA Manips 3 * *Alt. Keyboard 2 * *Signing 17 3 18%Assistive communication device 3 * *Other 16 1 6%None 0 -- --
Writing 3 Switch 6 * *Computer 4 * *E-Reader 0 -- --Eye Gaze 23 10 44%Braille version 2 * *Objects 91 68 74%Picture Symbols 109 93 86%MA Manips 4 * *Alt. Keyboard 2 * *Signing 24 22 92%Assistive communication device 8 * *Other 22 18 82%None 0 -- --
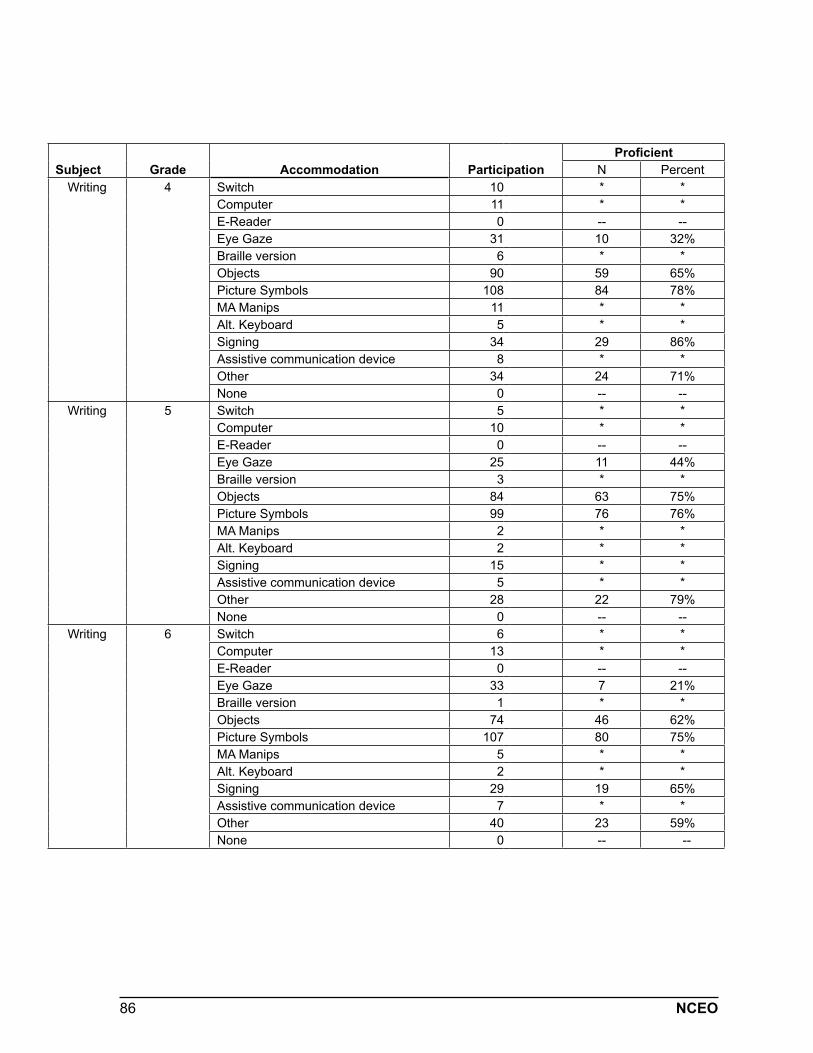
86 NCEO
Subject Grade Accommodation ParticipationProficient
N PercentWriting 4 Switch 10 * *
Computer 11 * *E-Reader 0 -- --Eye Gaze 31 10 32%Braille version 6 * *Objects 90 59 65%Picture Symbols 108 84 78%MA Manips 11 * *Alt. Keyboard 5 * *Signing 34 29 86%Assistive communication device 8 * *Other 34 24 71%None 0 -- --
Writing 5 Switch 5 * *Computer 10 * *E-Reader 0 -- --Eye Gaze 25 11 44%Braille version 3 * *Objects 84 63 75%Picture Symbols 99 76 76%MA Manips 2 * *Alt. Keyboard 2 * *Signing 15 * *Assistive communication device 5 * *Other 28 22 79%None 0 -- --
Writing 6 Switch 6 * *Computer 13 * *E-Reader 0 -- --Eye Gaze 33 7 21%Braille version 1 * *Objects 74 46 62%Picture Symbols 107 80 75%MA Manips 5 * *Alt. Keyboard 2 * *Signing 29 19 65%Assistive communication device 7 * *Other 40 23 59%None 0 -- --
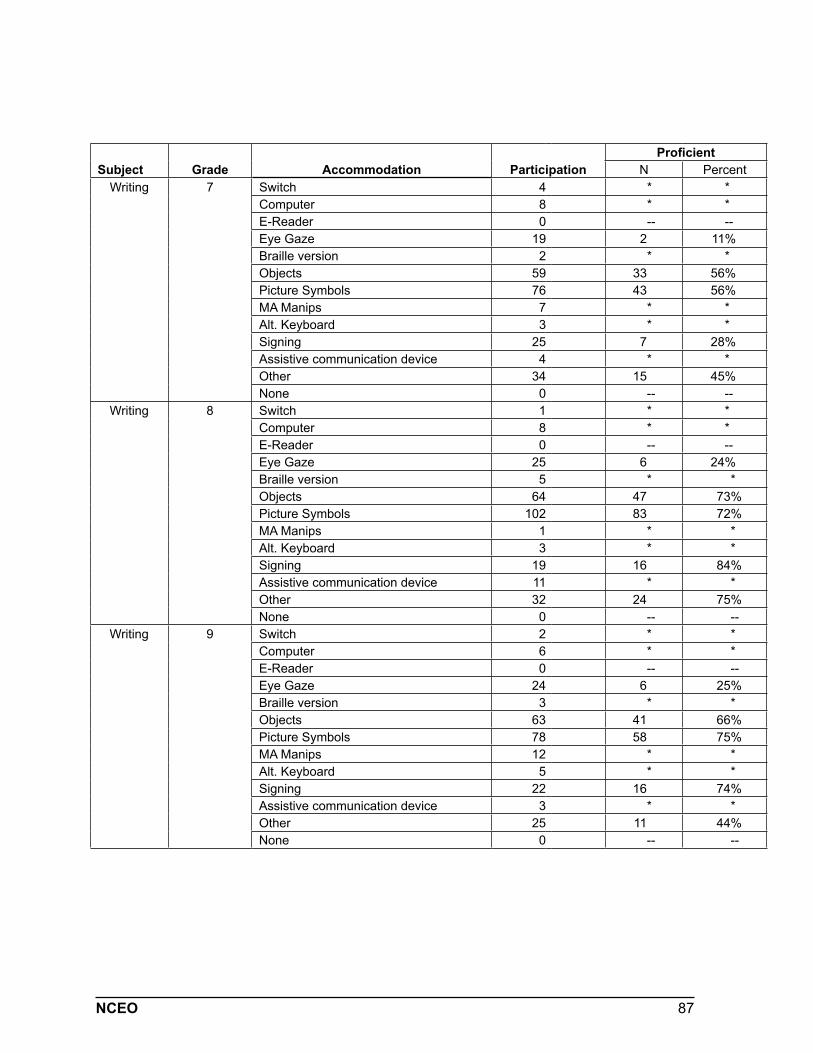
87NCEO
Subject Grade Accommodation ParticipationProficient
N PercentWriting 7 Switch 4 * *
Computer 8 * *E-Reader 0 -- --Eye Gaze 19 2 11%Braille version 2 * *Objects 59 33 56%Picture Symbols 76 43 56%MA Manips 7 * *Alt. Keyboard 3 * *Signing 25 7 28%Assistive communication device 4 * *Other 34 15 45%None 0 -- --
Writing 8 Switch 1 * *Computer 8 * *E-Reader 0 -- --Eye Gaze 25 6 24%Braille version 5 * *Objects 64 47 73%Picture Symbols 102 83 72%MA Manips 1 * *Alt. Keyboard 3 * *Signing 19 16 84%Assistive communication device 11 * *Other 32 24 75%None 0 -- --
Writing 9 Switch 2 * *Computer 6 * *E-Reader 0 -- --Eye Gaze 24 6 25%Braille version 3 * *Objects 63 41 66%Picture Symbols 78 58 75%MA Manips 12 * *Alt. Keyboard 5 * *Signing 22 16 74%Assistive communication device 3 * *Other 25 11 44%None 0 -- --
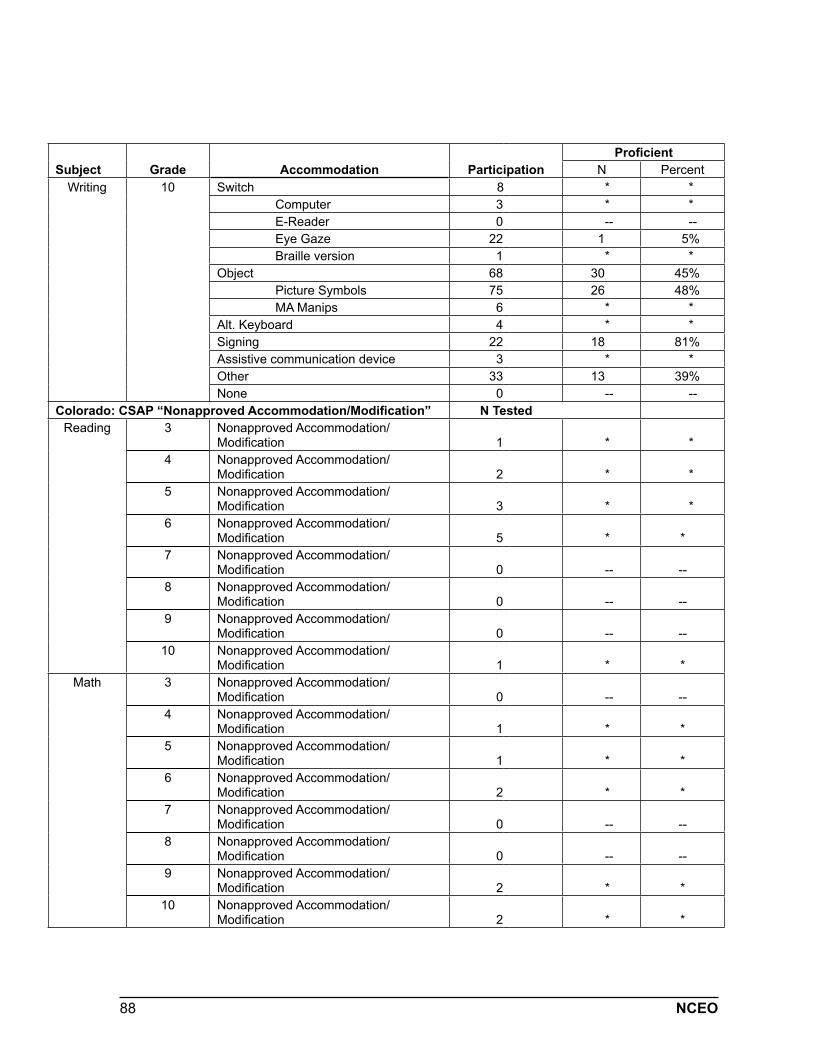
88 NCEO
Subject Grade Accommodation ParticipationProficient
N PercentWriting 10 Switch 8 * *
Computer 3 * *E-Reader 0 -- --Eye Gaze 22 1 5%Braille version 1 * *
Object 68 30 45%Picture Symbols 75 26 48%MA Manips 6 * *
Alt. Keyboard 4 * *Signing 22 18 81%Assistive communication device 3 * *Other 33 13 39%None 0 -- --
Colorado: CSAP “Nonapproved Accommodation/Modification” N TestedReading 3 Nonapproved Accommodation/
Modification 1 * *4 Nonapproved Accommodation/
Modification 2 * *5 Nonapproved Accommodation/
Modification 3 * *6 Nonapproved Accommodation/
Modification 5 * *7 Nonapproved Accommodation/
Modification 0 -- --8 Nonapproved Accommodation/
Modification 0 -- --9 Nonapproved Accommodation/
Modification 0 -- --10 Nonapproved Accommodation/
Modification 1 * *Math 3 Nonapproved Accommodation/
Modification 0 -- --4 Nonapproved Accommodation/
Modification 1 * *5 Nonapproved Accommodation/
Modification 1 * *6 Nonapproved Accommodation/
Modification 2 * *7 Nonapproved Accommodation/
Modification 0 -- --8 Nonapproved Accommodation/
Modification 0 -- --9 Nonapproved Accommodation/
Modification 2 * *10 Nonapproved Accommodation/
Modification 2 * *
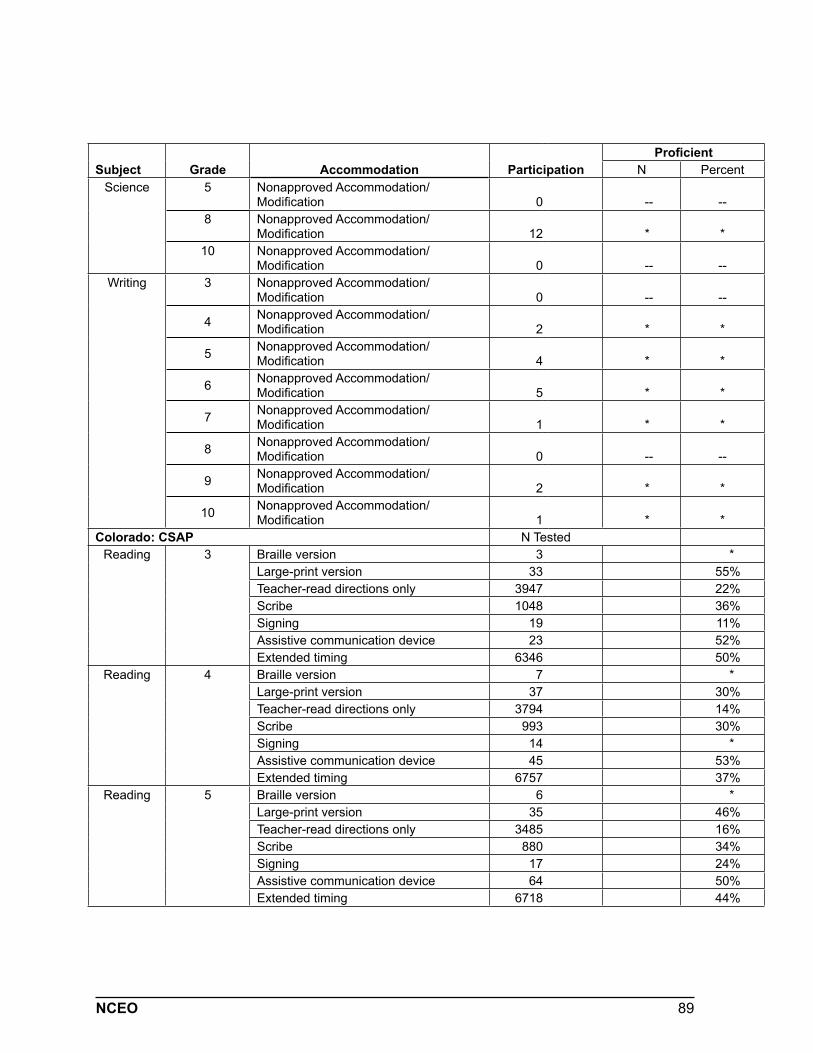
89NCEO
Subject Grade Accommodation ParticipationProficient
N PercentScience 5 Nonapproved Accommodation/
Modification 0 -- --8 Nonapproved Accommodation/
Modification 12 * *10 Nonapproved Accommodation/
Modification 0 -- --Writing 3 Nonapproved Accommodation/
Modification 0 -- --
4 Nonapproved Accommodation/Modification 2 * *
5 Nonapproved Accommodation/Modification 4 * *
6 Nonapproved Accommodation/Modification 5 * *
7 Nonapproved Accommodation/Modification 1 * *
8 Nonapproved Accommodation/Modification 0 -- --
9 Nonapproved Accommodation/Modification 2 * *
10 Nonapproved Accommodation/Modification 1 * *
Colorado: CSAP N TestedReading 3 Braille version 3 *
Large-print version 33 55%Teacher-read directions only 3947 22%Scribe 1048 36%Signing 19 11%Assistive communication device 23 52%Extended timing 6346 50%
Reading 4 Braille version 7 *Large-print version 37 30%Teacher-read directions only 3794 14%Scribe 993 30%Signing 14 *Assistive communication device 45 53%Extended timing 6757 37%
Reading 5 Braille version 6 *Large-print version 35 46%Teacher-read directions only 3485 16%Scribe 880 34%Signing 17 24%Assistive communication device 64 50%Extended timing 6718 44%
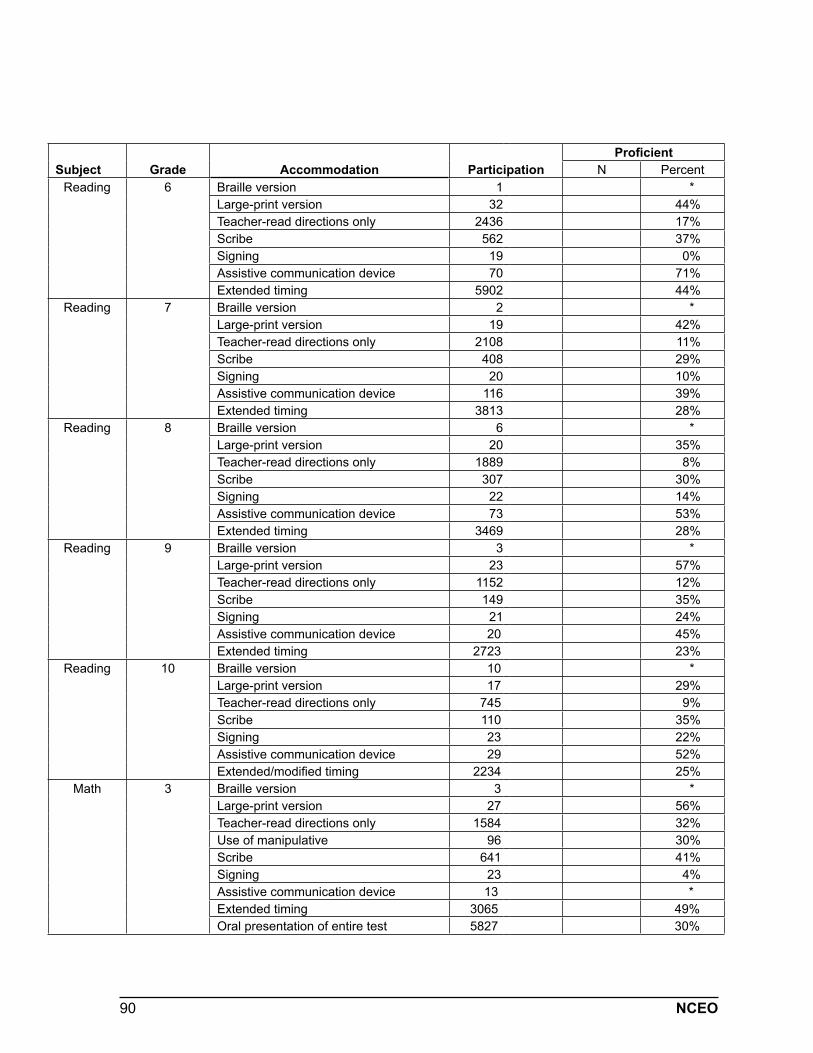
90 NCEO
Subject Grade Accommodation ParticipationProficient
N PercentReading 6 Braille version 1 *
Large-print version 32 44%Teacher-read directions only 2436 17%Scribe 562 37%Signing 19 0%Assistive communication device 70 71%Extended timing 5902 44%
Reading 7 Braille version 2 *Large-print version 19 42%Teacher-read directions only 2108 11%Scribe 408 29%Signing 20 10%Assistive communication device 116 39%Extended timing 3813 28%
Reading 8 Braille version 6 *Large-print version 20 35%Teacher-read directions only 1889 8%Scribe 307 30%Signing 22 14%Assistive communication device 73 53%Extended timing 3469 28%
Reading 9 Braille version 3 *Large-print version 23 57%Teacher-read directions only 1152 12%Scribe 149 35%Signing 21 24%Assistive communication device 20 45%Extended timing 2723 23%
Reading 10 Braille version 10 *Large-print version 17 29%Teacher-read directions only 745 9%Scribe 110 35%Signing 23 22%Assistive communication device 29 52%Extended/modified timing 2234 25%
Math 3 Braille version 3 *Large-print version 27 56%Teacher-read directions only 1584 32%Use of manipulative 96 30%Scribe 641 41%Signing 23 4%Assistive communication device 13 *Extended timing 3065 49%Oral presentation of entire test 5827 30%
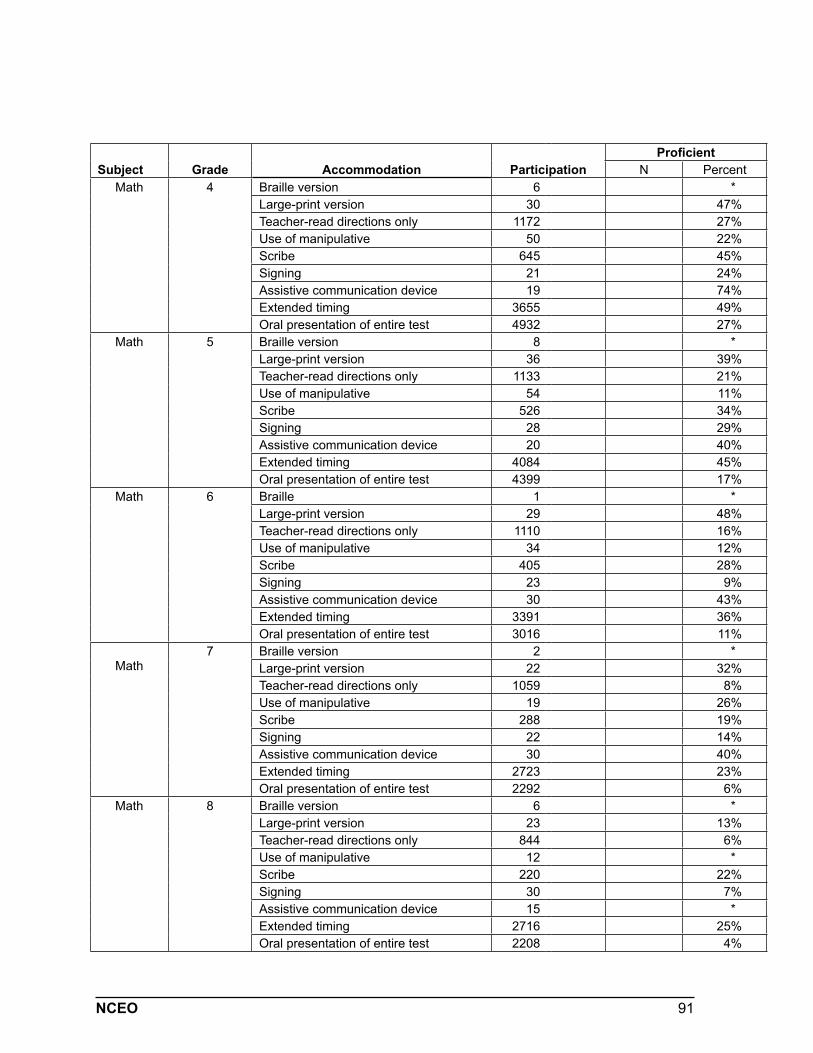
91NCEO
Subject Grade Accommodation ParticipationProficient
N PercentMath 4 Braille version 6 *
Large-print version 30 47%Teacher-read directions only 1172 27%Use of manipulative 50 22%Scribe 645 45%Signing 21 24%Assistive communication device 19 74%Extended timing 3655 49%Oral presentation of entire test 4932 27%
Math 5 Braille version 8 *Large-print version 36 39%Teacher-read directions only 1133 21%Use of manipulative 54 11%Scribe 526 34%Signing 28 29%Assistive communication device 20 40%Extended timing 4084 45%Oral presentation of entire test 4399 17%
Math 6 Braille 1 *Large-print version 29 48%Teacher-read directions only 1110 16%Use of manipulative 34 12%Scribe 405 28%Signing 23 9%Assistive communication device 30 43%Extended timing 3391 36%Oral presentation of entire test 3016 11%
Math7 Braille version 2 *
Large-print version 22 32%Teacher-read directions only 1059 8%Use of manipulative 19 26%Scribe 288 19%Signing 22 14%Assistive communication device 30 40%Extended timing 2723 23%Oral presentation of entire test 2292 6%
Math 8 Braille version 6 *Large-print version 23 13%Teacher-read directions only 844 6%Use of manipulative 12 *Scribe 220 22%Signing 30 7%Assistive communication device 15 *Extended timing 2716 25%Oral presentation of entire test 2208 4%
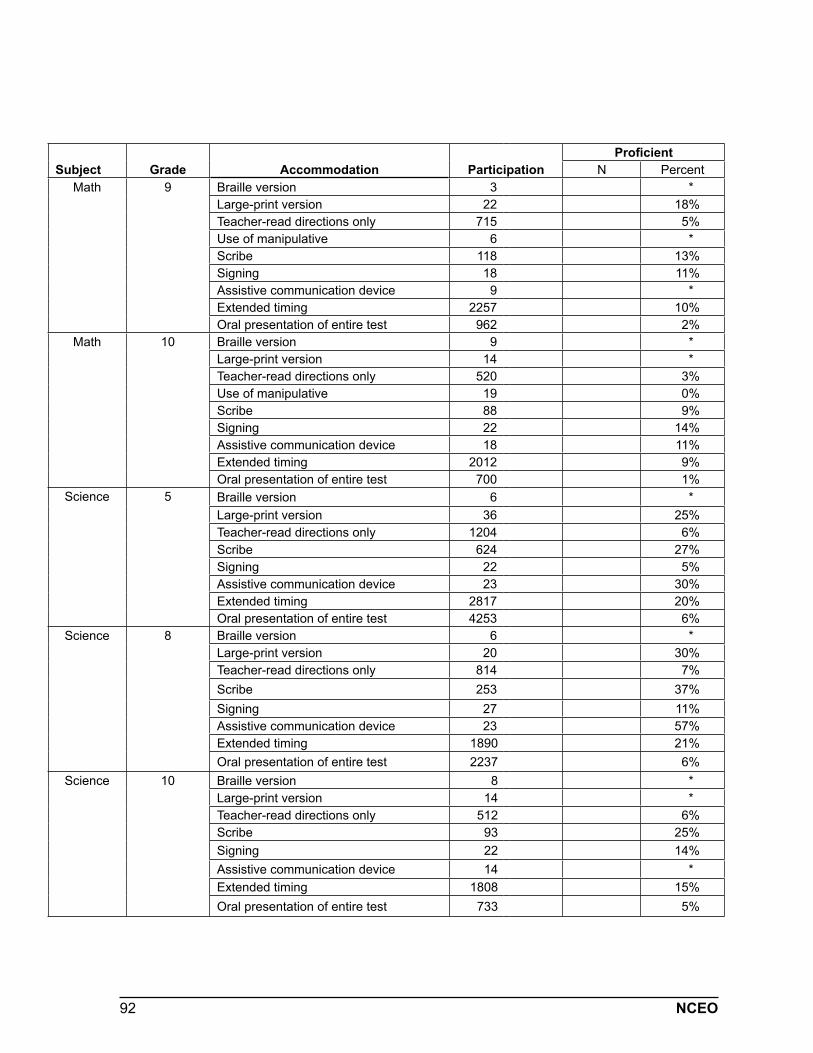
92 NCEO
Subject Grade Accommodation ParticipationProficient
N PercentMath 9 Braille version 3 *
Large-print version 22 18%Teacher-read directions only 715 5%Use of manipulative 6 *Scribe 118 13%Signing 18 11%Assistive communication device 9 *Extended timing 2257 10%Oral presentation of entire test 962 2%
Math 10 Braille version 9 *Large-print version 14 *Teacher-read directions only 520 3%Use of manipulative 19 0%Scribe 88 9%Signing 22 14%Assistive communication device 18 11%Extended timing 2012 9%Oral presentation of entire test 700 1%
Science 5 Braille version 6 *Large-print version 36 25%Teacher-read directions only 1204 6%Scribe 624 27%Signing 22 5%Assistive communication device 23 30%Extended timing 2817 20%Oral presentation of entire test 4253 6%
Science 8 Braille version 6 *Large-print version 20 30%Teacher-read directions only 814 7%Scribe 253 37%Signing 27 11%Assistive communication device 23 57%Extended timing 1890 21%Oral presentation of entire test 2237 6%
Science 10 Braille version 8 *Large-print version 14 *Teacher-read directions only 512 6%Scribe 93 25%Signing 22 14%Assistive communication device 14 *Extended timing 1808 15%Oral presentation of entire test 733 5%
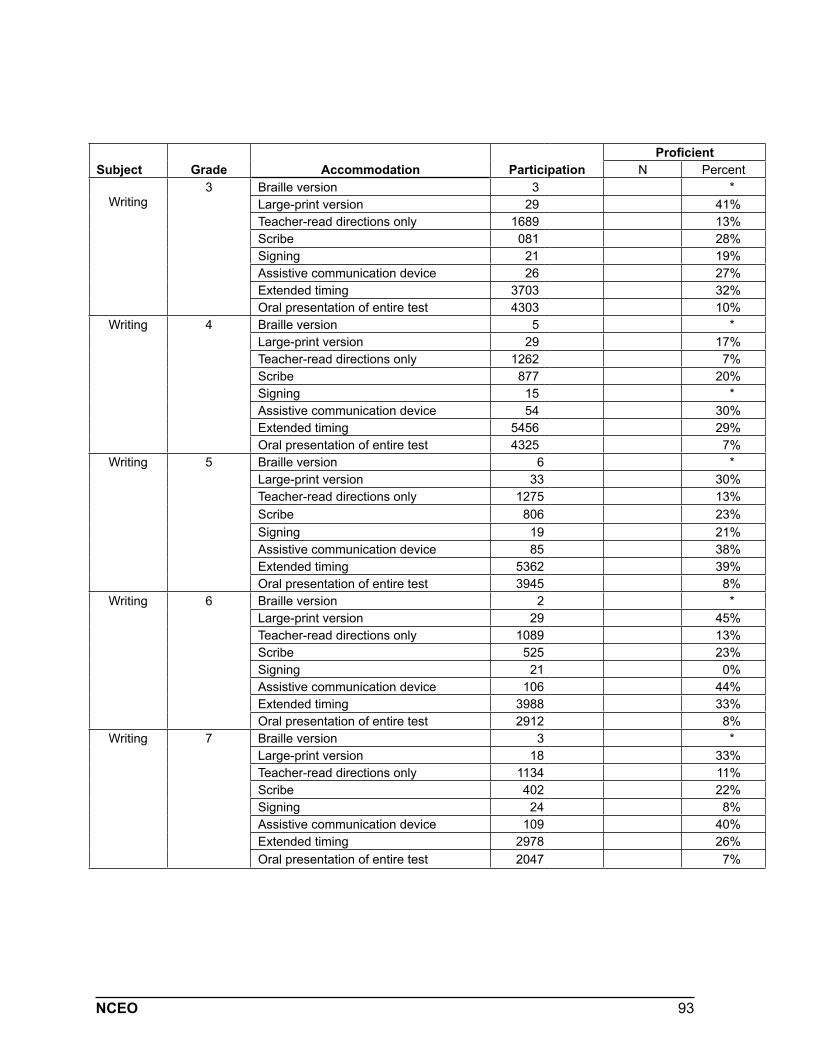
93NCEO
Subject Grade Accommodation ParticipationProficient
N Percent
Writing3 Braille version 3 *
Large-print version 29 41%Teacher-read directions only 1689 13%Scribe 081 28%Signing 21 19%Assistive communication device 26 27%Extended timing 3703 32%Oral presentation of entire test 4303 10%
Writing 4 Braille version 5 *Large-print version 29 17%Teacher-read directions only 1262 7%Scribe 877 20%Signing 15 *Assistive communication device 54 30%Extended timing 5456 29%Oral presentation of entire test 4325 7%
Writing 5 Braille version 6 *Large-print version 33 30%Teacher-read directions only 1275 13%Scribe 806 23%Signing 19 21%Assistive communication device 85 38%Extended timing 5362 39%Oral presentation of entire test 3945 8%
Writing 6 Braille version 2 *Large-print version 29 45%Teacher-read directions only 1089 13%Scribe 525 23%Signing 21 0%Assistive communication device 106 44%Extended timing 3988 33%Oral presentation of entire test 2912 8%
Writing 7 Braille version 3 *Large-print version 18 33%Teacher-read directions only 1134 11%Scribe 402 22%Signing 24 8%Assistive communication device 109 40%Extended timing 2978 26%Oral presentation of entire test 2047 7%
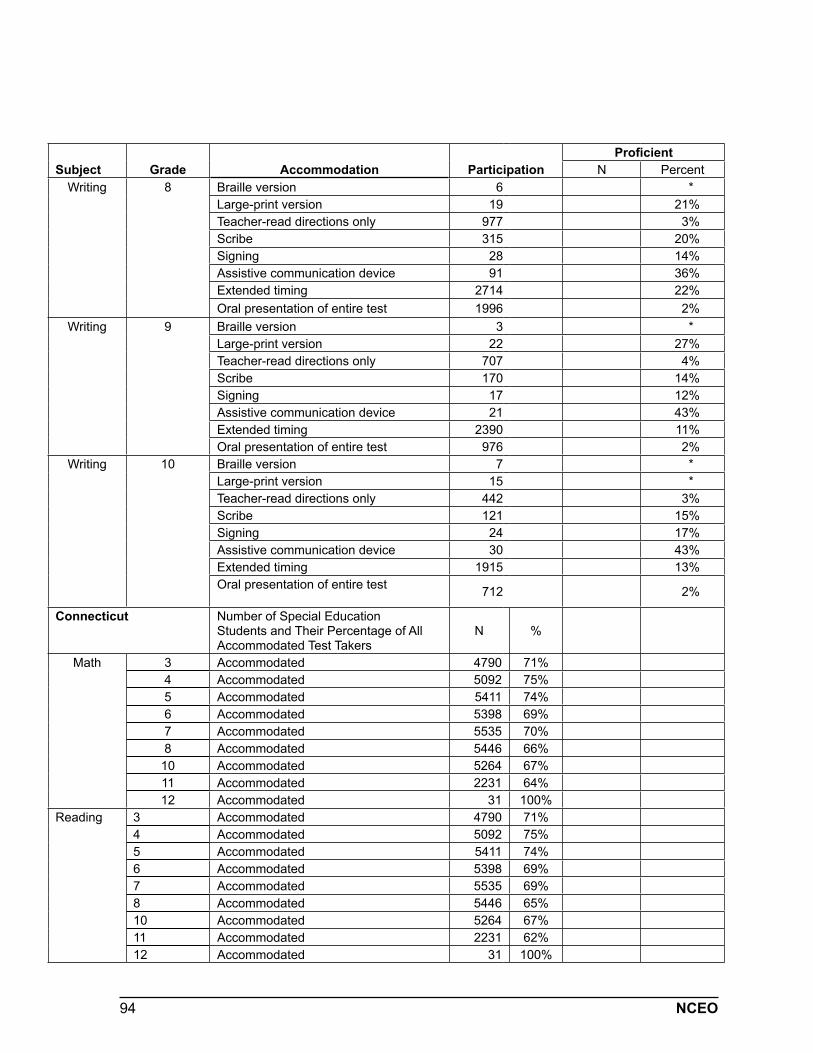
94 NCEO
Subject Grade Accommodation ParticipationProficient
N PercentWriting 8 Braille version 6 *
Large-print version 19 21%Teacher-read directions only 977 3%Scribe 315 20%Signing 28 14%Assistive communication device 91 36%Extended timing 2714 22%Oral presentation of entire test 1996 2%
Writing 9 Braille version 3 *Large-print version 22 27%Teacher-read directions only 707 4%Scribe 170 14%Signing 17 12%Assistive communication device 21 43%Extended timing 2390 11%Oral presentation of entire test 976 2%
Writing 10 Braille version 7 *Large-print version 15 *Teacher-read directions only 442 3%Scribe 121 15%Signing 24 17%Assistive communication device 30 43%Extended timing 1915 13%Oral presentation of entire test 712 2%
Connecticut Number of Special Education Students and Their Percentage of All Accommodated Test Takers
N %
Math 3 Accommodated 4790 71%4 Accommodated 5092 75%5 Accommodated 5411 74%6 Accommodated 5398 69%7 Accommodated 5535 70%8 Accommodated 5446 66%10 Accommodated 5264 67%11 Accommodated 2231 64%12 Accommodated 31 100%
Reading 3 Accommodated 4790 71%4 Accommodated 5092 75%5 Accommodated 5411 74%6 Accommodated 5398 69%7 Accommodated 5535 69%8 Accommodated 5446 65%10 Accommodated 5264 67%11 Accommodated 2231 62%12 Accommodated 31 100%
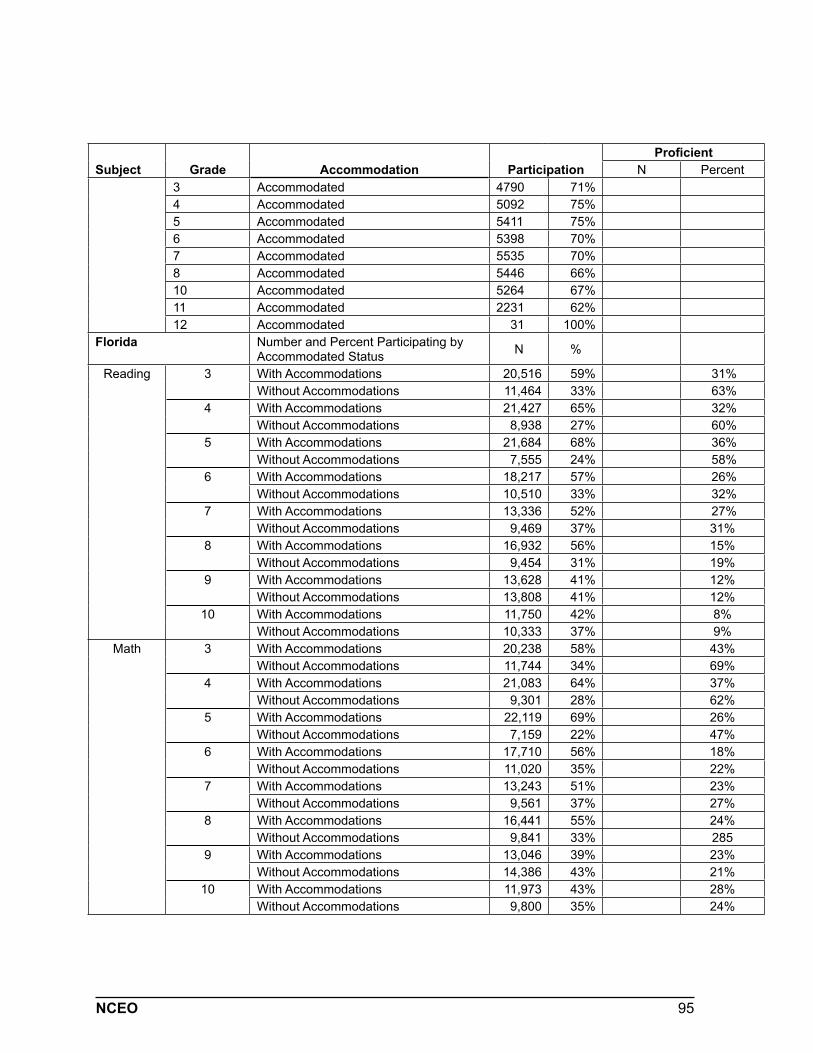
95NCEO
Subject Grade Accommodation ParticipationProficient
N Percent3 Accommodated 4790 71%4 Accommodated 5092 75%5 Accommodated 5411 75%6 Accommodated 5398 70%7 Accommodated 5535 70%8 Accommodated 5446 66%10 Accommodated 5264 67%11 Accommodated 2231 62%12 Accommodated 31 100%
Florida Number and Percent Participating by Accommodated Status N %
Reading 3 With Accommodations 20,516 59% 31%Without Accommodations 11,464 33% 63%
4 With Accommodations 21,427 65% 32%Without Accommodations 8,938 27% 60%
5 With Accommodations 21,684 68% 36%Without Accommodations 7,555 24% 58%
6 With Accommodations 18,217 57% 26%Without Accommodations 10,510 33% 32%
7 With Accommodations 13,336 52% 27%Without Accommodations 9,469 37% 31%
8 With Accommodations 16,932 56% 15%Without Accommodations 9,454 31% 19%
9 With Accommodations 13,628 41% 12%Without Accommodations 13,808 41% 12%
10 With Accommodations 11,750 42% 8%Without Accommodations 10,333 37% 9%
Math 3 With Accommodations 20,238 58% 43%Without Accommodations 11,744 34% 69%
4 With Accommodations 21,083 64% 37%Without Accommodations 9,301 28% 62%
5 With Accommodations 22,119 69% 26%Without Accommodations 7,159 22% 47%
6 With Accommodations 17,710 56% 18%Without Accommodations 11,020 35% 22%
7 With Accommodations 13,243 51% 23%Without Accommodations 9,561 37% 27%
8 With Accommodations 16,441 55% 24%Without Accommodations 9,841 33% 285
9 With Accommodations 13,046 39% 23%Without Accommodations 14,386 43% 21%
10 With Accommodations 11,973 43% 28%Without Accommodations 9,800 35% 24%
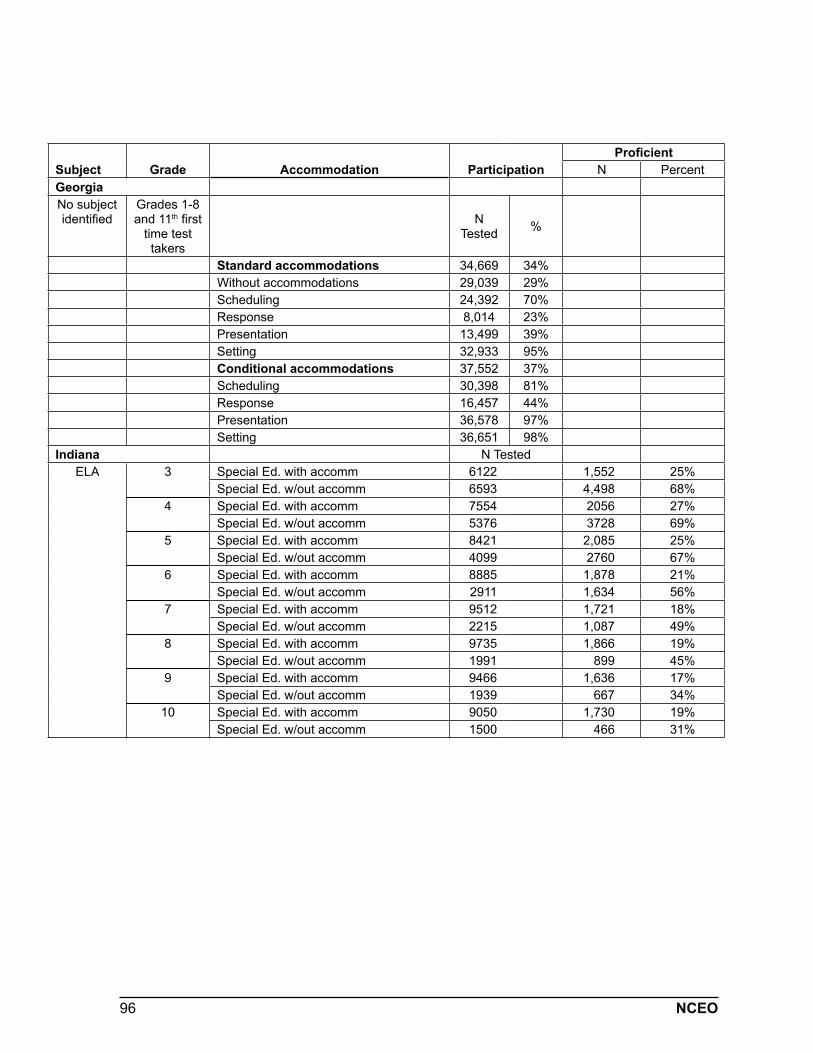
96 NCEO
Subject Grade Accommodation ParticipationProficient
N PercentGeorgiaNo subject identified
Grades 1-8 and 11th first
time test takers
N Tested %
Standard accommodations 34,669 34%Without accommodations 29,039 29%Scheduling 24,392 70%Response 8,014 23%Presentation 13,499 39%Setting 32,933 95%Conditional accommodations 37,552 37%Scheduling 30,398 81%Response 16,457 44%Presentation 36,578 97%Setting 36,651 98%
Indiana N TestedELA 3 Special Ed. with accomm 6122 1,552 25%
Special Ed. w/out accomm 6593 4,498 68%4 Special Ed. with accomm 7554 2056 27%
Special Ed. w/out accomm 5376 3728 69%5 Special Ed. with accomm 8421 2,085 25%
Special Ed. w/out accomm 4099 2760 67%6 Special Ed. with accomm 8885 1,878 21%
Special Ed. w/out accomm 2911 1,634 56%7 Special Ed. with accomm 9512 1,721 18%
Special Ed. w/out accomm 2215 1,087 49%8 Special Ed. with accomm 9735 1,866 19%
Special Ed. w/out accomm 1991 899 45%9 Special Ed. with accomm 9466 1,636 17%
Special Ed. w/out accomm 1939 667 34%10 Special Ed. with accomm 9050 1,730 19%
Special Ed. w/out accomm 1500 466 31%
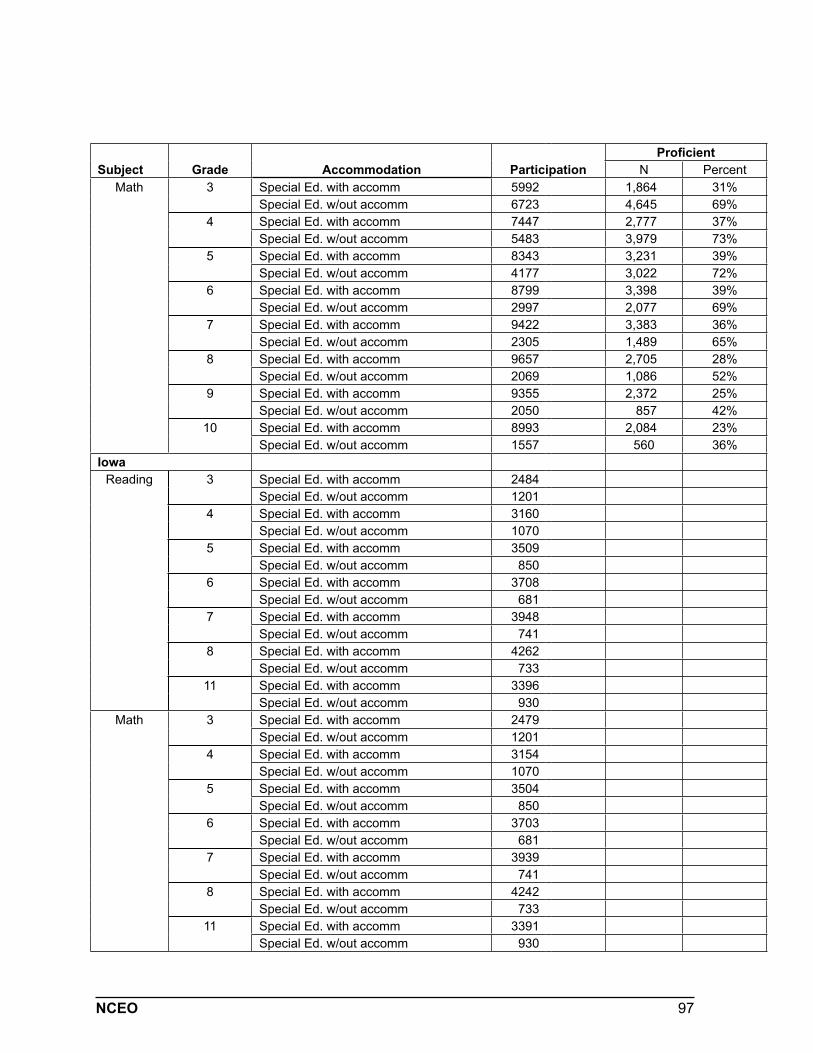
97NCEO
Subject Grade Accommodation ParticipationProficient
N PercentMath 3 Special Ed. with accomm 5992 1,864 31%
Special Ed. w/out accomm 6723 4,645 69%4 Special Ed. with accomm 7447 2,777 37%
Special Ed. w/out accomm 5483 3,979 73%5 Special Ed. with accomm 8343 3,231 39%
Special Ed. w/out accomm 4177 3,022 72%6 Special Ed. with accomm 8799 3,398 39%
Special Ed. w/out accomm 2997 2,077 69%7 Special Ed. with accomm 9422 3,383 36%
Special Ed. w/out accomm 2305 1,489 65%8 Special Ed. with accomm 9657 2,705 28%
Special Ed. w/out accomm 2069 1,086 52%9 Special Ed. with accomm 9355 2,372 25%
Special Ed. w/out accomm 2050 857 42%10 Special Ed. with accomm 8993 2,084 23%
Special Ed. w/out accomm 1557 560 36%Iowa
Reading 3 Special Ed. with accomm 2484Special Ed. w/out accomm 1201
4 Special Ed. with accomm 3160Special Ed. w/out accomm 1070
5 Special Ed. with accomm 3509Special Ed. w/out accomm 850
6 Special Ed. with accomm 3708Special Ed. w/out accomm 681
7 Special Ed. with accomm 3948Special Ed. w/out accomm 741
8 Special Ed. with accomm 4262Special Ed. w/out accomm 733
11 Special Ed. with accomm 3396Special Ed. w/out accomm 930
Math 3 Special Ed. with accomm 2479Special Ed. w/out accomm 1201
4 Special Ed. with accomm 3154Special Ed. w/out accomm 1070
5 Special Ed. with accomm 3504Special Ed. w/out accomm 850
6 Special Ed. with accomm 3703Special Ed. w/out accomm 681
7 Special Ed. with accomm 3939Special Ed. w/out accomm 741
8 Special Ed. with accomm 4242Special Ed. w/out accomm 733
11 Special Ed. with accomm 3391Special Ed. w/out accomm 930
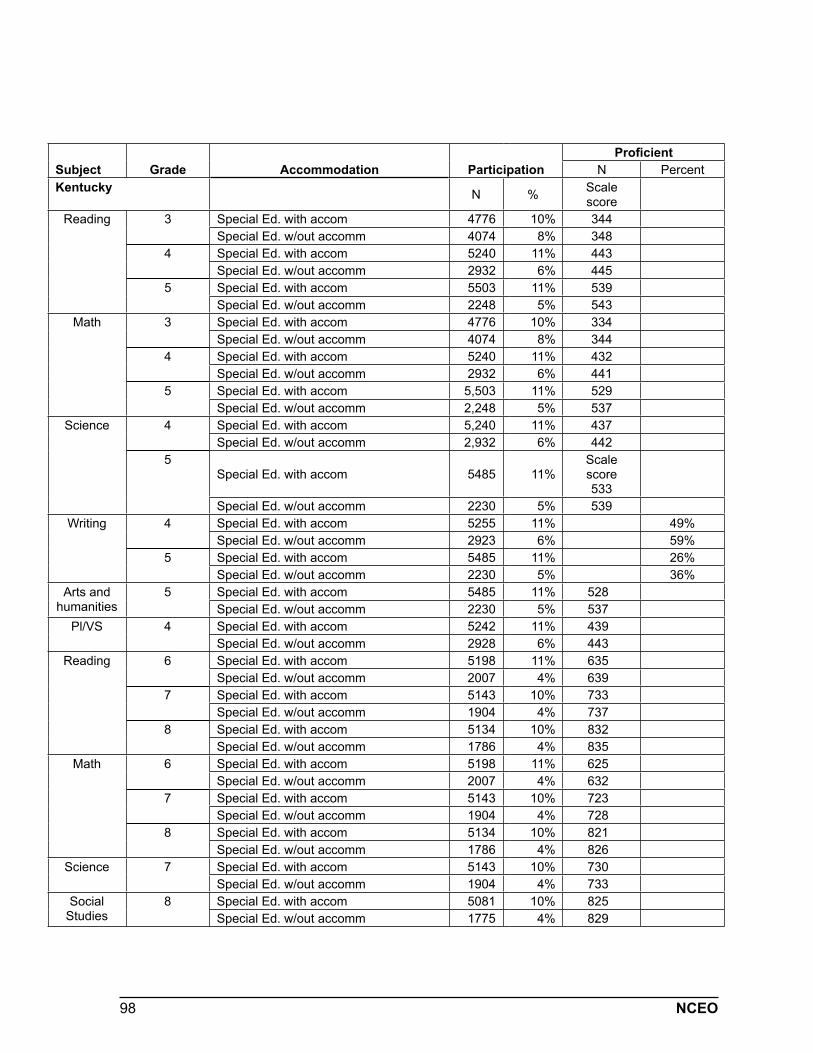
98 NCEO
Subject Grade Accommodation ParticipationProficient
N PercentKentucky N % Scale
scoreReading 3 Special Ed. with accom 4776 10% 344
Special Ed. w/out accomm 4074 8% 3484 Special Ed. with accom 5240 11% 443
Special Ed. w/out accomm 2932 6% 4455 Special Ed. with accom 5503 11% 539
Special Ed. w/out accomm 2248 5% 543Math 3 Special Ed. with accom 4776 10% 334
Special Ed. w/out accomm 4074 8% 3444 Special Ed. with accom 5240 11% 432
Special Ed. w/out accomm 2932 6% 4415 Special Ed. with accom 5,503 11% 529
Special Ed. w/out accomm 2,248 5% 537Science 4 Special Ed. with accom 5,240 11% 437
Special Ed. w/out accomm 2,932 6% 4425
Special Ed. with accom 5485 11%Scale score 533
Special Ed. w/out accomm 2230 5% 539Writing 4 Special Ed. with accom 5255 11% 49%
Special Ed. w/out accomm 2923 6% 59%5 Special Ed. with accom 5485 11% 26%
Special Ed. w/out accomm 2230 5% 36%Arts and
humanities5 Special Ed. with accom 5485 11% 528
Special Ed. w/out accomm 2230 5% 537Pl/VS 4 Special Ed. with accom 5242 11% 439
Special Ed. w/out accomm 2928 6% 443Reading 6 Special Ed. with accom 5198 11% 635
Special Ed. w/out accomm 2007 4% 6397 Special Ed. with accom 5143 10% 733
Special Ed. w/out accomm 1904 4% 7378 Special Ed. with accom 5134 10% 832
Special Ed. w/out accomm 1786 4% 835Math 6 Special Ed. with accom 5198 11% 625
Special Ed. w/out accomm 2007 4% 6327 Special Ed. with accom 5143 10% 723
Special Ed. w/out accomm 1904 4% 7288 Special Ed. with accom 5134 10% 821
Special Ed. w/out accomm 1786 4% 826Science 7 Special Ed. with accom 5143 10% 730
Special Ed. w/out accomm 1904 4% 733Social
Studies8 Special Ed. with accom 5081 10% 825
Special Ed. w/out accomm 1775 4% 829
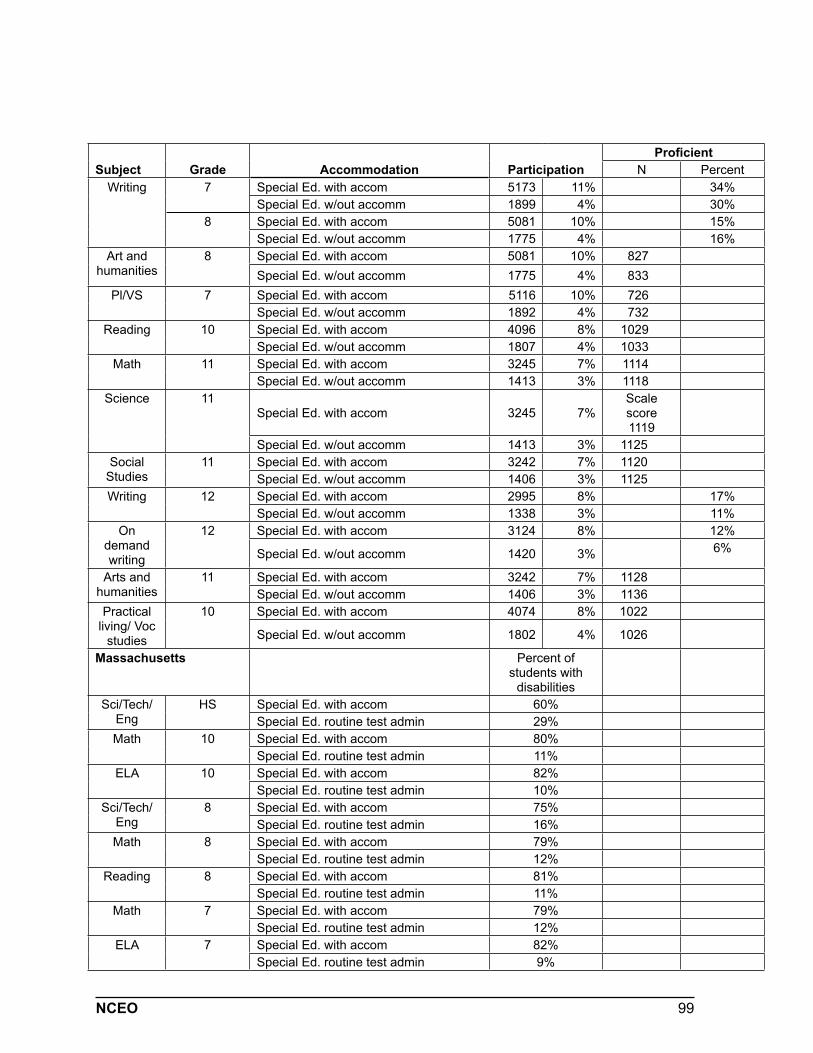
99NCEO
Subject Grade Accommodation ParticipationProficient
N PercentWriting 7 Special Ed. with accom 5173 11% 34%
Special Ed. w/out accomm 1899 4% 30%8 Special Ed. with accom 5081 10% 15%
Special Ed. w/out accomm 1775 4% 16%Art and
humanities8 Special Ed. with accom 5081 10% 827
Special Ed. w/out accomm 1775 4% 833Pl/VS 7 Special Ed. with accom 5116 10% 726
Special Ed. w/out accomm 1892 4% 732 Reading 10 Special Ed. with accom 4096 8% 1029
Special Ed. w/out accomm 1807 4% 1033Math 11 Special Ed. with accom 3245 7% 1114
Special Ed. w/out accomm 1413 3% 1118Science 11
Special Ed. with accom 3245 7%Scale score1119
Special Ed. w/out accomm 1413 3% 1125Social
Studies11 Special Ed. with accom 3242 7% 1120
Special Ed. w/out accomm 1406 3% 1125Writing 12 Special Ed. with accom 2995 8% 17%
Special Ed. w/out accomm 1338 3% 11%On
demand writing
12 Special Ed. with accom 3124 8% 12%
Special Ed. w/out accomm 1420 3% 6%
Arts and humanities
11 Special Ed. with accom 3242 7% 1128Special Ed. w/out accomm 1406 3% 1136
Practical living/ Voc
studies
10 Special Ed. with accom 4074 8% 1022
Special Ed. w/out accomm 1802 4% 1026
Massachusetts Percent of students with
disabilitiesSci/Tech/
EngHS Special Ed. with accom 60%
Special Ed. routine test admin 29%Math 10 Special Ed. with accom 80%
Special Ed. routine test admin 11%ELA 10 Special Ed. with accom 82%
Special Ed. routine test admin 10%Sci/Tech/
Eng8 Special Ed. with accom 75%
Special Ed. routine test admin 16%Math 8 Special Ed. with accom 79%
Special Ed. routine test admin 12%Reading 8 Special Ed. with accom 81%
Special Ed. routine test admin 11%Math 7 Special Ed. with accom 79%
Special Ed. routine test admin 12%ELA 7 Special Ed. with accom 82%
Special Ed. routine test admin 9%
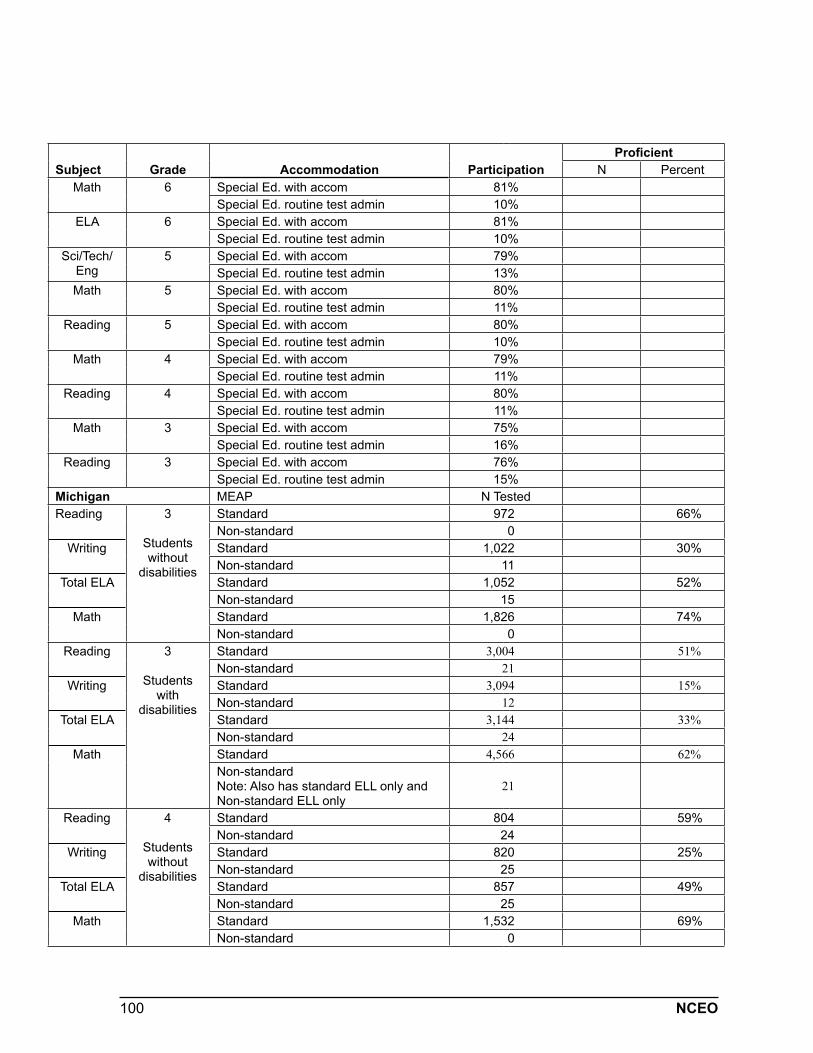
100 NCEO
Subject Grade Accommodation ParticipationProficient
N PercentMath 6 Special Ed. with accom 81%
Special Ed. routine test admin 10%ELA 6 Special Ed. with accom 81%
Special Ed. routine test admin 10%Sci/Tech/
Eng5 Special Ed. with accom 79%
Special Ed. routine test admin 13%Math 5 Special Ed. with accom 80%
Special Ed. routine test admin 11%Reading 5 Special Ed. with accom 80%
Special Ed. routine test admin 10%Math 4 Special Ed. with accom 79%
Special Ed. routine test admin 11%Reading 4 Special Ed. with accom 80%
Special Ed. routine test admin 11%Math 3 Special Ed. with accom 75%
Special Ed. routine test admin 16%Reading 3 Special Ed. with accom 76%
Special Ed. routine test admin 15%Michigan MEAP N TestedReading 3
Students without
disabilities
Standard 972 66%Non-standard 0
Writing Standard 1,022 30%Non-standard 11
Total ELA Standard 1,052 52%Non-standard 15
Math Standard 1,826 74%Non-standard 0
Reading 3
Students with
disabilities
Standard 3,004 51%Non-standard 21
Writing Standard 3,094 15%Non-standard 12
Total ELA Standard 3,144 33%Non-standard 24
Math Standard 4,566 62%Non-standardNote: Also has standard ELL only and Non-standard ELL only
21
Reading 4
Students without
disabilities
Standard 804 59%Non-standard 24
Writing Standard 820 25%Non-standard 25
Total ELA Standard 857 49%Non-standard 25
Math Standard 1,532 69%Non-standard 0
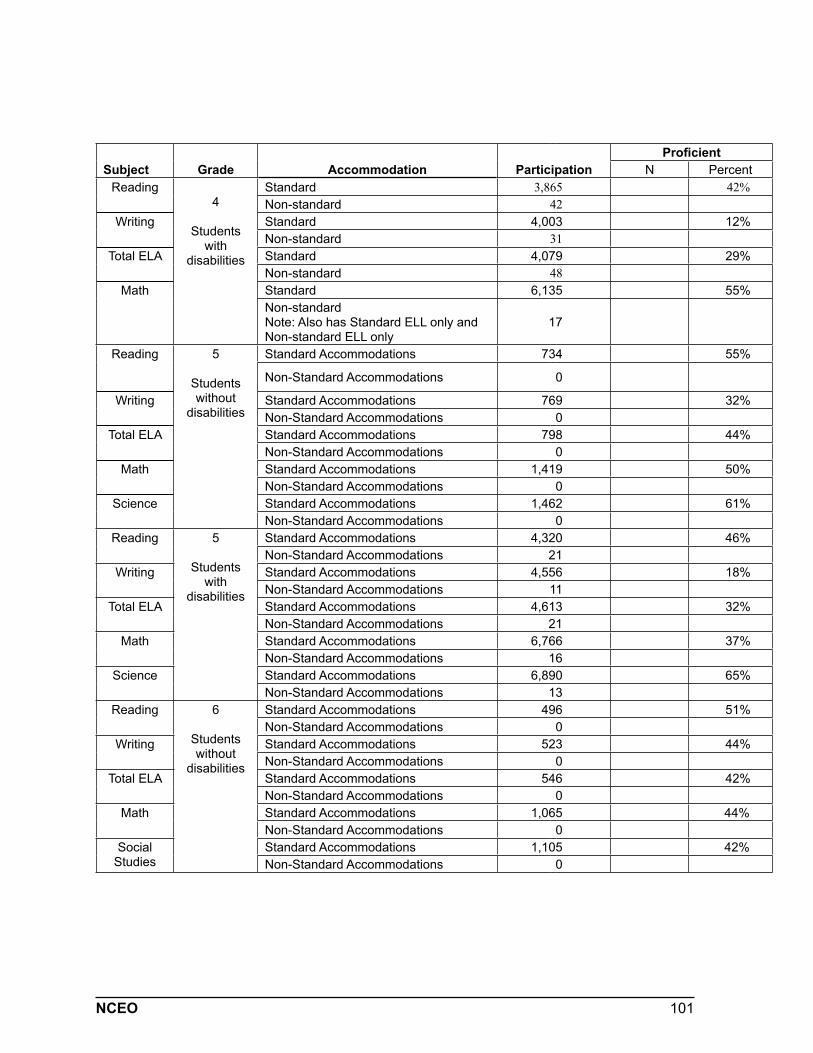
101NCEO
Subject Grade Accommodation ParticipationProficient
N PercentReading
4
Students with
disabilities
Standard 3,865 42%Non-standard 42
Writing Standard 4,003 12%Non-standard 31
Total ELA Standard 4,079 29%Non-standard 48
Math Standard 6,135 55%Non-standardNote: Also has Standard ELL only and Non-standard ELL only
17
Reading 5
Students without
disabilities
Standard Accommodations 734 55%
Non-Standard Accommodations 0
Writing Standard Accommodations 769 32%Non-Standard Accommodations 0
Total ELA Standard Accommodations 798 44%Non-Standard Accommodations 0
Math Standard Accommodations 1,419 50%Non-Standard Accommodations 0
Science Standard Accommodations 1,462 61%Non-Standard Accommodations 0
Reading 5
Students with
disabilities
Standard Accommodations 4,320 46%Non-Standard Accommodations 21
Writing Standard Accommodations 4,556 18%Non-Standard Accommodations 11
Total ELA Standard Accommodations 4,613 32%Non-Standard Accommodations 21
Math Standard Accommodations 6,766 37%Non-Standard Accommodations 16
Science Standard Accommodations 6,890 65%Non-Standard Accommodations 13
Reading 6
Students without
disabilities
Standard Accommodations 496 51%Non-Standard Accommodations 0
Writing Standard Accommodations 523 44%Non-Standard Accommodations 0
Total ELA Standard Accommodations 546 42%Non-Standard Accommodations 0
Math Standard Accommodations 1,065 44%Non-Standard Accommodations 0
Social Studies
Standard Accommodations 1,105 42%Non-Standard Accommodations 0
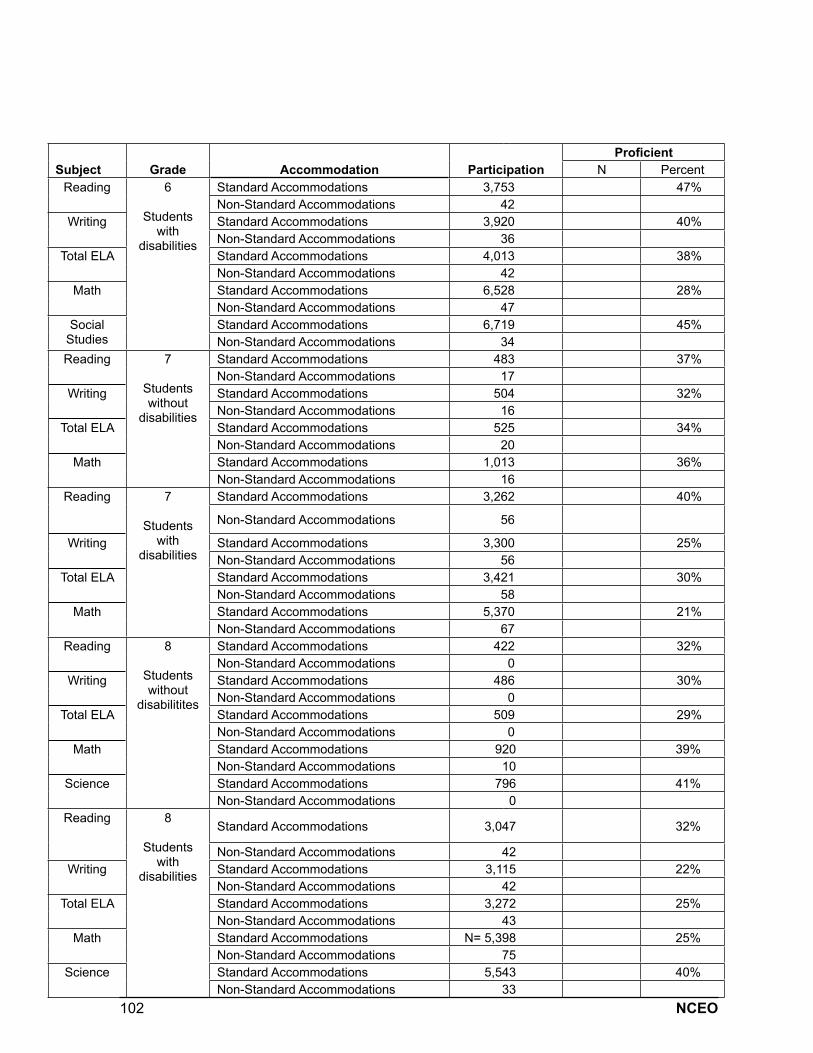
102 NCEO
Subject Grade Accommodation ParticipationProficient
N PercentReading 6
Students with
disabilities
Standard Accommodations 3,753 47%Non-Standard Accommodations 42
Writing Standard Accommodations 3,920 40%Non-Standard Accommodations 36
Total ELA Standard Accommodations 4,013 38%Non-Standard Accommodations 42
Math Standard Accommodations 6,528 28%Non-Standard Accommodations 47
Social Studies
Standard Accommodations 6,719 45%Non-Standard Accommodations 34
Reading 7
Students without
disabilities
Standard Accommodations 483 37%Non-Standard Accommodations 17
Writing Standard Accommodations 504 32%Non-Standard Accommodations 16
Total ELA Standard Accommodations 525 34%Non-Standard Accommodations 20
Math Standard Accommodations 1,013 36%Non-Standard Accommodations 16
Reading 7
Students with
disabilities
Standard Accommodations 3,262 40%
Non-Standard Accommodations 56
Writing Standard Accommodations 3,300 25%Non-Standard Accommodations 56
Total ELA Standard Accommodations 3,421 30%Non-Standard Accommodations 58
Math Standard Accommodations 5,370 21%Non-Standard Accommodations 67
Reading 8
Students without
disabilitites
Standard Accommodations 422 32%Non-Standard Accommodations 0
Writing Standard Accommodations 486 30%Non-Standard Accommodations 0
Total ELA Standard Accommodations 509 29%Non-Standard Accommodations 0
Math Standard Accommodations 920 39%Non-Standard Accommodations 10
Science Standard Accommodations 796 41%Non-Standard Accommodations 0
Reading 8
Students with
disabilities
Standard Accommodations 3,047 32%
Non-Standard Accommodations 42Writing Standard Accommodations 3,115 22%
Non-Standard Accommodations 42Total ELA Standard Accommodations 3,272 25%
Non-Standard Accommodations 43Math Standard Accommodations N= 5,398 25%
Non-Standard Accommodations 75Science Standard Accommodations 5,543 40%
Non-Standard Accommodations 33
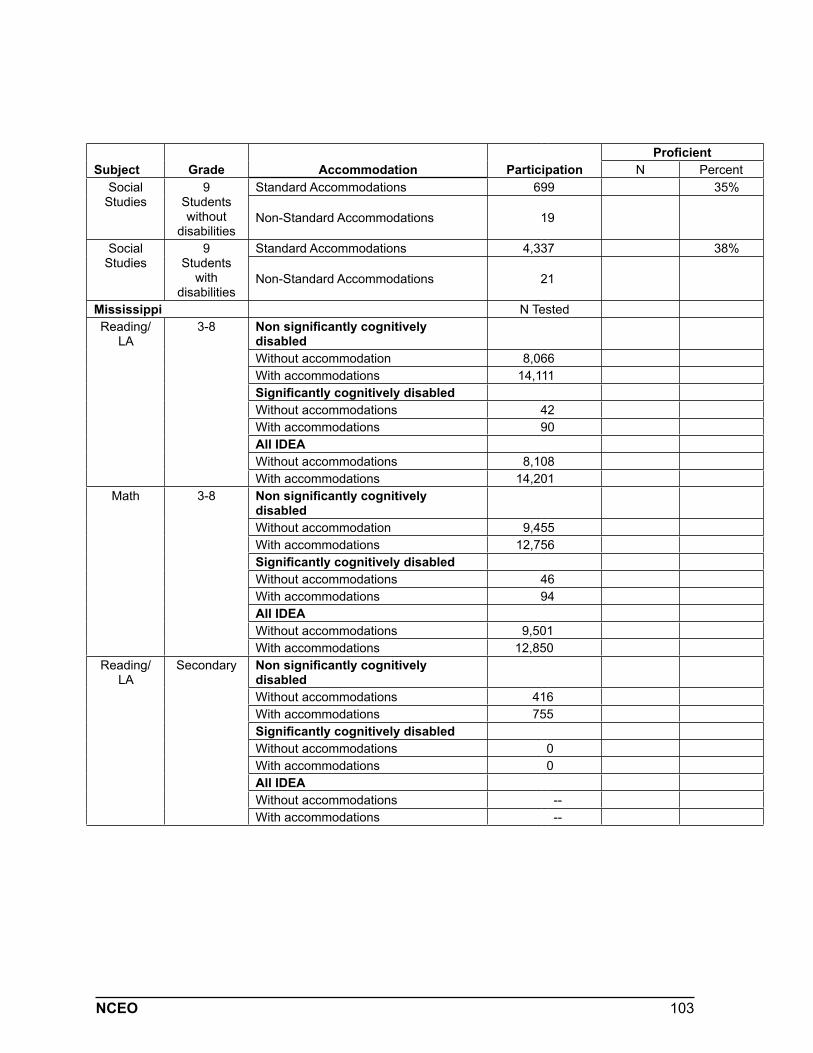
103NCEO
Subject Grade Accommodation ParticipationProficient
N PercentSocial
Studies9
Students without
disabilities
Standard Accommodations 699 35%
Non-Standard Accommodations 19
Social Studies
9Students
with disabilities
Standard Accommodations 4,337 38%
Non-Standard Accommodations 21
Mississippi N TestedReading/
LA3-8 Non significantly cognitively
disabled Without accommodation 8,066With accommodations 14,111Significantly cognitively disabled Without accommodations 42With accommodations 90All IDEAWithout accommodations 8,108With accommodations 14,201
Math 3-8 Non significantly cognitively disabled Without accommodation 9,455With accommodations 12,756Significantly cognitively disabled Without accommodations 46With accommodations 94All IDEAWithout accommodations 9,501With accommodations 12,850
Reading/LA
Secondary Non significantly cognitively disabled Without accommodations 416With accommodations 755Significantly cognitively disabled Without accommodations 0With accommodations 0All IDEAWithout accommodations --With accommodations --
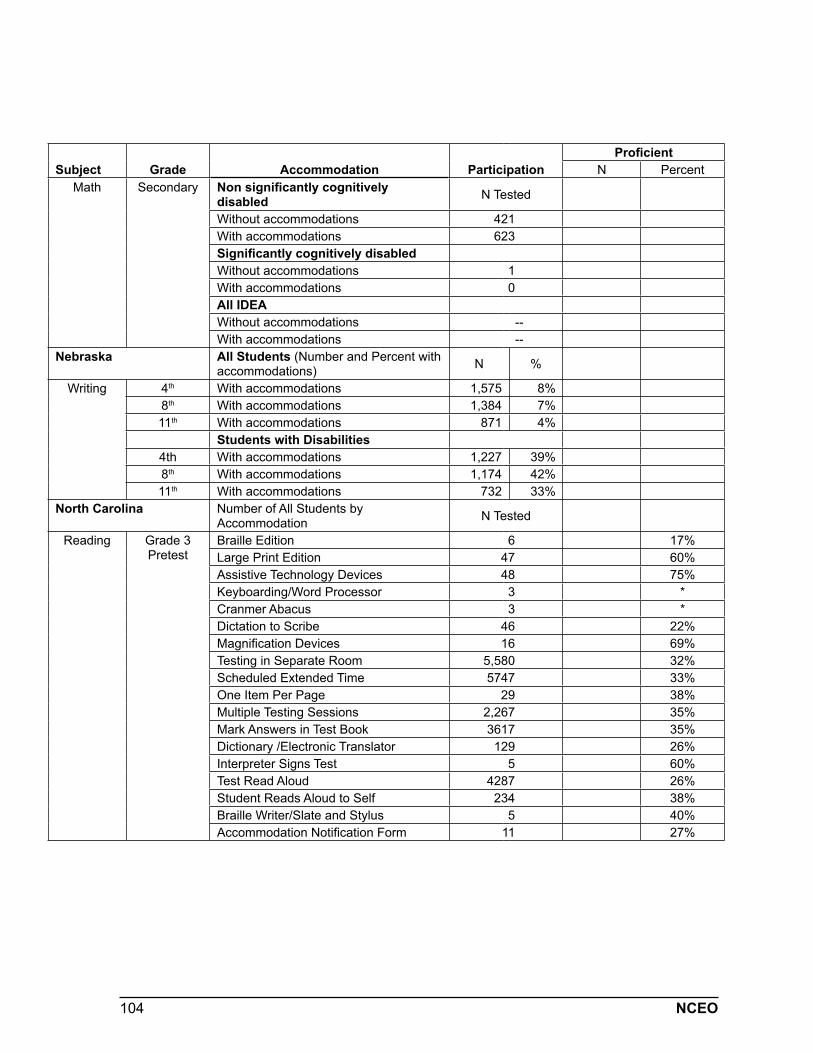
104 NCEO
Subject Grade Accommodation ParticipationProficient
N PercentMath Secondary Non significantly cognitively
disabled N Tested
Without accommodations 421With accommodations 623Significantly cognitively disabled Without accommodations 1With accommodations 0All IDEAWithout accommodations --With accommodations --
Nebraska All Students (Number and Percent with accommodations) N %
Writing 4th With accommodations 1,575 8%8th With accommodations 1,384 7%11th With accommodations 871 4%
Students with Disabilities4th With accommodations 1,227 39%8th With accommodations 1,174 42%11th With accommodations 732 33%
North Carolina Number of All Students by Accommodation N Tested
Reading Grade 3 Pretest
Braille Edition 6 17%Large Print Edition 47 60%Assistive Technology Devices 48 75%Keyboarding/Word Processor 3 *Cranmer Abacus 3 *Dictation to Scribe 46 22%Magnification Devices 16 69%Testing in Separate Room 5,580 32%Scheduled Extended Time 5747 33%One Item Per Page 29 38%Multiple Testing Sessions 2,267 35%Mark Answers in Test Book 3617 35%Dictionary /Electronic Translator 129 26%Interpreter Signs Test 5 60%Test Read Aloud 4287 26%Student Reads Aloud to Self 234 38%Braille Writer/Slate and Stylus 5 40%Accommodation Notification Form 11 27%
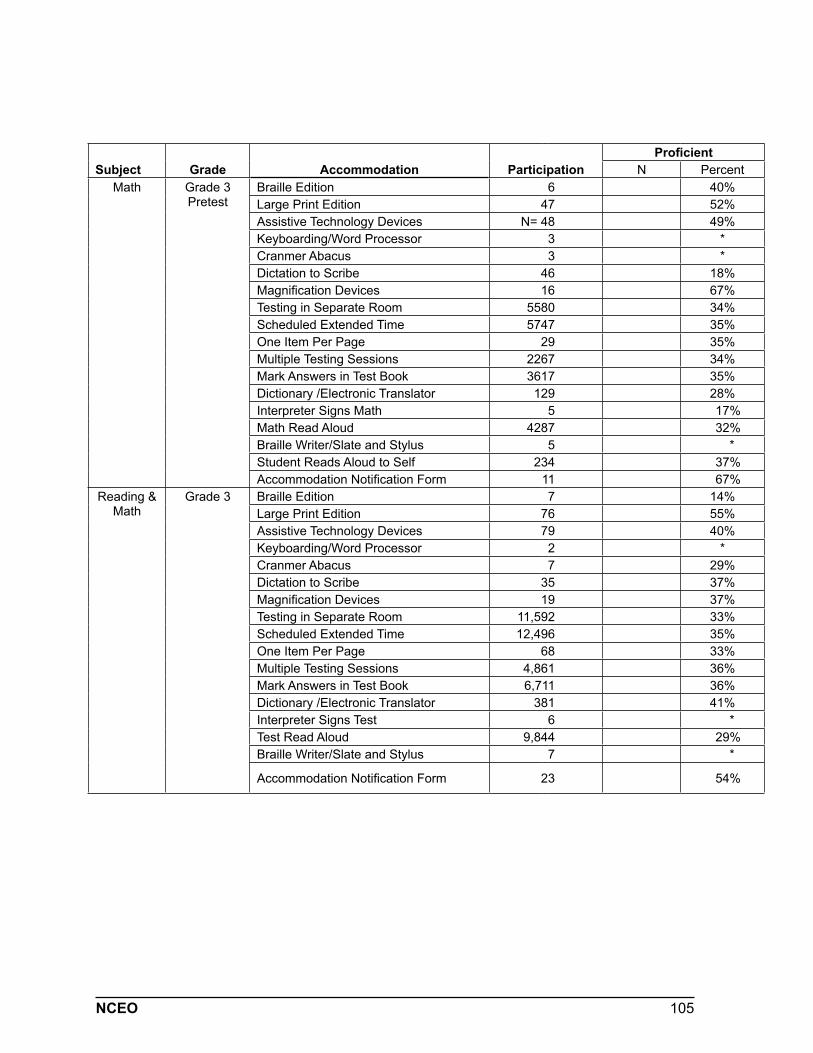
105NCEO
Subject Grade Accommodation ParticipationProficient
N PercentMath Grade 3
PretestBraille Edition 6 40%Large Print Edition 47 52%Assistive Technology Devices N= 48 49%Keyboarding/Word Processor 3 *Cranmer Abacus 3 *Dictation to Scribe 46 18%Magnification Devices 16 67%Testing in Separate Room 5580 34%Scheduled Extended Time 5747 35%One Item Per Page 29 35%Multiple Testing Sessions 2267 34%Mark Answers in Test Book 3617 35%Dictionary /Electronic Translator 129 28%Interpreter Signs Math 5 17%Math Read Aloud 4287 32%Braille Writer/Slate and Stylus 5 *Student Reads Aloud to Self 234 37%Accommodation Notification Form 11 67%
Reading & Math
Grade 3 Braille Edition 7 14%Large Print Edition 76 55%Assistive Technology Devices 79 40%Keyboarding/Word Processor 2 *Cranmer Abacus 7 29%Dictation to Scribe 35 37%Magnification Devices 19 37%Testing in Separate Room 11,592 33%Scheduled Extended Time 12,496 35%One Item Per Page 68 33%Multiple Testing Sessions 4,861 36%Mark Answers in Test Book 6,711 36%Dictionary /Electronic Translator 381 41%Interpreter Signs Test 6 *Test Read Aloud 9,844 29%Braille Writer/Slate and Stylus 7 *
Accommodation Notification Form 23 54%
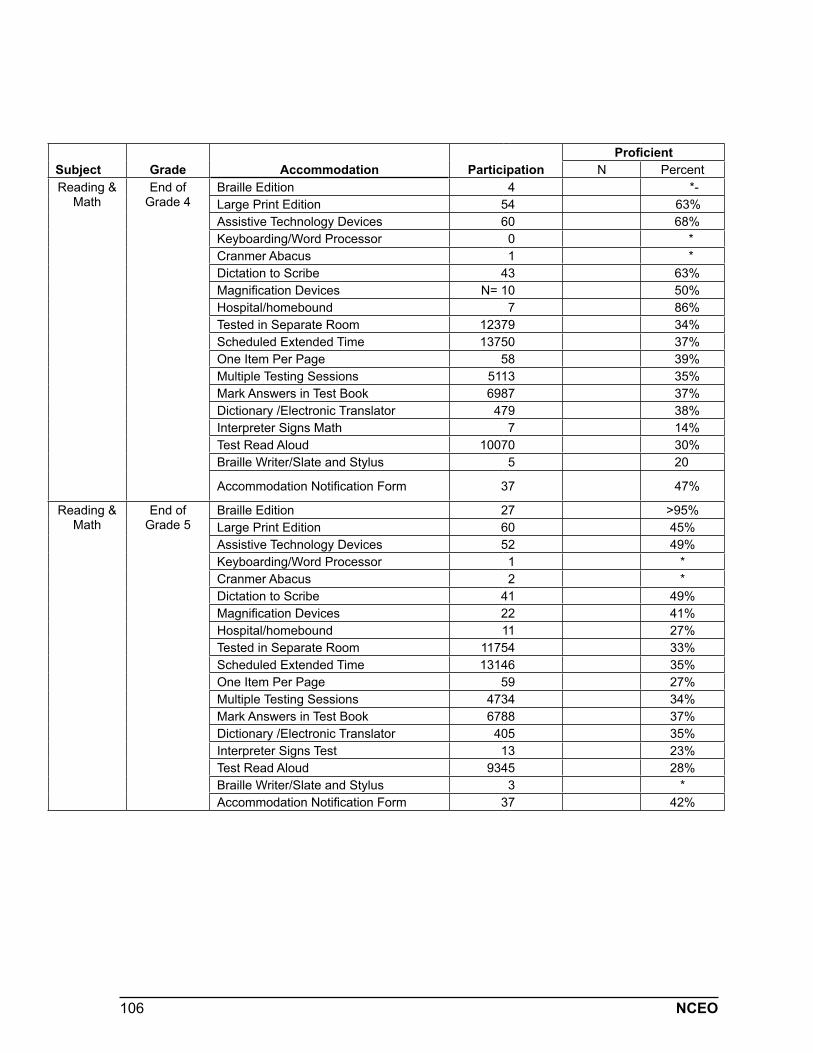
106 NCEO
Subject Grade Accommodation ParticipationProficient
N PercentReading &
MathEnd of
Grade 4Braille Edition 4 *-Large Print Edition 54 63%Assistive Technology Devices 60 68%Keyboarding/Word Processor 0 *Cranmer Abacus 1 *Dictation to Scribe 43 63%Magnification Devices N= 10 50%Hospital/homebound 7 86%Tested in Separate Room 12379 34%Scheduled Extended Time 13750 37%One Item Per Page 58 39%Multiple Testing Sessions 5113 35%Mark Answers in Test Book 6987 37%Dictionary /Electronic Translator 479 38%Interpreter Signs Math 7 14%Test Read Aloud 10070 30%Braille Writer/Slate and Stylus 5 20
Accommodation Notification Form 37 47%
Reading & Math
End of Grade 5
Braille Edition 27 >95%Large Print Edition 60 45%Assistive Technology Devices 52 49%Keyboarding/Word Processor 1 *Cranmer Abacus 2 *Dictation to Scribe 41 49%Magnification Devices 22 41%Hospital/homebound 11 27%Tested in Separate Room 11754 33%Scheduled Extended Time 13146 35%One Item Per Page 59 27%Multiple Testing Sessions 4734 34%Mark Answers in Test Book 6788 37%Dictionary /Electronic Translator 405 35%Interpreter Signs Test 13 23%Test Read Aloud 9345 28%Braille Writer/Slate and Stylus 3 *Accommodation Notification Form 37 42%
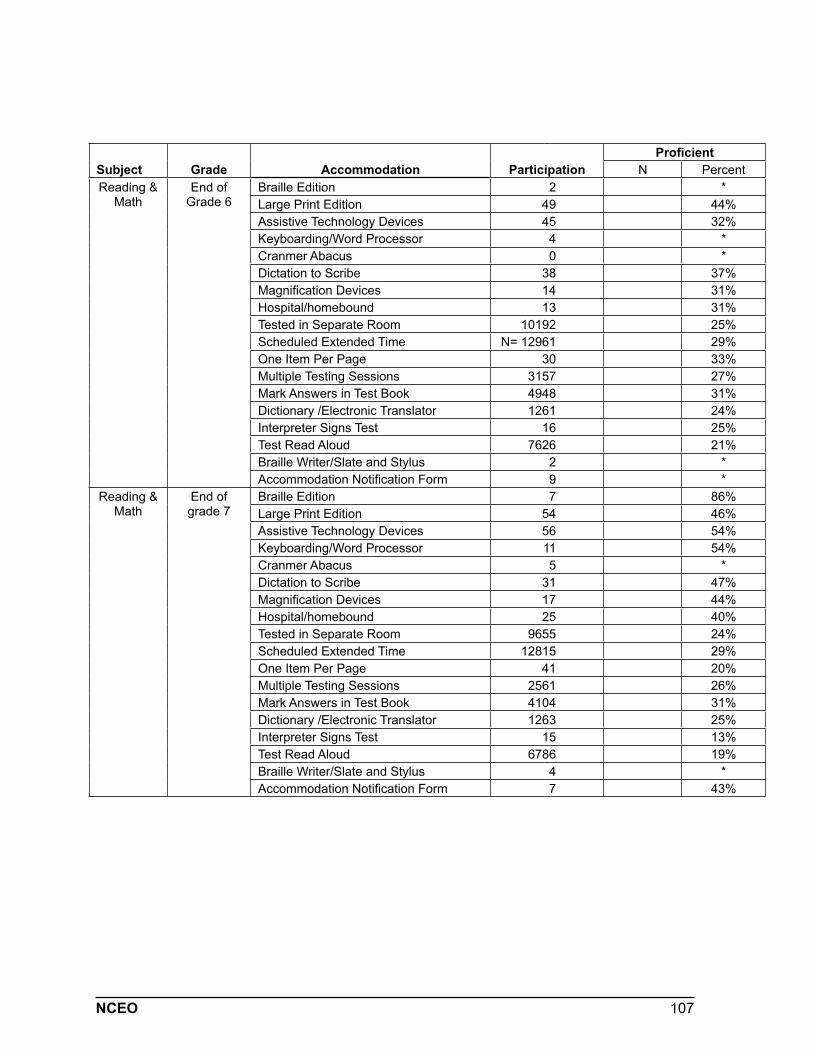
107NCEO
Subject Grade Accommodation ParticipationProficient
N PercentReading &
MathEnd of
Grade 6Braille Edition 2 *Large Print Edition 49 44%Assistive Technology Devices 45 32%Keyboarding/Word Processor 4 *Cranmer Abacus 0 *Dictation to Scribe 38 37%Magnification Devices 14 31%Hospital/homebound 13 31%Tested in Separate Room 10192 25%Scheduled Extended Time N= 12961 29%One Item Per Page 30 33%Multiple Testing Sessions 3157 27%Mark Answers in Test Book 4948 31%Dictionary /Electronic Translator 1261 24%Interpreter Signs Test 16 25%Test Read Aloud 7626 21%Braille Writer/Slate and Stylus 2 *Accommodation Notification Form 9 *
Reading & Math
End of grade 7
Braille Edition 7 86%Large Print Edition 54 46%Assistive Technology Devices 56 54%Keyboarding/Word Processor 11 54%Cranmer Abacus 5 *Dictation to Scribe 31 47%Magnification Devices 17 44%Hospital/homebound 25 40%Tested in Separate Room 9655 24%Scheduled Extended Time 12815 29%One Item Per Page 41 20%Multiple Testing Sessions 2561 26%Mark Answers in Test Book 4104 31%Dictionary /Electronic Translator 1263 25%Interpreter Signs Test 15 13%Test Read Aloud 6786 19%Braille Writer/Slate and Stylus 4 *Accommodation Notification Form 7 43%
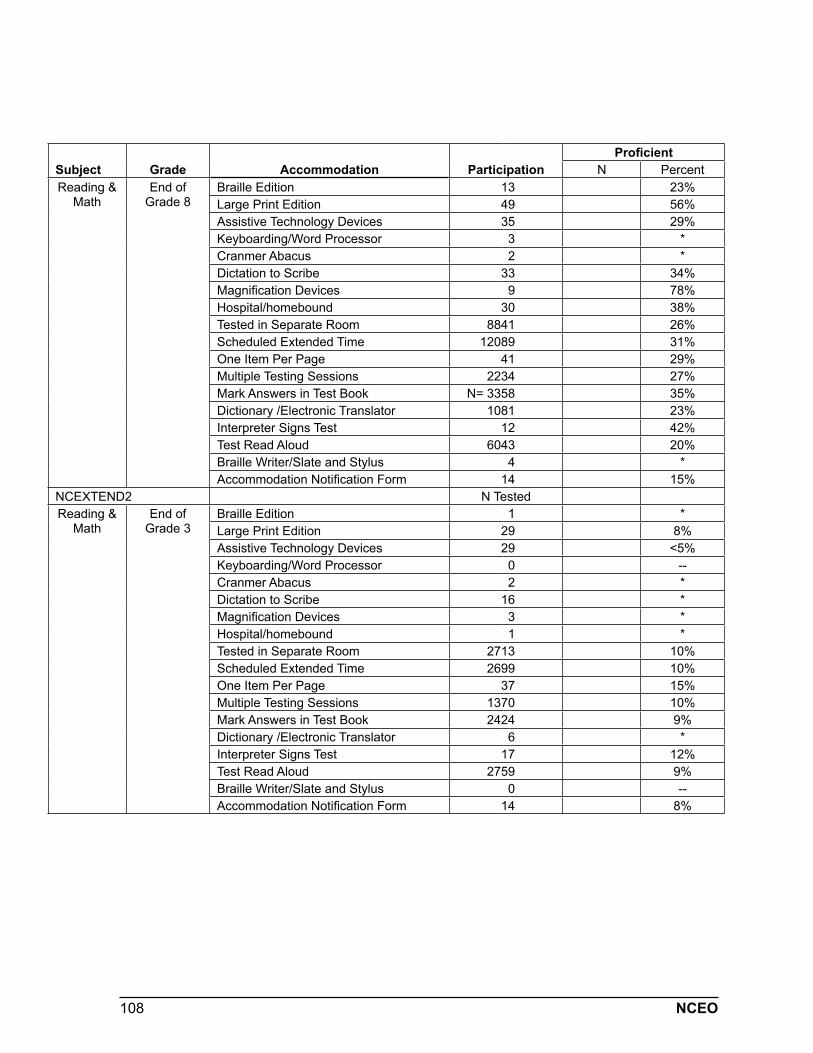
108 NCEO
Subject Grade Accommodation ParticipationProficient
N PercentReading &
MathEnd of
Grade 8Braille Edition 13 23%Large Print Edition 49 56%Assistive Technology Devices 35 29%Keyboarding/Word Processor 3 *Cranmer Abacus 2 *Dictation to Scribe 33 34%Magnification Devices 9 78%Hospital/homebound 30 38%Tested in Separate Room 8841 26%Scheduled Extended Time 12089 31%One Item Per Page 41 29%Multiple Testing Sessions 2234 27%Mark Answers in Test Book N= 3358 35%Dictionary /Electronic Translator 1081 23%Interpreter Signs Test 12 42%Test Read Aloud 6043 20%Braille Writer/Slate and Stylus 4 *Accommodation Notification Form 14 15%
NCEXTEND2 N TestedReading &
MathEnd of
Grade 3Braille Edition 1 *Large Print Edition 29 8%Assistive Technology Devices 29 <5%Keyboarding/Word Processor 0 --Cranmer Abacus 2 *Dictation to Scribe 16 *Magnification Devices 3 *Hospital/homebound 1 *Tested in Separate Room 2713 10%Scheduled Extended Time 2699 10%One Item Per Page 37 15%Multiple Testing Sessions 1370 10%Mark Answers in Test Book 2424 9%Dictionary /Electronic Translator 6 *Interpreter Signs Test 17 12%Test Read Aloud 2759 9%Braille Writer/Slate and Stylus 0 --Accommodation Notification Form 14 8%
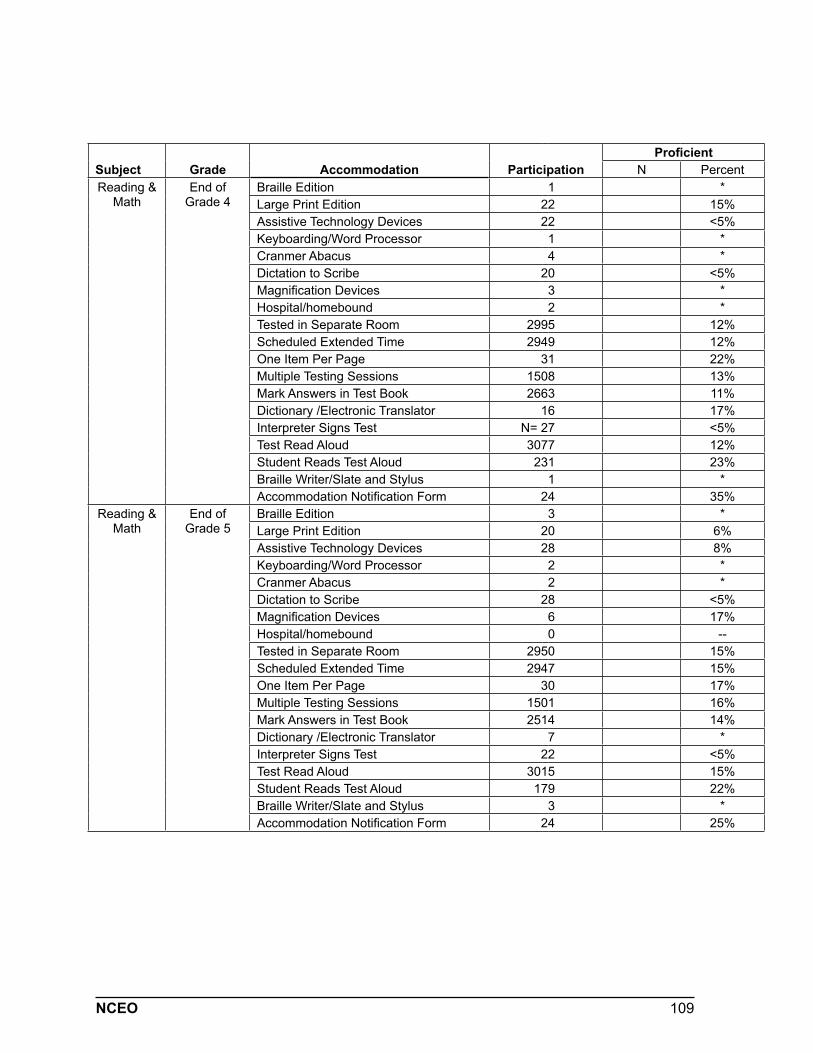
109NCEO
Subject Grade Accommodation ParticipationProficient
N PercentReading &
MathEnd of
Grade 4Braille Edition 1 *Large Print Edition 22 15%Assistive Technology Devices 22 <5%Keyboarding/Word Processor 1 *Cranmer Abacus 4 *Dictation to Scribe 20 <5%Magnification Devices 3 *Hospital/homebound 2 *Tested in Separate Room 2995 12%Scheduled Extended Time 2949 12%One Item Per Page 31 22%Multiple Testing Sessions 1508 13%Mark Answers in Test Book 2663 11%Dictionary /Electronic Translator 16 17%Interpreter Signs Test N= 27 <5%Test Read Aloud 3077 12%Student Reads Test Aloud 231 23%Braille Writer/Slate and Stylus 1 *Accommodation Notification Form 24 35%
Reading & Math
End of Grade 5
Braille Edition 3 *Large Print Edition 20 6%Assistive Technology Devices 28 8%Keyboarding/Word Processor 2 *Cranmer Abacus 2 *Dictation to Scribe 28 <5%Magnification Devices 6 17%Hospital/homebound 0 --Tested in Separate Room 2950 15%Scheduled Extended Time 2947 15%One Item Per Page 30 17%Multiple Testing Sessions 1501 16%Mark Answers in Test Book 2514 14%Dictionary /Electronic Translator 7 *Interpreter Signs Test 22 <5%Test Read Aloud 3015 15%Student Reads Test Aloud 179 22%Braille Writer/Slate and Stylus 3 *Accommodation Notification Form 24 25%

110 NCEO
Subject Grade Accommodation ParticipationProficient
N PercentReading &
MathEnd of
Grade 6Braille Edition 4 *Large Print Edition 14 8%Assistive Technology Devices 16 21%Keyboarding/Word Processor 1 *Cranmer Abacus 2 *Dictation to Scribe 13 17%Magnification Devices 2 *Hospital/homebound 2 *Tested in Separate Room 2634 17%Scheduled Extended Time 2724 18%One Item Per Page 17 7%Multiple Testing Sessions 996 18%Mark Answers in Test Book 1874 16%Dictionary /Electronic Translator 10 *Interpreter Signs Test 22 <5%Test Read Aloud N= 2682 17%Braille Writer/Slate and Stylus 4 *Accommodation Notification Form 7 40%
Reading & Math
End of Grade 7
Braille Edition 2 *Large Print Edition 13 18%Assistive Technology Devices 12 10%Keyboarding/Word Processor 0 --Cranmer Abacus 0 --Dictation to Scribe 21 6%Magnification Devices 5 *Hospital/homebound 4 *Tested in Separate Room 2502 15%Scheduled Extended Time 2557 15%One Item Per Page 21 17%Multiple Testing Sessions 853 14%Mark Answers in Test Book 1555 13%Dictionary /Electronic Translator 10 *Interpreter Signs Test 15 *Test Read Aloud 2526 14%Student Reads Test Aloud to Self 60 20%Braille Writer/Slate and Stylus 3 *Accommodation Notification Form 15 13%
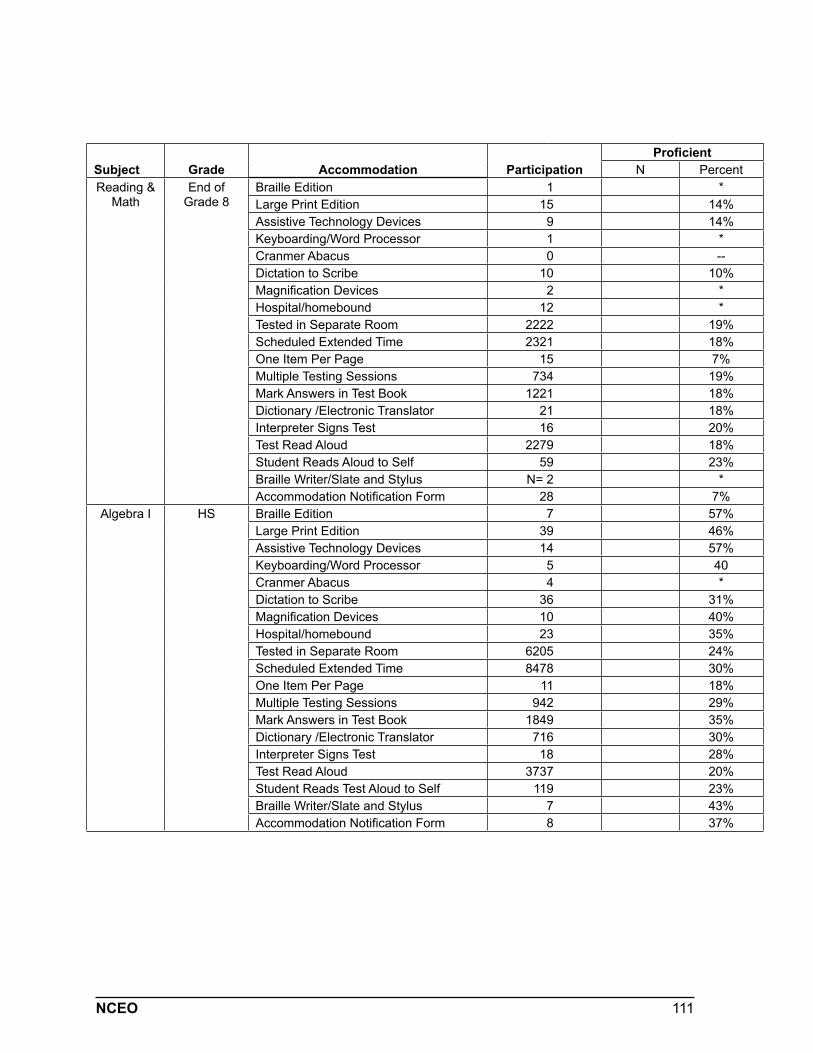
111NCEO
Subject Grade Accommodation ParticipationProficient
N PercentReading &
MathEnd of
Grade 8Braille Edition 1 *Large Print Edition 15 14%Assistive Technology Devices 9 14%Keyboarding/Word Processor 1 *Cranmer Abacus 0 --Dictation to Scribe 10 10%Magnification Devices 2 *Hospital/homebound 12 *Tested in Separate Room 2222 19%Scheduled Extended Time 2321 18%One Item Per Page 15 7%Multiple Testing Sessions 734 19%Mark Answers in Test Book 1221 18%Dictionary /Electronic Translator 21 18%Interpreter Signs Test 16 20%Test Read Aloud 2279 18%Student Reads Aloud to Self 59 23%Braille Writer/Slate and Stylus N= 2 *Accommodation Notification Form 28 7%
Algebra I HS Braille Edition 7 57%Large Print Edition 39 46%Assistive Technology Devices 14 57%Keyboarding/Word Processor 5 40Cranmer Abacus 4 *Dictation to Scribe 36 31%Magnification Devices 10 40%Hospital/homebound 23 35%Tested in Separate Room 6205 24%Scheduled Extended Time 8478 30%One Item Per Page 11 18%Multiple Testing Sessions 942 29%Mark Answers in Test Book 1849 35%Dictionary /Electronic Translator 716 30%Interpreter Signs Test 18 28%Test Read Aloud 3737 20%Student Reads Test Aloud to Self 119 23%Braille Writer/Slate and Stylus 7 43%Accommodation Notification Form 8 37%
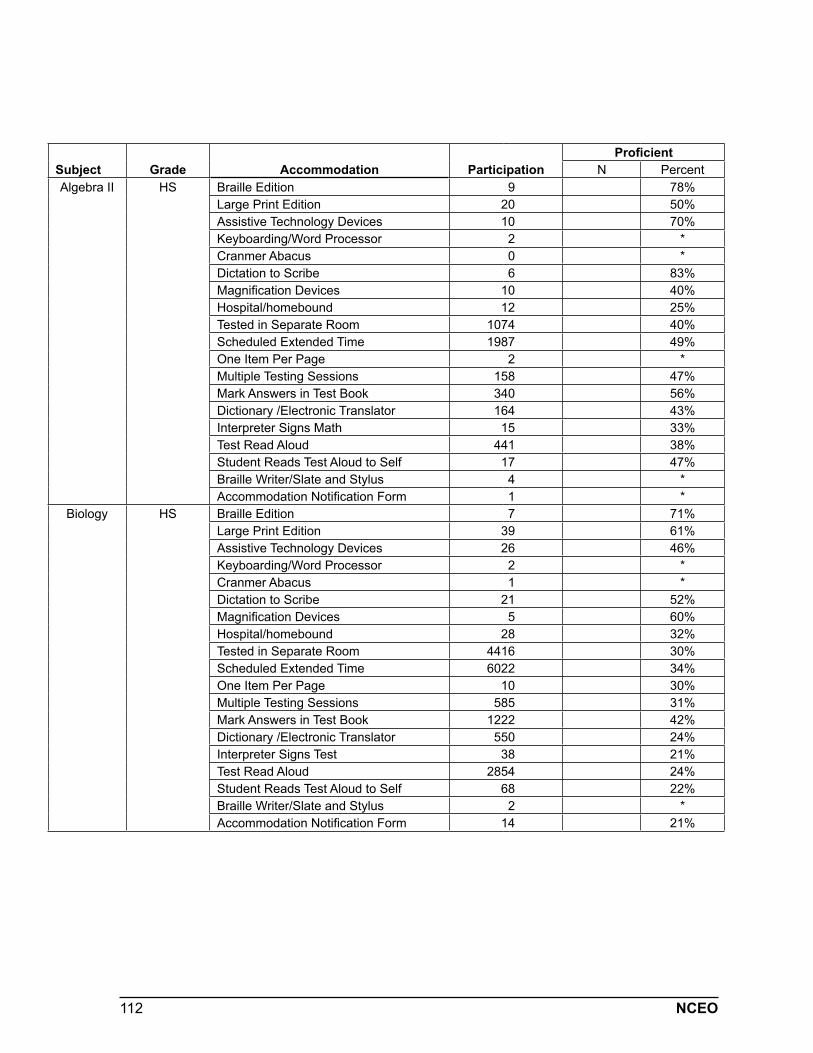
112 NCEO
Subject Grade Accommodation ParticipationProficient
N PercentAlgebra II HS Braille Edition 9 78%
Large Print Edition 20 50%Assistive Technology Devices 10 70%Keyboarding/Word Processor 2 *Cranmer Abacus 0 *Dictation to Scribe 6 83%Magnification Devices 10 40%Hospital/homebound 12 25%Tested in Separate Room 1074 40%Scheduled Extended Time 1987 49%One Item Per Page 2 *Multiple Testing Sessions 158 47%Mark Answers in Test Book 340 56%Dictionary /Electronic Translator 164 43%Interpreter Signs Math 15 33%Test Read Aloud 441 38%Student Reads Test Aloud to Self 17 47%Braille Writer/Slate and Stylus 4 *Accommodation Notification Form 1 *
Biology HS Braille Edition 7 71%Large Print Edition 39 61%Assistive Technology Devices 26 46%Keyboarding/Word Processor 2 *Cranmer Abacus 1 *Dictation to Scribe 21 52%Magnification Devices 5 60%Hospital/homebound 28 32%Tested in Separate Room 4416 30%Scheduled Extended Time 6022 34%One Item Per Page 10 30%Multiple Testing Sessions 585 31%Mark Answers in Test Book 1222 42%Dictionary /Electronic Translator 550 24%Interpreter Signs Test 38 21%Test Read Aloud 2854 24%Student Reads Test Aloud to Self 68 22%Braille Writer/Slate and Stylus 2 *Accommodation Notification Form 14 21%
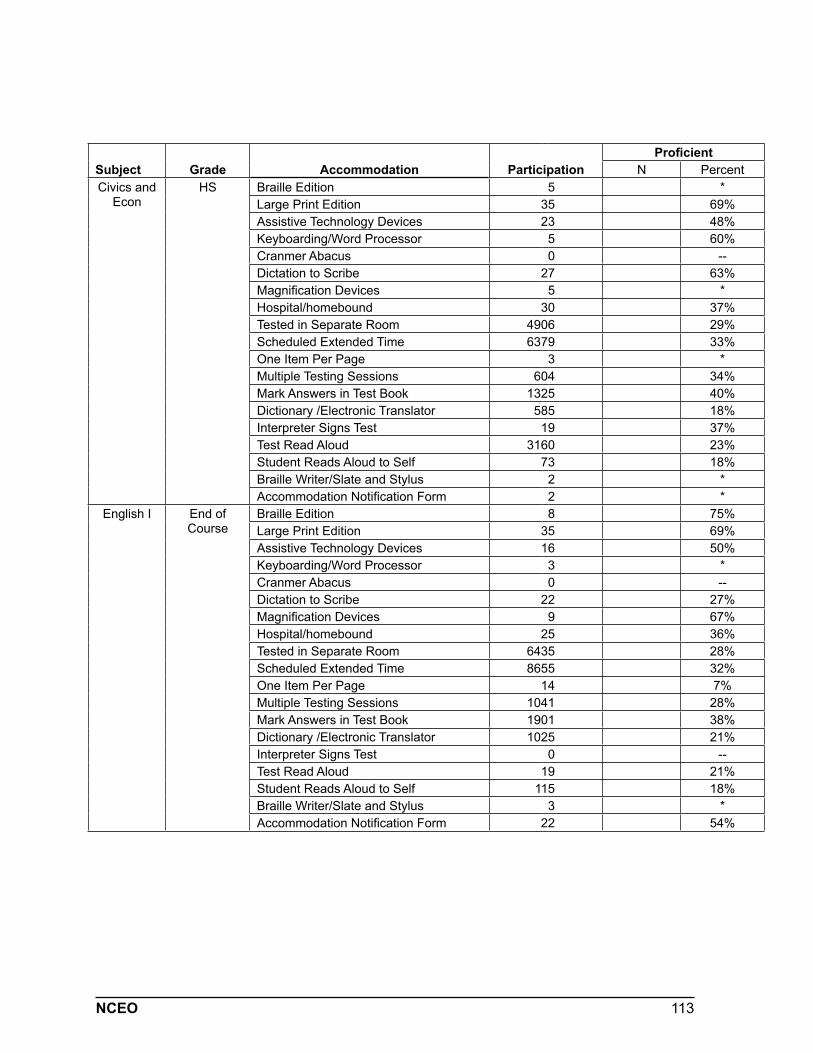
113NCEO
Subject Grade Accommodation ParticipationProficient
N PercentCivics and
EconHS Braille Edition 5 *
Large Print Edition 35 69%Assistive Technology Devices 23 48%Keyboarding/Word Processor 5 60%Cranmer Abacus 0 --Dictation to Scribe 27 63%Magnification Devices 5 *Hospital/homebound 30 37%Tested in Separate Room 4906 29%Scheduled Extended Time 6379 33%One Item Per Page 3 *Multiple Testing Sessions 604 34%Mark Answers in Test Book 1325 40%Dictionary /Electronic Translator 585 18%Interpreter Signs Test 19 37%Test Read Aloud 3160 23%Student Reads Aloud to Self 73 18%Braille Writer/Slate and Stylus 2 *Accommodation Notification Form 2 *
English I End of Course
Braille Edition 8 75%Large Print Edition 35 69%Assistive Technology Devices 16 50%Keyboarding/Word Processor 3 *Cranmer Abacus 0 --Dictation to Scribe 22 27%Magnification Devices 9 67%Hospital/homebound 25 36%Tested in Separate Room 6435 28%Scheduled Extended Time 8655 32%One Item Per Page 14 7%Multiple Testing Sessions 1041 28%Mark Answers in Test Book 1901 38%Dictionary /Electronic Translator 1025 21%Interpreter Signs Test 0 --Test Read Aloud 19 21%Student Reads Aloud to Self 115 18%Braille Writer/Slate and Stylus 3 *Accommodation Notification Form 22 54%
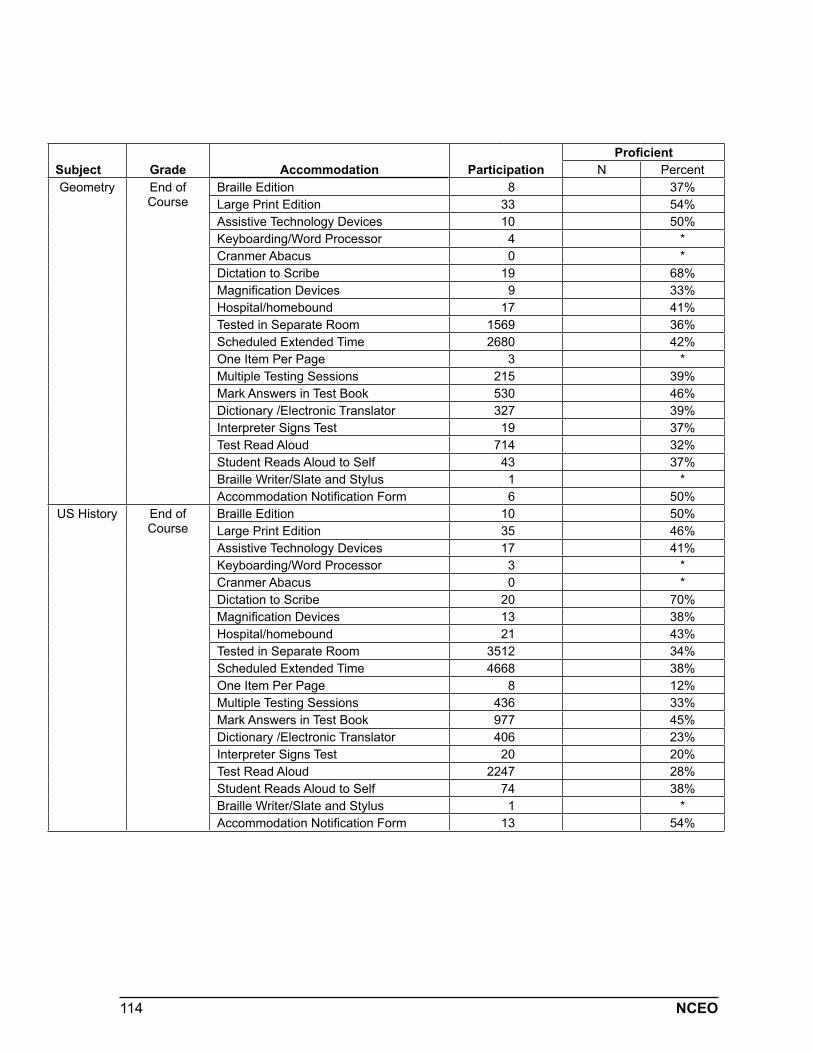
114 NCEO
Subject Grade Accommodation ParticipationProficient
N PercentGeometry End of
CourseBraille Edition 8 37%Large Print Edition 33 54%Assistive Technology Devices 10 50%Keyboarding/Word Processor 4 *Cranmer Abacus 0 *Dictation to Scribe 19 68%Magnification Devices 9 33%Hospital/homebound 17 41%Tested in Separate Room 1569 36%Scheduled Extended Time 2680 42%One Item Per Page 3 *Multiple Testing Sessions 215 39%Mark Answers in Test Book 530 46%Dictionary /Electronic Translator 327 39%Interpreter Signs Test 19 37%Test Read Aloud 714 32%Student Reads Aloud to Self 43 37%Braille Writer/Slate and Stylus 1 *Accommodation Notification Form 6 50%
US History End of Course
Braille Edition 10 50%Large Print Edition 35 46%Assistive Technology Devices 17 41%Keyboarding/Word Processor 3 *Cranmer Abacus 0 *Dictation to Scribe 20 70%Magnification Devices 13 38%Hospital/homebound 21 43%Tested in Separate Room 3512 34%Scheduled Extended Time 4668 38%One Item Per Page 8 12%Multiple Testing Sessions 436 33%Mark Answers in Test Book 977 45%Dictionary /Electronic Translator 406 23%Interpreter Signs Test 20 20%Test Read Aloud 2247 28%Student Reads Aloud to Self 74 38%Braille Writer/Slate and Stylus 1 *Accommodation Notification Form 13 54%
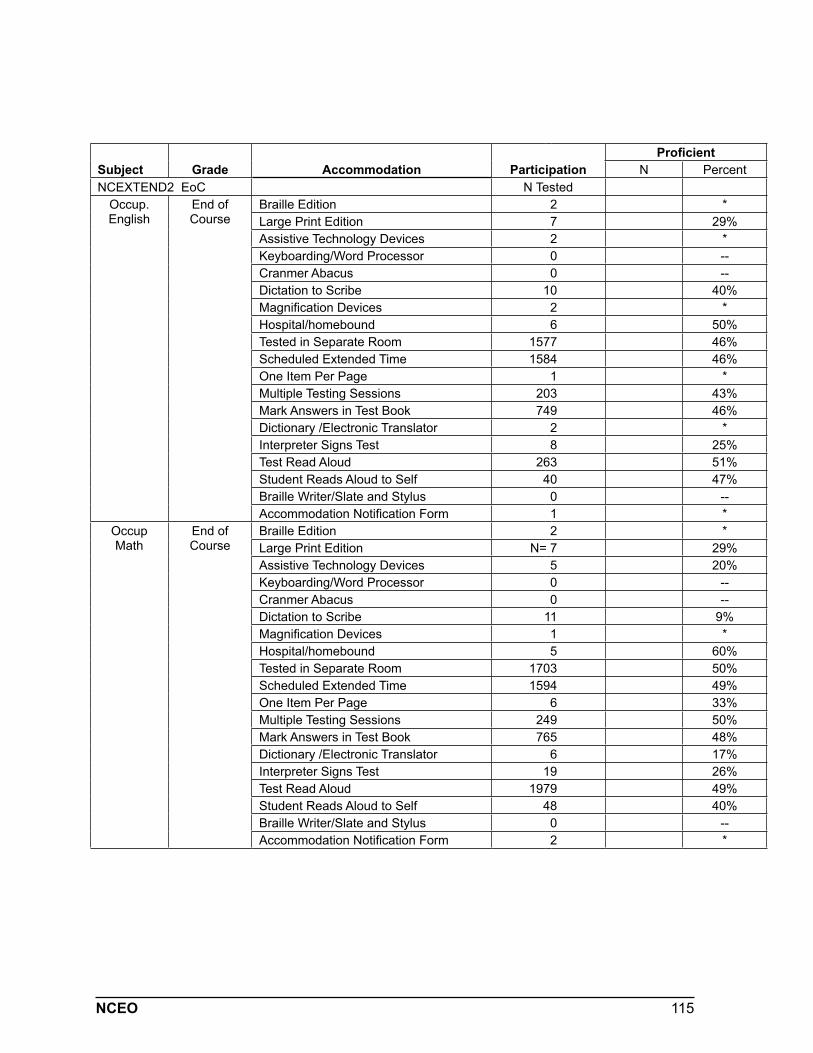
115NCEO
Subject Grade Accommodation ParticipationProficient
N PercentNCEXTEND2 EoC N Tested
Occup. English
End of Course
Braille Edition 2 *Large Print Edition 7 29%Assistive Technology Devices 2 *Keyboarding/Word Processor 0 --Cranmer Abacus 0 --Dictation to Scribe 10 40%Magnification Devices 2 *Hospital/homebound 6 50%Tested in Separate Room 1577 46%Scheduled Extended Time 1584 46%One Item Per Page 1 *Multiple Testing Sessions 203 43%Mark Answers in Test Book 749 46%Dictionary /Electronic Translator 2 *Interpreter Signs Test 8 25%Test Read Aloud 263 51%Student Reads Aloud to Self 40 47%Braille Writer/Slate and Stylus 0 --Accommodation Notification Form 1 *
Occup Math
End of Course
Braille Edition 2 *Large Print Edition N= 7 29%Assistive Technology Devices 5 20%Keyboarding/Word Processor 0 --Cranmer Abacus 0 --Dictation to Scribe 11 9%Magnification Devices 1 *Hospital/homebound 5 60%Tested in Separate Room 1703 50%Scheduled Extended Time 1594 49%One Item Per Page 6 33%Multiple Testing Sessions 249 50%Mark Answers in Test Book 765 48%Dictionary /Electronic Translator 6 17%Interpreter Signs Test 19 26%Test Read Aloud 1979 49%Student Reads Aloud to Self 48 40%Braille Writer/Slate and Stylus 0 --Accommodation Notification Form 2 *
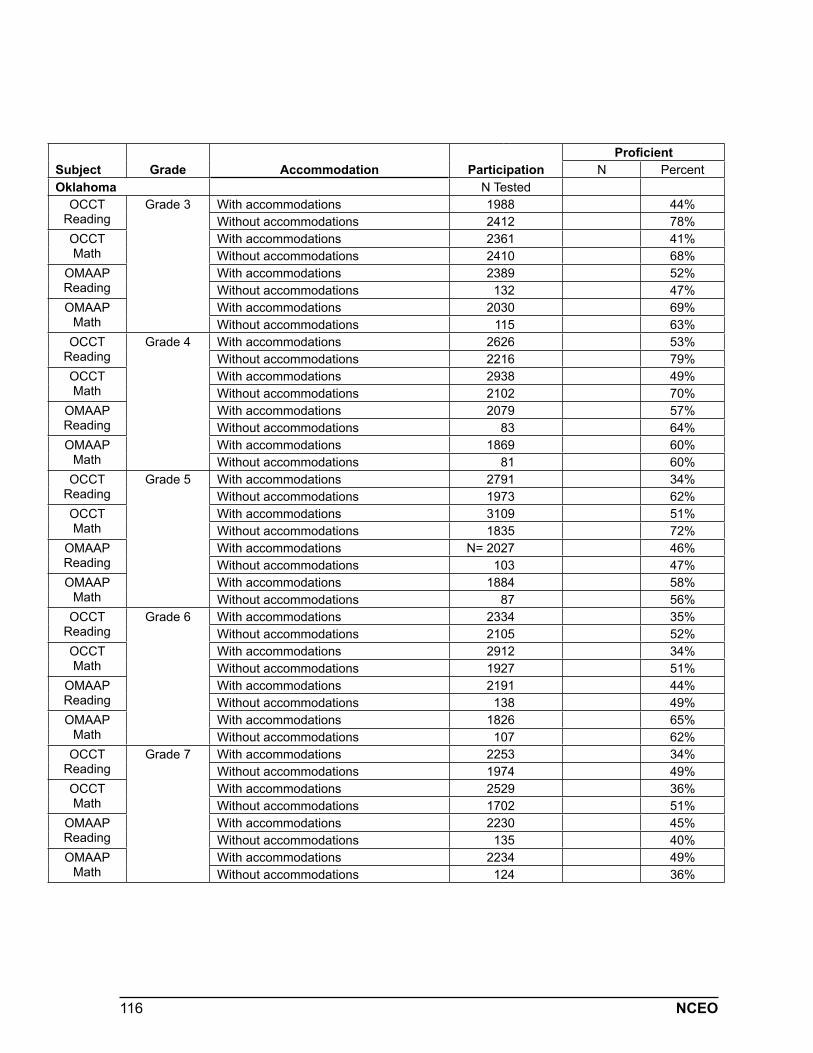
116 NCEO
Subject Grade Accommodation ParticipationProficient
N PercentOklahoma N Tested
OCCT Reading
Grade 3 With accommodations 1988 44%Without accommodations 2412 78%
OCCTMath
With accommodations 2361 41%Without accommodations 2410 68%
OMAAPReading
With accommodations 2389 52%Without accommodations 132 47%
OMAAPMath
With accommodations 2030 69%Without accommodations 115 63%
OCCTReading
Grade 4 With accommodations 2626 53%Without accommodations 2216 79%
OCCTMath
With accommodations 2938 49%Without accommodations 2102 70%
OMAAPReading
With accommodations 2079 57%Without accommodations 83 64%
OMAAPMath
With accommodations 1869 60%Without accommodations 81 60%
OCCTReading
Grade 5 With accommodations 2791 34%Without accommodations 1973 62%
OCCTMath
With accommodations 3109 51%Without accommodations 1835 72%
OMAAPReading
With accommodations N= 2027 46%Without accommodations 103 47%
OMAAPMath
With accommodations 1884 58%Without accommodations 87 56%
OCCTReading
Grade 6 With accommodations 2334 35%Without accommodations 2105 52%
OCCTMath
With accommodations 2912 34%Without accommodations 1927 51%
OMAAPReading
With accommodations 2191 44%Without accommodations 138 49%
OMAAPMath
With accommodations 1826 65%Without accommodations 107 62%
OCCTReading
Grade 7 With accommodations 2253 34%Without accommodations 1974 49%
OCCTMath
With accommodations 2529 36%Without accommodations 1702 51%
OMAAPReading
With accommodations 2230 45%Without accommodations 135 40%
OMAAPMath
With accommodations 2234 49%Without accommodations 124 36%
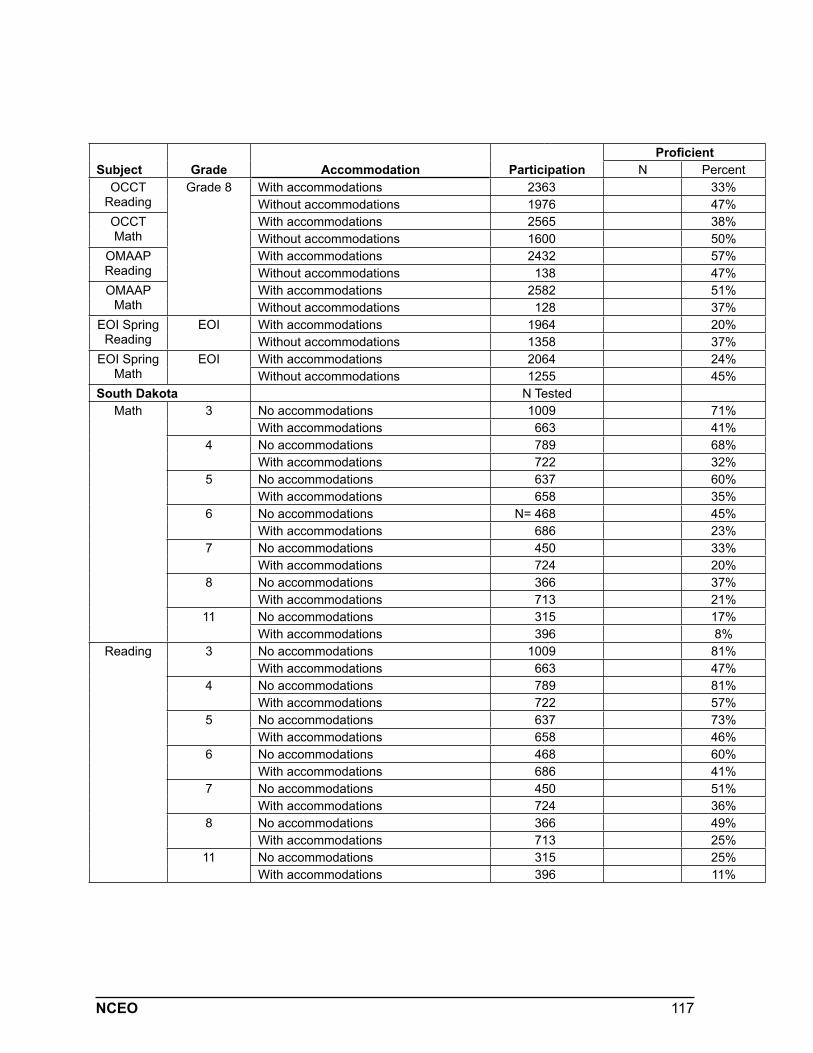
117NCEO
Subject Grade Accommodation ParticipationProficient
N PercentOCCT
ReadingGrade 8 With accommodations 2363 33%
Without accommodations 1976 47%OCCTMath
With accommodations 2565 38%Without accommodations 1600 50%
OMAAPReading
With accommodations 2432 57%Without accommodations 138 47%
OMAAPMath
With accommodations 2582 51%Without accommodations 128 37%
EOI SpringReading
EOI With accommodations 1964 20%Without accommodations 1358 37%
EOI SpringMath
EOI With accommodations 2064 24%Without accommodations 1255 45%
South Dakota N TestedMath 3 No accommodations 1009 71%
With accommodations 663 41%4 No accommodations 789 68%
With accommodations 722 32%5 No accommodations 637 60%
With accommodations 658 35%6 No accommodations N= 468 45%
With accommodations 686 23%7 No accommodations 450 33%
With accommodations 724 20%8 No accommodations 366 37%
With accommodations 713 21%11 No accommodations 315 17%
With accommodations 396 8%Reading 3 No accommodations 1009 81%
With accommodations 663 47%4 No accommodations 789 81%
With accommodations 722 57%5 No accommodations 637 73%
With accommodations 658 46%6 No accommodations 468 60%
With accommodations 686 41%7 No accommodations 450 51%
With accommodations 724 36%8 No accommodations 366 49%
With accommodations 713 25%11 No accommodations 315 25%
With accommodations 396 11%
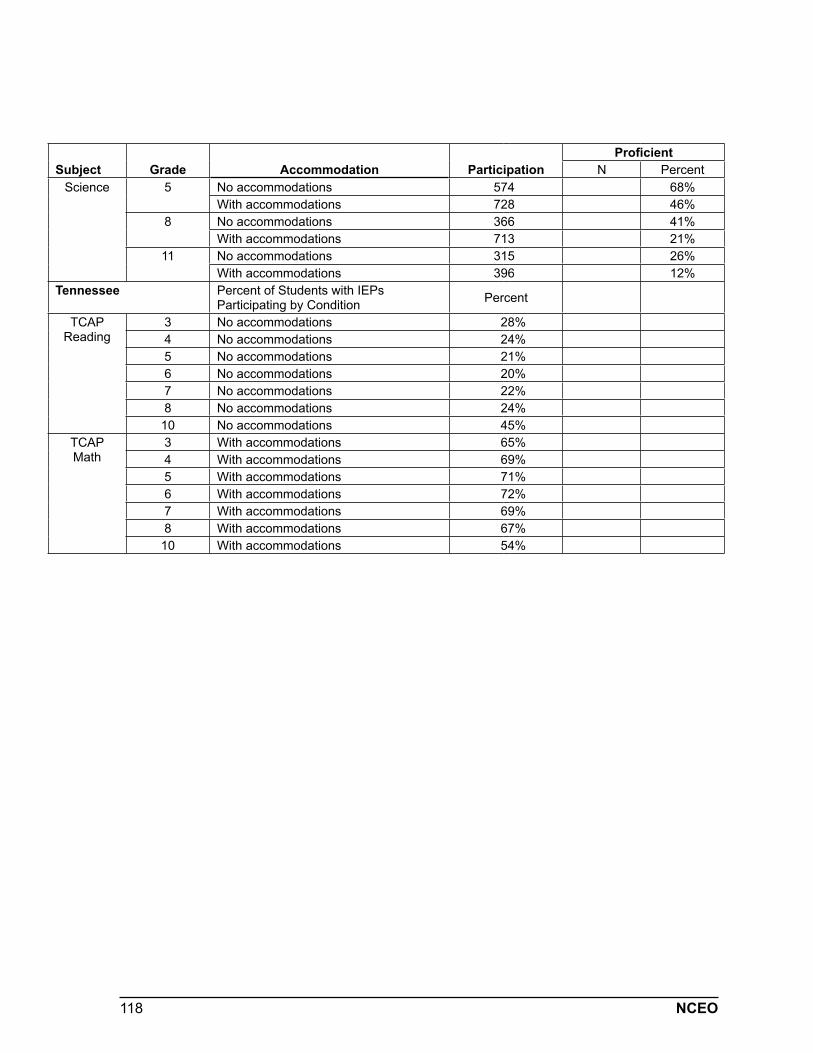
118 NCEO
Subject Grade Accommodation ParticipationProficient
N PercentScience 5 No accommodations 574 68%
With accommodations 728 46%8 No accommodations 366 41%
With accommodations 713 21%11 No accommodations 315 26%
With accommodations 396 12%Tennessee Percent of Students with IEPs
Participating by Condition Percent
TCAPReading
3 No accommodations 28%4 No accommodations 24%5 No accommodations 21%6 No accommodations 20%7 No accommodations 22%8 No accommodations 24%
10 No accommodations 45%TCAP Math
3 With accommodations 65%4 With accommodations 69%5 With accommodations 71%6 With accommodations 72%7 With accommodations 69%8 With accommodations 67%
10 With accommodations 54%
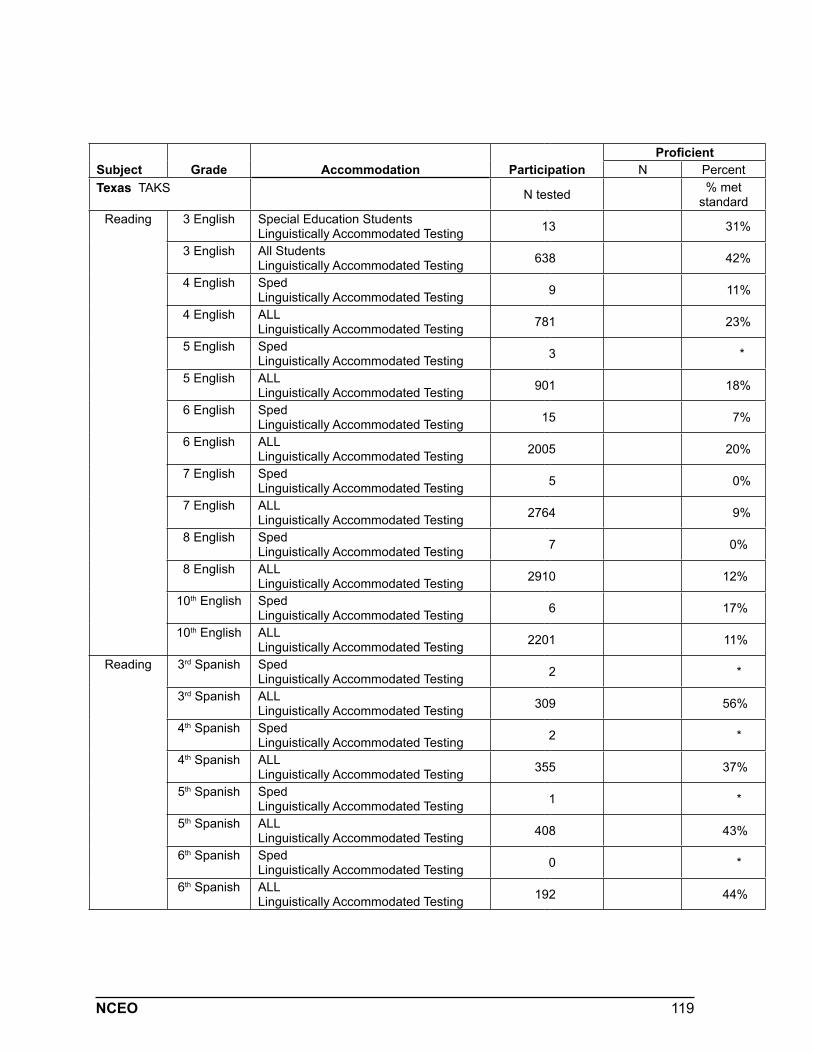
119NCEO
Subject Grade Accommodation ParticipationProficient
N PercentTexas TAKS N tested % met
standardReading 3 English Special Education Students
Linguistically Accommodated Testing 13 31%
3 English All StudentsLinguistically Accommodated Testing 638 42%
4 English Sped Linguistically Accommodated Testing 9 11%
4 English ALLLinguistically Accommodated Testing 781 23%
5 English SpedLinguistically Accommodated Testing 3 *
5 English ALLLinguistically Accommodated Testing 901 18%
6 English SpedLinguistically Accommodated Testing 15 7%
6 English ALLLinguistically Accommodated Testing 2005 20%
7 English SpedLinguistically Accommodated Testing 5 0%
7 English ALLLinguistically Accommodated Testing 2764 9%
8 English SpedLinguistically Accommodated Testing 7 0%
8 English ALLLinguistically Accommodated Testing 2910 12%
10th English SpedLinguistically Accommodated Testing 6 17%
10th English ALLLinguistically Accommodated Testing 2201 11%
Reading 3rd Spanish SpedLinguistically Accommodated Testing 2 *
3rd Spanish ALLLinguistically Accommodated Testing 309 56%
4th Spanish SpedLinguistically Accommodated Testing 2 *
4th Spanish ALLLinguistically Accommodated Testing 355 37%
5th Spanish SpedLinguistically Accommodated Testing 1 *
5th Spanish ALLLinguistically Accommodated Testing 408 43%
6th Spanish SpedLinguistically Accommodated Testing 0 *
6th Spanish ALLLinguistically Accommodated Testing 192 44%
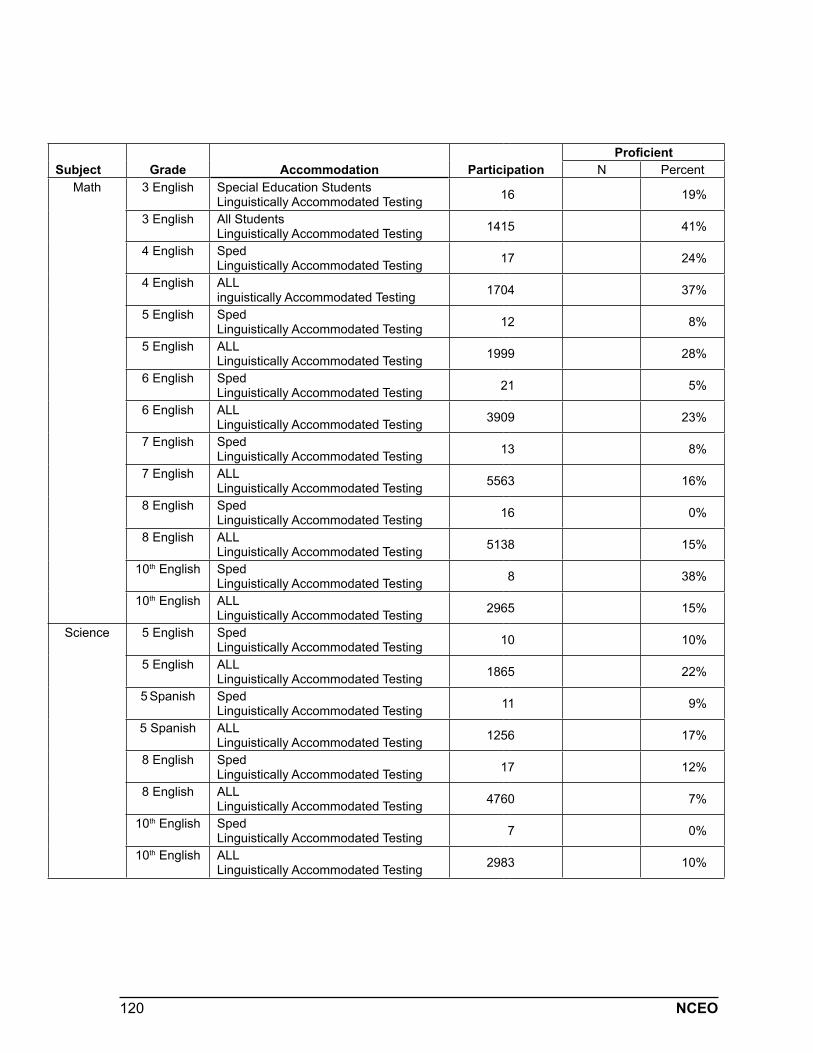
120 NCEO
Subject Grade Accommodation ParticipationProficient
N PercentMath 3 English Special Education Students
Linguistically Accommodated Testing 16 19%
3 English All StudentsLinguistically Accommodated Testing 1415 41%
4 English Sped Linguistically Accommodated Testing 17 24%
4 English ALLinguistically Accommodated Testing 1704 37%
5 English SpedLinguistically Accommodated Testing 12 8%
5 English ALLLinguistically Accommodated Testing 1999 28%
6 English SpedLinguistically Accommodated Testing 21 5%
6 English ALLLinguistically Accommodated Testing 3909 23%
7 English SpedLinguistically Accommodated Testing 13 8%
7 English ALLLinguistically Accommodated Testing 5563 16%
8 English SpedLinguistically Accommodated Testing 16 0%
8 English ALLLinguistically Accommodated Testing 5138 15%
10th English SpedLinguistically Accommodated Testing 8 38%
10th English ALLLinguistically Accommodated Testing 2965 15%
Science 5 English SpedLinguistically Accommodated Testing 10 10%
5 English ALLLinguistically Accommodated Testing 1865 22%
5 Spanish SpedLinguistically Accommodated Testing 11 9%
5 Spanish ALLLinguistically Accommodated Testing 1256 17%
8 English SpedLinguistically Accommodated Testing 17 12%
8 English ALLLinguistically Accommodated Testing 4760 7%
10th English SpedLinguistically Accommodated Testing 7 0%
10th English ALLLinguistically Accommodated Testing 2983 10%
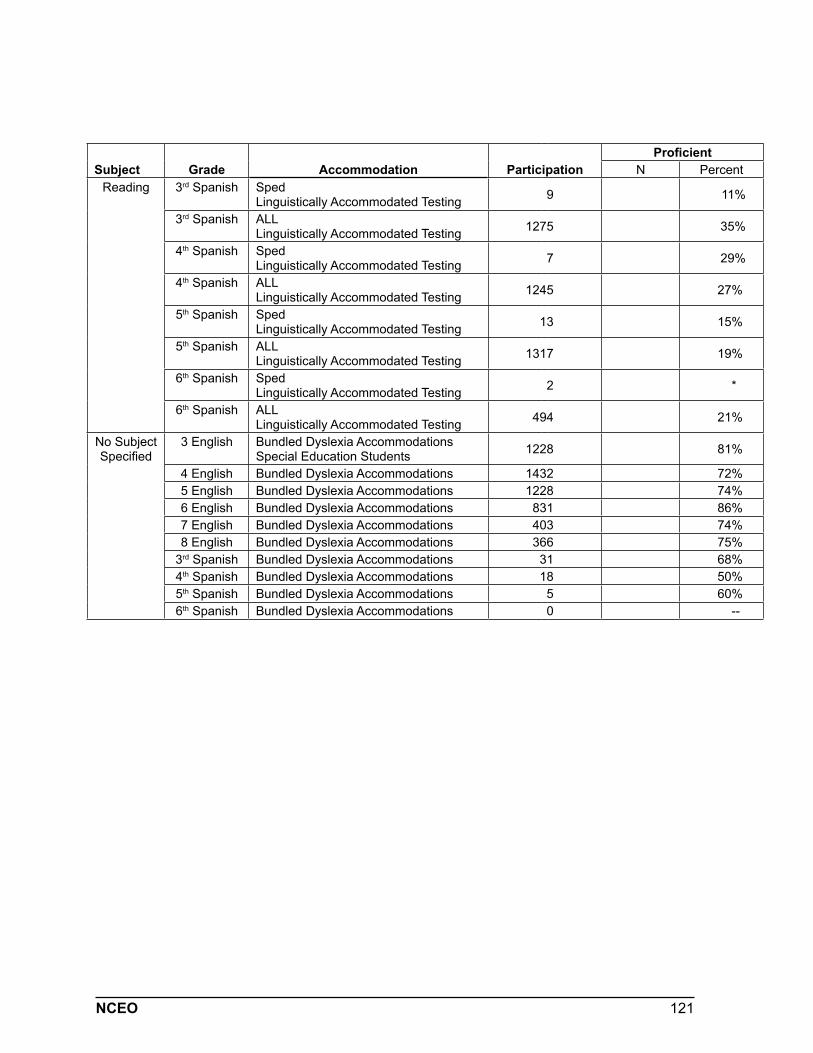
121NCEO
Subject Grade Accommodation ParticipationProficient
N PercentReading 3rd Spanish Sped
Linguistically Accommodated Testing 9 11%
3rd Spanish ALLLinguistically Accommodated Testing 1275 35%
4th Spanish SpedLinguistically Accommodated Testing 7 29%
4th Spanish ALLLinguistically Accommodated Testing 1245 27%
5th Spanish SpedLinguistically Accommodated Testing 13 15%
5th Spanish ALLLinguistically Accommodated Testing 1317 19%
6th Spanish SpedLinguistically Accommodated Testing 2 *
6th Spanish ALLLinguistically Accommodated Testing 494 21%
No Subject Specified
3 English Bundled Dyslexia AccommodationsSpecial Education Students 1228 81%
4 English Bundled Dyslexia Accommodations 1432 72%5 English Bundled Dyslexia Accommodations 1228 74%6 English Bundled Dyslexia Accommodations 831 86%7 English Bundled Dyslexia Accommodations 403 74%8 English Bundled Dyslexia Accommodations 366 75%
3rd Spanish Bundled Dyslexia Accommodations 31 68%4th Spanish Bundled Dyslexia Accommodations 18 50%5th Spanish Bundled Dyslexia Accommodations 5 60%6th Spanish Bundled Dyslexia Accommodations 0 --