achieving value for money from people in the gb rail...
TRANSCRIPT

Achieving Value for Money from People in the GB Rail Industry – Theme H Benchmarking

Although this report was commissioned jointly by the Department for Transport (DfT) and the Office of Rail Regulation (ORR), the findings and recommendations are those of the authors and do not necessarily represent the views of the DfT and the ORR. While the DfT and the ORR have made all reasonable efforts to ensure the information in this document is accurate, the DfT and the ORR do not guarantee the accuracy, completeness or usefulness of that information; and cannot accept liability for any loss or damages of any kind resulting from reliance on the information or guidance this document contains. Department for Transport Office of Rail Regulation Great Minster House 1 Kemble Street 76 Marsham Street London London SW1P 4DR WC2B 4AN Telephone: 0300 330 3000 Telephone: 020 7282 2000 Website: www.dft.gov.uk Website: www.rail-reg.gov.uk © Crown copyright, 2011, except where otherwise stated You may re-use this information (not including logos or third-party material) free of charge in any format or medium, under the terms of the Open Government Licence. To view this licence, visit www.nationalarchives.gov.uk/doc/open-government-licence/ or write to the Information Policy Team, The National Archives, Kew, London TW9 4DU, or e-mail: [email protected]. To reproduce third-party material you need to obtain permission from the copyright holders concerned. For further details contact: Hugh Chaplain Rail Planning and Advisory AECOM 2 City Walk Leeds LS11 9AR Telephone: 0113 391 6800 Website: www.aecom.com

Key Messages ............................................................................................................................................ 1
Key Findings .............................................................................................................................................. 3
1 Railway Industry Staff Numbers ................................................................................................... 8 1.1 Staff Numbers ....................................................................................................................... 8 1.2 Network Rail Staff Numbers .................................................................................................. 9 1.3 TOC Staff Numbers ............................................................................................................. 11 1.4 Umbrella Body staff numbers .............................................................................................. 14
2 Railway Industry Income and Staff Costs .................................................................................. 17 2.1 Railway Industry Staff Costs................................................................................................ 17 2.2 Railway Industry Pension Costs .......................................................................................... 21
3 Railway Industry Average Salaries ............................................................................................. 22 3.1 Trend in Average Salary for TOCs ...................................................................................... 22 3.2 Trend in Average Salary for Network Rail ........................................................................... 24 3.3 Average Salary of Operations Staff ..................................................................................... 25 3.4 Average Salary of Management and Administrative Staff ................................................... 26 3.5 Average Salary of Drivers.................................................................................................... 27 3.6 Comparison with Average Salary in Freight Operating Companies .................................... 28 3.7 Comparison with Average Salary in Other UK Industries .................................................... 29 3.8 Comparison with Average Salary in European Rail Industry ............................................... 31 3.9 Effect of Temporary Contracts and Mergers on Salary ....................................................... 33 3.10 Terms and Conditions ......................................................................................................... 35
4 Railway Industry Staff Productivity ............................................................................................ 37 4.1 Staff Productivity in Train Km per Employee ....................................................................... 37 4.2 Other Staff Productivity Measures ....................................................................................... 41 4.3 Unit Staff Costs.................................................................................................................... 44 4.4 Comparison with Staff Productivity in European Rail Industry ............................................ 45 4.5 Comparison of Trends in Staff Productivity with European Rail Industry ............................ 48 4.6 Conclusions on productivity ................................................................................................. 48
5 Industrial Relations ...................................................................................................................... 50 5.1 Background ......................................................................................................................... 50 5.2 Prospects for addressing state of current Industrial Relations ............................................ 51
6 Franchising ................................................................................................................................... 54 6.1 Franchise length .................................................................................................................. 54 6.2 Franchising process ............................................................................................................ 55 6.3 Franchise and industry structure ......................................................................................... 55 6.4 Station staffing ..................................................................................................................... 56
7 Implementing changes ................................................................................................................. 57 7.1 Context ................................................................................................................................ 57 7.2 Financial flows from costs saving measures ....................................................................... 57 7.3 Salary levels ........................................................................................................................ 57 7.4 Longer term efficiencies ...................................................................................................... 58
8 References .................................................................................................................................... 59
9 Appendix A – University of Leeds Report .................................................................................. 60
Table of Contents

Table 1 – Network Rail actual staff numbers by employee category ........................................................... 9 Table 2 – Network Rail actual staff numbers by employee band ............................................................... 10 Table 5 – TOC staff by year ....................................................................................................................... 12 Table 6 – TOC FTE staff by employee category 2009/10 ......................................................................... 13 Table 7 – Staff numbers for umbrella industry bodies ............................................................................... 14 Table 8 – Staff numbers for British Transport Police ................................................................................. 14 Table 9 – Staff costs for umbrella industry bodies (£000s) ........................................................................ 14 Table 10 – Staff costs for British Transport Police (£000s) ....................................................................... 15 Table 11 – Full time equivalent employees in rail regulators (2006/07) .................................................... 15 Table 12 – TOC staff costs 2008/09 (£000s) ............................................................................................. 19 Table 13 – Average staff costs by company in £2008/09 .......................................................................... 22 Table 15 – Average staff costs index by sector from DfT database (in £2008/09) .................................... 25 Table 16 – Average staff costs index by sector from published statutory accounts (in £2008/09) ............ 26 Table 17 – Avg staff costs index by sector for operations staff from DfT database (in £2008/09) ............ 26 Table 18 – TOC growth in staff and staff costs (1996/97 – 2007/08) ........................................................ 26 Table 19 – Average staff costs compared to other industries (£2008/09) ................................................. 30 Table 20 – Average Network Rail earnings (£2007/08) ............................................................................. 31 Table 21 – Avg staff costs/employee by country and type of company (2006/07 in PPP euro) ................ 31 Table 22 – Trends in average staff costs expressed in local currency ...................................................... 32 Table 23: Growth in average staff costs by TOC type in £2008/09 ........................................................... 33 Table 24 – Average staff costs: Greater Western merger / franchise changes in £2008/09 ..................... 33 Table 25 – Average staff costs: Northern/TPE merger / franchise changes in £2008/09 .......................... 34 Table 26 – Average staff costs: ONE merger / franchise changes in £2008/09 ........................................ 34 Table 27 – Average driver pay and hours .................................................................................................. 35 Table 28 – Labour productivity levels (1996/97 to 2008/09) ...................................................................... 39 Table 29 – Labour productivity growth (1996/97 to 2008/09) for “problem” and other TOCs .................... 40 Table 30 – Train operating company productivity in train km/employee by country for 2006/07 ............... 45 Table 31 – Infrastructure manager productivity in train km/employee by country for 2006/07 .................. 46 Table 32 – Staff numbers and productivity for selected European companies 2008 ................................. 47 Table 33 – Operations staff numbers and passenger km per staff 2008 ................................................... 47 Table 34 – Trends in productivity ............................................................................................................... 48 Table 35 – Proportion of TOC staff in different operational activities for various TOCs ............................ 52 Figure 1 – TOC and Network Rail staff numbers since privatisation ........................................................... 8 Figure 2 – TOC and Network Rail operating costs 2008/09 ...................................................................... 17 Figure 3 – TOC Staff Costs in £2008/09 (millions) .................................................................................... 18 Figure 4 – Network Rail revenue (£2008/09) ............................................................................................. 20 Figure 5 – Network Rail staff costs (£2008/09) .......................................................................................... 20 Figure 6 – Comparison of Network Rail revenue and cost indices (£2008/09) .......................................... 21 Figure 7 – TOC average staff costs indices in £2008/09 ........................................................................... 23 Figure 8 – Network Rail average staff costs indices in £2008/09 .............................................................. 25 Figure 9 – Driver hourly earnings in £2008/09 ........................................................................................... 28 Figure 10 – Average staff costs compared to freight operating companies in £2008/09 ........................... 29 Figure 11 – Staff productivity in Train km per employee since privatisation .............................................. 37 Figure 12 – TOC staff productivity since privatisation (as Figure 11 but different scale) ........................... 38 Figure 13 – Staff productivity in Train km per employee by sector ............................................................ 40 Figure 14 – Train km per staff compared to passenger km per staff ......................................................... 41 Figure 15 – Train km per staff compared to freight tonne km per staff ...................................................... 42 Figure 16 – Train km per staff compared to PPM Number of staff compared to PPM ............................. 43 Figure 17 – Train km per staff compared to Customer Satisfaction ..................................................................... Number of staff compared to Customer Satisfaction 43 Figure 18 – Staff cost/train km indices (2008/09) ...................................................................................... 44

1
AECOM, in partnership with First Class Partnerships and Leeds ITS, has been commissioned to undertake a study to look at the Value for Money of the people within the rail industry. This study forms part of the wider rail Value for Money Study being lead by Sir Roy McNulty. The two key questions directing the work have been: How much value for money does the GB rail industry offer compared to other countries and
sectors?
What are the options for reducing cost/improving value for money from railway human capital?
Options for addressing significant Value for Money issues are limited in the short term. Any alterations to Franchise Agreements are likely to incur further public sector cost to negotiate. The case for longer franchises being articulated in many sections of the industry is by no means a clear one. When thoroughly examined it may not be the panacea for achieving additional value for money and may even detract from achieving competition efficiencies. Significant changes to Network Rail funding and targets are only feasible in anticipation of a new control period, or through primary legislation. Within this context we suggest possible measures that could be considered to improve Value for Money within the industry, and we set these out below. It is worth noting that our strong perception throughout the course of this work is that the Government imposing a plan to deliver better value will have limited impact – particularly because the levers available to Government to make improvements happen are often indirect. Industry experience reports that Government intervention tends to increase cost and reduce efficiency rather than the converse. Care must be taken to ensure the same does not occur while looking for staff efficiencies and cost saving within the industry. Our recommendations therefore focus on setting the levers and letting the industry deliver the efficiencies. Our recommended staff initiatives are set out below: a. Consider active measures to address key staff shortages – for example, we have proposed an
alternative model for addressing the demand and supply of train drivers through outsourcing driver selection and training. Approximately 300 drivers are trained by the TOCs each year and costs per trainee are in the region of £60k. If the training time could be limited to the final 2 months of “live rail” route learning, the savings could be in the order of £13 m per annum. Although much more analysis would be required to fully evaluate all the pros, cons, benefits and costs associated with this approach we highly recommend that this be looked at as a discrete work piece.
b. Continued effective engagement with the Trade Unions to consider solutions for improved productivity. The experience of the last 15 years has been that trade unions have been effective at negotiating outcomes for their members from the somewhat short-term interest of franchisees.
c. Rationalisation of the overall human resource capacity using a network demand and activity level analysis. This could underpin the rationale for resetting service level minimum requirements, and would potentially allow savings through improved train crew rosters and diagrams.
d. There could be considerable opportunity to de-staff stations. Making significant savings in this area will require a full review of the levels of service required at stations by train operators. It is a question about the level and type of railway outputs that the taxpayers and passengers can afford
Key Messages

2
and are prepared to pay for. Despite many examples of unstaffed stations across the network, there are many where staffing levels are driven by the presence of a booking office. In practice the presence of a single member of staff shut away in a booking office which is costly to maintain and operate may be offering poor value for money. We recommend a network wide analysis of station activity levels and current resourcing levels, and develop a plan for de-staffing stations and for simplifying station facilities.
e. We believe there is a need to review the Network Rail Transformation Programme to ensure that the Value for Money study has a full understanding of the staffing and headcount implication of this important proposal. This review will provide clarity and context for the Value for Money study, and may also form an input to the CP5 regulatory review.
f. Further work is required to consider more appropriate productivity measures for Network Rail than train kilometres per FTE for all staff groups.
g. Inbucon noted the array of allowances for certain job types, and recommended harmonisation in some areas would be desirable. We also note that Network Rail was working towards this goal at the time the report was compiled. We recommend that harmonisation of terms and conditions be prioritised by Network Rail.
h. The number of umbrella organisation staff gives an indication of the extent of interfaces and intervention within the industry. By their nature, umbrella organisations will generate interaction with TOCs and Network Rail, and so there could well be a headcount multiplier effect. We recommend that analysis of the interface costs driven by the umbrella organisations be undertaken, in order to identify potential efficiency savings. The objective would be to reduce the number of interfaces across the industry as these are seen as unnecessary and complex and result in unnecessarily slow decision making and the stifling of innovation. Slimming down the amount of bureaucracy required by having a simpler structure would improve the risk management of these safety and human factors through allowing a sharper focus.
i. There is a strong view within the industry that the complexity and fear of the Industry’s safety architecture is a disincentive to innovate in changing structures, resource levels, terms or conditions and reinforcing Trades Union intransigence towards change. This applies, for example, to methods of working to deliver renewal and enhancement investment on the operational railway. While we recognise that there are major issues of safety to consider, the possessions regime for infrastructure works has been a major driver of cost escalation and warrants a thorough review to establish potential for alternative, cost effective approaches to be implemented where feasible. For example, it may be appropriate to review a series of selected activities to investigate whether any procedures have resulted in significant over-manning without showing any demonstrable change in safety records.
j. The devolved TOCs are all at the higher end of the staff cost spectrum, which is due to the specification and quality requirements emanating from bodies such as Welsh Assembly Government, Transport Scotland, TfL and PTEs. We recommend a review of staffing costs in each of the devolved TOCs compared with those Franchises under DfT control.

3
The study has followed two parallel lines of activity. The first has taken an analytic approach using available data. The second has sought ways to answer these questions through a series of interviews with senior industry players. From a combination of these two approaches, our findings are as follows: Network Rail findings The analysis of Network Rail presented in this report is based on the full year data that was available at the time of writing (up to and including 2009/10). Network Rail operating costs have increased by about 50% since privatisation. However, during this time staff costs have increased by over 300%, meaning that for the period investigation staff costs have increased at a greater rate than both overall operating costs, and revenue (Figure 6). In 2008/09 staff costs were 46% of total operating costs (Figure 2). The main reason for the increase in staff costs has been the move to bring all maintenance activity in-house (Figure 5). This substantial structural change resulted in a large increase in headcount to the 2009/10 level of around 36,800 (Figure 1)1. Our adjustments to take account of the inclusion of maintenance staff are quite simplistic, and do not consider other non-maintenance functions which were brought in-house at the same time. Neither do the adjustments take account of increases in enhancement projects etc. However, from our analysis, it would appear that even after removing the additional maintenance staff, overall headcount and associated staff costs were still increasing up to and including 2009/10 (Figure 1 and Figure 5). We have more certainty about the figures between 2007/08 and 2009/10 as these are all on the same basis, and still show an increase in headcount from 35,521 to 36,811 (Table 1). This increase has not been uniform across job function or band, and most staff categories have actually stayed fairly static or declined over the last three years. As the largest employment group in Network Rail, maintenance staff account for nearly 50% of total staff. The numbers of maintenance staff declined over the period 2007/08 to 2009/10 from 17,762 to 17,5292. The biggest increases in staff headcount over this period were within the Asset Management and NDS (National Delivery Service) functions. Network Rail identified an indicative range of employees in roles classified as direct between 72% and 92%, although they believe that a more realistic number would be somewhere between 75% and 80%. Network Rail has indicated that, to meet its original Control Period 4 (CP4) efficiency targets it expected to need to reduce staff numbers over CP4 by as much as 6,300. Most of this reduction would be able to come from maintenance activity, with further significant reductions from investment projects and operations staff (signallers and others). This would equate to a 17% reduction in staff numbers and has been predicted could deliver a corresponding 21% reduction in staff costs. Even allowing for the additional in-house maintenance staff, average staff costs per employee for Network Rail staff have increased by 32% between privatisation and 2008/09, exceeding the average earnings index of 15% (Figure 8). This includes an increase in pension costs over the same time period (Figure 5). Based on data provided by Network Rail, between 2007/08 and 2009/10 there was a 9%
1 It should be noted since the time of writing a more recent cut of data (12 April 2011) shows a decrease in the level of headcount to c.34,500
2 It should be noted since the time of writing a more recent cut of data (12 April 2011) shows a decrease in the level of maintenance staff to c.16,000
Key Findings

4
increase in overall average staff costs. Bands 2-8 all saw an increase higher than the average for all staff. These bands tend to include management, HQ and administrative functions. A salary comparison study by Inbucon (2008) concluded that although non-operational railway employees were paid at about market rate, signalling and maintenance staffs were above market rate. Their overall conclusion was that employment costs at Network Rail are around 15% - 20% above the market. Staff cost comparisons with other European infrastructure providers showed that for Network Rail these were 31% higher than Germany and 67% higher than Sweden, but about 11% than in the Netherlands (allowing for currency differences and PPP) (Table 18). TOC findings Over the period since privatisation train operator staff costs have increased by about 50% (Figure 3). Some of this increase is explained by a direct increase in headcount (Figure 1). The TOC staff numbers (currently around 49,500) show a decline in the initial period after privatisation. This was followed by a period of prolonged growth in staff numbers. This occurred during a period of sustained passenger growth and followed changes in franchising policy arising from the formation of the SRA. Staff reductions would not necessarily have been expected or desired in these circumstances. TOC staff numbers stabilised around 2005/06. Data from the DfT suggests that in the last year most TOCs have reduced their headcount (

5
Table 3). In view of the current market conditions, this provides some evidence that the private sector does respond when market forces bite. Our analysis suggests that overall passenger franchised TOCS employed 89% direct employees and 11% indirect employees in 2010. These figures vary considerably by individual TOC, and as we might expect, the proportion of indirect employees is much higher for smaller open access operators. The devolved TOCs are all at the higher end of the staff cost spectrum, which is due to the specification and quality requirements emanating from bodies such as Welsh Assembly Government, Transport Scotland, TfL and PTEs. Although TOCs have seen an increase in overall headcount, at the same time there have been increases in a number of output measures, including: passenger km (Figure 1 and Figure 14); train km (Figure 12); PPM (Figure 16); and customer satisfaction (Figure 17).
The period under review has seen significant improvements in performance and quality indicators and a large reduction in complaints. This has been achieved at a cost in terms of staff numbers, particularly management and administration. It may also have played a part in salary escalation. The substantial growth in passenger kilometres suggests that the focus on harnessing the revenue opportunities made possible from a 10 year period of exceptional economic growth may have taken the focus away from managing costs in general and staff costs in particular. Overall productivity growth (measured by train km per employee) has seen minimal growth since privatisation (10% over 12 years) (Table 25). This is low compared to the economy as a whole and certainly compared to what might have been expected following privatisation and competitive franchising. What productivity growth that there is has been driven by the Intercity TOCs, who have seen the highest growth in train-km. Comparisons with TOC productivity in other European countries show that overall train kms per full time equivalent employees (FTEs) are about 50% lower in Britain than in Germany, Sweden or the Netherlands (Table 27). The increase in staff costs since privatisation has been caused by both an increase in headcount, and an increase in average staff costs per headcount. Average staff costs have increased by 31% as compared to 15% growth in real average earnings for the economy as a whole (Figure 7). This increase has levelled off in recent years, but most of this period saw a strong economy which caused vacancy gaps to become harder to fill. Most TOCs serve London and employ significant numbers of staff there. This will have had an impact on the average salaries. The strong upward trend in average salaries is sector wide, though higher for Intercity TOCs (Figure 7). There is some evidence that the Virgin TOCs saw higher wage growth first, with other TOCs following, which is in line with anecdotal evidence from discussions with the industry. The requirements for Virgin West Coast and CrossCountry to recruit to staff their Pendolino and Voyager fleets resulted in a surge of recruitment that included driver poaching in some cases. To compete and retain staff, other TOCs followed Virgin with salary increases.

6
There is also some evidence that in general train operations staff have received higher settlements than other TOC staff, and their salaries have seen a higher rate of growth (Table 14). Although Management and administrative staff have increased in number, they have not seen a higher rate of average staff cost growth than average (Table 15). Train driver salaries have continued to increase above the average for all UK employees in real terms since privatisation (1996/97) (Figure 9). There is some weak evidence to suggest that franchise mergers have increased average staff costs (Table 21 - Table 23). From our limited comparison with other industries, there does seem to be some indicative evidence that railway average salary rates may be high compared to the market (Table 16). Industry Umbrella Organisations
It seems that there has been general staff number creep for most of the umbrella organisations (DfT, ATOC, RSSB and Passenger Focus) (Table 5). As far as costs are concerned, with the exception of British Transport Police, who employ around 3,400 staff (Table 6), the absolute value of staff costs is small as a proportion of total industry staff costs (about £67m in 2008/09 compared to £1,656m for Network Rail and £1,942m for passenger franchised TOCs) (Table 7). It is unlikely then, that changes to staffing levels in the umbrella organisations will make significant impacts on the costs of the rail industry in total. Although the umbrella bodies represent a very small proportion of total industry costs, the number of umbrella organisation staff does give an indication of the extent of interfaces and intervention within the industry. By their nature, umbrella organisations will generate interaction with TOCs and Network Rail, and so there could well be a headcount multiplier effect. It could be argued that streamlining the functions within the umbrella organisations (possibly resulting in reduced number of staff) would have a greater impact on the wider industry than the immediate savings within the organisations themselves.
Staff cost causation The post-Hatfield effect may have caused some increases in staffing, in order to manage emerging safety requirements. Investment in infrastructure e.g. Modern Facilities at Stations, West Coast Route Modernisation, Southern Power etc. will also have driven some staffing requirements at TOCs and Network Rail. Nevertheless there seems to be some suggestion that the additional specifications introduced during the second round of franchises and the closer involvement of the SRA and DfT has led to higher indirect staff ratios. This may in part be a correction following staff reductions in the immediate period following privatisation. Improvements that have been seen across the industry in outputs such as performance and quality will also have contributed to higher staff costs. Similarly, Network Rail’s increased programme of enhancements and major project will have increased staff costs. Anecdotally, salaries are widely believed to be too high in the UK rail industry. It is difficult to conclude firmly that absolute wage levels are higher than comparable levels in other UK sectors. However, features of the industry suggest that they are likely to be on the high side. For example:

7
Above average earnings growth rates (Figure 7) occurring without equivalent improvements in productivity (Figure 12);
Evidence of restrictions in the supply of personnel in key roles such as drivers and signallers which in turn is forcing up wage rates;
Active and co-ordinated Trade Union activity, resulting in pressures on employers to settle claims for the short, rather than longer-term.
Our investigations tend to corroborate this belief. The information we have gathered suggest the following may have caused this:
Lack of focus on wage restraint as part of the franchise process; Lack of incentive on the part of franchisees to minimise staff costs; Shortages in the market place, particularly in relation to specialist staff (which has led to staff
poaching); Desire to recruit the best staff; and Full employment and recruiting difficulties in the South East.
Benchmarking Our analysis shows that average staff costs were about 20% higher in Britain than in Germany and Sweden though about 25% less in Britain than in the Netherlands (allowing for currently differences and PPP) (Table 18). This pattern is broadly the same for management and administrative staff and for other staff. Looking at the data for passenger TOCs alone there is however little difference between Britain, Germany and Sweden. For FOCs and infrastructure managers, average British staff costs are higher. However staff costs at Prorail, the infrastructure manager in the Netherlands, are slightly higher than at Network Rail.
Overall the productivity measures presented (mainly train km per staff) tend to show that there could be scope for productivity savings within the British railway industry. On balance, we do not suggest that productivity targets within franchise agreements would be a good idea. There is strong feeling amongst the franchise community that less intervention and specification is required, rather than more. Furthermore, the competitive bidding process plus incentive to maximise share value should act positively towards delivering improved productivity. We do suggest that better TOC productivity measures could be introduced to better monitor and compare the performance of different operators.
Barriers to achieving greater efficiency The industry remains fragmented in certain areas, and the absence of clear leadership and coherent direction is cited frequently as a barrier to achieving better efficiency. Direct political and governmental intervention is seen as adding to rather than helping to minimise the impact of industry complexity.
We have found clear evidence of differences between the motivations of TOCs and their parent companies compared to Network Rail. Incentives are often opposed between these two groups. Involvement of both DfT and ATOC can further complicate this relationship.
In some areas market forces are either absent altogether or the current industry contractual matrix and consequent financial flows serve as a disincentive to stimulating competition and resultant efficiencies. However, market forces are present via competitive franchising and there are commercial incentives for TOCs to keep costs down.

8
The reality of franchising is that any imperfections with incentives or behaviour of train operators are fixed at the point of franchise. Beyond then, Train Operators can be expected to behave rationally according to the terms of the contract to which they are committed and any discretion they have in relation to prevailing market conditions.
There is a strong view within the industry that the complexity and fear of the Industry’s safety architecture is a disincentive to innovate in changing structures, resource levels, terms or conditions and reinforcing Trades Union intransigence towards change.
The current franchise and regulatory structure appears to have given very little incentive for Train Operators (or indeed Network Rail) to engage seriously with the Trade Unions. Almost universally, the attitude has been that it will require full Government support to risk industrial action. TOCs argue that at typically £1m per strike day, the cost of industrial action will not be recoverable in any contemporary franchise term. As staff costs generally form only around 30% of total TOC costs, the marginal savings that can be achieved are not sufficiently high for Train Operators to take such action. Furthermore, the current design of money flows are also an inhibitor in that effectively the TOCs can ‘buy their way out of trouble’ and simply pass the costs back to Government. The other significant change which is used as a device in impeding any change to the industrial relations landscape is the significant increase in the weight of safety procedures now attached to job responsibilities, post-Hatfield. This has also been exploited by the Unions as a tool to resist (for example) the introduction of new technology or reduced training times for safety critical roles.

9
1.1 Staff Numbers 1.1.1 The first question we have addressed is the number and cost of people working in the railway
industry. For the purpose of this study, we have considered the main railway organisations (TOCs, Network Rail and umbrella organisations). Although this does not cover the full number of people working in the industry overall, it does cover organisations who receive subsidy from the public purse in one form or another.
1.1.2 It should be noted that blanket numbers savings do not necessarily result in efficiency savings. However, an assessment of individual categories of staff may be necessary to establish an efficiency index related to outputs delivered and contribution to bottom line before conclusions can be drawn on implementing savings. Figure 1 shows franchised passenger TOC and Network Rail staff numbers since privatisation.
Figure 1 – TOC and Network Rail staff numbers3 since privatisation
0
100
200
300
400
500
600
0
10,000
20,000
30,000
40,000
50,000
60,000
Passen
ger Km
(millions)
Num
ber o
f Staff
Average Staff NumbersTOCSNetwork RailEstimate excl. maintenance staffPassenger Km (millions)
Infrastructure maintenance taken
in house
Network Rail takesover Railtrack
Source: TOC data from University of Leeds based on published statutory accounts; Network Rail data from published statutory accounts; Estimates of maintenance staff based on other data supplied by Network Rail; Pass km data from National Trends data, as published by ORR
1.1.3 The TOC figures show a decline in overall numbers following the initial period after privatisation. This is followed by a period of prolonged growth in staff numbers. This occurred during a period of sustained passenger growth and during a change in franchising policy arising from the formation of the SRA. Staff reductions would not necessarily have been expected or desired in these circumstances. TOC staff numbers stabilised around 2005/06.
3 Staff numbers as reported in statutory accounts. The accounts do not specify whether staff numbers are actual headcount or FTEs.
1 Railway Industry Staff Numbers

10
1.1.4 Network Rail/Railtrack figures are significantly affected by Network Rail’s decision to bring all maintenance activity in-house. Owing to this substantial structural change, Network Rail staff figures only stabilised over the period between 2007/08 and 2009/10. Network Rail has supplied a breakdown of their staff numbers for the last three years, from which we are have estimated the number of maintenance staff and removed them from the trend. We have interpolated the data for the remaining three years since Network Rail took over from Railtrack to estimate the staff headcount over the whole period on a consistent basis (see dotted line in Figure 1).
1.1.5 It should be noted that our estimate does not take any account of the in-sourcing of other roles which were previously out-sourced to maintenance companies and subsequently passed on to other functions within Network Rail, such as, finance, HR and NDS, For this reason, Network Rail felt unable to provide their own estimate of staff numbers excluding maintenance staff.
1.2 Network Rail Staff Numbers 1.2.1 In the first section we considered time series data for the period from privatisation. As part of this
study, Network Rail has supplied data on actual staff numbers for the last three years including the most up to date full year data that was available at the time of writing (up to and including 2009/10), and this provides us with a consistent set of disaggregated data, albeit for a shorter time frame from which it is difficult to conclude on general trends. However, it is useful to examine disaggregating within Network Rail over a shorter time period. A more recent cut of data taken after the time of writing (April 2011) shows a decrease in the Network Rail headcount level to c.34,500.
In Table 1 below, we have reported staff numbers by Network Rail job function. Table 1 – Network Rail actual staff numbers by employee category Table 1 staff function information redacted due to data sensitivities
Staff Function 2007/8 2008/9 2009/10 % 2009/10 Total 35,521 36,803 36,811 100%
Source: Based on data provided by Network Rail
1.2.2 The largest employment group in Network Rail are maintenance staff, accounting for nearly 50% of total staff based on the data received for 2007/08 to 2009/10. The numbers of maintenance staff declined over these three years from 17,762 to 17,529. As reported by Inbucon (2008),

11
maintenance staff are characterised by having a wide range of terms and conditions, and receiving a substantial proportion of their pay as overtime in particular, and other allowances. More recent data made available after the time of writing shows further decreases in the level of Network Rail maintenance staff numbers to c.16,000).
1.2.3 Most staff categories have stayed fairly static or declined over the last three years. The main exceptions are Asset Management and NDS (National Delivery Service) which have both risen quite markedly over the three year period studied.
1.2.4 In Table 2 we have presented data for the three years by Network Rail’s employee bands. This table highlights the wide range of employee bands within the organisation. Other data we have received suggests that in some cases these are groupings of bands, with very many bands having fewer than 10 employees. Network Rail explains that many of these bands are as a consequence of bringing maintenance staff in-house on the same terms and conditions.
Table 2 – Network Rail actual staff numbers by employee band Table 2 redacted due to data sensitivities
1.2.5 Network Rail has provided a categorisation into direct and indirect staff. They note that this categorisation is complex and somewhat subjective. They have provided three possible methods of calculation, and therefore three different results. From this, they would argue that there is an indicative range of employees in roles classified as direct between 72% and 92%, although they believe that a more realistic number would be somewhere between 75% and 80%.
1.2.6 The method that produces a value falling in the range that Network Rail believe is realistic is based on their organisation structure. They have classified anything outside of their Plan, Specify, Change, Manage and Operate (PSCMO) structure as indirect. Within the PSCMO functions they have also identified a number of job family categories which are also indirect. Using this definition, Network Rail identified 77% direct employees and 23% indirect employees in 2010.
1.2.7 The headcount data also highlights some other interesting features of Network Rail’s staff composition. For example, Network Rail has staff located in 1527 different locations. Around half are employed in the largest 82 places. 95% are located in the largest 895 locations, leaving 5% or 1761 employees employed across 632 other locations. These statistics emphasize the wide

12
geographical coverage of the Network Rail network. We would assume that these individuals are generally manning small signal boxes or level crossings. The cost associated with employing people at all these locations, although operationally necessary, will be large.
1.2.8 Network Rail has indicated that, to meet its original Control Period 4 (CP4) efficiency targets it expected to need to reduce staff numbers over CP4 by as much as 6,300. Most of this reduction would be able to come from maintenance activity, with further significant reductions from investment projects and operations staff (signallers and others). This would equate to a 17% reduction in staff numbers and has been predicted could deliver a corresponding 21% reduction in staff costs.
1.2.9 If delivered, these outcomes would make a significant impact to productivity, providing outputs do not deteriorate as a consequence. We have no specific information on how Network Rail will deliver reductions in staff costs that will exceed reductions in staff numbers (implying a reduction in average salary).
1.2.10 Our existing understanding of this programme is limited. We understand the programme design to be complex and in the time permitted by the Theme H programme plan, were not able to validate the claims of efficiencies the programme states as its intended outcomes. Given the importance of this programme we feel that the Value for Money study should have a full understanding of the staffing and headcount implications. Therefore we recommend a review of the transformation programme, with a view to providing clarity and context for the Value for Money study, and possibly also forming an input to the CP5 regulatory review.
1.2.11 Within the rail industry considerable work has already been done to look for cost efficiencies within Network Rail as part of the periodic review. Furthermore, the Regulator has the function of the Rail Reporter to investigate specific areas of concern. There are established mechanisms in place to challenge and review questions of efficiency and cost. However these systems do not lend themselves to the radical change that might be required for a substantial change, or a paradigm shift.
1.3 TOC Staff Numbers 1.3.1 Figure 1 suggested that TOC staff numbers have remained fairly stable since around 2005/06.
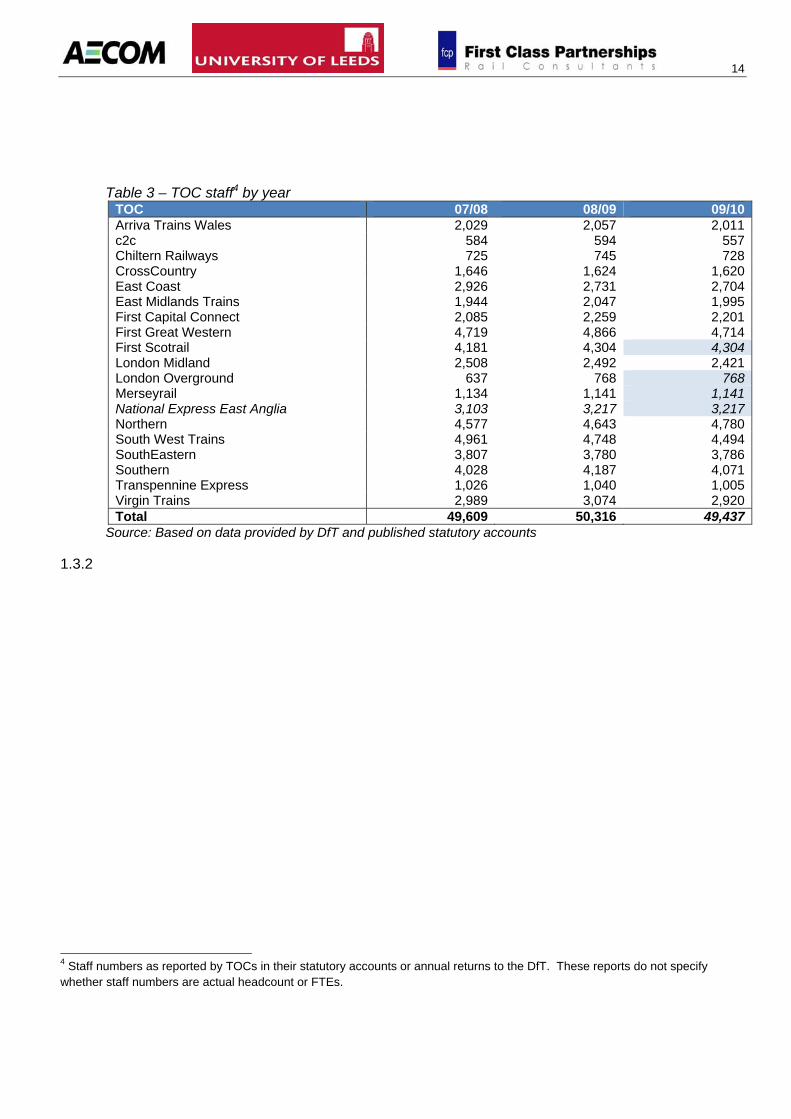
However, Figure 1 only continues to 2008/09. Data from the DfT suggests that in the last year most TOCs have reduced their headcount (see

13
Table 3). In view of the current market conditions, this provides some evidence that the private sector does respond when market forces bite.
14
Table 3 – TOC staff4 by year TOC 07/08 08/09 09/10Arriva Trains Wales 2,029 2,057 2,011c2c 584 594 557Chiltern Railways 725 745 728CrossCountry 1,646 1,624 1,620East Coast 2,926 2,731 2,704East Midlands Trains 1,944 2,047 1,995First Capital Connect 2,085 2,259 2,201First Great Western 4,719 4,866 4,714First Scotrail 4,181 4,304 4,304London Midland 2,508 2,492 2,421London Overground 637 768 768Merseyrail 1,134 1,141 1,141National Express East Anglia 3,103 3,217 3,217Northern 4,577 4,643 4,780South West Trains 4,961 4,748 4,494SouthEastern 3,807 3,780 3,786Southern 4,028 4,187 4,071Transpennine Express 1,026 1,040 1,005Virgin Trains 2,989 3,074 2,920Total 49,609 50,316 49,437
Source: Based on data provided by DfT and published statutory accounts
1.3.2
4 Staff numbers as reported by TOCs in their statutory accounts or annual returns to the DfT. These reports do not specify whether staff numbers are actual headcount or FTEs.

15
Table 4 shows the full time equivalent 2009/10 staff headcount from the passenger franchised TOCs for which we have data. (This table is mainly based on data from TOC responses to the Theme H surveys, and therefore we do not have data for all TOCs, and the totals are slightly different to those in

16
Table 3).

17
Table 4 – TOC FTE staff5 by employee category 2009/10
TOC OperationsDepot &
EngineeringCommercial
/Retail HQ TotalArriva Trains Wales 1,182 214 454 197 2,047c2c 250 38 231 38 557Chiltern Railways 275 133 225 95 728CrossCountry 1,053 0 514 53 1,620East Coast 621 503 1,499 68 2,690East Midlands Trains 697 407 814 77 1,995First Capital Connect 700 520 898 111 2,229First Great Western 1,883 1,081 1,630 197 4,790First Scotrail 1,739 732 1,598 103 4,173London Midland 1,224 386 667 145 2,421Northern 2,588 1,090 862 243 4,783South West Trains 2,047 594 1,631 181 4,453SouthEastern 1,365 337 1,374 673 3,748Southern 1,742 680 1,387 219 4,028Transpennine Express 717 20 228 58 1,023Virgin Trains 990 11 1,860 113 2,974Total 43% 15% 36% 6% 100%
Source: Based on data provided by DfT and TOC Theme H Returns
1.3.3 Some of the TOCs have supplied staff counts disaggregated in sufficient detail to estimate the proportion of direct and indirect staff. Different TOCs may well categorise their staff in different ways, and so the direct and indirect proportions we have calculated are not necessarily consistent between TOCs. However, our analysis suggests that overall passenger franchised TOCS employed 89% direct employees and 11% indirect employees in 2010. These figures vary considerably by individual TOC, and as we might expect, the proportion of indirect employees is much higher for smaller open access operators.
5 Most of the staff numbers in Table 4 are FTEs taken from TOC responses to a Theme H questionnaire. However, some figures are taken from figures supplied by TOCs to the DfT, and so we cannot be certain that all are FTEs. However, this does not affect any conclusions that we have drawn from this table.

18
1.4 Umbrella Body staff numbers 1.4.1 Table 5 shows the number of staff employed by umbrella bodies. These currently comprise about
4500 staff in total. We do not have complete data for these organisations for all years since privatisation, but there is enough information to get a general picture.
Table 5 – Staff numbers6 for umbrella industry bodies Company 00/01 01/02 02/03 03/04 04/05 05/06 06/07 07/08 08/09 09/10ATOC 125 125 149 170 164 125 125 149 170 164SRA 284 354 382 429 412 174 DfT Rail 386RSSB 164 173 197 196 223 224ORR 379 353 325 302Passenger Focus 47 47
Source: Based on data provided by DfT and other published sources
Table 65 – Staff numbers for British Transport Police Company 00/01 01/02 02/03 03/04 04/05 05/06 06/07 07/08 08/09 09/10BTP 3,254 3,574 3,170 3,311 4,420 4,581
Source: Based on data provided by DfT and other published sources
1.4.2 The ATOC headcount has risen from around 125 in 2000/01 to 164 in 2009/10. RSSB staff numbers have increased from 164 in 2004/05 to 244. The ORR numbers have decreased from 379 in 2004/05 to 302 in 2009/10, although during this time they took over the responsibility for safety regulation, and have also absorbed HMRI duties (HMRI no longer exists as an organisation). The figure of 386 for DfT Rail effectively replaces the role of the SRA. The SRA had a staff headcount of 284 in 2000/01 and 412 in the full year before its closure in 2004/05. However, the SRA had a very much higher staffing level that its predecessor OPRAF, which was tasked with franchise sales, with minimal intervention and no strategic governance or leadership. BTP saw a change in accounting policy from 2008/09, when London Underground police began to be included in the headcount and staff costs.
1.4.3 Overall, it seems that there has been general staff number creep for most of the umbrella organisations. As far as costs are concerned, with the exception of BTP, the absolute value of staff costs is small as a proportion of total industry staff costs (about £67m in 2008/08 compared to £1,656m for Network Rail and £1,942m for passenger franchised TOCs). It is unlikely then, that changes to staffing levels in the umbrella organisations will make significant impacts of the costs of the rail industry in total. Table 7 – Staff costs for umbrella industry bodies (£000s) Company 04/05 05/06 06/07 07/08 08/09 09/10ATOC 8,091 8,828DfT Rail 20,000RSSB 10,391 12,199 13,266 15,318 ORR 19,102 19,811 20,635 19,910Passenger Focus 2,536
Source: Based on data provided by DfT and other published sources
6 The data sources do not specify whether staff numbers are actual headcount or FTEs.

19
Table 8 – Staff costs for British Transport Police (£000s) Company 04/05 05/06 06/07 07/08 08/09 09/10BTP 79,700 129,900 147,425 154,280 212,651 210,746
Source: Based on data provided by DfT and other published sources
1.4.4 Although the umbrella bodies represent a very small proportion of total industry costs, the number of umbrella organisation staff does give an indication of the extent of interfaces and intervention within the industry. By their nature, umbrella organisations will generate interaction with TOCs and Network Rail, and so there could well be a headcount multiplier effect. It could be argued that streamlining the functions within the umbrella organisations (possibly resulting in reduced number of staff) would have a greater impact on the wider industry, than the immediate savings within the organisations themselves.
1.4.5 Whilst franchising provides incentives for TOCs to reduce cost and regulation provides such incentives to Network Rail, there are no incentives on regulators to reduce their costs or the transaction costs they impose on the industry. Table 9 compares the number of staff in regulators in Britain, Germany and Sweden.
Table 9 – Full time equivalent employees in rail regulators (2006/07) Country/organisation FTEs Responsibilities Great Britain Office of Rail Regulation (ORR inclusive HSE) 3287 Economic and safety regulation Rail Safety and Standards Board (RSSB) 197 Safety and standards Great Britain total 525 Great Britain per m train km 1.07 Germany Federal Network Agency BnetzA (only rail) 35 Economic regulation Federal Railway Authority (EBA) 1,200 Safety and standards Germany total 1,235 Germany per m train km 1.23 Sweden Swedish Rail Agency (Järnvägsstyrelsen) 55 Economic and safety regulation Sweden total 55 Sweden per m train km 0.42
Source: Data supplied by Rico Merkert. Data on the Netherlands supplied by Didier van de Velde and Martijn Lelieveld at inno-V, the Netherlands
1.4.6 This shows that Britain has fewer staff in regulators than Germany but far more than Sweden –
however this partly reflects the respective sizes of the railways. In terms of FTE/train km, regulators in UK only had slightly fewer than Germany but again far more than Sweden.
7 This is not the same as the figure of 379 quoted in Table 5. The figure here is taken from a forecast published in the 2006/07 annual report. http://www.rail-reg.gov.uk/upload/pdf/329.pdf

20
1.4.7 Sweden also has fewer industry association staff than the UK - about 5. However it has many staff involved in franchising – 10 for long distance and about 4,000 at regional level (responsible also for timetabling, ticketing, stations and rolling stock). The Transport Inspectorate in the Netherlands (IVW), the regulator, has only 60 staff dedicated to rail. We were unable to obtain staff numbers for franchising in Germany (by Lander or local government) or for government departments in any country.
1.4.8 Overall it is difficult to make any firm conclusions from this evidence.

21
2.1 Railway Industry Staff Costs 2.1.1 Figure 2 shows the staff costs as a proportion of total operating costs for Network Rail and all
franchised passenger TOCs in 2008/09. The TOC figure shows that staff costs account for only a quarter of TOC operating costs.
Figure 2 – TOC and Network Rail operating costs 2008/09
54%
77%
0
1,000
2,000
3,000
4,000
5,000
6,000
7,000
8,000
9,000
Network Rail All TOCs
£m (200
8/09
)
Industry Operating Costs 2008/09
Other
Pension
Wages & Salaries
Non Staff Costs
Source: Based on data from published statutory accounts
2 Railway Industry Income and Staff Costs

22
2.1.2 Figure 3 shows the total staff costs for all franchised passenger TOCs in £2008/09.
Figure 3 – TOC Staff Costs in £2008/09 (millions)
0
200
400
600
800
1,000
1,200
1,400
1,600
1,800
2,000
Staff C
ost (£ m
illion)
TOC Staff Costs £2008/09
Source: From data provided by University of Leeds based on published statutory accounts
2.1.3 Table 10 contains data taken from published statutory accounts for passenger franchised TOCs. Not all TOCs report over the same accounting period, but generally the data is for 2008/09. Staff costs tend to be a higher proportion of total costs for TOCs with a larger number of stations. It is also noticeable that the devolved TOCs are all at the higher end of the staff cost spectrum, which is due to the specification and quality requirements emanating from bodies such as Welsh Assembly Government, Transport Scotland, TfL and PTEs.
2.1.4 Nevertheless there does seem to be a large variation in staff costs as a proportion of total operation costs. We have not been able conclude the full reason for this, but track access and rolling stock costs will vary proportionally across TOC, and these will be clearly affect the staff cost proportion. Other factors may include on board retail services, the type of fleet and the extent of TOC train maintenance as opposed to ROSCO or manufacturer train maintenance.
2.1.5 For example, CrossCountry outsources train maintenance and operates no stations. Therefore staff costs are only 13% of operating costs. At the other end of the scale, the London Overground and Merseyrail concessions have staff costs of over 45%. These concessions were specified by TfL and Merseytravel, with more prescriptive quality regimes than a standard franchise.

23
Table 10 – TOC staff costs 2008/09 (£000s)
TOC
Other Operating
Costs Staff
Costs Earnings Pension
Other Staff
Costs
Pension as % of
Staff Costs
Staff Costs as
% of Other Oper ’ing
Costs
Arriva Trains Wales 178,222 73,451 63,537 5,114 4,800 7% 41%
c2c 101,409 22,073 18,586 2,000 1,487 9% 22%
Chiltern Railways 103,066 32,415 27,326 2,753 2,336 8% 31%
CrossCountry 561,654 75,016 63,447 6,277 5,292 8% 13%
East Coast 565,885 106,718 87,709 9,323 9,686 9% 19%
East Midlands Trains 240,931 76,768 65,872 5,525 5,371 7% 32%
First Capital Connect 357,691 87,437 74,167 7,562 5,708 9% 24%
First Great Western 577,611 201,912 170,769 17,940 13,203 9% 35%
First Scotrail 402,176 151,317 120,958 13,976 16,383 9% 38%
London Midland 278,373 95,741 79,553 9,900 6,288 10% 34%
London Overground 59,077 27,407 23,272 2,110 2,025 8% 46%
Merseyrail 80,329 38,309 32,701 3,263 2,345 9% 48%
NE East Anglia 388,869 122,127 97,903 9,787 14,437 8% 31%
Northern 389,038 162,990 137,117 15,625 10,248 10% 42%
South West Trains 546,073 179,270 153,742 12,603 12,925 7% 33%
SouthEastern 406,516 154,725 122,389 16,496 15,840 11% 38%
Southern 408,667 156,597 131,109 15,198 10,290 10% 38%
TransPennine Express 165,857 44,397 37,879 3,900 2,618 9% 27%
Virgin Trains 552,580 127,774 107,671 10,682 9,421 8% 23%
Total 6,364,024 1,936,444 1,615,707 170,034 150,703 9% 30% Source: Based on data from published Statutory Accounts
2.1.6 Figure 4 shows Network Rail revenue since privatisation and Figure 5 shows Network Rail staff costs since privatisation, both in £2008/09 prices.
2.1.7 In Figure 5, from 2004/05 we have estimated the split of wages and salaries into those costs relating to maintenance staff, and those relating to other operating staff. The total cost of wages and salaries is as given in statutory accounts. From Network Rail regulatory returns, the split is approximately 40%. This gives an indication of the continued trend in salary costs without maintenance staff. Note that the pension and social security costs are for all staff and have not been split.

24
Figure 4 – Network Rail revenue (£2008/09)
0
1,000
2,000
3,000
4,000
5,000
6,000
7,000
£m (200
8/09
)
Network Rail Revenue
Other
Grants
Passenger Franchise
Infrastructure maintenance taken in
houseNetwork Rail takes
over Railtrack
Source: Based on data from published Statutory Accounts
Figure 5 – Network Rail staff costs (£2008/09)
0
200
400
600
800
1000
1200
1400
1600
1800
£m (200
8/09
)
Network Rail Staff Costs
Pension
Social Security
Maintenance Wages & Salaries
Operating Wages & Salaries
Infrastructure maintenance taken in
house
Network Rail takesover Railtrack
Source: Based on data from published Statutory Accounts

25
2.1.8 Figure 6 compares Network Rail revenue and costs. These have been expressed as indices against 1996/97 values. Even allowing for the additional in house maintenance staff, staff costs have increased at a greater rate than revenue. However total operating costs remained much more constant, as non-staff costs have been falling.
Figure 6 – Comparison of Network Rail revenue and cost indices (£2008/09)
0
50
100
150
200
250
300
350
400
450
Inde
x
Comparison of Revenue and Costs
Revenue Index
Staff Cost Index
Operating Cost Index
Infrastructure maintenance taken in
houseNetwork Rail takesover Railtrack
Source: Based on data from published Statutory Accounts
2.2 Railway Industry Pension Costs 2.2.1 Network Rail pension contributions increased from 1% to about 13% of staff costs in 2001/02
(Figure 5). We suspect that this is due to a change in accounting procedure, although we are aware that in 2000/01 Railtrack did have a pension holiday. Also, over this period of time, many staff moved from a low basic salary with high allowances, to a higher salary but the same overall pay. Although total staff earnings remained the same, a greater proportion of staff pay became pensionable, and so pension costs increased. Since 2001/02 Network Rail pension costs as a proportion of staff costs have reduced year on year to about 7% in 2008/09.
2.2.2 We do not have full time series data on the breakdown of staff costs for TOCs, but we have been able to compare to 2003 when pensions made up 4% of staff costs. By 2008/09 pension costs as a proportion of total staff costs had risen to 9% on average (Table 10). This compares to about 7% for Network Rail, and this proportion is fairly consistent across TOCs.
2.2.3 On the evidence we currently have available, pension costs for TOCs have increased significantly over the last five years. We anticipate that pension costs will be a serious issue for the industry going forwards. This point is corroborated by the comments received in the industry interviews.

26
3.1 Trend in Average Salary for TOCs 3.1.1 Further indications of whether the people in the railway industry are offering value for money can
be seen by looking at average staff cost levels. We have examined these over time, to show how and when changes have occurred, and by comparing absolute values across different sectors and jobs. First we have looked at trends over time. Table 11 shows average staff costs by company. These values have been calculated from data in published statutory accounts, and are expressed in £2008/09 prices. They include all staff earnings, plus social security and pension costs, but not redundancy costs. The information is also presented visually in Figure 7.
Table 11 – Average staff costs by company in £2008/09
1996/97 2003/04 2004/05 2005/06 2006/07 2007/08 2008/09
Growth 1996/97 to
2007/08
Growth 1996/97 to
2008/09Pure IntercityCross Country 34,812 42,190 45,982 46,128 46,014 45,534 39,526 31% 14%GNER 28,234 32,712 33,470 34,823 36,668 37,094 44,447 31% 57%West Coast 29,753 39,981 43,118 41,926 43,417 44,841 41,921 51% 41%Midland Mainline (to 2007/08) 30,790 34,088 35,980 36,290 38,199 40,804 33%
29,878 37,191 39,391 39,533 40,974 41,968 42,218 40% 41%
Pure LSEChiltern 32,712 36,790 44,228 43,253 43,165 43,605 44,710 33% 37%South Central / Southern 29,831 36,658 37,257 38,074 38,341 38,688 37,707 30% 26%South Eastern 29,694 42,863 37,739 38,989 40,959 40,354 40,462 36% 36%LTS / c2c 31,330 32,883 34,746 33,774 35,508 38,074 37,160 22% 19%Silverlink (to 2007/08) 34,190 36,793 37,641 37,912 40,282 44,775 31%South West Trains 30,656 38,587 38,416 38,068 35,773 38,692 36,575 26% 19%Thameslink / FCC 31,456 35,080 36,303 35,757 41,912 41,658 39,672 32% 26%
30,586 38,339 37,937 38,223 38,835 40,001 38,576 31% 26%
Pure regional Cardiff/Wales & Borders/Arriva Trains Wa 26,181 40,009 38,073 38,282 36,906 36,875 36,341 41% 39%Central Trains (to 2007/08) 31,061 36,464 38,182 38,739 39,791 39,102 26%Gatwick Express 30,994 36,041 36,037 37,119 40,043 38,616 25%Merseyrail (to 2007/08) 26,344 30,581 32,708 33,073 33,253 33,336 27%Scotrail 26,342 31,060 34,299 34,561 34,422 35,362 35,157 34% 33%
27,994 34,199 35,912 36,243 36,221 36,408 35,539 30% 27%
Other TOCsAnglia 28,994 28,361Great Eastern 29,009 34,186Great Western 28,509 38,611 40,432 42,327 40,356 42,931 41,165 51% 44%North Western / First North West 28,228 34,132Northern Sprit / Northern 27,116 30,963 40,021 31,899 36,060 36,080 35,402 33% 31%Thames Trains First Great Western Link 29,985 36,855 40,126 40,905WAGN 32,063 37,000 42,466 37,987Wales and West/Wessex 28,455 37,251 36,279 36,880Transpennine Express 41,191 40,612 42,726 42,692 43,020One 36,070 35,482 36,268 36,437 37,963East Midlands Trains 36,885London Midland 38,038London Overground 35,686
28,712 34,668 39,243 36,618 38,077 39,035 38,244 36% 33%
All operators 29,346 36,249 38,186 37,590 38,458 39,328 38,581 34% 31% Source: University of Leeds ‘Aggregate Level Analysis of Train Operating Company Average Salary and Productivity Performance’ (See Appendix A)
3 Railway Industry Average Salaries

27
3.1.2 There are variations in average staff cost levels between operators, but to some extent this would be expected given different mixes of staff and the different regions in which TOCs operate.
3.1.3 Intercity TOCs have the highest average staff costs in 2007/08 and 2008/09, followed by LSE and Regional. It is also clear that growth in wages for Intercity TOCs has been considerably higher than for other TOCs over the period. Interestingly, at privatisation Intercity operators started out at around the same level as LSE and then subsequently saw average staff costs grow faster.
3.1.4 Over the period since privatisation (1996/97-2008/09) TOC sector real average staff costs increased by 31% as compared to 15% growth in real average earnings for the economy as a whole. Through most of this period, a strong economy caused vacancy gaps to become harder to fill. Most TOCs serve London and employ significant numbers of staff there. This will have had an impact on the average salaries.
3.1.5 TOC wages were going up by 1.1% per year above those in the economy as a whole. This “rail wage growth premium” exists for the whole period, but seems to have got bigger since 1999/00, with the exception of 2008/09 where it appears that rail real wages fell faster than average earnings.
3.1.6 Figure 7 compares the average staff costs from Table 11 against the average earnings index. The average staff costs for 1996/97 have all been set to 100 and the relative growth rates calculated for subsequent years. This graph shows quite clearly that wage increases have exceeded average earnings increase since privatisation by a considerable margin.
Figure 7 – TOC average staff costs indices in £2008/09
100
105
110
115
120
125
130
135
140
145
150
Inde
x
Average Earnings IndicesInterCity
LSE
Regional
Virgin
Other
All TOCs
Average Earnings Index
Source: From data provided by University of Leeds based on published statutory accounts
3.1.7 The strong upward trend in average staff costs is sector wide, though higher for Intercity TOCs. There is some evidence that the Virgin TOCs saw higher wage growth first, with other TOCs following, which is in line with anecdotal evidence from discussions with the industry. The requirements for Virgin West Coast and CrossCountry to recruit to staff their Pendolino and Voyager fleets resulted in a surge of recruitment that included driver poaching in some cases. To compete and retain staff, other TOCs followed Virgin with salary increases.
28
3.1.8 It does appear that average staff costs have levelled out over the last year. Recent years will have been the first period since before privatisation that has not experienced passenger growth. Because passenger growth corresponds directly to revenue, if revenue is increasing faster than costs then the incentive to keep costs very tightly down will be weak.
3.1.9 There are a number of important caveats that should be noted here. First, general inflation (RPI growth) was high in 2008/09, and therefore the precise timing of pay rises could cause real wages to appear to fall faster than they are in practice. Second, there were a large number of franchise changes around 2007/08 and 2008/09. Whilst we have been careful to ensure a robust comparison, it remains possible that some distortions could enter the calculation if the average staff figures have not been accurately calculated by the TOCs. Overall, however, we consider the data to be reasonably robust, and we note that the premium of rail average staff costs growth above average earnings growth prevails throughout the sample. Third, the measure of average staff costs includes pension and social security costs and therefore the comparison with economy wide average earnings growth is not strictly valid. To the extent that social security and pension costs have increased over the period, our analysis may therefore give an overstated picture of relative wage growth.
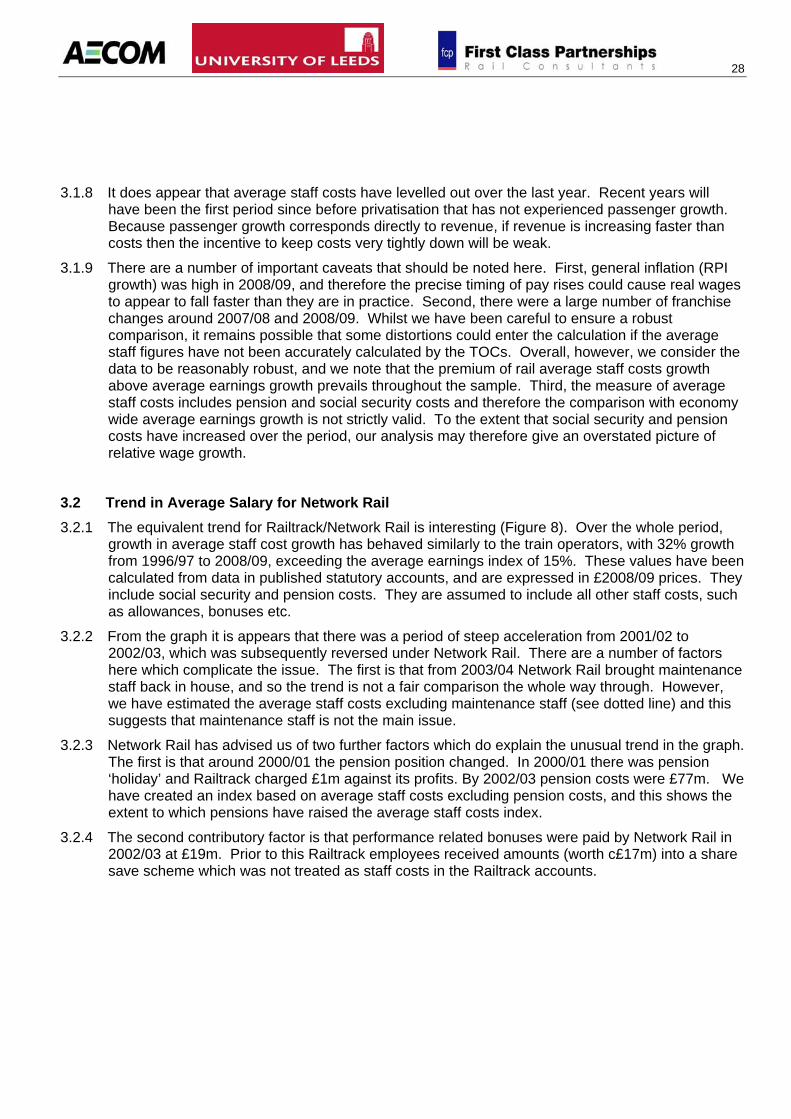
3.2 Trend in Average Salary for Network Rail 3.2.1 The equivalent trend for Railtrack/Network Rail is interesting (Figure 8). Over the whole period,
growth in average staff cost growth has behaved similarly to the train operators, with 32% growth from 1996/97 to 2008/09, exceeding the average earnings index of 15%. These values have been calculated from data in published statutory accounts, and are expressed in £2008/09 prices. They include social security and pension costs. They are assumed to include all other staff costs, such as allowances, bonuses etc.
3.2.2 From the graph it is appears that there was a period of steep acceleration from 2001/02 to 2002/03, which was subsequently reversed under Network Rail. There are a number of factors here which complicate the issue. The first is that from 2003/04 Network Rail brought maintenance staff back in house, and so the trend is not a fair comparison the whole way through. However, we have estimated the average staff costs excluding maintenance staff (see dotted line) and this suggests that maintenance staff is not the main issue.
3.2.3 Network Rail has advised us of two further factors which do explain the unusual trend in the graph. The first is that around 2000/01 the pension position changed. In 2000/01 there was pension ‘holiday’ and Railtrack charged £1m against its profits. By 2002/03 pension costs were £77m. We have created an index based on average staff costs excluding pension costs, and this shows the extent to which pensions have raised the average staff costs index.
3.2.4 The second contributory factor is that performance related bonuses were paid by Network Rail in 2002/03 at £19m. Prior to this Railtrack employees received amounts (worth c£17m) into a share save scheme which was not treated as staff costs in the Railtrack accounts.

29
Figure 8– Network Rail average staff costs indices in £2008/09
90
100
110
120
130
140
150
160
Inde
x
Average Earnings Indices
Network Rail
Network Rail excl. maint staff)
Pension Costs Removed
Average Earnings Index
Source: From data provided by University of Leeds based on published statutory accounts
3.3 Average Salary of Operations Staff 3.3.1 We have not been able to find reliable data to be able to report a consistent time series of average
staff costs by railway industry occupation. However, we have had access to the DfT database of TOC returns, which has enabled us to calculate average staff costs for TOC operations staff by sector. These are defined as all on-train staff, including drivers. Again, these have been normalised to £2008/09 prices. As data is only available from 2001/02 onwards prices we have calculated indices based on growth from 2001/02.
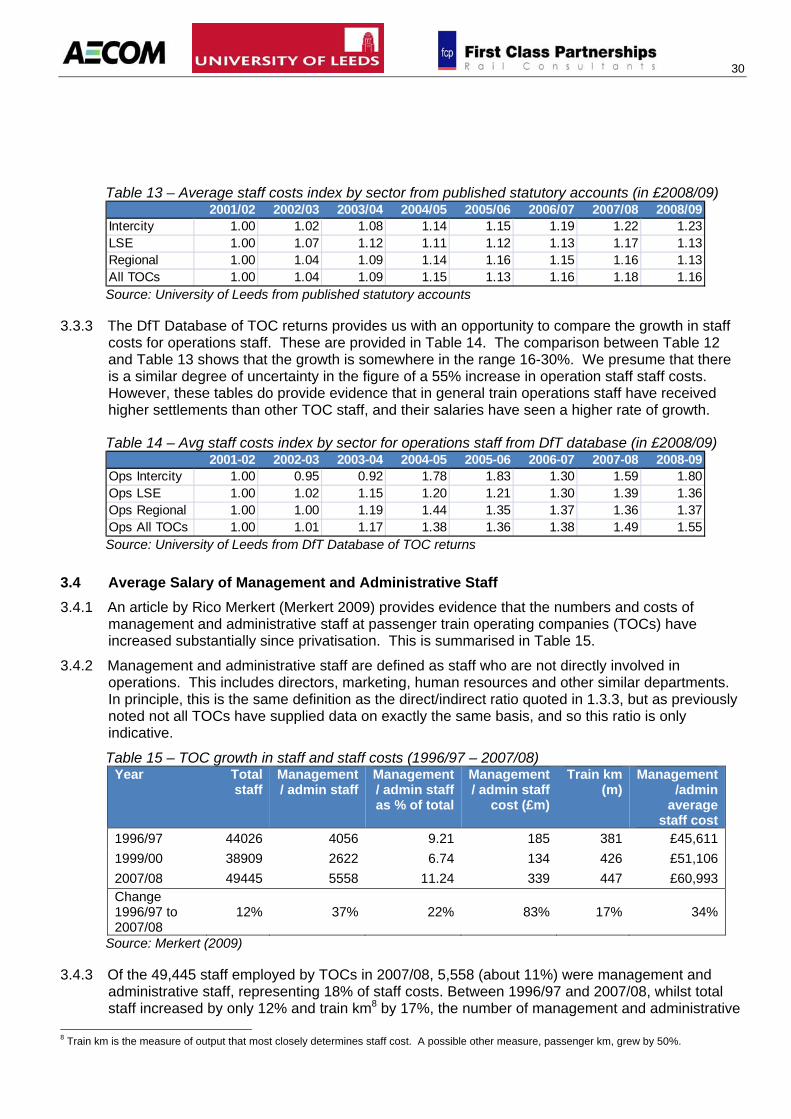
3.3.2 Table 12 gives the indices as based on the DfT database. Table 13 contains the equivalent values, but based on data from published statutory accounts, as reported in Table 11. A comparison of these shows that the DfT database suggests a higher rate of growth in staff costs. We think that these differences are explained by different assumptions in processing staff numbers - particularly around franchise handover etc. Therefore we can only conclude that average staff costs growth since 2001/02 has been in the range 16-30%. The equivalent growth in Average Earnings Index has been 4%.
Table 12 – Average staff costs index by sector from DfT database (in £2008/09) 2001-02 2002-03 2003-04 2004-05 2005-06 2006-07 2007-08 2008-09
Intercity 1.00 0.98 1.12 1.17 1.29 1.17 1.30 1.29LSE 1.00 1.04 1.07 1.14 1.20 1.25 1.28 1.28Regional 1.00 1.00 1.13 1.34 1.32 1.32 1.32 1.32All TOCs 1.00 1.01 1.10 1.21 1.25 1.25 1.31 1.30 Source: University of Leeds from DfT Database of TOC returns
30
Table 13 – Average staff costs index by sector from published statutory accounts (in £2008/09) 2001/02 2002/03 2003/04 2004/05 2005/06 2006/07 2007/08 2008/09
Intercity 1.00 1.02 1.08 1.14 1.15 1.19 1.22 1.23LSE 1.00 1.07 1.12 1.11 1.12 1.13 1.17 1.13Regional 1.00 1.04 1.09 1.14 1.16 1.15 1.16 1.13All TOCs 1.00 1.04 1.09 1.15 1.13 1.16 1.18 1.16 Source: University of Leeds from published statutory accounts
3.3.3 The DfT Database of TOC returns provides us with an opportunity to compare the growth in staff costs for operations staff. These are provided in Table 14. The comparison between Table 12 and Table 13 shows that the growth is somewhere in the range 16-30%. We presume that there is a similar degree of uncertainty in the figure of a 55% increase in operation staff staff costs. However, these tables do provide evidence that in general train operations staff have received higher settlements than other TOC staff, and their salaries have seen a higher rate of growth.
Table 14 – Avg staff costs index by sector for operations staff from DfT database (in £2008/09) 2001-02 2002-03 2003-04 2004-05 2005-06 2006-07 2007-08 2008-09
Ops Intercity 1.00 0.95 0.92 1.78 1.83 1.30 1.59 1.80Ops LSE 1.00 1.02 1.15 1.20 1.21 1.30 1.39 1.36Ops Regional 1.00 1.00 1.19 1.44 1.35 1.37 1.36 1.37Ops All TOCs 1.00 1.01 1.17 1.38 1.36 1.38 1.49 1.55 Source: University of Leeds from DfT Database of TOC returns
3.4 Average Salary of Management and Administrative Staff 3.4.1 An article by Rico Merkert (Merkert 2009) provides evidence that the numbers and costs of
management and administrative staff at passenger train operating companies (TOCs) have increased substantially since privatisation. This is summarised in Table 15.
3.4.2 Management and administrative staff are defined as staff who are not directly involved in operations. This includes directors, marketing, human resources and other similar departments. In principle, this is the same definition as the direct/indirect ratio quoted in 1.3.3, but as previously noted not all TOCs have supplied data on exactly the same basis, and so this ratio is only indicative.
Table 15 – TOC growth in staff and staff costs (1996/97 – 2007/08) Year Total
staff Management / admin staff
Management / admin staff as % of total
Management / admin staff
cost (£m)
Train km (m)
Management /admin
average staff cost
1996/97 44026 4056 9.21 185 381 £45,6111999/00 38909 2622 6.74 134 426 £51,1062007/08 49445 5558 11.24 339 447 £60,993Change 1996/97 to 2007/08
12% 37% 22% 83% 17% 34%
Source: Merkert (2009) 3.4.3 Of the 49,445 staff employed by TOCs in 2007/08, 5,558 (about 11%) were management and
administrative staff, representing 18% of staff costs. Between 1996/97 and 2007/08, whilst total staff increased by only 12% and train km8 by 17%, the number of management and administrative
8 Train km is the measure of output that most closely determines staff cost. A possible other measure, passenger km, grew by 50%.

31
staff increased by 37% and their cost by 83%. Although the average staff costs of management and administrative staff is £60,993 in 2007/08, compared to £39,328 for all staff (Table 11), there has been a 34% growth in staff costs since 1996/97, which is the same as the average growth across all functions in all TOCs. One possible explanation for this significant increase in management and administrative staff is that they are the staff most involved in transactions, both with government authorities and other parts of the industry. In the first three years after privatisation, the number of these staff actually fell by over one third. In contrast, total staff numbers fell by 16% over this period.
3.4.4 After 1999/2000, the reverse happened with the number of management and administrative staff doubling between 1999/2000 and 2007/08. However, other changes could explain these trends. For example, the distinction between management and administrative staff and other staff may have changed over the period and this could explain the increase in their numbers relative to other staff. Also the increases may be partly due to TOCs taking on more responsibilities, such as in rolling stock maintenance, which would reduce costs elsewhere in the system.
3.4.5 The post-Hatfield effect may also have caused some increases in staffing, in order to manage emerging safety requirements. Finally, the increasing investment in infrastructure e.g. Modern Facilities at Stations, West Coast Route Modernisation etc will have driven some staffing requirements at TOCs and Network Rail.
3.4.6 Nevertheless there seems to be some suggestion that the additional specifications introduced during the second round of franchises and the closer involvement of the SRA and DfT has led to higher indirect staff ratios. This may also be in part a correction following an immediate job reduction in the immediate period following privatisation.
3.4.7 Merkert analysed the impact on the number of management and administrative staff because this number could be seen as indicative of the level of transaction costs in the industry. However, there may be other transaction costs associated with the way in which the industry is organised and administered: the parent companies of the TOCs may also incur higher transaction costs and there is also the cost of the government administration itself (although this may have fallen since the abolition of SRA in 2006).
3.5 Average Salary of Drivers 3.5.1 We have also looked at the average earnings of goods vehicles drivers and bus and coach vehicle
drivers compared to train drivers and all employees over several years. These are shown in Figure 9.

32
Figure 9 – Driver hourly earnings in £2008/09
0.00
5.00
10.00
15.00
20.00
25.00
1981
1982
1983
1984
1985
1986
1987
1988
1989
1990
1991
1992
1993
1994
1995
1996
1997
1998
1999
2000
2001
2002
2003
2004
2005
2006
2007
2008
2009
Hou
rly Rate
Hourly Earnings of Drivers
Bus and Coach Drivers
Train drivers
Drivers of roads goods vehicles
All employees
Source: ASHE, Glaister (2004)
3.5.2 Train driver earnings have increased above the average for all UK employees in real terms since privatisation (1996/97). The growth in earnings over this period has been 42%, compared with 19%9 for all employees. However, bus and HGV driver earnings also increased substantially above the average at 36% and 24% respectively over the equivalent period.
3.5.3 Interestingly, looking back over a longer time period, train drivers have seen steady growth in earnings since the 1980s. At the same time bus driver earnings had a sustained period with no growth, followed by a more recent period of increasing at comparable rates to train drivers.
3.6 Comparison with Average Salary in Freight Operating Companies 3.6.1 Figure 10 compares the average staff costs across passenger TOCs with UK freight operators.
Again, these values have been calculated from data in published statutory accounts, and are expressed in £2008/09 prices. They include all staff costs, social security and pension costs, but not redundancy costs.
3.6.2 The average staff costs in freight operating companies tends to be higher than the average across passenger TOCs. Over the last five years, passenger TOCs have not seen much growth in average staff costs. This is comparable to Freightliner, Freightliner Heavy Haul and GB Railfreight, who have all seen either very little change in real terms. However, over the same period both EWS and DRS saw significant growth in staff costs.
9 Note, the equivalent figure from Average Earnings Index previously quoted is 15%. This figure is based on hourly gross mean wages.

33
Figure 10 – Average staff costs compared to freight operating companies in £2008/09
30,000
35,000
40,000
45,000
50,000
55,000
60,000
65,000
Average
Earnings
Average Earnings
EWSGB RailfreightFreightlinerFreightliner Heavy HaulPassenger TOCsDRS
Source: From data provided by the DfT, based on statutory returns
3.7 Comparison with Average Salary in Other UK Industries 3.7.1 To get a feel for the level of salary in the railway industry compared to other comparable
organisations, we have looked at staff costs for the occupations listed in Table 16. These are taken from ASHE 2009 (the Annual Survey of Hours and Earnings, Office for National Statistics) and the Civil Aviation Authority (2009).
3.7.2 Here average earnings includes all allowances/bonuses etc but does not include national insurance or pension contributions. Average staff costs includes both.

34
Table 16 – Average staff costs compared to other industries (£2008/09) Network Rail Average
EarningsAvg Staff
CostsComparison Average
EarningsAvg Staff
CostsSignallers 39,000 Air traffic control 60,548
Road construction and maintenance contractors
26,829
Repair and maintenance of aircraft and spacecraft
33,080
Electric power generation, transmission and distribution
32,173
Train operatorsLow cost airline pilots 67,308Bus driver 20,492HGV driver 24,699
Other train operations staff 26,000 31,000 Low cost airline cabin staff 17,224Station/platform staff 24,000 27,000 Air travel assistants 21,670
Customer service occupations 14,689Travel agency, tour operator and other reservation services
20,888
Airline ticket & sales staff 15,848Depot managment 36,000 42,000 Airline maintenance and overhaul 43,318Rail transport operatives 30,586 Air transport operatives 24,807
49,000
33,000
Booking office staff 16,000 21,000
Maintenance
Drivers 40,000
Source: ASHE, CAA data, Inbucon report and TOC Theme H returns
3.7.3 The figures for the Network Rail signallers and maintenance salaries are based on the Inbucon report (Inbucon 2008), adjusted to £2008/09 prices. The figures for the TOC occupations are taken from the TOC responses to the Theme H surveys, and have also been adjusted to £2008/09 prices. Therefore the data sample is quite small, as it is only based on those TOCs who chose to provide salaries by occupation in their survey responses. The average salaries from ASHE do not include pensions and national insurance contributions, but the data from the Civil Aviation Authority includes both. Therefore we have quoted both the average earnings and the average staff costs for a fair comparison. Although not all the occupations are directly comparable, and it is difficult to say anything very conclusive from such a small sample of data, there does seem to be some indicative evidence that railway average salary rates may be high. We would caution drawing firm conclusions from this data however.
3.7.4 The average earnings for Network Rail signallers and maintenance staff have been based on values reported in a detailed study of Network Rail’s costs undertaken by Inbucon for CP4 (Inbucon 2008). This report concluded that although non-operational railway employees were paid at about market rate, signalling and maintenance staff were above market rate, noting that terms and conditions were in some aspects very favourable against comparators (particularly in relation to travel concessions). Inbucon also noted the array of allowances for certain job types, and recommended harmonisation in some areas would be desirable. We also note that Network Rail was working towards this goal at the time the report was compiled.
3.7.5 We reproduce Inbucon results for 2007/08, which show the pattern of wages within Network Rail in Table 17 below. Signallers pay is characterised by a high proportion of Rest Day and Sunday working allowances. Maintenance workers are relying on high overtime payments. Together, these form a substantial proportion of the workforce.
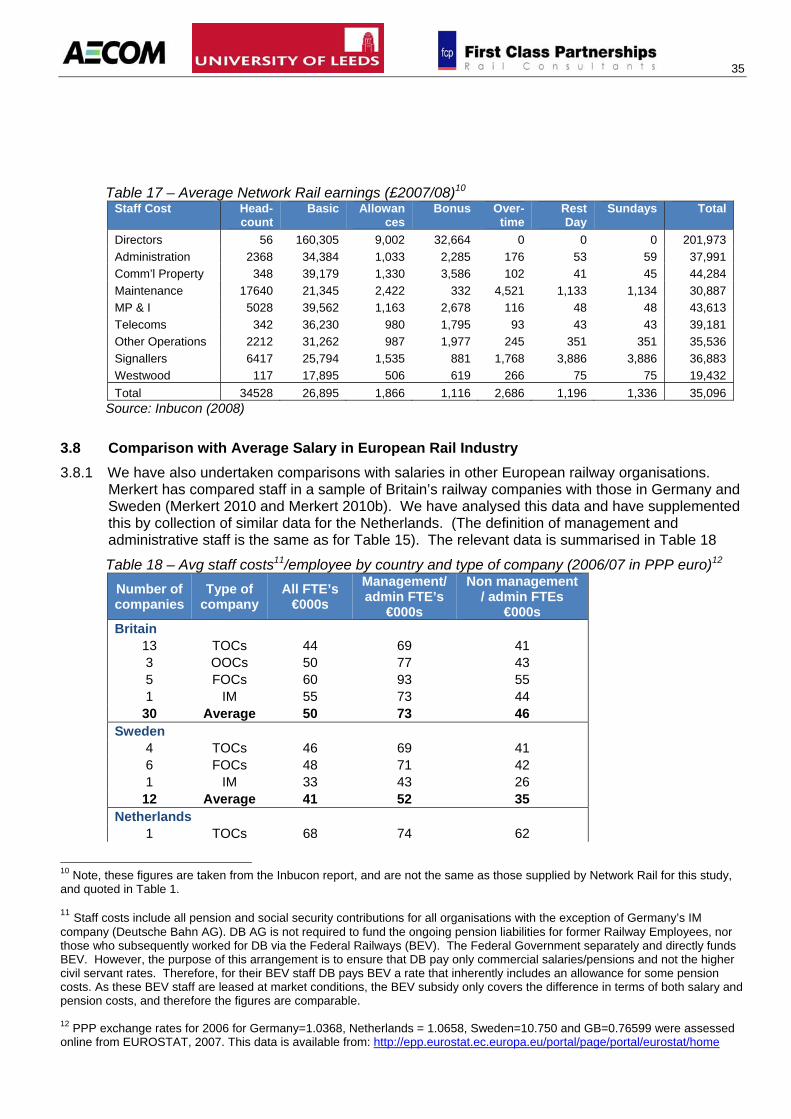
35
Table 17 – Average Network Rail earnings (£2007/08)10 Staff Cost Head-
count Basic Allowan
ces Bonus Over-
time Rest Day
Sundays Total
Directors 56 160,305 9,002 32,664 0 0 0 201,973 Administration 2368 34,384 1,033 2,285 176 53 59 37,991 Comm’l Property 348 39,179 1,330 3,586 102 41 45 44,284 Maintenance 17640 21,345 2,422 332 4,521 1,133 1,134 30,887 MP & I 5028 39,562 1,163 2,678 116 48 48 43,613 Telecoms 342 36,230 980 1,795 93 43 43 39,181 Other Operations 2212 31,262 987 1,977 245 351 351 35,536 Signallers 6417 25,794 1,535 881 1,768 3,886 3,886 36,883 Westwood 117 17,895 506 619 266 75 75 19,432 Total 34528 26,895 1,866 1,116 2,686 1,196 1,336 35,096
Source: Inbucon (2008)
3.8 Comparison with Average Salary in European Rail Industry 3.8.1 We have also undertaken comparisons with salaries in other European railway organisations.
Merkert has compared staff in a sample of Britain’s railway companies with those in Germany and Sweden (Merkert 2010 and Merkert 2010b). We have analysed this data and have supplemented this by collection of similar data for the Netherlands. (The definition of management and administrative staff is the same as for Table 15). The relevant data is summarised in Table 18
Table 18 – Avg staff costs11/employee by country and type of company (2006/07 in PPP euro)12 Number of companies
Type of company
All FTE’s €000s
Management/admin FTE’s
€000s
Non management / admin FTEs
€000s Britain
13 TOCs 44 69 41 3 OOCs 50 77 43 5 FOCs 60 93 55 1 IM 55 73 44 30 Average 50 73 46
Sweden 4 TOCs 46 69 41 6 FOCs 48 71 42 1 IM 33 43 26 12 Average 41 52 35
Netherlands 1 TOCs 68 74 62
10 Note, these figures are taken from the Inbucon report, and are not the same as those supplied by Network Rail for this study, and quoted in Table 1. 11 Staff costs include all pension and social security contributions for all organisations with the exception of Germany’s IM company (Deutsche Bahn AG). DB AG is not required to fund the ongoing pension liabilities for former Railway Employees, nor those who subsequently worked for DB via the Federal Railways (BEV). The Federal Government separately and directly funds BEV. However, the purpose of this arrangement is to ensure that DB pay only commercial salaries/pensions and not the higher civil servant rates. Therefore, for their BEV staff DB pays BEV a rate that inherently includes an allowance for some pension costs. As these BEV staff are leased at market conditions, the BEV subsidy only covers the difference in terms of both salary and pension costs, and therefore the figures are comparable. 12 PPP exchange rates for 2006 for Germany=1.0368, Netherlands = 1.0658, Sweden=10.750 and GB=0.76599 were assessed online from EUROSTAT, 2007. This data is available from: http://epp.eurostat.ec.europa.eu/portal/page/portal/eurostat/home

36
1 IM 62 N/A N/A 2 Average 67 N/A N/A
Germany
6 TOCs 43 69 41 2 OOCs 43 69 41 4 FOCs 44 71 42 1 IM 42 61 36 17 Average 43 63 40
Source: Data supplied by Rico Merkert. Data on the Netherlands supplied by Didier van de Velde and Martijn Lelieveld at inno-V, the Netherlands
3.8.2 Table 18 compares average staff costs in 2006/7 expressed in Euros, adjusted for purchasing power parity (PPP), and shows that these were about 20% higher in Britain than in Germany and Sweden though about 25% less in Britain than in the Netherlands. This pattern is broadly the same for management and administrative staff and for other staff. Looking at the data for passenger TOCs alone there is however little differences between Britain, Germany and Sweden. For FOCs and infrastructure managers, average British salaries are higher. However staff costs at Prorail, the infrastructure manager in the Netherlands, are slightly higher than at Network Rail.
3.8.3 Table 19 compares trends in average staff costs expressed in local currency:
Table 19 – Trends in average staff costs expressed in local currency Staff Costs per member of staff
Country Companies Currency13 2001/02 2008/09 Change GB All franchise operators 2008 £ 32,579 38,380 18%Germany DB Regio 2008 Euro 21,700 36,305 67%Germany DB Fernverkehr 2008 Euro 30,215 43,446 44%
Country Companies Currency 2005/06 2008/09 Change GB All franchise operators 2008 £ 36,282 38,380 6%Sweden SJ Kroner 2008 530,391 558,846 5%
Country Companies Currency 2004/05 2008/09 Change GB All franchise operators 2008 £ 35,368 38,380 9%Netherlands NS 2008 Euro 53,615 54,840 2%
Source: Data supplied by Rico Merkert. Data on the Netherlands supplied by Didier van de Velde and Martijn Lelieveld at inno-V, the Netherlands14
3.8.4 Table 19 shows that Britain has had slightly larger staff costs increases than Sweden and the
Netherlands but all three have had average real increases of less than 10% over the past few years. In contrast, over a longer period since 2001/2, average staff costs have increased by 18% in Britain compared to 67% for DB Regio and 44% for DB Fernverkehr.
13 The figures should not be compared between years as they are different currencies and are not adjusted for PPP. This is because they are intended to show trends in local currency. 14 Note that this analysis is based on a sample of 13 TOCs, and therefore gives slightly different results to analysis based on all franchised passenger TOCs, as reported in Table 11.

37
3.8.5 A likely explanation as to why staff costs increased so much in DB is that the 1993 rail reforms in Germany moved staff from the status of civil servants to that of normal contracts. These normal contracts lacked the generous pensions and other social protection to which civil servants are entitled but meant that railway employees had to be paid more to compensate for this. The process was gradual as it has since been necessary to pay more to attract new employees.
3.9 Effect of Temporary Contracts and Mergers on Salary 3.9.1 In the normal course of events, one might expect to see franchising competition providing
opportunities to drive down costs through competition. This does not appear to have happened, except during the years immediately following privatisation, but during the period, significant improvements in performance and quality may have driven up staff costs. Another possible hypothesis is that TOCs that ran into difficulty and were placed on temporary management or re-negotiated contracts may have seen higher average salary growth whilst on those arrangements. Previous evidence (e.g. Smith et. al. 2010 and Smith and Wheat 2009) has pointed to the substantial rise in costs / deterioration in total factor productivity across the TOC sector post-1999/00, as well as the deterioration in relative efficiency of those TOCs placed onto temporary management or re-negotiated contracts following financial distress.
3.9.2 It is therefore interesting to see whether TOCs on temporary contract arrangements had faster wage growth as well as deteriorating relative efficiency performance. It would be understandable if SRA/DfT sanctioned measures to ensure staff retention during a period of uncertainty, possibly including salary increases. Interestingly Table 20 below does not show any substantial difference between average staff costs growth for TOCs on temporary contracts as compared to the rest of the sector; although it does appear that average staff costs were growing faster for these TOCs during the early years, which may have been one of the factors explaining the subsequent financial distress.
Table 20: Growth in average staff costs by TOC type in £2008/09 1996/97 -1999/00 1999/00 - 2007/08 1996/97 - 2007/08 All TOCs 9% 23.0% 34.0% "Problem" TOCs 10% 22.0% 33.7% Other 8% 24.3% 33.8% Average Earnings Index 7% 8.9% 16.3%
Source: University of Leeds ‘Aggregate Level Analysis of Train Operating Company Average Salary and Productivity Performance’ (See Appendix A)
3.9.3 There appears to be some substantial changes in the data in 2008/09 (see Table 11) which may relate to franchise boundary changes. (For example, Cross Country average staff costs fall substantially). An interesting further question concerns the impact of mergers on average salary levels. Anecdotal evidence suggests that mergers result in all staff being placed onto the highest salary / benefit levels of the merging operators, thus resulting in a substantial increase in average salary levels. Data for three mergers is shown in Table 21 to Table 23.
Table 21 – Average staff costs: Greater Western merger / franchise changes in £2008/09 Great Western Merger 2002/03 2003/04 2004/05 2005/06 2006/07 2007/08 2008/09Great Western 37,508 38,611 40,432 42,327Thames Trains First Great Western Link 34,609 38,855 40,126 40,905Wales and West/Wessex 33,444 37,251 36,279 36,880Weighted Average by Train - KM 40,387Greater Western 40,356 42,931 41,165Growth Compared to Weighted Average in 2005/06 -0.1% 6.3% 1.9%TOC's Sector average wage growth 2.3% 4.6% 2.6%

38
Table 22 – Average staff costs: Northern/TPE merger / franchise changes in £2008/09 Northern Merger 2002/03 2003/04 2004/05 2005/06 2006/07 2007/08 2008/09Arriva Trains North 31,149 30,963North Western 32,658 34,132Weighted Average by Train - KM 32,269Northern 40,021 31,899 36,060 36,080 35,402TPE 41,191 40,612 42,726 42,692 43,020Weighted Average by Train - KM 40,305 33,905 37,744 37,788 37,431Growth Compared to Weighted Average in 2003/04 24.9% 5.1% 17.0% 17.1% 16.0%TOC's Sector average wage growth 5.3% 3.7% 6.1% 8.5% 6.4%
Table 23 – Average staff costs: ONE merger / franchise changes in £2008/09 ONE Merger 2002/03 2003/04 2004/05 2005/06 2006/07 2007/08 2008/09Anglia 27,007 28,361Great Eastern 33,432 34,186WAGN (all) 34,645 37,000Weighted Average 34,261WAGN (GN) 42,466 37,987ONE 36,070 35,482 36,268 36,437 37,963Weighted Average 37,860 36,176 36,268 36,437 37,963Growth Compared to Weighted Average in 2003/04 10.5% 5.6% 5.9% 6.4% 10.8%TOC's Sector average wage growth 5.3% 3.7% 6.1% 8.5% 6.4% Source: University of Leeds ‘Aggregate Level Analysis of Train Operating Company Average Salary and Productivity Performance’ (See Appendix A)
3.9.4 For some of the mergers there appears to be some noise in the data around the franchise change over, which is perhaps not surprising given the problems of aggregating TOCs and producing a consistent time series around the time of mergers. This is the most likely explanation for the apparent fall in average staff costs for Northern from 2004/05 to 2005/06.
3.9.5 In the case of the Greater Western franchise, by 2007/08 the merged TOC’s average staff costs had increased by 6.3% compared to the pre-merged position (2003/04), whereas total sector average staff costs had increased by only 4.6% over that period. However, the position reverses itself in 2008/09, so the picture is not totally clear. On balance we have more confidence in the data to 2007/08 in part because inflation was lower prior to 2008/09, and in part because the 2008/09 data was included for the first time as part of this project and we have not had time to fully assess its quality.
3.9.6 Despite the uncertainty around the accuracy of the Northern figures for 2004/05 and 2005/06, the overall picture for the Northern / TPE merger is clearer, with average staff costs ending up 16% higher in 2008/09 compared to the pre-merged position (2003/04), as compared to sector growth of only 6.4% over that period. There is some ambiguity concerning the ONE merger, with the 2007/08 and 2008/09 picture giving different answers.
3.9.7 Overall, however, we consider that this brief analysis provides some weak evidence to suggest that franchise mergers have increased average staff costs.
3.9.8 The findings here are in line with those reported previously in Wheat and Smith (2010).
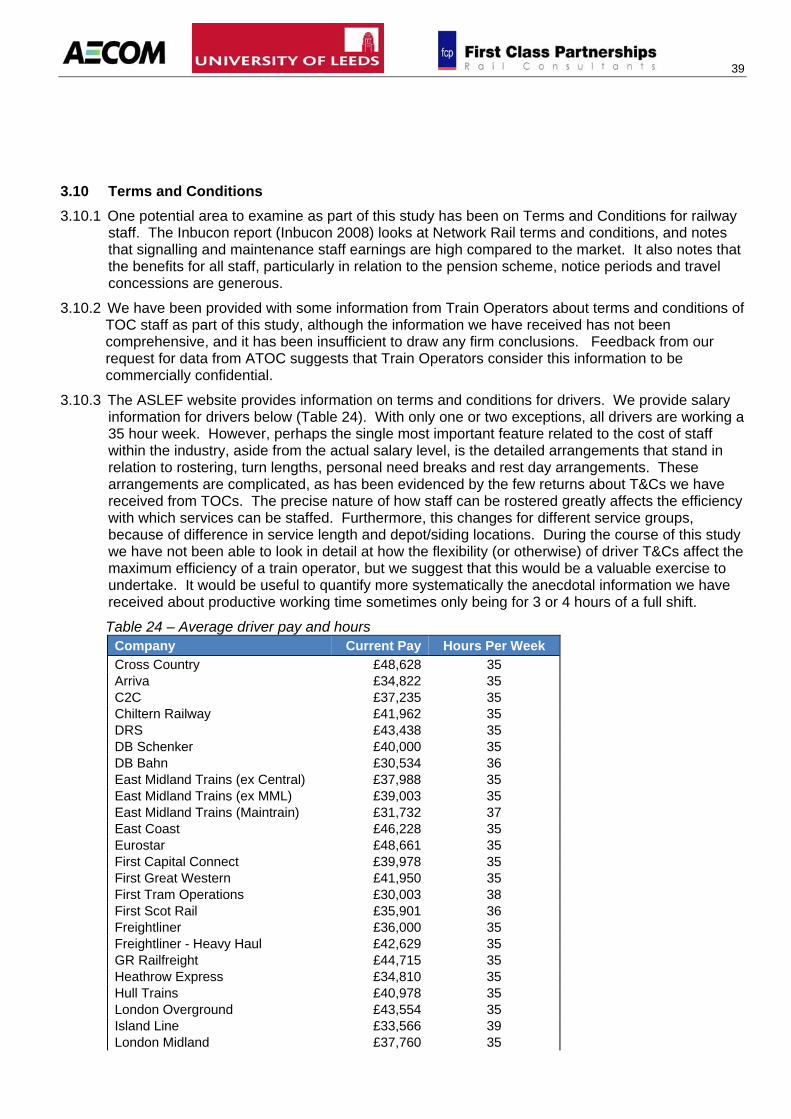
39
3.10 Terms and Conditions 3.10.1 One potential area to examine as part of this study has been on Terms and Conditions for railway
staff. The Inbucon report (Inbucon 2008) looks at Network Rail terms and conditions, and notes that signalling and maintenance staff earnings are high compared to the market. It also notes that the benefits for all staff, particularly in relation to the pension scheme, notice periods and travel concessions are generous.
3.10.2 We have been provided with some information from Train Operators about terms and conditions of TOC staff as part of this study, although the information we have received has not been comprehensive, and it has been insufficient to draw any firm conclusions. Feedback from our request for data from ATOC suggests that Train Operators consider this information to be commercially confidential.
3.10.3 The ASLEF website provides information on terms and conditions for drivers. We provide salary information for drivers below (Table 24). With only one or two exceptions, all drivers are working a 35 hour week. However, perhaps the single most important feature related to the cost of staff within the industry, aside from the actual salary level, is the detailed arrangements that stand in relation to rostering, turn lengths, personal need breaks and rest day arrangements. These arrangements are complicated, as has been evidenced by the few returns about T&Cs we have received from TOCs. The precise nature of how staff can be rostered greatly affects the efficiency with which services can be staffed. Furthermore, this changes for different service groups, because of difference in service length and depot/siding locations. During the course of this study we have not been able to look in detail at how the flexibility (or otherwise) of driver T&Cs affect the maximum efficiency of a train operator, but we suggest that this would be a valuable exercise to undertake. It would be useful to quantify more systematically the anecdotal information we have received about productive working time sometimes only being for 3 or 4 hours of a full shift.
Table 24 – Average driver pay and hours Company Current Pay Hours Per Week Cross Country £48,628 35 Arriva £34,822 35 C2C £37,235 35 Chiltern Railway £41,962 35 DRS £43,438 35 DB Schenker £40,000 35 DB Bahn £30,534 36 East Midland Trains (ex Central) £37,988 35 East Midland Trains (ex MML) £39,003 35 East Midland Trains (Maintrain) £31,732 37 East Coast £46,228 35 Eurostar £48,661 35 First Capital Connect £39,978 35 First Great Western £41,950 35 First Tram Operations £30,003 38 First Scot Rail £35,901 36 Freightliner £36,000 35 Freightliner - Heavy Haul £42,629 35 GR Railfreight £44,715 35 Heathrow Express £34,810 35 Hull Trains £40,978 35 London Overground £43,554 35 Island Line £33,566 39 London Midland £37,760 35

40
London Underground £40,714 35 Mersey Rail £35,500 35 Northern Rail £38,181 35 National Express (East Anglia) £37,357 35 Serco Rail Operations £41,464 35 South Eastern £39,350 36 Southern £38,785 35 SouthWest Trains £40,124 37 First Transpennine Express £40,126 35 Tube Lines Limited £43,425 35 Virgin (West Coast) £46,812 35
Source: ASLEF website http://www.aslef.org.uk/information/102222/102225/companies/
3.10.4 This table shows the wide range of salaries across drivers. The highest and lowest salaries are for Eurostar and Tram operators respectively, however, there is no clear pattern amongst passenger franchise TOCs.
3.10.5 It is difficult to conclude on the relative value of drivers across train operators without consideration of the wider terms and conditions that affect the efficiency with which train operators can roster staff. On the information that we have received, the terms and conditions of drivers do put considerable restraint on the extent to which train operators can efficiently resource services.

41
4.1 Staff Productivity in Train Km per Employee 4.1.1 For train operators, historic information shows that staff productivity, measured by train km per
member of staff, improved immediately following privatisation, and since gradually deteriorated to 2004/05. Since then, this measure has stabilised and become fairly constant (see Figure 12). However, passenger franchise train km have seen a steady increase during the whole of this period.
4.1.2 The train km per staff productivity measure is less useful for Railtrack/Network Rail because the absence of maintenance staff during the Railtrack period, followed by their inclusion in Network Rail distorts the picture (Figure 11). Again, we have estimated the productivity with the maintenance staff removed in order to show a consistent trendline. However, we can say that in the period just after privatisation, staff productivity increased rapidly, whereas since then it has been declining.
4.1.3 We note that this measure of productivity does not take into account the benefit of increased enhancement work. In fact, an increase in enhancement work tends to reduce overall productivity on this measure, as the headcount increases but train-km remains the same. To measure the benefits of an enhancement programme would require looking at another metric.
Figure 11 – Staff productivity in Train km per employee15 since privatisation
0
5,000
10,000
15,000
20,000
25,000
30,000
35,000
40,000
45,000
Train Km
per Staff
Staff ProductivityTOCS
Network Rail
Estimate Excl Maintenance
Infrastructure maintenance taken in
house
Network Rail takes over Railtrack
Source: University of Leeds from published statutory accounts; NR data from published statutory accounts; Estimates of maintenance staff based on other data supplied by Network Rail
15 Staff numbers as reported in statutory accounts. The accounts do not specify whether staff numbers are actual headcount or FTEs.
4 Railway Industry Staff Productivity

42
Figure 12 – TOC staff productivity since privatisation (as Figure 11 but different scale)
0
100
200
300
400
500
600
700
0
2,000
4,000
6,000
8,000
10,000
12,000
Million Train Km
Train Km
per Staff
Staff Productivity
TOC Train Km per FTE
Million Train Km
Source: From data provided by University of Leeds based on published statutory accounts; Train Km data supplied by DfT
4.1.4 For TOCS, this train km per staff member productivity measure has a number of limitations - namely:
it ignores capital substitution effects; it ignores the impact of contracting out; and it ignores the impact of economies of scale and density, and other sources of heterogeneity
such as speed of service.
The following analysis therefore should be viewed with these caveats in mind.
4.1.5 Table 25 shows productivity levels by TOC. They are grouped by sector in order to strip out some of the heterogeneity between TOCs. The totals by sector are also presented in Figure 13.
4.1.6 As noted, these measures are aggregate, and will be affected by the proportions of different types of staff. For example, Cross Country which operates no stations has a much higher productivity level. The sector groupings do not remove all heterogeneity of course, and there remain differences between operators within the same sector.
4.1.7 The table shows improving productivity during the first few years, followed by a deterioration post 1999/00 (see Smith et. al., 2010). Overall productivity growth between 1996/97 and 2008/09 is therefore minimal (10% over 12 years), or only 0.8% per year. This is low compared to the economy as a whole and certainly compared to what might have been expected following privatisation and competitive franchising.
4.1.8 What productivity growth that there is has been driven by the Intercity TOCs, who have seen the highest growth in train-km. However, given the strong economies of density a large part of these savings cannot therefore be seen as productivity gains in the traditional sense. It should further be noted that Intercity has had both higher productivity growth and higher average salary growth over the period (we return to this point below).
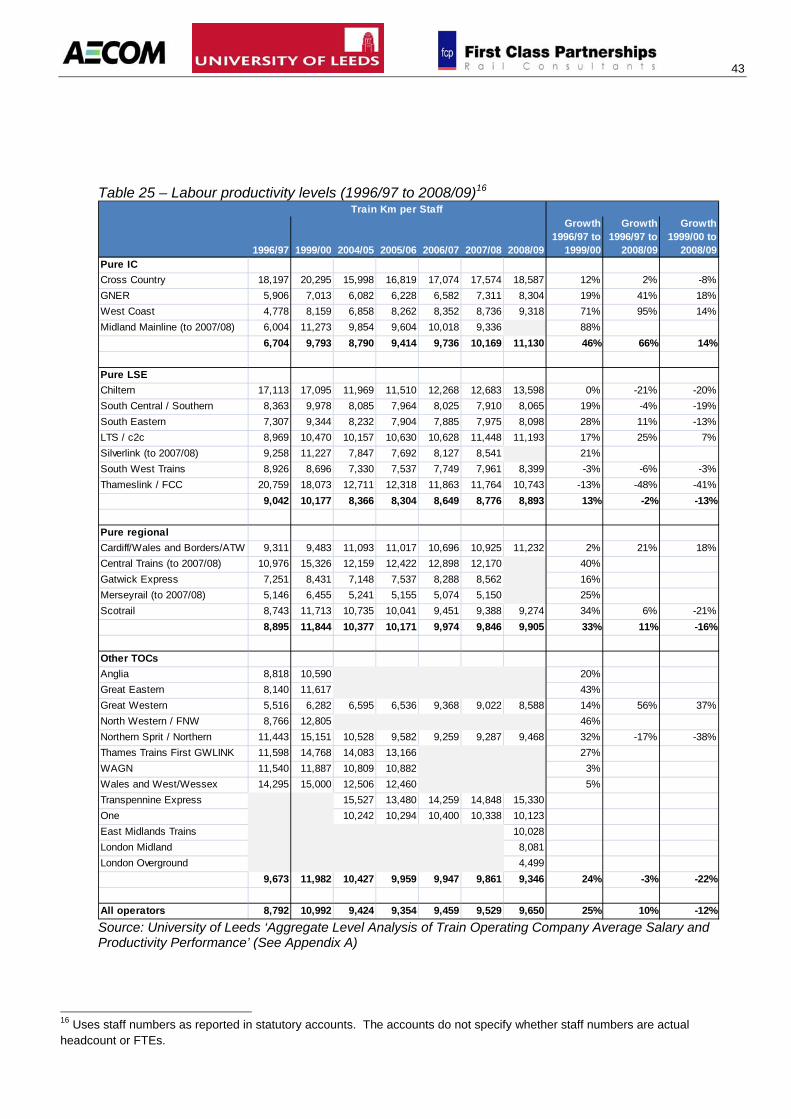
43
Table 25 – Labour productivity levels (1996/97 to 2008/09)16
1996/97 1999/00 2004/05 2005/06 2006/07 2007/08 2008/09
Growth 1996/97 to
1999/00
Growth 1996/97 to
2008/09
Growth 1999/00 to
2008/09Pure ICCross Country 18,197 20,295 15,998 16,819 17,074 17,574 18,587 12% 2% -8%GNER 5,906 7,013 6,082 6,228 6,582 7,311 8,304 19% 41% 18%West Coast 4,778 8,159 6,858 8,262 8,352 8,736 9,318 71% 95% 14%Midland Mainline (to 2007/08) 6,004 11,273 9,854 9,604 10,018 9,336 88%
6,704 9,793 8,790 9,414 9,736 10,169 11,130 46% 66% 14%
Pure LSEChiltern 17,113 17,095 11,969 11,510 12,268 12,683 13,598 0% -21% -20%South Central / Southern 8,363 9,978 8,085 7,964 8,025 7,910 8,065 19% -4% -19%South Eastern 7,307 9,344 8,232 7,904 7,885 7,975 8,098 28% 11% -13%LTS / c2c 8,969 10,470 10,157 10,630 10,628 11,448 11,193 17% 25% 7%Silverlink (to 2007/08) 9,258 11,227 7,847 7,692 8,127 8,541 21%South West Trains 8,926 8,696 7,330 7,537 7,749 7,961 8,399 -3% -6% -3%Thameslink / FCC 20,759 18,073 12,711 12,318 11,863 11,764 10,743 -13% -48% -41%
9,042 10,177 8,366 8,304 8,649 8,776 8,893 13% -2% -13%
Pure regional Cardiff/Wales and Borders/ATW 9,311 9,483 11,093 11,017 10,696 10,925 11,232 2% 21% 18%Central Trains (to 2007/08) 10,976 15,326 12,159 12,422 12,898 12,170 40%Gatwick Express 7,251 8,431 7,148 7,537 8,288 8,562 16%Merseyrail (to 2007/08) 5,146 6,455 5,241 5,155 5,074 5,150 25%Scotrail 8,743 11,713 10,735 10,041 9,451 9,388 9,274 34% 6% -21%
8,895 11,844 10,377 10,171 9,974 9,846 9,905 33% 11% -16%
Other TOCsAnglia 8,818 10,590 20%Great Eastern 8,140 11,617 43%Great Western 5,516 6,282 6,595 6,536 9,368 9,022 8,588 14% 56% 37%North Western / FNW 8,766 12,805 46%Northern Sprit / Northern 11,443 15,151 10,528 9,582 9,259 9,287 9,468 32% -17% -38%Thames Trains First GWLINK 11,598 14,768 14,083 13,166 27%WAGN 11,540 11,887 10,809 10,882 3%Wales and West/Wessex 14,295 15,000 12,506 12,460 5%Transpennine Express 15,527 13,480 14,259 14,848 15,330One 10,242 10,294 10,400 10,338 10,123East Midlands Trains 10,028London Midland 8,081London Overground 4,499
9,673 11,982 10,427 9,959 9,947 9,861 9,346 24% -3% -22%
All operators 8,792 10,992 9,424 9,354 9,459 9,529 9,650 25% 10% -12%
Train Km per Staff
Source: University of Leeds ‘Aggregate Level Analysis of Train Operating Company Average Salary and Productivity Performance’ (See Appendix A)
16 Uses staff numbers as reported in statutory accounts. The accounts do not specify whether staff numbers are actual headcount or FTEs.

44
Figure 13 – Staff productivity in Train km per employee17 by sector
0
2,000
4,000
6,000
8,000
10,000
12,000
14,000
Train Km
per Staff
Productivity by Sector
Intercity LSERegional Other All
Source: From data provided by University of Leeds
4.1.9 Table 26 shows that those TOCs placed on management or re-negotiated contracts following
financial distress (the “problem” TOCs) did worse after 1999/00 (between 1999/00 and 2005/06) than other TOCs, though only marginally so (-16% as compared with -12% for unaffected TOCs). This finding accords with previous evidence showing that most of the extra cost rise for these TOCs was in “other” costs, not staff costs. The performance gap then opens up further by 2007/08, though by this stage most of the temporary contracts had been replaced following competitive re-franchising, so this finding seems surprising.
Table 26 – Labour productivity growth (1996/97 to 2008/09) for “problem” and other TOCs Productivity growth rates
1996/97 -1999/00
1999/00 - 2005/06
1999/00 - 2007/08
All TOCs 25% -15.0% -13.0% "Problem" TOCs 31% -16.0% -17.0% Other 16% -12.0% -5.0% Virgin 58% -1.0% 4.0%
Source: University of Leeds ‘Aggregate Level Analysis of Train Operating Company Average Salary and Productivity Performance’ (See Appendix A)
4.1.10 It is hard to make definitive judgements based on this data. Within the sectors, Cross Country stands out as having much higher productivity, though that may be explained (at least prior to 2008/09) by the fact that the company did not operate any stations. Excluding Cross-Country the variation in productivity between Intercity operators is around 27% based on 2007/08 data and 12% based on 2008/09 data. The variations within LSE and Regional are 48% (excluding Chiltern, which has a much higher productivity level) and 42% (excluding Merseyrail, which has much lower productivity) respectively.
17 Staff numbers as reported in statutory accounts. The accounts do not specify whether staff numbers are actual headcount or FTEs.
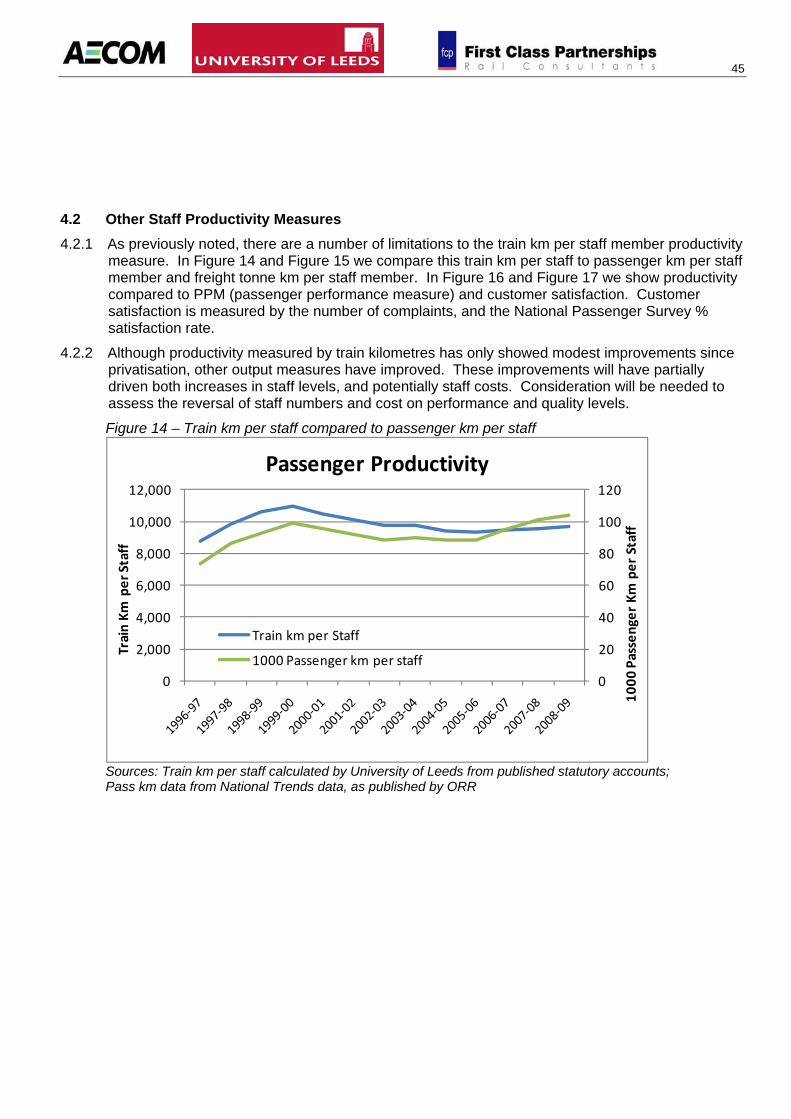
45
4.2 Other Staff Productivity Measures 4.2.1 As previously noted, there are a number of limitations to the train km per staff member productivity
measure. In Figure 14 and Figure 15 we compare this train km per staff to passenger km per staff member and freight tonne km per staff member. In Figure 16 and Figure 17 we show productivity compared to PPM (passenger performance measure) and customer satisfaction. Customer satisfaction is measured by the number of complaints, and the National Passenger Survey % satisfaction rate.
4.2.2 Although productivity measured by train kilometres has only showed modest improvements since privatisation, other output measures have improved. These improvements will have partially driven both increases in staff levels, and potentially staff costs. Consideration will be needed to assess the reversal of staff numbers and cost on performance and quality levels.
Figure 14 – Train km per staff compared to passenger km per staff
0
20
40
60
80
100
120
0
2,000
4,000
6,000
8,000
10,000
12,000
1000
Passenger Km per Staff
Train Km
per Staff
Passenger Productivity
Train km per Staff
1000 Passenger km per staff
Sources: Train km per staff calculated by University of Leeds from published statutory accounts; Pass km data from National Trends data, as published by ORR

46
Figure 15 – Train km per staff compared to freight tonne km per staff
0
0.5
1
1.5
2
2.5
3
3.5
0
2,000
4,000
6,000
8,000
10,000
12,000
Million Freight Tonn
e Km
per Staff
Train Km
per STaff
Passenger and Freight Productivity
Train km per Staff
Freight (million tonne kilometres) per staff
Sources: Train km per staff calculated by University of Leeds from published statutory accounts; Freight tonne km data from National Trends data, as published by ORR; Freight staff data supplied by DfT
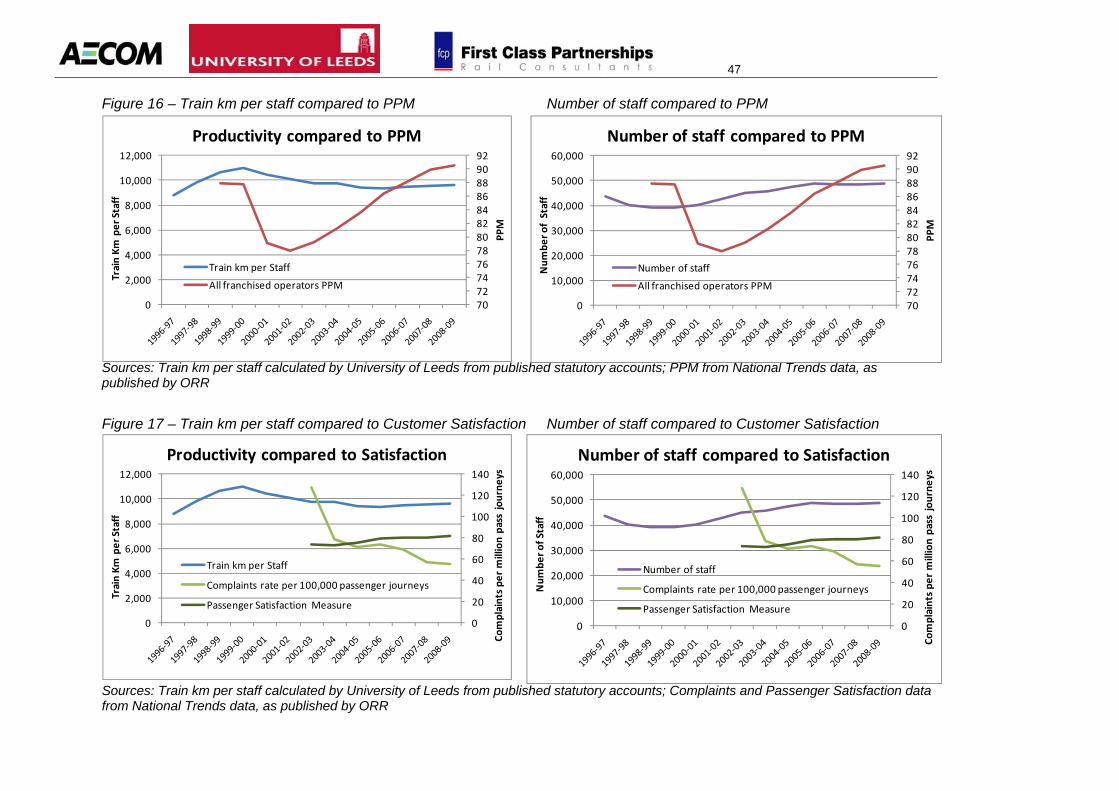
47
Figure 16 – Train km per staff compared to PPM Number of staff compared to PPM
Sources: Train km per staff calculated by University of Leeds from published statutory accounts; PPM from National Trends data, as published by ORR
Figure 17 – Train km per staff compared to Customer Satisfaction Number of staff compared to Customer Satisfaction Sources: Train km per staff calculated by University of Leeds from published statutory accounts; Complaints and Passenger Satisfaction data from National Trends data, as published by ORR
707274767880828486889092
0
10,000
20,000
30,000
40,000
50,000
60,000
PPM
Num
ber o
f Staff
Number of staff compared to PPM
Number of staff
All franchised operators PPM
707274767880828486889092
0
2,000
4,000
6,000
8,000
10,000
12,000
PPM
Train Km
per Staff
Productivity compared to PPM
Train km per Staff
All franchised operators PPM
0
20
40
60
80
100
120
140
0
2,000
4,000
6,000
8,000
10,000
12,000
Complaints pe
r million pass jou
rneys
Train Km
per Staff
Productivity compared to Satisfaction
Train km per Staff
Complaints rate per 100,000 passenger journeys
Passenger Satisfaction Measure
0
20
40
60
80
100
120
140
0
10,000
20,000
30,000
40,000
50,000
60,000
Complaints pe
r million pass jou
rneys
Num
ber o
f Staff
Number of staff compared to Satisfaction
Number of staff
Complaints rate per 100,000 passenger journeys
Passenger Satisfaction Measure

48
4.3 Unit Staff Costs 4.3.1 Figure 18 shows unit staff costs, defined as staff costs divided by train km. This measure
therefore captures both changes in average salaries and labour productivity. It shows that over the period since privatisation unit staff costs have risen by 20%, since average salary growth has far outstripped labour productivity growth.
Figure 18 – Staff cost/train km indices (2008/09)
60
70
80
90
100
110
120
130
140
150
Inde
x
Staff Costs per Train Km Indices
InterCity LSE Regional
Virgin Other All TOCs
Source: From data provided by University of Leeds
4.3.2 The unit costs, defined as staff costs divided train-km, can also be expressed as follows:
Unit cost = staff costs / train-km
= (staff costs / # employees) / ( train-km/ # employees)
= average salary / productivity
4.3.3 Thus unit costs increase when average salary growth outstrips productivity growth, and decrease when productivity growth outstrips average salary growth. Average salary growth is illustrated in Figure 7, and productivity growth is illustrated in Figure 13.
4.3.4 Looking at the Intercity line in Figure 18, the unit costs fell sharply between 1996/97 and 1999/00 and then rose again between 1999/00 and 2008/09. They still end up lower in 2008/09 than in 1996/97. The explanation for this is as follows:
During the early years, both average salary and productivity are increasing, but productivity growth outstrips wage growth and thus unit costs fall.
In 1990/00 the average salary for Intercity TOCs actually dropped (Figure 7). We are not sure of the reason for this, but think may be related to restructuring/consolidating allowances etc. Whatever the reason it causes the sharp decrease in unit costs in 1990/00 for Intercity in Figure 18 as now salary is decreasing while productivity is still increasing.
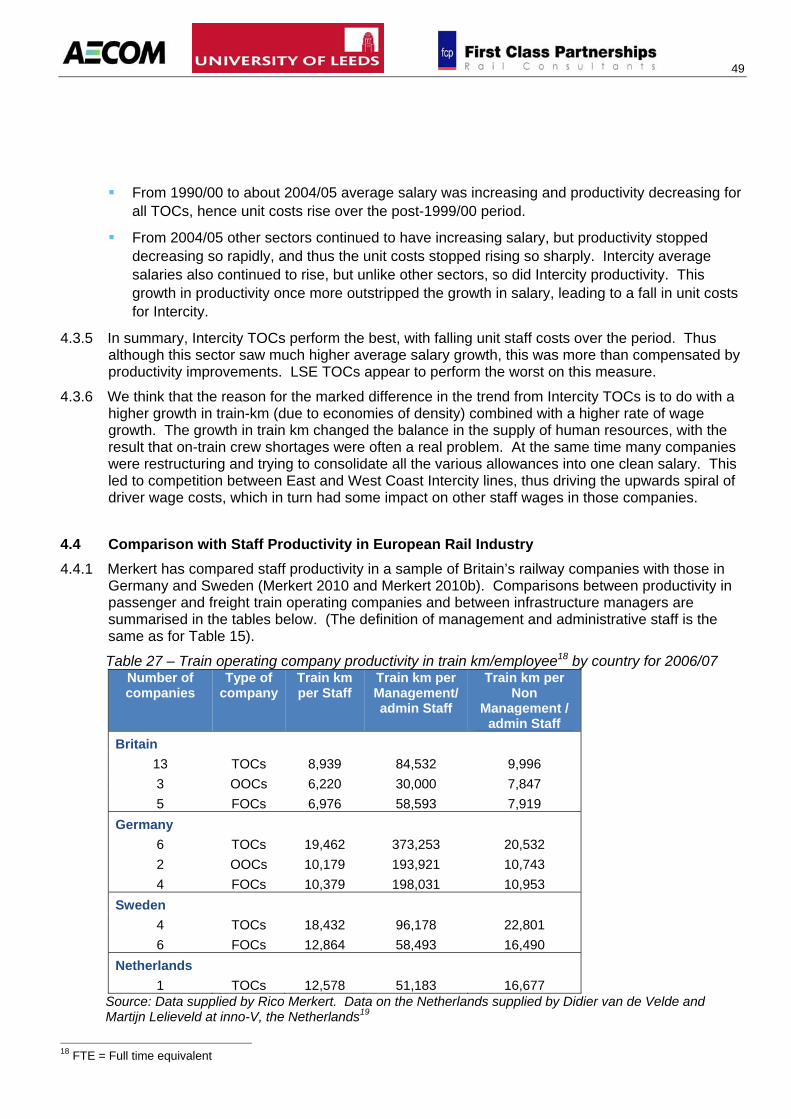
49
From 1990/00 to about 2004/05 average salary was increasing and productivity decreasing for all TOCs, hence unit costs rise over the post-1999/00 period.
From 2004/05 other sectors continued to have increasing salary, but productivity stopped decreasing so rapidly, and thus the unit costs stopped rising so sharply. Intercity average salaries also continued to rise, but unlike other sectors, so did Intercity productivity. This growth in productivity once more outstripped the growth in salary, leading to a fall in unit costs for Intercity.
4.3.5 In summary, Intercity TOCs perform the best, with falling unit staff costs over the period. Thus although this sector saw much higher average salary growth, this was more than compensated by productivity improvements. LSE TOCs appear to perform the worst on this measure.
4.3.6 We think that the reason for the marked difference in the trend from Intercity TOCs is to do with a higher growth in train-km (due to economies of density) combined with a higher rate of wage growth. The growth in train km changed the balance in the supply of human resources, with the result that on-train crew shortages were often a real problem. At the same time many companies were restructuring and trying to consolidate all the various allowances into one clean salary. This led to competition between East and West Coast Intercity lines, thus driving the upwards spiral of driver wage costs, which in turn had some impact on other staff wages in those companies.
4.4 Comparison with Staff Productivity in European Rail Industry 4.4.1 Merkert has compared staff productivity in a sample of Britain’s railway companies with those in
Germany and Sweden (Merkert 2010 and Merkert 2010b). Comparisons between productivity in passenger and freight train operating companies and between infrastructure managers are summarised in the tables below. (The definition of management and administrative staff is the same as for Table 15).
Table 27 – Train operating company productivity in train km/employee18 by country for 2006/07 Number of companies
Type of company
Train km per Staff
Train km per Management/admin Staff
Train km per Non
Management / admin Staff
Britain 13 TOCs 8,939 84,532 9,996 3 OOCs 6,220 30,000 7,847 5 FOCs 6,976 58,593 7,919
Germany 6 TOCs 19,462 373,253 20,532 2 OOCs 10,179 193,921 10,743 4 FOCs 10,379 198,031 10,953
Sweden 4 TOCs 18,432 96,178 22,801 6 FOCs 12,864 58,493 16,490
Netherlands 1 TOCs 12,578 51,183 16,677
Source: Data supplied by Rico Merkert. Data on the Netherlands supplied by Didier van de Velde and Martijn Lelieveld at inno-V, the Netherlands19
18 FTE = Full time equivalent

50
4.4.2 These comparisons show that overall train km per full time equivalent employees (FTEs) are
about 50% lower in Britain than in Germany, Sweden or the Netherlands. For management and administrative staff alone, train km per FTEs are three times lower than Germany but the same as in Sweden. Merkert notes that the figures for management and administrative staff in Germany may be high because of the help that DB subsidiaries receive from the holding company. Also it is possible that the definition of management staff and their responsibilities may differ between countries. However, these factors are unlikely to explain such large differences.
4.4.3 Table 27 also shows that open access passenger operators in Britain and Germany have fewer train km per staff (of all types) than franchised TOCs, presumably because open access passenger operators are small and lack economies of scale and buy in expertise as and when required (such as Hull Trains) or use centralised support services from larger owning groups (such as Wrexham and Shropshire). However overall Britain has fewer train km/FTE than Germany and this cannot be explained by the role of the DB holding company.
4.4.4 Merkert’s (2010) interviews supported the data by indicating that British TOC managing directors are spending far more time than their German and Swedish counterparts in dealing with interactions on train operations and infrastructure matters.
4.4.5 Turning to freight companies, a similar pattern emerges with Britain having nearly 50% less train km per staff than Germany and 80% less than Sweden but these may reflect the very different market and operating characteristics, particularly in Sweden.
4.4.6 Table 28 shows Network Rail has 14,482 train km per FTE compared to 26,772 for DB Netz, 19,944 for the Swedish infrastructure manager (Banverket now Trafikverket) and as many as 46,848 for the Netherlands. This may be due to differences in policies on contracting out maintenance and renewal and on mechanisation so it is therefore difficult to draw definite conclusions from these comparisons. The difference between Britain and Germany is even greater for management and administrative staff alone although for Sweden the ratio is almost the same as for Britain. This may be because, unlike DB Netz, Network Rail and Trafikverket are separate from ANY railway operator and therefore have to deal with more external actors than DB Netz - this is mainly the responsibility of management and administrative staff.
Table 28 – Infrastructure manager productivity in train km/employee20 by country for 2006/07 Country Number of
companies Train km per Staff
Train km per Management
Staff
Train km per Non
Management Staff
Britain 1 14,482 38,934 23,060 Germany 1 26,772 106,780 35,731 Sweden 1 19,944 44,321 36,262
Source: Data supplied by Rico Merkert.21
4.4.7 We have also compared productivity ratios and wage data based on “International Railway Statistics” (UIC, 2008 and 2009) which produces data on staff costs and staff numbers by company (infrastructure and train operators) from around the world. However, we are not very confident about the quality of the data.
19 Note that this analysis is based on a sample of 13 TOCs, and therefore gives slightly different results to analysis based on all franchised passenger TOCs, as reported in Table 25. 20 FTE = Full time equivalent 21 Note that this analysis is based on a sample of 13 TOCs, and therefore gives slightly different results to analysis based on all franchised passenger TOCs, as reported in Table 25.

51
4.4.8 Table 29 contains an analysis of UIC IRS for 2008 for Britain, Germany, Sweden, the Netherlands and also France, where infrastructure has been separated but liberalisation of markets is less advanced than in the other countries.
Table 29 – Staff numbers and productivity for selected European companies 2008 Staff numbers (FTEs) Train km / Staff
Country Company Train km m
Infra Transport operations Total Infra Transport
operations Total
GB ATOC 455 55,454 55,454 8,205 8,205 NR 494 36,039 36,039 13,707 13,707 Total GB 494 36,039 55,454 91,493 13,707 8,908 5,399 Germany DB 1043 47,606 73,069 120,675 21,909 14,274 8,643 France RFF 541 887 887 609,921 609,921 SNCF 541 53,159 94,483 147,642 10,177 5,726 3,664 Total Fr 541 54,046 94,483 148,529 10,010 5,726 3,642 Netherlands NS 131 7,821 7,821 16,750 16,750 Prorail 145 3,049 3,049 47,557 47,557 Total NL 145 3,049 7,821 10,870 47,557 18,540 13,339 Sweden Banverket 137 6,689 6,689 20,481 20,481 ASTOC 89 3,769 3,769 23,614 23,614 Total SE 137 6,689 3,769 10,458 20,481 36,349 13,100
Source: International Railway Statistics, UIC (2008)
4.4.9 Train km/infrastructure staff are lowest in France (10,010) followed by Britain (13,707) and then Germany and Sweden. The Netherlands has the highest productivity (47,557).
4.4.10 Train km/transport operator staff are far lower in Britain than in Germany, Sweden and the Netherlands but higher than in France. These figures differ from those in Table 27 but confirm that British TOCs are less efficient than all countries except France.
4.4.11 Table 30 compares operations staff per passenger km using data from the same source:
Table 30 – Operations staff numbers and passenger km per staff 2008 Country Company Transport
operations staff
(FTEs)
Passenger km m
Pass km per Transportation
Operations Staff
GB ATOC 55,454 50,710 914,452 Germany DB 73,069 76,929 1,052,827 France SNCF 94,483 86,664 917,244 Netherlands NS 7,821 15,513 1,983,506
Source: International Railway Statistics, UIC (2008)
4.4.12 This table shows that 0.9 million passenger km are carried per operations in Britain and France. 1 million are carried in Germany and 1.9 million in the Netherlands. Passenger km / transport operator member of staff is therefore less than half in Britain compared to the Netherlands.
4.4.13 The UIC data therefore shows that Britain compares unfavourably with Germany, Sweden and the Netherlands but not with France.
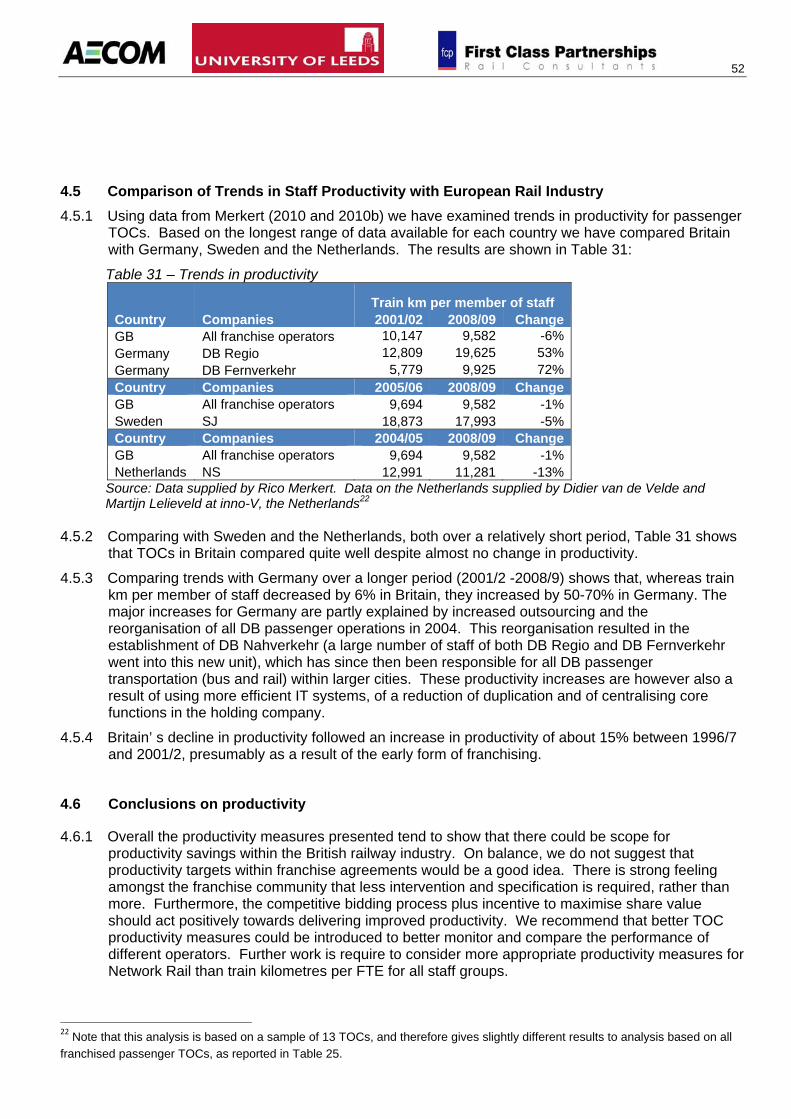
52
4.5 Comparison of Trends in Staff Productivity with European Rail Industry 4.5.1 Using data from Merkert (2010 and 2010b) we have examined trends in productivity for passenger
TOCs. Based on the longest range of data available for each country we have compared Britain with Germany, Sweden and the Netherlands. The results are shown in Table 31:
Table 31 – Trends in productivity
Train km per member of staff Country Companies 2001/02 2008/09 Change GB All franchise operators 10,147 9,582 -6% Germany DB Regio 12,809 19,625 53% Germany DB Fernverkehr 5,779 9,925 72% Country Companies 2005/06 2008/09 Change GB All franchise operators 9,694 9,582 -1% Sweden SJ 18,873 17,993 -5% Country Companies 2004/05 2008/09 Change GB All franchise operators 9,694 9,582 -1% Netherlands NS 12,991 11,281 -13%
Source: Data supplied by Rico Merkert. Data on the Netherlands supplied by Didier van de Velde and Martijn Lelieveld at inno-V, the Netherlands22
4.5.2 Comparing with Sweden and the Netherlands, both over a relatively short period, Table 31 shows
that TOCs in Britain compared quite well despite almost no change in productivity.
4.5.3 Comparing trends with Germany over a longer period (2001/2 -2008/9) shows that, whereas train km per member of staff decreased by 6% in Britain, they increased by 50-70% in Germany. The major increases for Germany are partly explained by increased outsourcing and the reorganisation of all DB passenger operations in 2004. This reorganisation resulted in the establishment of DB Nahverkehr (a large number of staff of both DB Regio and DB Fernverkehr went into this new unit), which has since then been responsible for all DB passenger transportation (bus and rail) within larger cities. These productivity increases are however also a result of using more efficient IT systems, of a reduction of duplication and of centralising core functions in the holding company.
4.5.4 Britain’ s decline in productivity followed an increase in productivity of about 15% between 1996/7 and 2001/2, presumably as a result of the early form of franchising.
4.6 Conclusions on productivity
4.6.1 Overall the productivity measures presented tend to show that there could be scope for productivity savings within the British railway industry. On balance, we do not suggest that productivity targets within franchise agreements would be a good idea. There is strong feeling amongst the franchise community that less intervention and specification is required, rather than more. Furthermore, the competitive bidding process plus incentive to maximise share value should act positively towards delivering improved productivity. We recommend that better TOC productivity measures could be introduced to better monitor and compare the performance of different operators. Further work is require to consider more appropriate productivity measures for Network Rail than train kilometres per FTE for all staff groups.
22 Note that this analysis is based on a sample of 13 TOCs, and therefore gives slightly different results to analysis based on all franchised passenger TOCs, as reported in Table 25.

53
4.6.2 We have examined sources of information for other regulated industries, but have not been able to find information specifically about salary levels or relating to staff specifically. Other industry information about productivity is not comparable to the railway sector, and would not provide us with anything comparable to railway staff.

54
5.1 Background 5.1.1 The Railway Industry is not unique within British industry in having a highly unionised employee
base. Nor is the UK any different to other European railways in having a highly unionised railway workforce. What does make it different, however, is the complex industry structure which seeks to combine the benefits of privatisation with the controls of a public service.
5.1.2 Many other UK companies and industries are also highly unionised and understand the benefits of spending time negotiating changes to terms and conditions to better align these with the requirements of the business. Such companies also, like the rail industry, understand the additional costs associated with agreeing to higher wages or improved terms and conditions that are the consequence of not taking on the risks and adverse effects of potential industrial action.
5.1.3 Since the period of privatisation, unlike other UK businesses, the current franchise structure appears to have given very little incentive for Train Operators (or indeed Network Rail) to engage seriously with the Trade Unions. Almost universally, the attitude has been that it will require full Government support to risk industrial action. TOCs argue that at typically £1m per strike day, the cost of industrial action will not be recoverable in any contemporary franchise term. As staff costs generally form only around 30% of total TOC costs, the marginal savings that can be achieved are not sufficiently high for Train Operators to take such action. Furthermore, the current design of money flows are also an inhibitor in that effectively the TOCs can ‘buy their way out of trouble’ and simply pass the costs back to Government.
5.1.4 Effective Trade Union action has meant that Unions have been able to exploit the fragmented and somewhat short-term interest of franchisees to the benefits of their members. This has strongly protected the pay and benefits of railway staff, but has not encouraged much opportunity for employee representatives to become engaged in any discussions about updating or reviewing terms and conditions to better fit with the requirements of the railway today.
5.1.5 Most of the comments we have heard during the course of this study have been antipathetic towards the unions. We have heard some anecdotal examples of Unions being ‘taken on’, but we have not heard any comments about the wish to engage or negotiate with the unions as a way to look for acceptable solutions for all parties. This seems to mainly be the result of a frustrated acceptance on the part of franchisees that delivering real and sustained changes and improvements have not been achieved up to this point and they cannot see what will alter this within the current environment.
5.1.6 What has struck us is the commonly expressed expert opinion that longer franchise terms will not in themselves incentivise TOCs or Owner Groups to tackle IR issues any more or less than current arrangements. The principal incentive to do so expressed universally during our research to be the absolute commitment of politicians to stand behind the industry in any dispute, both with political will and through sharing the revenue risk which operators would have to bear.
5.1.7 The other significant change which is used as a device in impeding any change to the IR landscape is the significant increase in the weight of safety procedures now attached to job responsibilities, post-Hatfield. This has also been exploited by the Unions as a tool to resist (for example) the introduction of new technology or reduced training times for safety critical roles.
5 Industrial Relations

55
5.2 Prospects for addressing state of current Industrial Relations 5.2.1 The general tone from the industry is a complaint that the Unions are too powerful. In fact, the
unions have been able to exploit the structure and approach of the industry over the last few years, to their advantage and understandably so as they are incentivised to do so. As would be expected, they are behaving to maximise the outcomes for their members. The fault (if there is one), is that the industry structure has made it fairly easy for them to do this.
5.2.2 The TOCs, Network Rail (and even FOCs to some degree), on the other hand have found the industry structure works against them being able to deliver sustained improvements in many areas. They have had to manage the impact of Unions comparing pay settlements or reduced working hours without importing huge corporate financial losses. This is not unique to the rail industry, but the structure and what is seen by franchisees as significant “political interference” is unusual and an added complexity.
5.2.3 Most of the comments relating to IR have been with a view to potential industrial action. We have not had any discussion about specific proposals that could be put to employees that might provoke such action. Understandably, the sensitivity of the subject makes it unlikely that employers would be prepared to discuss specific issues candidly with third parties. However, certain topics were referred to as having provoked industrial unrest to date. These include the wider use of Driver Only Operations (DOO), changes to pension arrangements (even for future employees) and changed roster patterns which improve alignment with business needs but are seen as detrimental to the work-life balance of employees. What was made very clear in our discussions with senior managers was that any action would require full Government support, including the financial support for franchisees when faced with strike action.
5.2.4 There is evidence that non-legacy organisations (such as Open Access operators and freight companies) have more flexibility to design terms and conditions to best meet the needs of their business. Staff are still Trade Union members, and they do not appear to earn less than other railway staff to any significant degree. However, there is some feedback to suggest that the relationship between employee and employer is more balanced by virtue of the new organisation having to take responsibility for this relationship, rather than inheriting it from a previous organisation, or having protection in place through the funding mechanisms. Indeed, it is the lack of DfT role in these businesses which are governed by their licences and financial self-sufficiency that promotes this different relationship between Staff, Management and the Trades Unions.
5.2.5 From the experience of the Open Access operator, the critical element of achieving real efficiencies in the industry (as opposed to cost cutting alone) relate to independence from DfT, flexibility of shift patterns and working practices that allow unnecessary wastage within the industry.
5.2.6 In general then, it appears that following a franchise replacement (which should be the opportunity to create efficiencies) the TUPE regulations, contracting arrangements and associated money-flows of the present industry structure, inadvertently provide for protections in terms of staff numbers and terms and conditions, effectively removing any incentives for Train Operators to make any serious attempt at restructuring employee costs.
5.2.7 The Trades Unions have tried to argue that some sort of national pay bargaining would make negotiations on pay and conditions smoother for all concerned. However, amongst the TOCs it is clear that this would not be welcome. First, it runs the risk of the Unions being able to find greater leverage for concerted industrial action across the whole industry. Second, some have expressed the view that such an approach would result in all wages being raised to the highest common denominator, and would not sensibly reflect the different employment market conditions and costs of living indices that do exist across the country.

56
5.2.8 It would be very unlikely that any meaningful calculations of the consequences of strikes can be quantified in advance of formal discussions with Employee representatives about the main areas of concern. As a first step, industry employers and funders should determine the areas of most concern in relation to the future viability of the industry, and devise a reasonable proposition to be discussed with the Trade Unions. These may include:
Driver only operation Rest day working Pensions Salary levels
5.2.9 Currently, there is a degree of variation in practice between TOCs in each of these areas.
Employers have responsibility to negotiate individually with Unions, and there are many different agreements in existence.
5.2.10 The DOO debate, and as well as overall staffing levels for different functions raises some interesting questions. The following table provides a breakdown of staff for the four TOCs who supplied a detailed breakdown of their staff by activity.
Table 32 – Proportion of TOC staff in different operational activities for various TOCs
TOC A TOC B TOC C TOC D TOC E TOC F TOC G TOC H TOC I TOC J TOC K TOC LDrivers 21% 26% 34% 23% 31% 32% 12% 26% 20% 26% 24% 18%Drivers Management 1% 2% 2% 1% 0% 0% 0% 0% 0% 0% 0% 0%Guards 14% 0% 27% 13% 23% 0% 8% 10% 0% 0% 12% 0%Guards Management 1% 0% 2% 0% 0% 0% 3% 0% 0% 0% 0% 0%Train Managers 0% 0% 0% 0% 0% 25% 0% 0% 14% 18% 0% 12%Catering Staff 9% 0% 0% 4% 0% 20% 26% 0% 10% 0% 0% 26%Catering Management 0% 0% 0% 0% 0% 0% 2% 0% 0% 0% 0% 0%Engineering Staff 17% 13% 1% 9% 0% 0% 16% 6% 0% 0% 0% 0%Depot Management 1% 1% 0% 2% 0% 0% 0% 3% 20% 13% 0% 0%Fleet Presentation 4% 8% 0% 5% 10% 0% 0% 0% 0% 0% 16% 0%Revenue Protection 2% 15% 2% 11% 0% 0% 0% 4% 2% 10% 8% 2%Control 1% 3% 3% 1% 0% 0% 0% 0% 0% 0% 0% 0%Production Support 0% 0% 0% 0% 0% 7% 0% 0% 1% 2% 4% 3%Station Management 1% 1% 1% 1% 0% 0% 0% 0% 0% 0% 0% 0%Booking Office 1% 0% 11% 2% 0% 0% 9% 0% 13% 22% 13% 12%Station Staff 19% 20% 5% 18% 1% 3% 14% 31% 1% 1% 13% 0%Platform Staff 0% 0% 0% 0% 9% 0% 0% 0% 10% 0% 0% 16%% Direct Operational Staff 92% 90% 89% 92% 74% 87% 89% 81% 90% 92% 91% 90% Source: From data provided by TOC Theme H returns
5.2.11 Percentages over 10% have been highlighted in green. What is interesting is that although TOC B has no Guards, a very substantial number are involved in revenue protection. TOC D has proportionally fewer guards than TOC C, but again has a high proportion of revenue protection staff. Also of note is the proportion of staff engaged at stations (or booking offices).
5.2.12 It must be recognised that the role of the guard does vary across the industry, and that therefore the savings to be gained by potentially moving to DOO have already been realised in many instances. More generally, best practise already applies in some areas of the industry, and therefore the benefits of taking action to spread such best practise will have limitations.
5.2.13 There is a strongly held view amongst some industry players that the Government should also look to change the current employment laws pertaining to strikes. The intention would not be to remove the rights of Unions and their members to take strike action but to achieve a rebalancing in this area. Most interviewees felt that strike action (or action short of a strike) should require a minimum of 51% of the balloted membership, not 51% of those who actually voted. However, a
57
small minority suggested that it would be more appropriate to make this 40% of the balloted population, in line with other employment law.
5.2.14 It is clear that there is strong support amongst all railway industry employers that some change is required. However, unless it is appropriate to amend primary legislation for all UK industry (as called for by the CBI recently), it may be that such an approach results in unnecessary industrial conflict in GB rail. Further investigation on the efficacy of this approach, balanced against the benefits of stronger political will to change the industrial relations landscape would be helpful.
5.2.15 Although there is little appetite for an industry-wide approach to negotiations on pay and conditions, our research shows a clear requirement for improved co-operation across the industry. Improving the leadership qualities, having a real understanding of the various component parts of GB Rail and shared strategies (without treading on commercial sensitivities) are seen as other mechanisms for better management of the industrial relations. Whether this should be achieved through a contractual framework to which all are tied, or an informal arrangement has not had a consistent view from our research. However, what is clear is that the current informal arrangements to share best practice and improve understanding of the wider industry (introduced by the ATOC/Network Rail Joint Board) have so far not been successful.
58
6.1 Franchise length 6.1.1 Franchise length is regularly cited as a contributory reason for TOCs not engaging fully in
industrial relations activities, and to explain lack of incentives for reducing costs or increasing investment in the industry by train operators. Other arguments for longer franchises also point to savings in franchise transactions costs, which are estimated to be around £20m per franchise re-let.
6.1.2 There is almost universal agreement across the top slice of the industry and across the interfaces that probably the single most compelling argument for longer franchises is the opportunity this would provide to rebuild efforts to create joint-working approaches and joint human resource capability and skills development. There is a widely held view that has been expressed by most we have interviewed, that one of the most significant pieces of ‘collateral damage’ from the privatisation model the UK adopted in the 1990s was the demolition of the BR Board’s approach to developing outstanding generalists; i.e. managers with insight into all aspects of the management of a railway by virtue of being required to migrate across the industry disciplines in the course of their management development. The current industry structure makes this almost impossible to achieve and there is a real risk that once the current crop of industry leaders move on (the last generation of those who went through the BR Board scheme) that their successors will be far more myopic in the managerial approach and outlook and hence further entrench the divisions, silos and exacerbate the associated costs and inefficiencies.
6.1.3 Further arguments relate to the difficulty in achieving staff attachment and loyalty to their employer, rather than seeing their Trades Union or the DfT as being the guardians of their careers and jobs. However, it must be borne in mind that most of these comments come from individuals who have a vested interest in seeing longer term franchises, and possibly a frustration that good ideas for introducing innovation and efficiency are genuinely being lost because of the existing franchise length.
6.1.4 Examples have been cited of short-term franchises that have delivered good value such as SWT, and the evidence does not seem to be conclusive either way. There seems to be consensus that longer term franchises require regular reviews with clear break options for Government in the case of poor performers – although little detail has been examined on how these reviews would take place, when effectively Government would be reviewing with a sole supplier who would (presumably) have the option to withdraw if terms were not favourable.
6.1.5 Overall, the arguments presented on franchise length do not seem to be critical in relation to incentivising franchisees to address cost saving initiatives. One exception seems to be for rolling stock, where the suggestion that longer franchises could result in different decisions being made on rolling stock procurement and leasing. Open Access operators such as Wrexham and Shropshire, Heathrow Express and in their early years Hull Trains, all had the confidence to procure their own rolling stock entirely at their own risk in part because of the length of licence terms offered and the sense that they are always likely to see licence renewal if they are delivering the network and economic benefits and customer satisfaction levels required by the Regulator under their licence conditions. First Group took the view that it was in their interests to acquire at their own financial risk, a fleet of diesel HST’s because they could anticipate a growing basket of UK rail interests including franchises that had 10 year term opportunity, albeit on a 7+3 basis. The evidence provided by our interviews clearly indicates that this practice would be far more prevalent if either franchise lengths were longer or Government was prepared to permit owner groups some protection by ensuring that privately financed fleets were designated to a franchise for a minimum term, even if they were not the franchise owner. This picture is supported by the large scale procurement of locos and wagons by the privatised freight operators, all achieved solely with the financial support of banks and shareholders, working towards the long term good of the business.
6 Franchising

59
6.1.6 Further comment has been made to suggest that longer term franchises would allow TOCs to take a longer term view on industry-wide issues. Again, it is not entirely clear why a longer franchises policy would make step changes to issues surrounding railway planning, and efficiency. There may be some behavioural changes resulting from longer franchises, but without other structural alterations in responsibilities and incentives, it is likely that these would only be marginal.
6.2 Franchising process 6.2.1 Discussions held in the course of our analysis with industry players do suggest that the franchising
process itself limits the freedom that operators have to deliver efficiency. The degree of specification within the franchise in particular is perceived as constraining the responsiveness of operators to deliver as efficiently as possible. Comments suggest that the older style franchise agreements offered greater incentive to Train Operators to perform better than the plan.
6.2.2 The franchising process also limits the ability of the franchising authority to specify industry wide solutions which might result in overall staff efficiency. Furthermore, there are some conflicting elements of franchise specification which could be said to distort the attempt to gain better efficiency. One example cited was a mid-term proposal to save franchise costs by reducing station staff, which was rejected by the DfT not because of safety or consumer concern but for the benign reason that this was not compliant with the franchise bid-plan.
6.2.3 Other comments have been made that the DfT is not interested in discussions about industrial relations and focus mainly on contractual issues. Effectively this means that until the franchise process is designed to address the underlying structural issues that need consideration within the industry, it will be very difficult to do anything about them, and almost certainly not without some additional cost on the public purse. Structural change through the franchising process would take a number of years to deliver, as not all franchises would be re-let simultaneously.
6.2.4 The reality of franchising is that any imperfections with incentives or behaviour of train operators are fixed at the point of franchise. Beyond then, Train Operators can be expected to behave rationally according to the terms of the contract to which they are committed and any discretion they have in relation to prevailing market conditions.
6.2.5 A firm and common view has been expressed by those we have interviewed that restructuring the DfT does not deal with the underlying inefficiencies of a franchise procurement that is effectively operated directly by Government. The proximity of procurement to Government is seen to fetter sound commercial logic with a level of political interference that detracts from both raw cost efficiency and the promotion of value for money. There is a view that although imperfect, the SRA was a more effective instrument in value creation because it was able to operate one level removed from politicians in promoting innovations that might not always be vote-catching but which undoubtedly delivered savings to the tax payer. An example of this was the SRA’s ability to tackle BTP staffing levels and shift more of the responsibility for station and train security to the private sector.
6.3 Franchise and industry structure 6.3.1 Most industry leaders we spoke to held similar views about changes required to the structure of
the rail industry. The main emphasis has been on the need to reduce the number of interfaces across the industry as these are seen as unnecessary and complex and result in unnecessarily slow decision making and the stifling of innovation.
60
6.3.2 Although no-one suggested that re-introducing vertical integration was a realistic approach, the current model is seen as importing increased risk in safety and human factors. Slimming down the amount of bureaucracy required by having a simpler structure would improve the risk management of these safety and human factors through allowing a sharper focus.
6.3.3 Although we have not been able to quantify the scales of headcount or costs to be saved, the widely held view from those we interviewed was that there should be one single regulatory and licensing body for the rail industry. This would lead to significant cost savings in bodies such as RSSB, DfT, ORR and ATOC. Within this single body would sit a smaller number of experts in all the required fields of safety, contract management, procurement, audit etc. improving decision making and efficiency. More work would be needed here, to quantify the potential scale of savings that could result from introducing such a structure, and to identify the benefits that would be lost by changing the existing structures.
6.4 Station staffing 6.4.1 It is a feature of an industry with large and complex geographic coverage, that considerable cost is
required to serve a very large number of smaller places. We have not been able to undertake a full analysis on the number of staff employed at small stations, although a sample provided by one TOC does highlight the large number of stations who employ 1 member of staff only.
6.4.2 It is worth pointing out that across the whole country the smallest 25% stations account for 0.7% of total trips and the smallest 50% account for 5% of trips23. Despite many examples of unstaffed stations across the network, there are many where staffing levels are driven by the presence of a booking office. In practice the presence of a single member of staff shut away in a booking office which is costly to maintain and operate may be offering poor value for money. It could be argued that investment in security and reassurance measures at stations and on trains such as centrally monitored cctv, help points, uncluttered, clean and secure station environments, automated ticket machines, PA, and travelling BTP covering trains and stations could provide a safer environment than a lightly manned retail presence. With the emergence in the market of new on-line retailers now with print at home and sms tickets, booking offices are no longer essential in many locations.
6.4.3 This is especially true where relatively low use stations are only staffed by a single booking clerk out of contact with the majority of station users. This issue recently came to the fore at LU as a result of a huge reduction in booking office transactions following oyster introduction, and we suggest it require further detailed consideration for the railway sector
23 Based on analysis of ORR stations data

61
7.1 Context 7.1.1 The challenge for implementing better Value for Money within the railway industry must be
considered within the context of the practical measures that can be taken to implement change, over a range of time frames, and the affordability and available budget to implement changes in the short to medium term. There are many projects, service specifications and even efficiency measures which could deliver excellent value for money, but may not be affordable. There have been examples in the past of franchise restructuring and reletting being abandoned, even though the transaction negotiated offered good value for money, because of affordability constraints.
7.1.2 Many of the measures that might be considered as a way of reducing long term cost or improving efficiency have an initial cost to deliver. These costs may not be affordable when prioritised alongside other Government initiatives. There is a real chance that long term cost saving measures are not deliverable due to short term affordability constraints. We set out some of these issues below.
7.2 Financial flows from costs saving measures 7.2.1 First, any cost saving measures a TOC takes to reduce its headcount, within the term of its
Franchise Agreement, will flow directly to the TOC, not to the DfT. This means that any TOC related cost savings can only be realised by the DfT at the point of refranchising. If Network Rail reduces its headcount, the benefit will be that it is more likely to achieve Regulatory spending targets. While this can then be taken into account in the next regulatory settlement, there is no short term benefit to the Exchequer. However, the regulatory review does provide a very strong opportunity to implement Government funding (and efficiency) targets for infrastructure provision. The challenge will be in ensuring the negotiation between required outputs and cost savings is optimised.
7.2.2 The mechanism of delivering cost and efficiency savings within Network Rail is effectively determined by the competency of the Network Rail as an organisation, and the effectiveness by which the ORR sets and regulates performance targets. We have found no evidence to suggest that the ORR is not doing this effectively, and any changes to arrangements would require legislation.
7.2.3 There has been some suggestion that the targets for Network Rail have not been set as stringently as they could have been. This has not been a directly relevant area for Theme H and we have not investigated the issues in detail. One reason for this could be the recognition that Network Rail is still developing a capability to be agile and responsive to the requirements of the regulatory review, and that imposing too stringent targets would impact on the longer term prospects of its capability as an organisation.
7.3 Salary levels 7.3.1 Salaries are widely believed to be too high in the UK rail industry. As we have seen in Chapter 1-
4, our investigations tend to corroborate this belief. It is important to understand the reasons for why this might have been happening. The conclusions we have drawn from the information we have gathered suggest the following main causes are as follows:
Lack of focus on wage restraint as part of the franchise process;
Lack of incentive on the part of franchisees to minimise staff costs;
Shortages in the market place, particularly in relation to specialist staff (which has lead to staff poaching);
7 Implementing changes

62
Desire to recruit the best staff; and
Full employment and recruiting difficulties in the South East.
7.4 Longer term efficiencies Stations
7.4.1 We have discussed earlier in Section 6 that there could be considerable opportunity to de-staff stations. Making significant savings in this area will require a full review of the levels of service required at stations by train operators. It is a question about the level and type of railway outputs that the taxpayers and passengers can afford and are prepared to pay for.
Driver Training 7.4.2 A further proposal that we would particularly advocate concerns driver training. It currently takes
in the order of 8 months to train a Driver, and a further 2 or 3 months until the Driver is truly in revenue earning work. Efforts have previously been made to reduce the training times, through increased use of technology (such as simulators), more effective classroom time and assessors signing the Driver fully competent instead of Driver self-assessment. However, these changes have been robustly rejected by the Trades Unions, citing the potential increased safety risks that would be imported.
7.4.3 There is clear evidence that the use by the Trades Unions of this safety card is being employed to slow down the driver training cycle times which thus in turn impedes the supply of new drivers into the system. The consequence of this is that since privatisation driver salary rates have increased out of proportion compared to other industry salary rises in the same period. The same is true for London Underground Drivers in the same period, where the base entry level salary is now £41K per annum. Driver salaries (and earnings) since privatisation have increased dramatically and a key contributing factor is the restricted supply of new drivers caused in part by driver training cycle times and which in turn distorts the market-price through activity such as driver poaching.
7.4.4 The costs associated with Driver training are also significant. Although trainees would be on reduced rates, the costs include almost 12 months pay, plus the costs of the trainers and assessors. Approximately 300 drivers are trained by the TOCs each year and costs per trainee are in the region of £60k. If the training time could be limited to the final 2 months of “live rail” route learning, the savings could be in the order of £13 m per annum.
7.4.5 It is well documented that airline pilots pay for their own training and in their own time and this approach should be considered for Driver training as a means of reducing industry costs. It would be viewed as a radical concept for the rail industry and seeking to introduce it would be met with some resistance both from the Trades Unions and also from some TOCs who have expressed a strong desire to train their own Drivers throughout, as a means of embedding their corporate culture and from the point of the initial hire.
7.4.6 Some investigation into the feasibility of this has already been done by a recognised rail industry driver training specialist and training supplier, and although much more analysis would be required to fully evaluate all the pros, cons, benefits and costs associated with this approach we highly recommend that this be looked at as a discrete work piece.

63
Civil Aviation Authority (2009), “Airline Personnel Costs (UK and Overseas)” http://www.caa.co.uk/docs/80/airline_data/2009Annual/Table_1_15_UK_Airline_Personnel_Employed_in_Great_Britain_2009.pdf
Inbucon Group (2008), “Network Rail: Employment Costs Efficiency Review”
Glaister (2004), “British Rail Privatisation – Competition Destroyed by Politics”
Merkert, R., (2009), “Changes in transaction costs over time – the case of franchised train operating firms in Great Britain”, 11th Conference on competition and ownership in land transport.
Merkert. R. (2010): An empirical study on the transaction sector within rail firms, Transportmetrica, (in press). Merkert, R. (2010b): Changes in transaction costs over time - The case of franchised train operating firms in Britain, Research in Transportation Economics 29, pp. 52-59. Smith, A.S.J., Wheat, P.E. and Nash, C.A. (2010), ‘Exploring the effects of Passenger Rail Franchising in Britain: Evidence from the First Two Rounds of Franchising (1997-2008)’, Research in Transportation Economics. Wheat, P.E. and Smith, A.S.J. (2010), Econometric Evidence on Train Operating Company Size.
8 References

64
Need Sdfsa
This Appendix contains the report prepared by Leeds ITS for this study. The contents have been amalgamated within the main body of this report.
9 Appendix A – University of Leeds Report

65
3.
Aggregate Level Analysis of Train Operating Company Average Salary
and Productivity Performance
Dr Andrew Smith, Professor Chris Nash and Jeremy Drew
6th October 2010
Project Funded by the Department for Transport and Office of Rail Regulation
Confidential
Institute for Transport Studies

Aggregate Level Analysis of Train Operating Company Average Salary and Productivity Performance 66
INSTITUTE FOR TRANSPORT STUDIES DOCUMENT CONTROL INFORMATION
Title Aggregate Level Analysis of Train Operating Company Average Salary and Productivity Performance
Authors Dr Andrew Smith, Professor Chris Nash and Jeremy Drew
Editor
Version Number
Date 6th October 2010
Distribution Confidential
Availability
File
Signature

Aggregate Level Analysis of Train Operating Company Average Salary and Productivity Performance 67
1. TABLE OF CONTENTS
1. Introduction ......................................................................................................................... 68
2. AVERAGE SALARY ANALYSIS ........................................................................................ 68
2.1 Average salary trends .............................................................................................. 68
2.2 Average salary levels ............................................................................................... 71
3. PRODUCTIVITY ANALYSIS .............................................................................................. 74
3.1 Unit cost analysis ..................................................................................................... 76
4. PREVIOUS EFFICIENCY FINDINGS FROM ECONOMETRIC WORK ............................ 78
5. OBSERVATIONS AND SUGGESTED FURTHER WORK ................................................ 80
REFERENCES .......................................................................................................................... 81

Aggregate Level Analysis of Train Operating Company Average Salary and Productivity Performance 68
1 INTRODUCTION
The Institute for Transport Studies (with AECOM and First Class Partnerships) has been commissioned by the Department for Transport and the Office of Rail Regulation to carry out an analysis of passenger train operating company average salaries and productivity levels since privatisation. This analysis is part of Theme H of the Value for Money Study.
This short note focuses on aggregate, TOC-level data that is available from the published statutory accounts. Separate work has been undertaken by AECOM and First Class Partnerships to get at more disaggregate information. The document is structured as follows. Section 2 covers average salary analysis. Section 3 covers analysis of labour productivity and unit staff costs. Section 4 reports the efficiency results coming out of previous econometric work carried out by ITS, based on total TOC costs (excluding access charges). Section 5 offers some observations in the context of previous evidence and suggests possible further work.
2 AVERAGE SALARY ANALYSIS
This section starts by looking at trends in average salaries over the period since privatisation, before turning to compare average salary levels.
2.1 Average salary trends Tables 1 and 2 show the changes in average salary costs for the TOC sector over the period since privatisation. The key finding from Tables 1 and 2 is that over the period since privatisation (1996/97-2008/09) TOC sector real average salary costs increased by 31% as compared to 15% growth in real average earnings for the economy as a whole over that period. This difference means that rail wages were going up by 1.1% per year above those in the economy as whole over this period. This “rail wage growth premium” exists for the whole period, but seems to have got bigger since 1999/00, with the exception of 2008/09 where it appears that rail real wages fell faster than average earnings.
There are a number of important caveats that should be noted here. First, general inflation (RPI growth) was high in 2008/09, and therefore the precise timing of pay rises could cause real wages to appear to fall faster than they are in practice. Second, there were a large number of franchise changes around 2007/08 and 2008/09. Whilst we have been careful to ensure a robust comparison, it remains possible that some distortions could enter the calculation if the FTE average figures have not been accurately calculated by the TOCs. Overall, however, we consider the data to be reasonably robust, and we note that the premium of rail average salary growth above average earnings growth prevails throughout the sample.
Third, the measure of average salary includes pension and social security costs and therefore the comparison with economy wide average earnings growth is not strictly valid. To the extent that social security and pension costs have increased over the period, our analysis may

Aggregate Level Analysis of Train Operating Company Average Salary and Productivity Performance 69
therefore give an overstated picture of relative wage growth. However, the maintenance of a very good pension scheme, whilst many private sector final salary schemes have been closed, is nevertheless a valuable benefit to rail industry staff. The data exists within most of the company accounts to split out pension costs and we therefore recommend that this is done in a subsequent phase of analysis. Some preliminary analysis of pension costs comparing 2003 and 2008/09 has been done and is included in section 2 of the main report.
Table 1: Real Average Salary Growth (1996/97 to 2008/09)
Average salary growth2007/08 2008/09 2007/08 2008/09 2008/09
All TOCs 34% 31% 23% 21% -2%Intercity* 40% 41% 33% 33% 0%LSE* 31% 27% 20% 16% -3%Regional* 30% 28% 17% 16% -1%Other* 36% 33% 25% 22% -2%Virgin TOCs 47% 34% 33% 22% -9%AEI 16% 15% 9% 7% -1%
1996/97 to 1999/00 to 2007/08 to
* The growth rates for Intercity, LSE and Regional are shown for those TOCs where boundary changes did not occur (to avoid distortions caused by TOC mergers). The Other TOC category covers the remainder of TOCs. Table 2: Real Average Salary CAGR (1996/97 to 2008/09)
Annual wage growth2007/08 2008/09 2007/08 2008/09 2008/09
All TOCs 2.7% 2.3% 2.6% 2.1% -1.9%Intercity* 3.1% 2.9% 3.6% 3.2% 0.2%LSE* 2.5% 2.0% 2.3% 1.7% -2.8%Regional* 2.4% 2.1% 2.0% 1.7% -1.2%Other* 2.8% 2.4% 2.8% 2.3% -2.0%Virgin 3.6% 2.5% 3.7% 2.2% -8.9%AEI 1.4% 1.2% 1.1% 0.8% -1.3%
1996/97 to 1999/00 to 2007/08 to
* The growth rates for Intercity, LSE and Regional are shown for those TOCs where boundary changes did not occur (to avoid distortions caused by TOC mergers). The Other TOC category covers the remainder of TOCs.
It is also clear that growth in wages for Intercity TOCs has been considerably higher than for other TOCs over the period. As we discuss in section 3, productivity growth for Intercity operators has also been higher over this period. LSE and regional TOCs have seen very similar growth in average salaries over the period of analysis. One explanation for the higher intercity wage growth may have been the higher train-km and passenger-km growth experienced by those TOCs. Competition between intercity operators (East Coast versus West Coast) to attract the very best staff may also have played a role.

Aggregate Level Analysis of Train Operating Company Average Salary and Productivity Performance 70
Table 3: Real Annual Average Salary Growth (1996/97 to 2008/09) – By Operator 1997/98 1998/99 1999/00 2000/01 2001/02 2002/03 2003/04 2004/05 2005/06 2006/07 2007/08 2008/09
Anglia 8% -9% -1% -1% -2% -1% 5%Cardiff/W&B/ATW 13% 6% 4% -3% 7% 7% 9% -5% 1% -4% 0% -1%Central Trains 9% -3% 0% 0% 1% 0% 8% 5% 1% 3% -2%Chiltern 6% 10% -8% 5% -2% 8% -5% 20% -2% 0% 1% 3%South Central / Southern 3% 4% 1% -2% 8% 4% 4% 2% 2% 1% 1% -3%South Eastern 0% 5% 3% 1% 4% 6% 19% -12% 3% 5% -1% 0%Cross Country 3% 7% -2% 15% -1% 1% -2% 9% 0% 0% -1% -13%Gatwick Express -1% 7% 7% 3% -4% 2% 2% 0% 3% 8% -4%Great Eastern 3% 2% 3% 4% 1% 2% 2%GNER 3% 3% 1% -5% 4% 6% 3% 2% 4% 5% 1% 20%Great Western 1% 4% 0% 12% 2% 10% 3% 5% 5% -5% 6% -4%Island LineLTS / c2c -7% 0% 4% 3% -6% 5% 8% 6% -3% 5% 7% -2%Merseyrail -1% 4% 6% 0% 1% 2% 4% 7% 1% 1% 0%Midland Main Line -2% -3% -7% 5% 5% 9% 4% 6% 1% 5% 7%North Western 1% 0% 9% -2% 5% 2% 5%Northern Sprit / Northern 7% 3% 5% -11% 10% 2% -1% 29% -20% 13% 0% -2%Scotrail 0% 9% 4% -2% 2% 3% 2% 10% 1% 0% 3% -1%Silverlink -2% 0% 2% 0% 1% 3% 3% 2% 1% 6% 11%South West Trains 17% -4% 3% -1% 1% 9% -1% 0% -1% -6% 8% -5%Thameslink / FCC 5% 1% -2% -2% 5% 5% 0% 3% -2% 17% -1% -5%Thames / FGW Link 5% 3% 3% 4% 0% 0% 6% 9% 2%WAGN 2% 1% -1% 7% -5% 4% 7% 15% -11%Wales /Wessex 3% 4% 4% -1% 5% 1% 11% -3% 2%West Coast 6% 8% -5% 13% 2% -4% 12% 8% -3% 4% 3% -7%Transpennine Express -1% 5% 0% 1%One -2% 2% 0% 4%East Midlands TrainsLondon MidlandLondon Overground
Average 4% 3% 2% 1% 3% 4% 5% 5% -2% 2% 2% -2%
Table 3 shows annual real average salary changes by operator for the whole period. This shows that there is some noise in the data from year to year, though we are reasonably confident in the trends over time. As noted earlier, the strong upward trend in average salaries is sector wide, though higher for Intercity TOCs. There is some evidence in Table 3 that the Virgin TOCs saw higher wage growth first, with other TOCs following, which is in line with anecdotal evidence from discussions with the industry. This data could form the starting point for suggestions for further analysis. For example, it may be possible to establish (statistically) a relationship between wage rate growth and the introduction of the 35 hour week.
One possible hypothesis is that those TOCs that ran into difficulty and were placed on temporary management or re-negotiated contracts may have seen higher average salary growth whilst on those arrangements. Previous evidence (e.g. Smith et. al. 2010 and Smith and Wheat 2009) has pointed to the substantial rise in costs / deterioration in total factor productivity across the TOC sector post-1999/00, as well as the deterioration in relative efficiency of those TOCs placed onto temporary management or re-negotiated contracts following financial distress. However, a wage rate variable was included in the model, so that the relative efficiency and general productivity findings are on top of any wage growth shown in Tables 1 and 2.

Aggregate Level Analysis of Train Operating Company Average Salary and Productivity Performance 71
It is therefore interesting to see whether TOCs on temporary contract arrangements had faster wage growth as well as deteriorating relative efficiency performance. Interestingly Table 4 below does not show any substantial difference between average salary growth for TOCs on temporary contracts as compared to the rest of the sector; although it does appear that average salaries were growing faster during the early years, which may have been one of the factors explaining the subsequent financial distress.
Table 4: Growth in Average Salary Costs by TOC-Type
1996/97- 1999/00- 1996/97-1999/00 2007/08 2007/08
All TOCs 8.9% 23.0% 34.0%"Problem" TOCs 9.6% 22.0% 33.7%Other 7.6% 24.3% 33.8%AEI 6.8% 8.9% 16.3%
2.2 Average salary levels Table 5 shows that Intercity TOCs have the highest average salaries in 2007/08 and 2008/09, followed by LSE and Regional. Recent modelling done for DfT confirmed this hierarchy, and would perhaps be expected. Interestingly, at privatisation Intercity operators started out at around the same level as LSE and then subsequently saw average salaries grow faster. There appears to be some substantial changes in the data in 2008/09 which may relate to franchise boundary changes. For example, Cross Country average salaries fall substantially.
Table 5 clearly shows variation in average salary levels between operators, but to some extent that would be expected given different mixes of staff and the different regions that the TOCs operate in. Within the TOC sector types, based on 2007/08 data, the variation between minimum and maximum average salary levels is 22%, 18%, 17% and 19% for Intercity, LSE, regional and other respectively. It is therefore not clear what these levels comparisons can tell us, without additional information, but they could form a useful starting point to investigate further.

Aggregate Level Analysis of Train Operating Company Average Salary and Productivity Performance 72
Table 5: Average Salary Costs by TOC 1996/97 2003/04 2004/05 2005/06 2006/07 2007/08 2008/09 Growth
1996/97 to 1996/97 to2007/08 2008/09
Pure ICCross Country 34,812 42,190 45,982 46,128 46,014 45,534 39,526 31% 14%GNER 28,234 32,712 33,470 34,823 36,668 37,094 44,447 31% 57%West Coast 29,753 39,981 43,118 41,926 43,417 44,841 41,921 51% 41%Midland Mainline (to 2007/08) 30,790 34,088 35,980 36,290 38,199 40,804 33%
29,878 37,191 39,391 39,533 40,974 41,968 42,218 40% 41%
Pure LSEChiltern 32,712 36,790 44,228 43,253 43,165 43,605 44,710 33% 37%South Central / Southern 29,831 36,658 37,257 38,074 38,341 38,688 37,707 30% 26%South Eastern 29,694 42,863 37,739 38,989 40,959 40,354 40,462 36% 36%LTS / c2c 31,330 32,883 34,746 33,774 35,508 38,074 37,160 22% 19%Silverlink (to 2007/08) 34,190 36,793 37,641 37,912 40,282 44,775 31%South West Trains 30,656 38,587 38,416 38,068 35,773 38,692 36,575 26% 19%Thameslink / FCC 31,456 35,080 36,303 35,757 41,912 41,658 39,672 32% 26%
30,586 38,339 37,937 38,223 38,835 40,001 38,576 31% 26%
Pure regional Cardiff/Wales and Borders/Arriva 26,181 40,009 38,073 38,282 36,906 36,875 36,341 41% 39%Central Trains (to 2007/08) 31,061 36,464 38,182 38,739 39,791 39,102 26%Gatwick Express 30,994 36,041 36,037 37,119 40,043 38,616 25%Merseyrail (to 2007/08) 26,344 30,581 32,708 33,073 33,253 33,336 27%Scotrail 26,342 31,060 34,299 34,561 34,422 35,362 35,157 34% 33%
27,994 34,199 35,912 36,243 36,221 36,408 35,539 30% 27%
Other TOCsAnglia 28,994 28,361Great Eastern 29,009 34,186Great Western 28,509 38,611 40,432 42,327 40,356 42,931 41,165 51% 44%North Western / First North Wes 28,228 34,132Northern Sprit / Northern 27,116 30,963 40,021 31,899 36,060 36,080 35,402 33% 31%Thames Trains First Great West 29,985 36,855 40,126 40,905WAGN 32,063 37,000 42,466 37,987Wales and West/Wessex 28,455 37,251 36,279 36,880Transpennine Express 41,191 40,612 42,726 42,692 43,020One 36,070 35,482 36,268 36,437 37,963East Midlands Trains 36,885London Midland 38,038London Overground 35,686
28,712 34,668 39,243 36,618 38,077 39,035 38,244 36% 33%
All operators 29,346 36,249 38,186 37,590 38,458 39,328 38,581 34% 31% An interesting further question concerns the impact of mergers on average salary levels. Anecdotal evidence suggests that mergers result in all staff being placed onto the highest salary / benefit levels of the merging operators, thus resulting in a substantial increase in average salary levels. Data for three mergers is shown in Tables 6-8.
For some of the mergers there appears to be some noise in the data around the franchise change over which is perhaps not surprising, given the problems of aggregating TOCs and producing a consistent time series around the time of mergers. This is the most likely explanation for the apparent fall in average salary for Northern from 2004/05 to 2005/06. In the case of the Greater Western franchise, by 2007/08 the merged TOC’s average salary had increased by 6.3% compared to the pre-merged position (2003/04), whereas total sector average salaries had increased by only 4.6% over that period. However, the position reverses

Aggregate Level Analysis of Train Operating Company Average Salary and Productivity Performance 73
itself in 2008/09, so the picture is not totally clear. On balance we have more confidence in the data to 2007/08 in part because inflation was lower prior to 2008/09, and in part because the 2008/09 data was included for the first time as part of this project and we have not had time to fully assess its quality.
Table 6: Average Salary Costs: Greater Western Merger / Franchise Changes Great Western merger 2002/03 2003/04 2004/05 2005/06 2006/07 2007/08 2008/09Great Western 37,508 38,611 40,432 42,327Thames Trains First Great Western Link 34,609 36,855 40,126 40,905Wales and West/Wessex 33,444 37,251 36,279 36,880Greater Western 40,356 42,931 41,165Weighted average by train-km 40,387Growth compared to weighted average in 2005/06 (cum) -0.1% 6.3% 1.9%TOC sector average wage growth (cum) 2.3% 4.6% 2.6% Table 7: Average Salary Costs: Northern / TPE Merger / Franchise Changes Northern merger 2002/03 2003/04 2004/05 2005/06 2006/07 2007/08 2008/09Arriva Trains Northern 31,149 30,963North Western 32,658 34,132Weighted average by train-km 32,269
Northern 40,021 31,899 36,060 36,080 35,402TPE 41,191 40,612 42,726 42,692 43,020Weighted average by train-km 40,305 33,905 37,744 37,798 37,431Growth compared to weighted average in 2003/04 (cum) 24.9% 5.1% 17.0% 17.1% 16.0%TOC sector average wage growth (cum) 5.3% 3.7% 6.1% 8.5% 6.4% Table 8: Average Salary Costs: ONE Merger / Franchise Changes ONE merger 2002/03 2003/04 2004/05 2005/06 2006/07 2007/08 2008/09Anglia 27,007 28,361Great Eastern 33,432 34,186WAGN (all) 34,645 37,000Weighted average 34,261
WAGN (GN) 42,466 37,987ONE 36,070 35,482 36,268 36,437 37,963Weighted average 37,860 36,176 36,268 36,437 37,963Growth compared to weighted average in 2003/04 (cum) 10.5% 5.6% 5.9% 6.4% 10.8%TOC sector average wage growth (cum) 5.3% 3.7% 6.1% 8.5% 6.4% The case seems clearer in the case of Northern / TPE, where average salary costs end up 16% higher in 2008/09 compared to the pre-merged position (2003/04), as compared to sector growth of only 6.4% over that period. There is some ambiguity concerning the ONE merger, with the 2007/08 and 2008/09 picture giving different answers. Overall, however, we consider that this brief analysis provides some weak evidence to suggest that franchise mergers have increased average salary costs.
The findings here are in line with those reported previously in Wheat and Smith (2010).
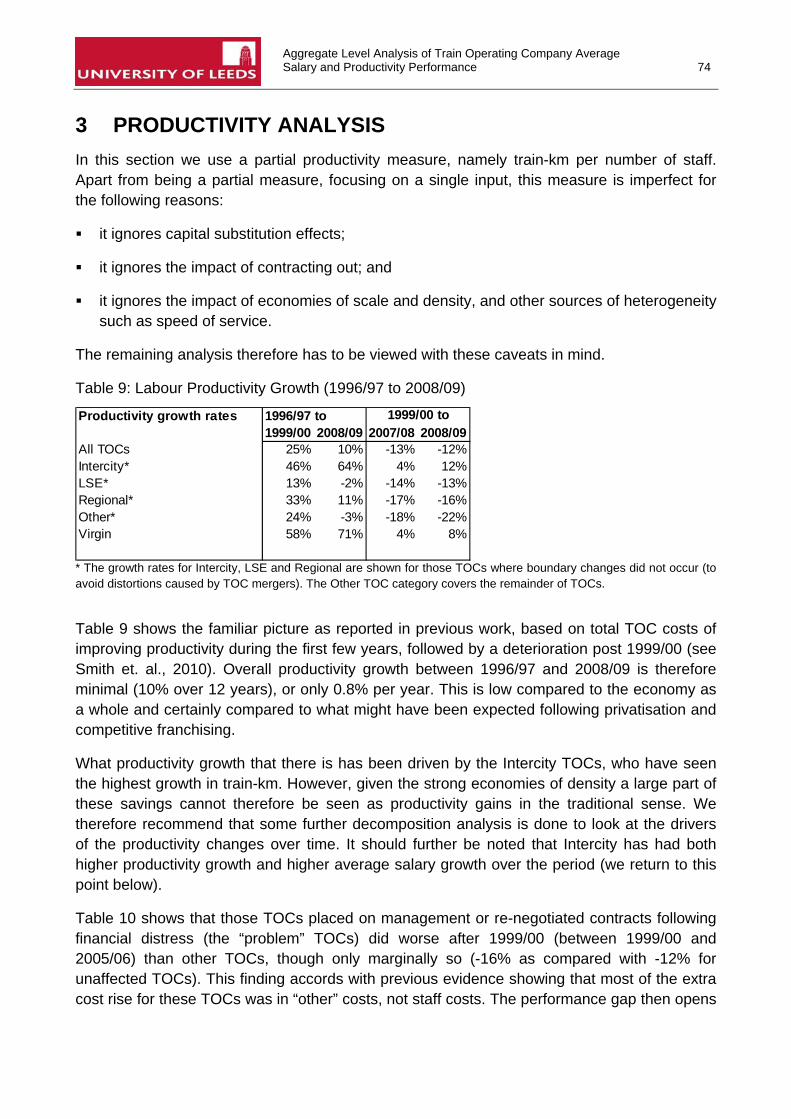
Aggregate Level Analysis of Train Operating Company Average Salary and Productivity Performance 74
3 PRODUCTIVITY ANALYSIS In this section we use a partial productivity measure, namely train-km per number of staff. Apart from being a partial measure, focusing on a single input, this measure is imperfect for the following reasons:
it ignores capital substitution effects;
it ignores the impact of contracting out; and
it ignores the impact of economies of scale and density, and other sources of heterogeneity such as speed of service.
The remaining analysis therefore has to be viewed with these caveats in mind.
Table 9: Labour Productivity Growth (1996/97 to 2008/09)
Productivity growth rates 1996/97 to1999/00 2008/09 2007/08 2008/09
All TOCs 25% 10% -13% -12%Intercity* 46% 64% 4% 12%LSE* 13% -2% -14% -13%Regional* 33% 11% -17% -16%Other* 24% -3% -18% -22%Virgin 58% 71% 4% 8%
1999/00 to
* The growth rates for Intercity, LSE and Regional are shown for those TOCs where boundary changes did not occur (to avoid distortions caused by TOC mergers). The Other TOC category covers the remainder of TOCs.
Table 9 shows the familiar picture as reported in previous work, based on total TOC costs of improving productivity during the first few years, followed by a deterioration post 1999/00 (see Smith et. al., 2010). Overall productivity growth between 1996/97 and 2008/09 is therefore minimal (10% over 12 years), or only 0.8% per year. This is low compared to the economy as a whole and certainly compared to what might have been expected following privatisation and competitive franchising.
What productivity growth that there is has been driven by the Intercity TOCs, who have seen the highest growth in train-km. However, given the strong economies of density a large part of these savings cannot therefore be seen as productivity gains in the traditional sense. We therefore recommend that some further decomposition analysis is done to look at the drivers of the productivity changes over time. It should further be noted that Intercity has had both higher productivity growth and higher average salary growth over the period (we return to this point below).
Table 10 shows that those TOCs placed on management or re-negotiated contracts following financial distress (the “problem” TOCs) did worse after 1999/00 (between 1999/00 and 2005/06) than other TOCs, though only marginally so (-16% as compared with -12% for unaffected TOCs). This finding accords with previous evidence showing that most of the extra cost rise for these TOCs was in “other” costs, not staff costs. The performance gap then opens

Aggregate Level Analysis of Train Operating Company Average Salary and Productivity Performance 75
up further by 2007/08, though by this stage most of the temporary contracts had been replaced following competitive re-franchising, so this finding seems surprising.
Table 10: Labour Productivity Growth (1996/97 to 2008/09) for “Problem” and Other TOCs
Productivity growth rates1999/00 2005/06 2007/08
All TOCs 25% -15% -13%"Problem" TOCs 31% -16% -17%Other TOCs 16% -12% -5%Virgin 58% -1% 4%
1999/00 to1996/97 to
Table 11 shows productivity levels by TOC. They are grouped by sector in order to strip out some of the heterogeneity between TOCs. However, as noted, these measures are aggregate, and will be affected by the proportions of different types of staff. For example, Cross Country which operates no stations (at least whilst operated by Virgin) has a much higher productivity level. The sector groupings do not remove all heterogeneity of course, and there remain differences between operators within the same sector.
Thus it is hard to make definitive judgements based on this data. Within the sectors, Cross Country stands out as having much higher productivity, though that may be explained (at least prior to 2008/09) by the fact that the company did not operate any stations. Excluding Cross-Country the variation in productivity between Intercity operators is around 27% based on 2007/08 data and 12% based on 2008/09 data. The variations within LSE and Regional are 48% (excluding Chiltern, which has a much higher productivity level) and 42% (excluding Merseyrail, which has much lower productivity) respectively.
The analysis therefore serves only to highlight areas for further investigation. Some decomposition analysis, to control for variation in train-speed, and economies of density for example could be attempted as further work.

Aggregate Level Analysis of Train Operating Company Average Salary and Productivity Performance 76
Table 11: Labour Productivity Levels (1996/97 to 2008/09)
1996/97 2003/04 2004/05 2005/06 2006/07 2007/08 2008/09
Pure ICCross Country 18,197 16,304 15,998 16,819 17,074 17,574 18,587GNER 5,906 6,228 6,082 6,228 6,582 7,311 8,304West Coast 4,778 5,962 6,858 8,262 8,352 8,736 9,318Midland Mainline (to 2007/08) 6,004 10,450 9,854 9,604 10,018 9,336
6,704 8,641 8,790 9,414 9,736 10,169 11,130
Pure LSEChiltern 17,113 11,943 11,969 11,510 12,268 12,683 13,598South Central / Southern 8,363 8,613 8,085 7,964 8,025 7,910 8,065South Eastern 7,307 10,277 8,232 7,904 7,885 7,975 8,098LTS / c2c 8,969 9,534 10,157 10,630 10,628 11,448 11,193Silverlink (to 2007/08) 9,258 9,117 7,847 7,692 8,127 8,541South West Trains 8,926 7,398 7,330 7,537 7,749 7,961 8,399Thameslink / FCC 20,759 13,964 12,711 12,318 11,863 11,764 10,743
9,042 9,063 8,366 8,304 8,649 8,776 8,893
Pure regional Cardiff/Wales and Borders/ATW 9,311 12,263 11,093 11,017 10,696 10,925 11,232Central Trains (to 2007/08) 10,976 13,190 12,159 12,422 12,898 12,170Gatwick Express 7,251 7,352 7,148 7,537 8,288 8,562Merseyrail (to 2007/08) 5,146 5,421 5,241 5,155 5,074 5,150Scotrail 8,743 11,420 10,735 10,041 9,451 9,388 9,274
8,895 11,109 10,377 10,171 9,974 9,846 9,905
Other TOCsAnglia 8,818 10,384Great Eastern 8,140 10,789Great Western 5,516 6,488 6,595 6,536 9,368 9,022 8,588North Western / FNW 8,766 10,406Northern Sprit / Northern 11,443 11,306 10,528 9,582 9,259 9,287 9,468Thames Trains First GWLINK 11,598 13,792 14,083 13,166WAGN 11,540 11,362 10,809 10,882Wales and West/Wessex 14,295 13,065 12,506 12,460Transpennine Express 15,527 13,480 14,259 14,848 15,330One 10,242 10,294 10,400 10,338 10,123East Midlands Trains 10,028London Midland 8,081London Overground 4,499
9,673 10,429 10,427 9,959 9,947 9,861 9,346
Whole sector 8,792 9,770 9,424 9,354 9,459 9,529 9,650
3.1 Unit cost analysis
The data below is based on unit staff costs, defined as staff costs divided by train-km. This measure therefore captures both changes in average salaries and labour productivity. It shows that over the period since privatisation unit staff costs have risen by 20%, since average salary growth has far outstripped labour productivity growth.
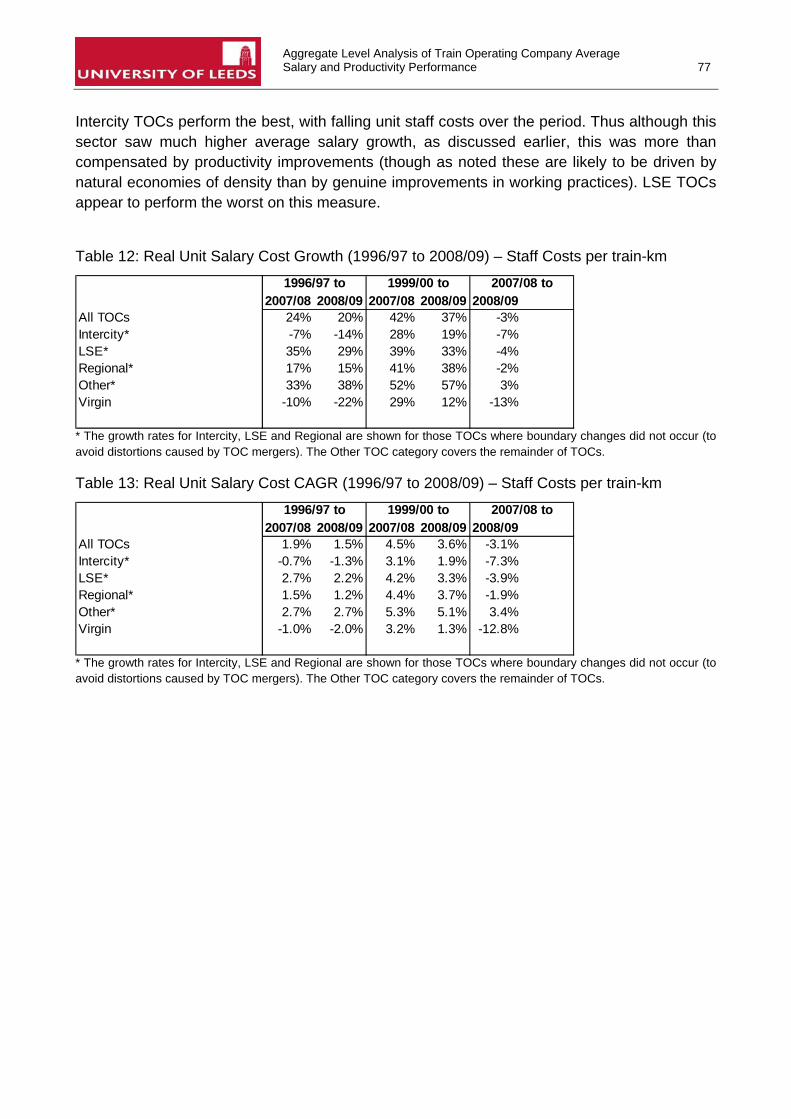
Aggregate Level Analysis of Train Operating Company Average Salary and Productivity Performance 77
Intercity TOCs perform the best, with falling unit staff costs over the period. Thus although this sector saw much higher average salary growth, as discussed earlier, this was more than compensated by productivity improvements (though as noted these are likely to be driven by natural economies of density than by genuine improvements in working practices). LSE TOCs appear to perform the worst on this measure.
Table 12: Real Unit Salary Cost Growth (1996/97 to 2008/09) – Staff Costs per train-km
2007/08 2008/09 2007/08 2008/09 2008/09All TOCs 24% 20% 42% 37% -3%Intercity* -7% -14% 28% 19% -7%LSE* 35% 29% 39% 33% -4%Regional* 17% 15% 41% 38% -2%Other* 33% 38% 52% 57% 3%Virgin -10% -22% 29% 12% -13%
1996/97 to 1999/00 to 2007/08 to
* The growth rates for Intercity, LSE and Regional are shown for those TOCs where boundary changes did not occur (to avoid distortions caused by TOC mergers). The Other TOC category covers the remainder of TOCs.
Table 13: Real Unit Salary Cost CAGR (1996/97 to 2008/09) – Staff Costs per train-km
2007/08 2008/09 2007/08 2008/09 2008/09All TOCs 1.9% 1.5% 4.5% 3.6% -3.1%Intercity* -0.7% -1.3% 3.1% 1.9% -7.3%LSE* 2.7% 2.2% 4.2% 3.3% -3.9%Regional* 1.5% 1.2% 4.4% 3.7% -1.9%Other* 2.7% 2.7% 5.3% 5.1% 3.4%Virgin -1.0% -2.0% 3.2% 1.3% -12.8%
1996/97 to 1999/00 to 2007/08 to
* The growth rates for Intercity, LSE and Regional are shown for those TOCs where boundary changes did not occur (to avoid distortions caused by TOC mergers). The Other TOC category covers the remainder of TOCs.

Aggregate Level Analysis of Train Operating Company Average Salary and Productivity Performance 78
4 PREVIOUS EFFICIENCY FINDINGS FROM ECONOMETRIC WORK
In section 3 we noted a number of caveats concerning the use of labour productivity measures to draw conclusions about sector performance. In previous work, the most recent of which is Wheat and Smith (2010), an attempt was made to obtain more satisfactory measures of relative performance. This was based on estimating a cost frontier, with allows cost differences due in scale and density, wage rates, sector-type and other variables (including train-speed) to be accounted for before arriving at an efficiency score. The work was also based on total TOC costs (excluding access charges), so offers a fuller and more satisfactory assessment of relative efficiency. Of course, as with any model, there may be other factors impacting on efficiency which have not been taken into account (this is discussed further below).
Table 14: TOC Efficiency Rankings from ITS Econometric Model
TOC Year Efficiency ScoreTOC 1 2007/08 1.000TOC 2 2007/08 0.991TOC 3 2007/08 0.983TOC 4 2007/08 0.937TOC 5 2007/08 0.915TOC 6 2007/08 0.913TOC 7 2007/08 0.912TOC 8 2007/08 0.912TOC 9 2007/08 0.899TOC 10 2007/08 0.893TOC 11 2007/08 0.890TOC 12 2007/08 0.873TOC 13 2007/08 0.865TOC 14 2007/08 0.863TOC 15 2007/08 0.838TOC 16 2007/08 0.781TOC 17 2007/08 0.722TOC 18 2007/08 0.681TOC 19 2007/08 0.657TOC 20 2007/08 0.574
The TOC rankings are shown in Table 14. Note that an efficiency score of one means that the firm is efficient (on the efficient frontier). Efficiency scores of less than unity indicate inefficiency. For example, an efficiency score of 0.70 implies that the firm should be able to reduce costs by 30% (1-0.70), holding all outputs constant, if it adopted industry best practice. This analysis uses confidential speed data provided by DfT, but we obtained permission to use

Aggregate Level Analysis of Train Operating Company Average Salary and Productivity Performance 79
it for previous work. However, the rankings of individual TOCs should not be made public without further permission from either and/ or DfT and the TOCs themselves.
The variables included in the econometric model are as follows24:
Route-km
Train density (train-km per route-km)
Train length
Train speed
Passenger-km
Average salary
Dummy variable reflecting the introduction of a 35-hour week
Number of stations operated
Dummy variable for sector type
Dummy variables to reflect contract type (e.g. management contract) – though any effects of these dummies are counted as inefficiency in the results
Time trend variables to capture frontier shift over time
The model thus takes account of a wide range of factors that should capture genuine heterogeneity between TOCs. Importantly it includes train speed which as far as we are aware is the first time this important measure has been included in an econometric model of train costs. Efficiency scores are computed after taking account of these factors (with the exception of the contract dummies, the effects of which are included in the measure of efficiency). Thus we should be reasonably confident in the resulting efficiency scores from this model.
As with any model, however, there are some variables that are not included which could distort the results. Diesel and electricity prices are not included due to lack of data. Variables reflecting different types of rolling stock (age and characteristics) are not included, although to some extent the variables included should pick up such effects, and also where we did try to include such variables they produced counterintuitive parameter estimates, but did not affect the efficiency scores greatly. Measures of output quality, such as TOC-caused delays are also not included, though potentially they could be now as we have the data. Likewise, other measures such as safety are not included, though these would be more problematic to include. A more sophisticated station variable (currently this is just number of stations, irrespective of size) would be a potential enhancement to the model.
24 These are expressed in logs (with the exception of stations operated) and for some variables second order terms are also included to permit additional flexibility in the functional form.

Aggregate Level Analysis of Train Operating Company Average Salary and Productivity Performance 80
That said, the TOC ranking in Table 14 is the best information that exists, to our knowledge on relative TOC rankings. The rankings do differ to some extent to previous work published by ITS (analysis going up to 2005/06), but the results shown here include the important train speed variable for the first time, and also extend to 2007/08, by which time the sector had seen competitive re-franchising, so the negative effects of management contracts should be starting to reduce.
Of course, in a sector governed not by economic regulation, but by competitive franchising, and with franchise agreements now in place for a number of years, there is a question as to what can really be done with Table 14 from a policy perspective. However, if government wants to take a more interventionist role, even within the current franchise agreements, perhaps via re-negotiation, Table 14 does form a starting point for further investigation. In any case, it will be interesting to see whether there is convergence in performance over the coming years following the first round of re-franchising.
5 OBSERVATIONS AND SUGGESTED FURTHER WORK
It is clear from the analysis shown in this paper and from previous econometric work (e.g. Smith et. al., 2010) that the TOC sector has not delivered the kind of productivity gains achieved in other privatised industries in the UK and elsewhere. Whilst there were some early costs savings, Smith et. al. (2010) find that these were later reversed; and that between 1996/97 and 2005/06, total factor productivity was largely unchanged. Taking into account rises in real wage, the authors find that the real cost of providing a given rail service was 12% higher in 2005/06 than at privatisation.
Based on updated data to 2007/08 the authors found some signs that costs were starting to fall following competitive re-franchising. The econometric model presented in Wheat and Smith (2010) incorporated a train-speed variable for the first time and also updated the sample to 2007/08. On this basis a ranking of TOCs was produced (shown in Table 14) that takes account of scale and density effects, sector-type, wage rates and train-speed amongst others.
One puzzle in the previous evidence is the fact that much of the post-1999/00 cost growth was in other costs. Hence it is interesting to look at the evidence on staff costs and productivity alone as we have done here. The analysis in this note, based on staff costs, wages and productivity, largely supports the previous evidence of early improvements in productivity, followed by a deterioration. However, we find that overall labour productivity is higher in 2008/09 (and in 2005/06) than at privatisation in contrast to previous evidence which showed that total factor productivity was the same in 2005/06 as in 1996/97.
Our analysis has also shed light on the different productivity and average salary trends experienced by the different sectors, and also individual TOCs. It is clear that Intercity has seen very different trends (overall, being more benign) than Regional and in turn LSE. There are also substantial differences in productivity and to some extent average salary costs between operators even within the same sector, although all the above caveats about

Aggregate Level Analysis of Train Operating Company Average Salary and Productivity Performance 81
interpreting these numbers apply. We suggest that these comparisons form the basis for further investigation rather than being an end in themselves.
Perhaps the most important trend, however, is the substantial rise in average salary costs over the period, consistently outstripping growth in the average earnings index. Finding ways of addressing this issue is therefore clearly a high priority.
We suggest a number of possible areas for further work:
Investigation of the impact of the 35-hour working week on average salaries and productivity. Potentially this could be done statistically;
Stripping out national insurance and pension costs from the average salary measure to look at the contribution of each component;
Decomposing labour productivity growth to take account of, for example, scale and density effects (and potentially doing a similar analysis across TOCs as well);
Further analysis of mergers and their impact on average salary levels;
Updating the econometric TOC cost model (which runs to 2007/08) to include the most up-to-date data, and thus derive an up-to-date firm efficiency ranking.
More generally there is a need for further, expert input to offer interpretation and suggestions for further analysis.
REFERENCES
Smith, A.S.J., Wheat, P.E. and Nash, C.A. (2010), ‘Exploring the effects of Passenger Rail Franchising in Britain: Evidence from the First Two Rounds of Franchising (1997-2008)’, Research in Transportation Economics.
Wheat, P.E. and Smith, A.S.J. (2010), Econometric Evidence on Train Operating Company Size.
3.