aci materials journal technical paper analysis of
TRANSCRIPT
ACIMaterialsJournal/September-October1998 617
ACI Materials Journal , V. 95, No. 5, September-October 1998.Received June 23, 1997, and reviewed under Institute publication policies. Copy-
right 1998, American Concrete Institute. All rights reserved, including the makingof copies unless permission is obtained from the copyright proprietors. Pertinent dis-cussion will be published in the July-August 1999 ACI Materials Journal if receivedby April 1, 1999.
ACI MATERIALS JOURNAL TECHNICAL PAPER
This paper presents the results of experimental studies of the micromechan-
ical behavior of concrete under different loading conditions. Cylindricalspecimens of normal- and high-strength concrete were tested under uniax-ial and confined compression. Cracks and pores in the concrete specimens
were impregnated with an alloy that has a low melting point. At the stressof interest, this alloy was solidified to preserve the stress-induced microc-racks as they exist under load and images from the cross sections of the
concrete specimens obtained using scanning electron microscopy (SEM).Stereological analysis that interprets three-dimensional structures bymeans of two-dimensional sections was used on the computerized images
to determine the density, orientation, and branching of the compressivestress-induced microcracks and the effect of confinement on microcrackbehavior. The density and branching of the microcracks decreased as the
confining stress increased. The confining stress had a pronounced influ-ence on microcracks in the interfacial transition zone (ITZ) between thecement paste and aggregate. The amount of interfacial cracking decreased
significantly as the confining stress was increased. Under uniaxial com-pression there were significant differences in the crack patterns observed innormal- and high-strength concretes. Under confined conditions the two
types of concrete had similar microcrack patterns.
Keywords: compressive stress-induced microcracks; concrete; confine-
ment; image analysis; interfacial transition zone; microcrack branching;microcracks; scanning electron microscopy; stereology; Wood’s metal.
RESEARCH SIGNIFICANCEA special experimental technique has been developed to
preserve compressive stress-induced microcracks in con-crete as they exist under applied loads, subjected to variousloading conditions. Several aspects of crack behavior underload as a function of confinement have been investigated.
INTRODUCTIONConcrete is a heterogeneous, multiphase material. On a
macroscopic scale it is a mixture of cement paste and fineand coarse aggregates, with a range of sizes and shapes. Ona microscopic scale the cement paste itself is found to be het-erogeneous, consisting of unreacted cores of cement grains,crystalline and amorphous hydration products, and porosity.
With regard to its mechanical behavior, concrete is oftenconsidered to be a three-phase composite structure, consist-ing of aggregate particles dispersed in a matrix of cementpaste and the transition zone which represents the interfacialregion between the particles of coarse aggregate and the
hydrated cement paste. The microstructure of cement pastein the vicinity of aggregate particles differs from that of thebulk paste. Many aspects of concrete behavior under stresscan be explained by the characteristics and behavior of thecement paste-aggregate interfacial zone. This transitionzone, typically 10 to 50 µm thick, is generally weaker thaneither of the two main components of concrete, and it there-fore has a disproportionate influence on the mechanical be-havior of concrete compared to its size.
Since the 1920s, researchers have suggested and assumedthe existence of different kinds of defects called microcracksthat occur in concrete.1-5 However, only since the early1960s have such cracks been observed, measured, and char-acterized in the interior of the system.6-9 In the 1970s and1980s the development of nonlinear fracture mechanicsmodels enabled the structure and behavior of concrete to betaken into account. In the 1980s and 1990s, further researchhas led to the increasingly common application of fracturemechanics in the design of beams, anchorage, and largedams. In spite of this, the theory of fracture mechanics inconcrete is not yet as mature as continuum theories, such aselasticity, viscoelasticity, and thermal problems. This is inpart due to the limited understanding of the formation andpropagation of microcracks in concrete.
Several methods have been used to study the microcrack-ing of concrete. These include acoustic emission,2,3,10-12 son-ic testing,13,14 microscope technique with dye,8,9 mercuryintrusion porosimetry,15 x-ray technique,16-19 optical andelectron microscopy computerized tomography analysis,20
and holographic interferometry.21-23 Some of these tech-niques cannot make adequate observations over large areas,are limited in their resolution, or are not sensitive in detect-ing cracks. Other methods cannot examine the specimenswhile they are under load, or, in some cases, require special
Title no. 95-M60
Analysis of Compressive Stress-Induced Cracks in Concrete
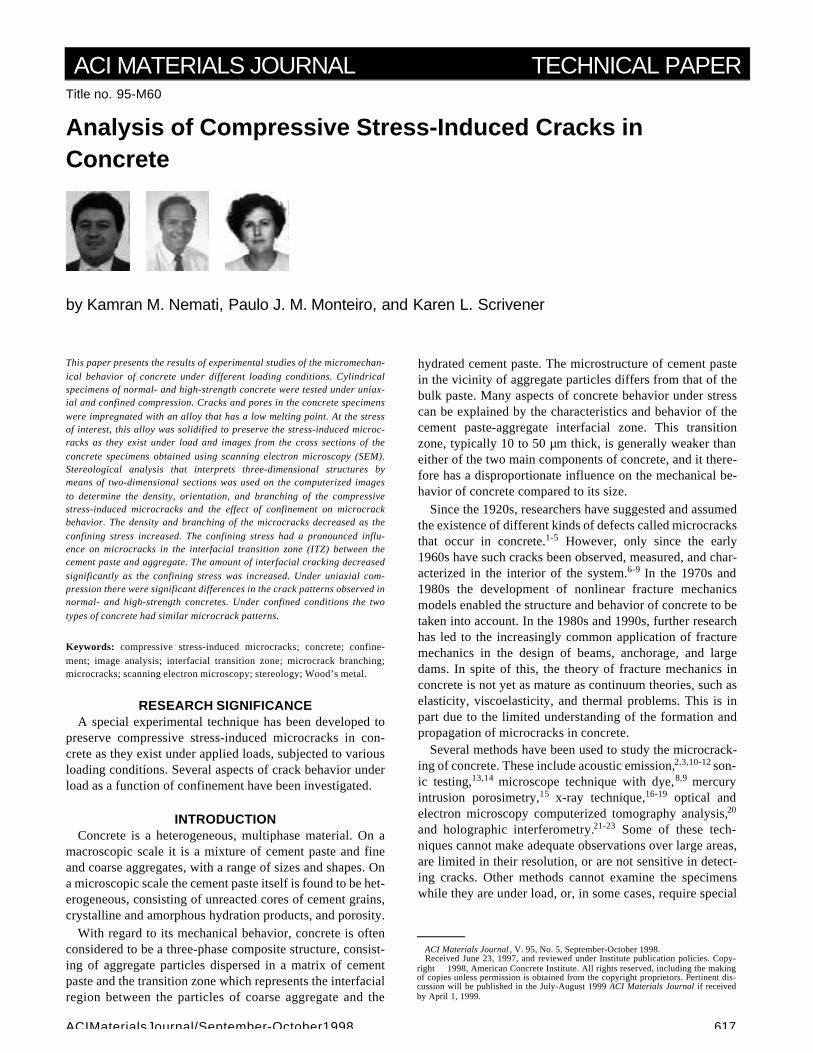
by Kamran M. Nemati, Paulo J. M. Monteiro, and Karen L. Scrivener
ACI Materials Journal/September-October1998618
Author Bio statement appears in this box. The first paragraph in the box should usethe format BiographyLA to insert a 20 pica line abovethe box, and the last paragraphshould be assigned style BiographyLB so that a 20 pica line is niserted below the line.
Author Bio statement appears in this box. The first paragraph in the box should usethe format BiographyLA to insert a 20 pica line abovethe box, and the last paragraphshould be assigned style BiographyLB so that a 20 pica line is niserted below the line
Author Bio statement appears in this box. The first paragraph in the box should usethe format BiographyLA to insert a 20 pica line abovethe box, and the last paragraphshould be assigned style BiographyLB so that a 20 pica line is niserted below the line
preparation of the specimen, which can alter the behavior ofthe material. The experimental technique described in thispaper involves the application of an alloy, called Wood’smetal, in the liquid phase, which makes possible the preser-vation of the microstructure of stress-induced microcracks inconcrete as they exist under load.
Wood’s metal has been used in the past few years to deter-mine the microstructure of different materials: for example,to study the porosimetry and to measure contact areas andvoids between the surfaces of natural fractures,24 to study thefracture of rocks,25 and to fill voids and microcracks in clas-tic rock specimens during loading and solidified it before un-loading to preserve the microstructure in specimens underload.26
Wood’s metal, which has a melting point below the boil-ing point of water, is used in conjunction with scanning elec-tron microscopy (SEM) and allows the detailed observationof microcracks in concrete as they exist under load. The con-cept of stereology, which deals with the interpretation ofthree-dimensional structures by means of their two-dimen-sional sections, can be applied to analyze the SEM images.Stroeven,27-30 Ringot,31 and Massat et al.32 successfully ap-plied the concept of stereology to study micromechanical as-pects of concrete. With the advent of modern image analysissystems, it is now possible to perform stereological analysison a great number of images accurately and expeditiously.
This investigation tested concrete cylinders of normal- andof high-strength concrete in compression with various de-grees of lateral confinement. While under load, the speci-mens were impregnated with Wood’s metal to preserve theinduced cracks. After the metal solidified, sections were cutfrom the specimens and examined in a scanning electron mi-croscope. Image analysis and stereology were used to char-acterize the quantity and distribution of cracks. Theobjectives were to determine the shapes and geometry ofstress-induced microcracks as they exist under load and toassess how the density, length, orientation, localization andbehavior of microcracks depend upon the concrete type andconfining stresses.
EXPERIMENTAL TECHNIQUEThe test equipment created to preserve the cracks under
applied load is described in detail elsewhere.33-38
Five normal-strength and three high-strength concrete cyl-inders, 8 in. (203 mm) long by 4 in. (102 mm) in diameter,were cast with the mix designs shown in Table 1. The cylin-ders were cured for about one year in 100 percent humidityand a temperature of 23 C.
The concrete cylinder ends were ground parallel to one an-other. Water was used as the cooling fluid during cutting andgrinding. The confining stress used to generate triaxial com-pression was supplied by stainless steel wires, 0.041 in. (0.3mm) in diameter, that were wound around the concrete cyl-inders at a pre-tension of 130 kN (150 lbf). In the partiallyconfined case the wire was wound one third of the way fromeach end at a pitch of winding of 4 pitches/cm (10 pitches/in.) for Experiment No. 3, at a pitch of winding of 8 pitches/cm (20 pitches/in.) for Experiment No. 4, and along the en-tire length at a pitch of winding of 8 pitches/cm (20 pitches/in.) in the fully confined case. Fig. 1 represents the normal-strength concrete specimens used in Experiments 1 through5. The high-strength concrete specimens used in Experi-ments 6, 7, and 8 resemble the specimens used in Experi-mens 1, 2, and 3, respectively.
Wood’s metal is a fusible alloy, that is solid at room tem-perature, with a melting range from 160 to 190 F (71.1 to87.8 C). In the liquid phase it is nonwetting, with an effectivesurface tension of about 400 mN/m.24 It consists of 42.5 per-cent bismuth (Bi), 37.7 percent lead (Pb), 11.3 percent tin(Sn), and 8.5 percent cadmium (Cd). Wood’s metal has aYoung's modulus of 9.7 GPa, a density of 9.4 g/cm3, anddoes not go through any volume change during hardening.The advantage of such an alloy is that it can be intruded intovoids and stress-induced microcracks while the specimen isheld at the desired stress level and then solidified to preserve
ACI member Kamran M. Nemati is a postdoctoral research fellow at the University ofCalifornia at Berkeley, and will assume an associate professor position at the Univer-sity of Washington in Seattle beginning September 1998. He received his PhD in civilengineering from the University of California at Berkeley. His research interests are infracture mechanics of concrete, microstructural studies of concrete behavior underapplied stresses, and experimental methods leading to preservation of cracks in con-crete under load.
ACI member Paulo J. M. Monteiro is Professor and Vice-Chair of Civil Engineeringat the University of California at Berkeley, where he received his PhD. He held theRoy W. Carlson Distinguished Professorship at UCB during 1987-88. In 1989 hereceived the Presidential Young Investigator Award from the National Science Foun-dation. His research interests include mathematical modeling and microstructure ofconcrete and testing methods.
Karen L. Scrivener received her degree in metallurgy and materials science at Cam-bridge University. In 1995 she joined the Central Research Laboratories of Lafarge asSenior Scientist in charge of research on calcium aluminate cements.
Table 1—Concrete mix design
Normal-strength concrete
Material Quantity/type
Cement 583 lb/yd3 (346 kg/m3 )
Water 308 lb/yd3 (183 kg/m3 )
Coarse aggregate ( 1/2 in. maximum size aggregate)
1650 lb/yd3 (979 kg/m3)
Sand 1448 lb/yd3 (859 kg/m3)
High-range water-reducingadmixture
15 oz/100 lb cement(10 ml/kg)
w/c 0.528
Slump 1.5 in. (38 mm)
Average strength 6200 psi (51.7 MPa)
High-strength concrete
Material Quantity/type
Cement Type I/II 600 lb/yd3 (356 kg/m3 )
Rice husk ash 90 lb/yd3 (53 kg/m3)
Crushed limestone (3/8 in. maximum size aggregate)
1760 lb/yd3 (1044 kg/m3)
Top sand (FM = 3.0) 1325 lb/yd3 (768 kg/m3)
Water 215 lb/yd3 (128 kg/m3 )
Superplasticizer 5.7 l/m3
w/c 0.358
Slump 1 in. (25 mm)
Average strength 11,000 psi (75.8 MPa)

ACI Materials Journal / September-October 1998 619
the geometry of the microcracks induced. The concretecylinders were first dried in an oven at a temperature of 110 F(43.3 C). This removed the moisture in the concrete and pre-heated the cylinder, ensuring that the molten metal alloycould penetrate into pores and cracks deep within its corewithout solidifying prematurely.
A total of eight experiments, five of normal-strength andthree of high-strength concrete cylinders, were conductedwith conditions as defined in Table 2. Each specimen wasloaded to a similar point in the stress-strain curve, corre-sponding to about 80 to 85 percent of the ultimate strength.
One disadvantage to using the Wood’s metal method isthat the concrete cylinders are dried by pre-heating the spec-imens at a temperature of about 43 C prior to testing. Thisprocess could induce excessive drying, thereby formingshrinkage cracks which may percolate through the sample.
After solidification of the metal each of the cylinders wassectioned along its long axis, using oil as a coolant. One ofthe half-cylinders was sectioned at the middle along its di-ameter. An axial slab, approximately 1/8-inch (5 mm) thick,was sliced parallel to the direction of the load. Four sectionswere extracted from the axial slab (Specimens 1 through 4),two from the mid-line edge, and two from the top surface. Inthe micrographs each section is identified by a two digitcode, the first referring to the experiment number (Table 2)and the second to the section number (Fig. 2). The sectionswere 1 in. (25 mm)-square and had an approximate thicknessof 5 mm.
One side of each section was lapped flat with 120, 220,320, and 600 grade silicon carbide using a rotating grinderand then mounted against a 1 in. (25 mm)-diameter glassplate with epoxy. A parallel-sided slice, 2 to 3 mm thick, wasthen cut from the section with a diamond slicing wheel anda nonaqueous lubricant (propylene glycol coolant). The
sections were lapped with a wheel grinder and polished with600 grade silicon carbide, 100-, 50-, and 10-micron alumi-num powder and 5-, 3-, and 1/4-micron diamond paste. Aftereach stage of polishing, the specimens were immersed in ac-etone and placed in an ultrasonic bath.
The specimens were examined using a JEOL JSM-35CFscanning electron microscopy (SEM) in conjunction with animage analyzer.
STEREOLOGICAL RELATIONSHIPSStereology deals with the interpretation of three-dimen-
sional structures by means of their two-dimensional sections.There are various approaches to stereological problems. Thestatistico-geometrical approach depends on measuring andclassifying a large number of two-dimensional images and isthe method utilized in this study. It is applicable when ob-jects are randomly distributed in space. In such cases validresults may be obtained from a single section, if this is exten-sive enough to contain a statistically significant number offeatures and is representative of the bulk specimen.
Fundamental expressions have been determined which re-late measurements on two-dimensional sections to thethree-dimensional structure. Table 3 presents some of thesymbols commonly used relevant to this work.
The relationships between LA and SV with PL are presentedbelow39
Surface area per unit volume, SV
(1)
Length of line per unit area, LA
SV 2PL µm2
µm3
⁄=
Fig. 1—Normal-strength concrete specimens used in the experiments: (a) Experiments No. 1 and 2, no-load and uniaxial tests; (b) Experiment No. 3, partially confined (1) test; (c) Experiment No. 4, partially confined (2) test; and (d) Experiment No. 5, fully confined test.
(a) (b) (c) (d)

620 ACIMaterialsJournal/September-October1998
(2)
or
(3)
IMAGE ANALYSIS PROCEDUREThe samples were examined in the scanning electron mi-
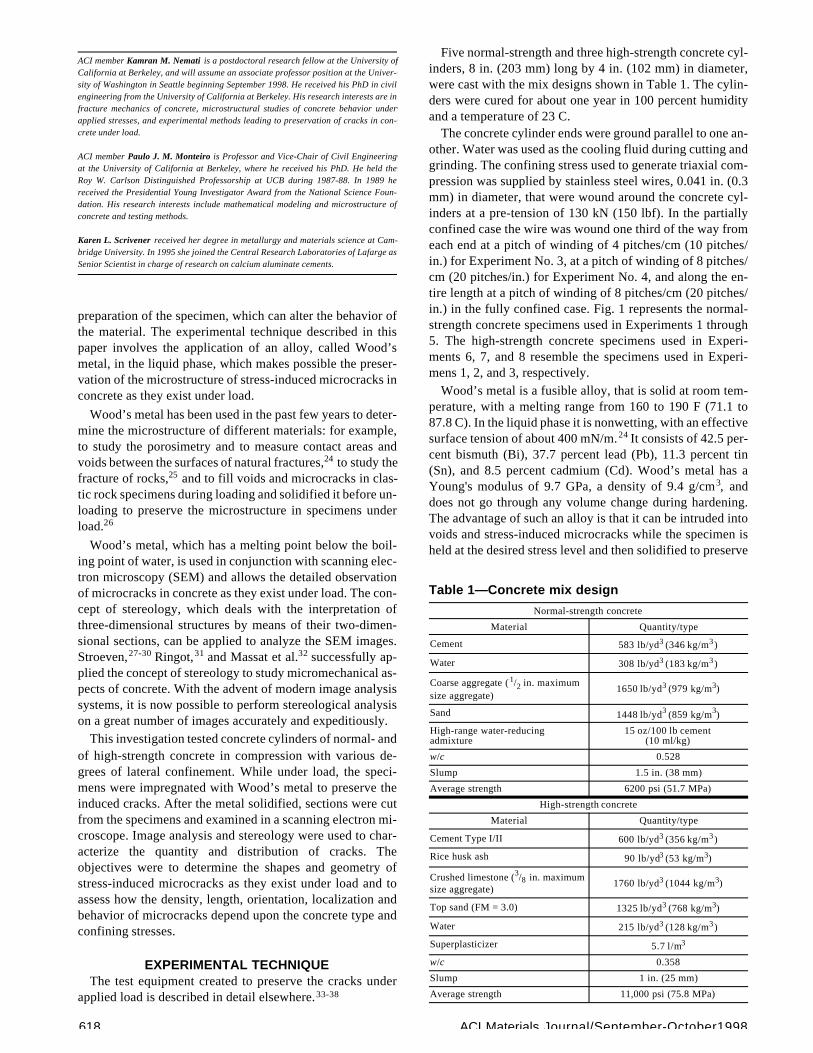
croscope with backscattered electrons (BSE). The SEM wasoperated at 15 kv and probe current of around 1 nA at aworking distance of 15 mm. The images were acquired bythe image analyzer at a magnification of 60× and digitizedinto an array of 512 x 512 pixels, with 255 gray levels (1 pix-el = 3.3 µm); 55 images were extracted from each sample. Atypical gray level BSE image is shown in Fig. 3.
Fig. 4 shows a histogram of the distribution of gray levelsin the BSE image superimposed on the original image. Asthe average atomic number of the Wood’s metal is muchhigher than cement paste and the aggregates, impregnatedcracks and pores can be easily distinguished in the BSE im-age. This technique also avoids the problem of crack forma-tion during specimen preparation. The peak at the right (highgray level) corresponds to the areas of Wood’s metal, whilethe peaks to the left correspond to the cementitious phasesand aggregate. This histogram was used to select the thresh-old value for discriminating the areas of Wood’s metal,shown in Fig. 5.
The image shown in Fig. 6 includes small isolated pores,which were eliminated by the application of a minimum sizethreshold (scrap) for objects of 10 pixels (minimum featuresize of approximately 33 µm).
Next, a skeletonized binary image was obtained by binarythinning. For every thinning step, pixels that are not relevantto the connectivity of an object are removed from the objectmargins, i.e., converted into background pixels, thus connec-tivity of objects is maintained. This process was continueduntil all objects were reduced to a width of one pixel that ap-proximates the skeleton. Fig. 7 is the final binary image usedfor stereological measurements.
To quantify the crack orientation, the skeletonized imagein Fig. 7 was then intersected by an array of straight parallellines at 15 deg angular increments, in this case at angles of 0,
LAπ2---
PL µm µm2
⁄=
π2--- PL LA
π4---S V= =
15, 30, 45, 60, 75, 90, 105, 120, 135, 150, and 165 deg to thecompression axis (Fig. 8). At each angle the number of inter-sections of the line array with the thinned crack network wasmeasured. A vector of length proportional to the number ofintersections PL(θ) was plotted at the θ to give a “rose of in-tersections” diagram, which characterizes the anisotropy ofthe cracks. Since lines at angle θ + 180 deg are equivalent tothose at angle θ, the rose diagrams only cover the range of 0to 165 deg.
This method allows the anisotropy of the crack pattern tobe characterized. For example, if most cracks were orientedparallel to the compression axis the number of intersectionswith the lines at 0 deg would be highest. Further image anal-ysis procedures are discussed in the next section.
RESULTSCharacterization of microcracks
Normal-strength concrete—Fig. 9 shows typical imagesfrom the unloaded specimen. To restrain the specimen dur-ing the impregnation with Wood’s metal, this specimen wassubject to a small uniaxial compressive stress of 1500 psi(10.3 MPa). In this specimen the bright areas that have been
Table 2—Experiments conductedExperiment no. Loading condition Concrete strength Load, psi/MPa Ultimate load,
percent
1 No load Normal 1500/10.3* N/A
2 Uniaxial Normal 5000/34.5 80
3 Partially confined 1† Normal 6000/41.4 81
4 Partially confined 2‡ Normal 6000/41.4 82
5 Fully confined Normal 7330/50.6 84
6 No load High 1500/10.3* N/A
7 Uniaxial High 9350/64.5 85
8 Partially confined High 10,800/74.5 82
* Restraining load to prevent movement of the specimen during impregnation.† Pitch detail: pitch of winding of 4 pitches/cm (10 pitches/in.).‡ Pitch detail: pitch of winding of 8 pitches/cm (20 pitches/in.).
Fig. 2—Specimen extraction and numbering scheme.
ACI Materials Journal / September-October 1998 621
permeated by Wood’s metal correspond to regions of con-nected porosity. These regions are most common in the in-terfacial transition zone around aggregate particles, a findingwhich is discussed in more detail elsewhere.35 The connec-tivity (and hence degree of penetration by Wood’s metal) ofthese pore agglomerations could have been enhanced by theformation of bridging microcracks during the curing of thesamples and the drying process prior to loading. There are nolong cracks characteristic of stress induced cracking in theseimages. In contrast such cracks are readily apparent in thesamples from the loaded unconfined specimen, shown inFig. 10.
The microcracks in the loaded specimens appear to havebeen generated by several different mechanisms. Fig. 11shows two micrographs taken from the partially confinedsample (Experiment No. 3) where microcracks have propa-gated through the cement paste and along the interfacial tran-sition zone. Many cracks appear to have been generated fromvoids as a result of local tensile stress tangential to the voidboundary, with a value of the order of the maximum appliedprincipal stress. These cracks usually originated from thepore boundaries and propagated in the direction of maximumcompression. Fig. 12 shows two micrographs of microcrack-ing around air voids, which are filled with Wood’s metal.
Microcracks also appeared to have been generated insideaggregates, with a tendency to run parallel to the compres-sion axis. It is presumed that these aggregates experiencedloading across their height leading to a mode of fractureanalogous to that which occurs in a splitting tensile test. Fig.13 shows two micrographs of this phenomenon for the fullyconfined loading conditions.
High-strength concrete—Compared to normal-strengthconcrete, high-strength concrete behaves more like a homo-geneous material, with its stress-strain curve being steeper,and remains closer to linearity at a higher stress-strength ra-tio. In addition, fracture in high-strength concrete tends to becharacterized more accurately by linear elastic fracture me-chanics than does normal-strength concrete.40 The amountand degree of microcracking in the interfacial transition zone(ITZ) between the cement paste matrix and the aggregatescause a more brittle mode of fracture and less volumetric di-lation.41 Because of densely packed cement grains and a re-duced amount of pores and cracks, high-strength concretehas a lower w/c, resulting in stronger cement paste. As a con-sequence, high-strength concrete has a stronger interfacialtransition zone, which is due to a reduction in excess bleed-ing and the filling of gaps by mineral admixtures, in thiscase, rice husk ash (RHA).
Table 3—List of basic stereological symbols and their definitionSymbol Dimensions Definition
PL µm–1Number of intersections per unit length of features (i.e., cracks) in a section with a superimposed array of equally spaced, randomly oriented parallel lines.
PL(θ) µm–1Number of intersection of cracks in a section with an array of equally spaced parallel lines oriented at an angle θ to a refer-ence axis.
LA µm / µm2 Total crack length in a section per unit of area.
SV µm 2 / µm3 Total crack surface area per unit of volume.
THRESHOLDS IN HISTOGRAM
Fig. 3—Typical BSE image. Fig. 4—Establishing threshold in histogram.

622 ACIMaterialsJournal/September-October1998
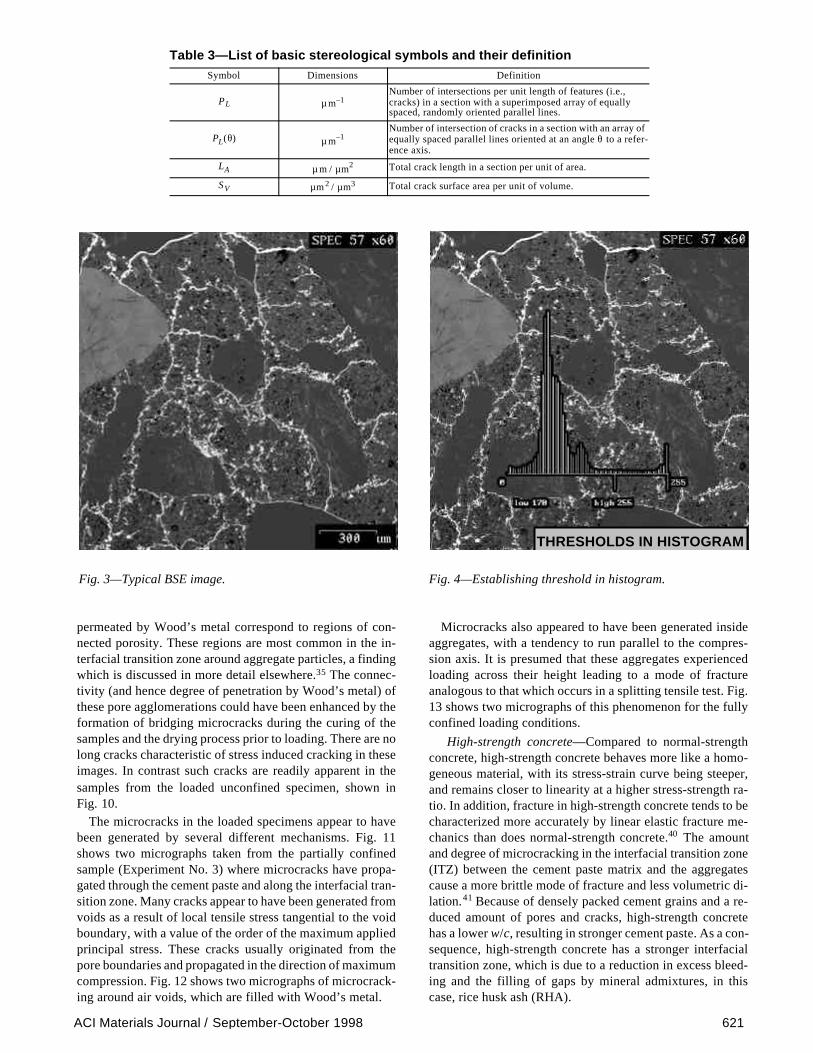
Two SEM micrographs from the unloaded specimen ofhigh-strength concrete are shown in Fig. 14, with nostress-induced microcracks observed in these sections. Re-gions of connected porosity in the ITZ are also far less appar-ent, which is due to the refinement of the microstructure inthis region.
Fig. 15 shows two SEM micrographs from ExperimentNo. 7, which was conducted under uniaxial condition. Fromthese micrographs it is clear that less cracking occurs inhigh-strength than in normal-strength concrete; because ofthe stronger cement paste, most of this cracking takes placein the interfacial transition zone.
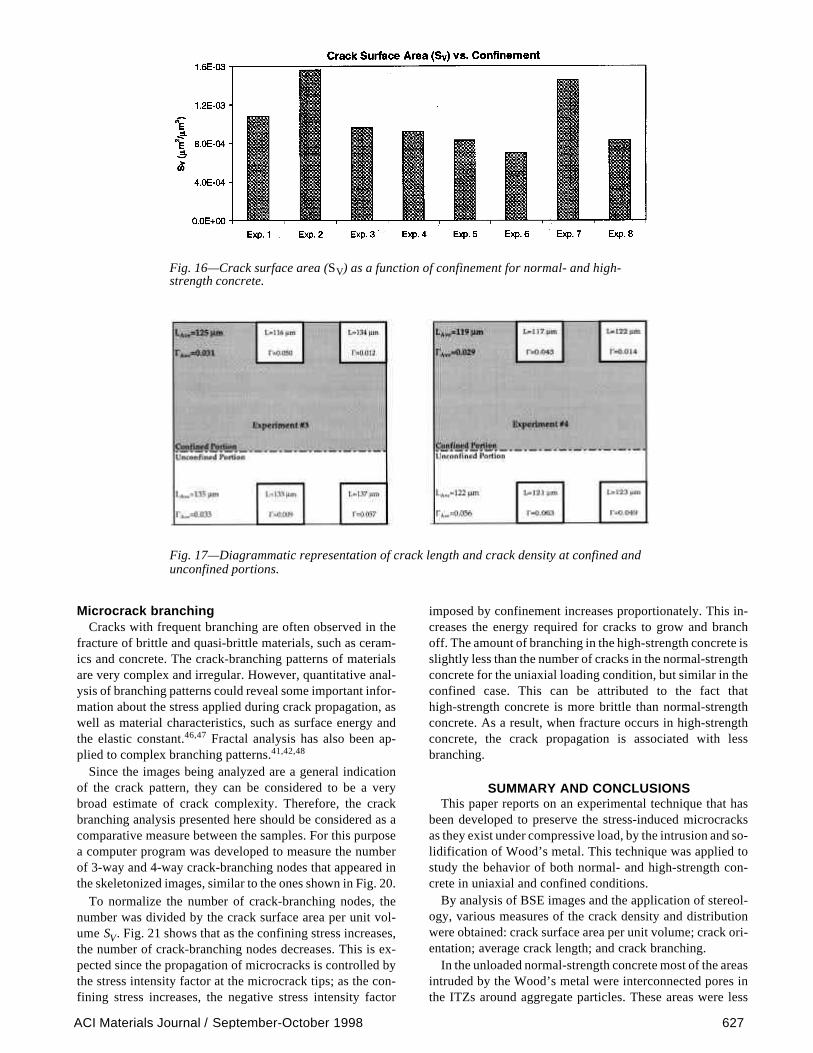
Microcrack density distributionPlots of the cracks surface area per unit volume SV as a
function of confinement are presented in Fig. 16 for nor-mal-strength and high-strength concrete specimens. The val-ue of SV was obtained based on the average value of PL in alldirections. It is clear that the crack surface area SV decreasesas the confining stress increases for both normal- andhigh-strength concrete.
As illustrated in Fig. 9, in the unloaded normal-strengthsample the Wood’s metal penetrates into connected pores,which are then measured as “cracks” by the image analysisprogram. The samples from the unconfined experiment (No.2) show a considerable increase in SV over the unloaded sam-ples. In all the normal-strength confined specimens (Experi-ments No. 3 through 5) the measured SV is actually lowerthan that in the unloaded sample. This may be attributed tothe decrease in the amount of connected porosity penetratedby the Wood’s metal, either due to the closure of bridgingmicrocracks or to the collapse of pore throats under the con-fining pressure.
In the high-strength concretes, SV in the unloaded samplewas lower than in the case of the normal-strength concrete.This is due to the decrease in the amount of connected poros-ity in the ITZ as noted from the micrographs (Fig. 15). Thereis a dramatic increase in the crack density in the unconfinedsample, but again the crack density in the confined sample ismuch lower. In both uniaxial and confined cases the crackdensities in the normal- and high-strength concrete are simi-lar. Although the absolute loads were different, the testingconditions correspond to similar percentage of the ultimateload.
Kranz42 put forward an explanation for the decrease incrack density in the presence of confinement. Microcracksare generated by local tensile stresses, which depend onthe geometry of pores and aggregates, and material heter-ogeneity, as well as the magnitude and direction of applied
Fig. 5—Threshold image.
Fig. 6—Crack network image after application of scrap function.
Fig. 7—Binary-thinned image of the crack network in concrete.

ACI Materials Journal / September-October 1998 623
stresses. Confinement increases the hydrostatic pressure act-ing on an existing deviatoric stress field, and so is likely todecrease the range and magnitude of deviatoric stresses con-centrated near crack tips, as well as increase frictional resis-tance to shear between crack surfaces in contact. For tensilecracks this increases the energy (and hence stress) requiredfor propagation, thereby making crack growth less probable.
The microcrack density distribution Γ represents the num-ber of microcracks per unit of observation area. Pore spaceswere not counted as microcracks. For a body of volume V(unit thickness) containing N cracks with initial cracks oflength l0, the initial crack density parameter Γ is given by
(4)
The crack density parameter Γ, in an image of area A withN cracks of length li , can be obtained from the followingrelationship
(5)
whereΓ = Crack density parameterli = Crack length (mm)A = SEM image area (512 x 512 pixels = 2.8358 mm2)Fig. 17 illustrates the crack length and crack densities for the
partially confined specimens in both confined and unconfinedportions of the specimen for Experiments No. 3 and 4 which
ΓN l0
2
V--------=
Γ
li2
i 1=
N
∑A
-------------=
Fig. 8—Array of straight parallel lines at 15 deg angular increments.
(a) (b)
Fig. 9(a) and (b)—SEM micrographs from the no-load experiment.

624 ACIMaterialsJournal/September-October1998
were subjected to a confining stress over each end and uniax-ial compression over the center. In both cases the crack den-sities in the center and edge of the sample are smaller in theconfined portion than in unconfined portion. Also, in bothexperiments, the average crack length is smaller in the centerportion of the specimen than along the edge.
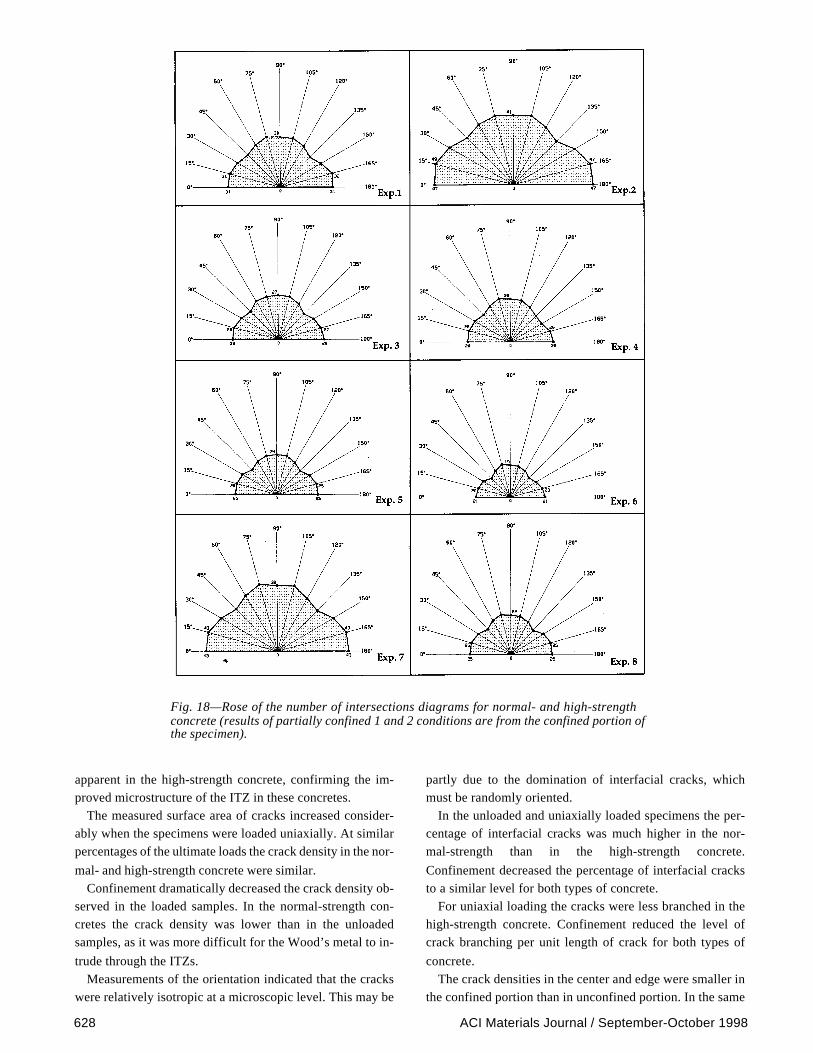
Orientation of microcracksFig. 18 shows the rose of the number of intersections for
normal- and high-strength concrete specimens. The degreeof orientation obtained for the partially confined specimenswere based on the crack patterns observed in the confinedportion.
From Fig. 18 it is apparent that on a microscopic scale, thecracking is relatively isotropic. The normal-strength uniaxialsection shows some tendency for a higher number of inter-sections for line arrays oriented parallel to the stress axis,indicating that the cracks in this section tended to run per-pendicular to the loading direction. However, this tendencyis not present in the normal-strength confined sections. Thehigh-strength concretes show a very slight, probably insig-nificant, orientation effect in both the uniaxial and confinedspecimens.
Any tendency to anisotropy of cracking, which might haveoccurred in a homogeneous material, will be greatly affectedby the heterogeneity of concrete. In particular, visual exam-ination makes it clear that a large proportion of the cracks oc-cur at the cement paste/aggregate interfaces, which will berandomly oriented.
Interfacial cracks and poresQualitative examination of the sections indicate that the
cracking was dominated by cracks at the interface betweenaggregate and cement paste and by the presence of regions ofconnected pores in the ITZ.
Investigations have shown that very fine cracks at the in-terface between coarse aggregate and cement paste exist
even prior to application of the load on concrete.8 The initi-ation and propagation of these cracks are considered to bethe dominant mechanisms responsible for the nonlinearresponse of concrete subjected to uniaxial compressiveloading. Interfacial cracks remain stable up to about 30 per-cent or more of the ultimate strength and then begin to in-crease in length, width, and number. The overall stress underwhich they develop is sensitive to the w/c ratio of the paste.At 70 to 90 percent of the ultimate strength, cracks openthrough the cement paste and bridge the interfacial cracks,and the continuous crack pattern is formed.43 Studies con-
Fig. 10—SEM microgaph from the uniaxial experiment.(a)
(b)
Fig. 11(a) and (b)—SEM micrographs from the partially confined experiment.

ACI Materials Journal / September-October 1998 625
ducted using microscopic analysis8,44,45 reveal that cracksfrequently initiate at the interface and then propagate into thematrix where mortar cracks join to form a continuous crackpath prior to ultimate load.
To analyze the phenomenon of interfacial pores and crack-ing, an attempt was made to distinguish these from the ma-trix cracks. The outline of the aggregate particles in theimage was identified by manual tracing. The areas corre-
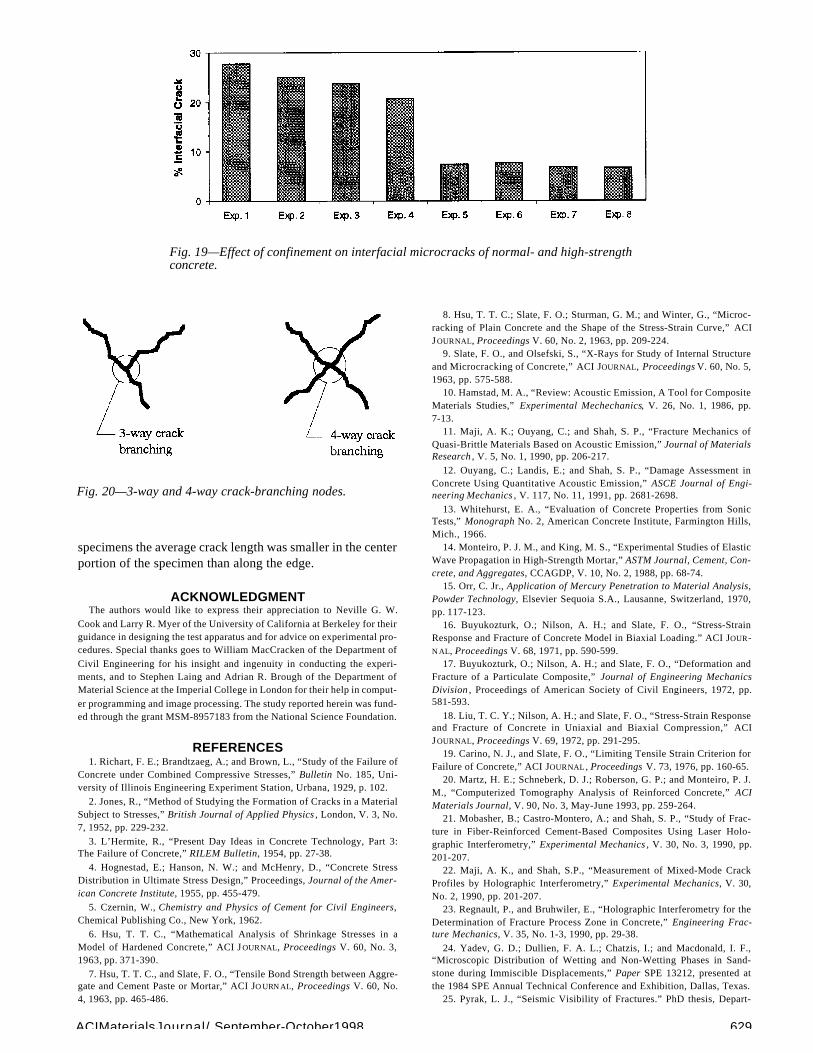
sponding to the aggregate particles were then dilated byabout 13 µm and cracks within this dilated region identified.The length of these interfacial cracks was then calculated asa percentage of the total crack length in the image. Fig. 19shows the percentage of interfacial microcracks and pores asa function of the confining stress for normal- andhigh-strength concrete. As shown, there is a sharp reductionin the amount of interfacial microcracks as the confining
(a) (b)
Fig. 12(a) and (b)—SEM micrographs of microcracks propagating from a pore.
(a) (b)
Fig. 13(a) and (b)—SEM micrographs of aggregate cracking.
ACI Materials Journal / September-October 1998626
stress increases. The greatest reduction occurred when theconcrete specimen was fully confined.
In the case of high-strength concrete, it is apparent thatthe percentage of interfacial cracks in the unloaded anduniaxially loaded specimens is much lower than in thecorresponding of normal-strength concrete specimens. Thismay be partially explained by the elimination of the region
of connected pores that were a common feature of the ITZsof the normal-strength concrete, but also confirms the im-provement of the strength of the interfacial zone in thehigh-strength concrete. In the confined case the percentageof interfacial cracks is similar in the two types of concrete.
(a) (b)
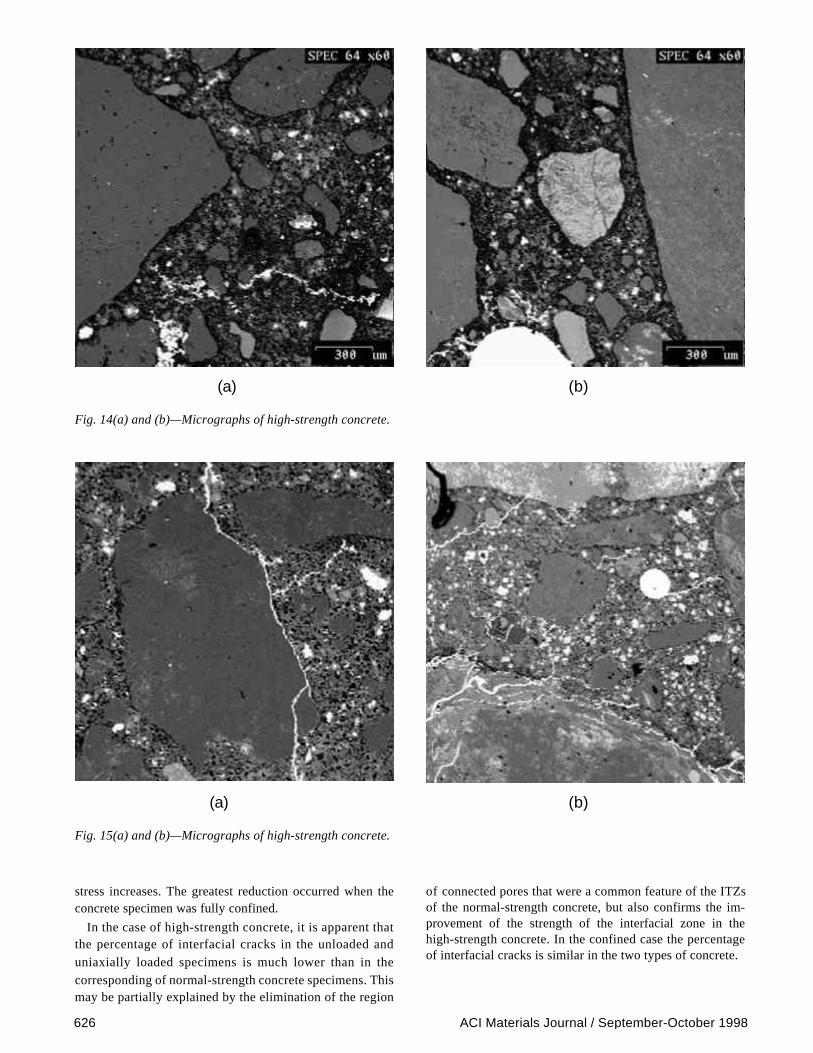
Fig. 14(a) and (b)—Micrographs of high-strength concrete.
(a) (b)
Fig. 15(a) and (b)—Micrographs of high-strength concrete.
ACI Materials Journal / September-October 1998 627
Microcrack branchingCracks with frequent branching are often observed in the
fracture of brittle and quasi-brittle materials, such as ceram-ics and concrete. The crack-branching patterns of materialsare very complex and irregular. However, quantitative anal-ysis of branching patterns could reveal some important infor-mation about the stress applied during crack propagation, aswell as material characteristics, such as surface energy andthe elastic constant.46,47 Fractal analysis has also been ap-plied to complex branching patterns.41,42,48
Since the images being analyzed are a general indicationof the crack pattern, they can be considered to be a verybroad estimate of crack complexity. Therefore, the crackbranching analysis presented here should be considered as acomparative measure between the samples. For this purposea computer program was developed to measure the numberof 3-way and 4-way crack-branching nodes that appeared inthe skeletonized images, similar to the ones shown in Fig. 20.
To normalize the number of crack-branching nodes, thenumber was divided by the crack surface area per unit vol-ume SV. Fig. 21 shows that as the confining stress increases,the number of crack-branching nodes decreases. This is ex-pected since the propagation of microcracks is controlled bythe stress intensity factor at the microcrack tips; as the con-fining stress increases, the negative stress intensity factor
imposed by confinement increases proportionately. This in-creases the energy required for cracks to grow and branchoff. The amount of branching in the high-strength concrete isslightly less than the number of cracks in the normal-strengthconcrete for the uniaxial loading condition, but similar in theconfined case. This can be attributed to the fact thathigh-strength concrete is more brittle than normal-strengthconcrete. As a result, when fracture occurs in high-strengthconcrete, the crack propagation is associated with lessbranching.
SUMMARY AND CONCLUSIONSThis paper reports on an experimental technique that has
been developed to preserve the stress-induced microcracksas they exist under compressive load, by the intrusion and so-lidification of Wood’s metal. This technique was applied tostudy the behavior of both normal- and high-strength con-crete in uniaxial and confined conditions.
By analysis of BSE images and the application of stereol-ogy, various measures of the crack density and distributionwere obtained: crack surface area per unit volume; crack ori-entation; average crack length; and crack branching.
In the unloaded normal-strength concrete most of the areasintruded by the Wood’s metal were interconnected pores inthe ITZs around aggregate particles. These areas were less
Fig. 16—Crack surface area (SV) as a function of confinement for normal- and high-strength concrete.
Fig. 17—Diagrammatic representation of crack length and crack density at confined and unconfined portions.
ACI Materials Journal / September-October 1998628
apparent in the high-strength concrete, confirming the im-proved microstructure of the ITZ in these concretes.
The measured surface area of cracks increased consider-ably when the specimens were loaded uniaxially. At similarpercentages of the ultimate loads the crack density in the nor-
mal- and high-strength concrete were similar.Confinement dramatically decreased the crack density ob-
served in the loaded samples. In the normal-strength con-cretes the crack density was lower than in the unloadedsamples, as it was more difficult for the Wood’s metal to in-
trude through the ITZs.Measurements of the orientation indicated that the cracks
were relatively isotropic at a microscopic level. This may be
partly due to the domination of interfacial cracks, whichmust be randomly oriented.
In the unloaded and uniaxially loaded specimens the per-centage of interfacial cracks was much higher in the nor-mal-strength than in the high-strength concrete.
Confinement decreased the percentage of interfacial cracksto a similar level for both types of concrete.
For uniaxial loading the cracks were less branched in thehigh-strength concrete. Confinement reduced the level ofcrack branching per unit length of crack for both types of
concrete.The crack densities in the center and edge were smaller in
the confined portion than in unconfined portion. In the same
Fig. 18—Rose of the number of intersections diagrams for normal- and high-strength concrete (results of partially confined 1 and 2 conditions are from the confined portion of the specimen).
ACIMaterialsJournal/ September-October1998 629
specimens the average crack length was smaller in the centerportion of the specimen than along the edge.
ACKNOWLEDGMENTThe authors would like to express their appreciation to Neville G. W.
Cook and Larry R. Myer of the University of California at Berkeley for theirguidance in designing the test apparatus and for advice on experimental pro-cedures. Special thanks goes to William MacCracken of the Department of
Civil Engineering for his insight and ingenuity in conducting the experi-ments, and to Stephen Laing and Adrian R. Brough of the Department ofMaterial Science at the Imperial College in London for their help in comput-
er programming and image processing. The study reported herein was fund-ed through the grant MSM-8957183 from the National Science Foundation.
REFERENCES1. Richart, F. E.; Brandtzaeg, A.; and Brown, L., “Study of the Failure of
Concrete under Combined Compressive Stresses,” Bulletin No. 185, Uni-versity of Illinois Engineering Experiment Station, Urbana, 1929, p. 102.
2. Jones, R., “Method of Studying the Formation of Cracks in a MaterialSubject to Stresses,” British Journal of Applied Physics , London, V. 3, No.7, 1952, pp. 229-232.
3. L’Hermite, R., “Present Day Ideas in Concrete Technology, Part 3:The Failure of Concrete,” RILEM Bulletin, 1954, pp. 27-38.
4. Hognestad, E.; Hanson, N. W.; and McHenry, D., “Concrete StressDistribution in Ultimate Stress Design,” Proceedings, Journal of the Amer-ican Concrete Institute, 1955, pp. 455-479.
5. Czernin, W., Chemistry and Physics of Cement for Civil Engineers,Chemical Publishing Co., New York, 1962.
6. Hsu, T. T. C., “Mathematical Analysis of Shrinkage Stresses in aModel of Hardened Concrete,” ACI J OURNAL, Proceedings V. 60, No. 3,1963, pp. 371-390.
7. Hsu, T. T. C., and Slate, F. O., “Tensile Bond Strength between Aggre-gate and Cement Paste or Mortar,” ACI JO URN AL, Proceedings V. 60, No.4, 1963, pp. 465-486.
8. Hsu, T. T. C.; Slate, F. O.; Sturman, G. M.; and Winter, G., “Microc-racking of Plain Concrete and the Shape of the Stress-Strain Curve,” ACIJOURNAL, Proceedings V. 60, No. 2, 1963, pp. 209-224.
9. Slate, F. O., and Olsefski, S., “X-Rays for Study of Internal Structureand Microcracking of Concrete,” ACI JOURNAL, Proceedings V. 60, No. 5,1963, pp. 575-588.
10. Hamstad, M. A., “Review: Acoustic Emission, A Tool for CompositeMaterials Studies,” Experimental Mechechanics, V. 26, No. 1, 1986, pp.7-13.
11. Maji, A. K.; Ouyang, C.; and Shah, S. P., “Fracture Mechanics ofQuasi-Brittle Materials Based on Acoustic Emission,” Journal of MaterialsResearch , V. 5, No. 1, 1990, pp. 206-217.
12. Ouyang, C.; Landis, E.; and Shah, S. P., “Damage Assessment inConcrete Using Quantitative Acoustic Emission,” ASCE Journal of Engi-neering Mechanics , V. 117, No. 11, 1991, pp. 2681-2698.
13. Whitehurst, E. A., “Evaluation of Concrete Properties from SonicTests,” Monograph No. 2, American Concrete Institute, Farmington Hills,Mich., 1966.
14. Monteiro, P. J. M., and King, M. S., “Experimental Studies of ElasticWave Propagation in High-Strength Mortar,” ASTM Journal, Cement, Con-crete, and Aggregates, CCAGDP, V. 10, No. 2, 1988, pp. 68-74.
15. Orr, C. Jr., Application of Mercury Penetration to Material Analysis,Powder Technology, Elsevier Sequoia S.A., Lausanne, Switzerland, 1970,pp. 117-123.
16. Buyukozturk, O.; Nilson, A. H.; and Slate, F. O., “Stress-StrainResponse and Fracture of Concrete Model in Biaxial Loading.” ACI JOUR-N AL, Proceedings V. 68, 1971, pp. 590-599.
17. Buyukozturk, O.; Nilson, A. H.; and Slate, F. O., “Deformation andFracture of a Particulate Composite,” Journal of Engineering MechanicsDivision , Proceedings of American Society of Civil Engineers, 1972, pp.581-593.
18. Liu, T. C. Y.; Nilson, A. H.; and Slate, F. O., “Stress-Strain Responseand Fracture of Concrete in Uniaxial and Biaxial Compression,” ACIJOURNAL, Proceedings V. 69, 1972, pp. 291-295.
19. Carino, N. J., and Slate, F. O., “Limiting Tensile Strain Criterion forFailure of Concrete,” ACI JOURNAL , Proceedings V. 73, 1976, pp. 160-65.
20. Martz, H. E.; Schneberk, D. J.; Roberson, G. P.; and Monteiro, P. J.M., “Computerized Tomography Analysis of Reinforced Concrete,” ACIMaterials Journal, V. 90, No. 3, May-June 1993, pp. 259-264.
21. Mobasher, B.; Castro-Montero, A.; and Shah, S. P., “Study of Frac-ture in Fiber-Reinforced Cement-Based Composites Using Laser Holo-graphic Interferometry,” Experimental Mechanics , V. 30, No. 3, 1990, pp.201-207.
22. Maji, A. K., and Shah, S.P., “Measurement of Mixed-Mode CrackProfiles by Holographic Interferometry,” Experimental Mechanics, V. 30,No. 2, 1990, pp. 201-207.
23. Regnault, P., and Bruhwiler, E., “Holographic Interferometry for theDetermination of Fracture Process Zone in Concrete,” Engineering Frac-ture Mechanics, V. 35, No. 1-3, 1990, pp. 29-38.
24. Yadev, G. D.; Dullien, F. A. L.; Chatzis, I.; and Macdonald, I. F.,“Microscopic Distribution of Wetting and Non-Wetting Phases in Sand-stone during Immiscible Displacements,” Paper SPE 13212, presented atthe 1984 SPE Annual Technical Conference and Exhibition, Dallas, Texas.
25. Pyrak, L. J., “Seismic Visibility of Fractures.” PhD thesis, Depart-
Fig. 19—Effect of confinement on interfacial microcracks of normal- and high-strength concrete.
Fig. 20—3-way and 4-way crack-branching nodes.

ACI Materials Journal / September-October 1998630
ment of Materials Science and Mineral Engineering, University of Califor-nia at Berkeley, 1988.
26. Zheng, Z., “Compressive Stress-Induced Microcracks in Rocks andApplications to Seismic Anisotropy and Borehole Stability,” PhD thesis,Department of Material Science and Mineral Engineering, University ofCalifornia at Berkeley, 1989.
27. Stroeven, P., “Some Aspects of Micromechanics of Concrete,” PhDthesis, Stevin Laboratory, Technological University of Delft, 1973.
28. Stroeven, P., “Application of Various Stereological Methods to theStudy of the Grain and the Crack Structure of Concrete,” Journal ofMicroscopy, V. 107, No. 3, 1976, pp. 313-321.
29. Stroeven, P., “Morphometry of Plain and Fibre Reinforced Concreteby Means of Image Analysis Techniques,” Proceedings of the SecondInternational Conference on Mechanical Behavior of Materials, Boston,Mass., 1976, pp. 1675-1679.
30. Stroeven, P., “Some Mechanical Effects of Interface Debonding inPlain Concrete, Interfaces in Cementitious Composites,” Proceedings ofthe RILEM International Conference, Edited by J. C. Maso, Toulouse,France, 1992, pp. 187-196.
31. Ringot, E., “Automatic Quantification of Microcracks Network byStereological Method of Total Projections in Mortars and Concretes,”Cement and Concrete Research, V. 18, 1988, pp. 35-43.
32. Massat, M.; Ollivier, E.; and Ringot, E., “Microscopic Analysis ofMicrocracking Damage in Concrete and Durability,” Laboratoire Materi-aux et Durabilite des Constructions (INSA-UPS), Toulouse, France, 1988.
33. Nemati, K. M., “Generation and Interaction of CompressiveStress-Induced Microcracks in Concrete.” PhD thesis, Department of CivilEngineering, University of California at Berkeley, 1994.
34. Nemati, K. M., and Monteiro, P. J. M., “Effect of Confinement on theFracture Behavior of Concrete Under Compression,” Proceedings of theSecond International Conference on Fracture Mechanics of Concrete andConcrete Structures, FraMCoS, Zurich, Switzerland, V. 3, 1995, pp.1843-1852.
35. Scrivener, K. L., and Nemati, K. M., “The Percolation of Pore Spacein the Cement Paste/Aggregate Interfacial Zone of Concrete,” Cement andConcrete Research, V. 26, No. 1, 1996, pp. 35-40.
36. Carpinteri, A.; Chiaia, B.; and Nemati, K. M., “Complex FractureEnergy Dissipation in Concrete under Different Loading Conditions,”Mechanics of Materials, V. 26, No. 2, 1997, pp. 93-108.
37. Nemati, K. M., and Monteiro, P. J. M., “A New Method to Observe
Three-Dimensional Fractures in Concrete Using Liquid Metal Prosimetry
Technique,” Cement and Concrete Research, V. 27, No. 9, 1997, pp.
1333-1341.
38. Nemati, K. M.; Monteiro, P. J. M.; and Cook, N. G. W., “New
Method for Studying Stress-Induced Microcracks in Concrete Using Mol-
ten Metal Alloy,” Journal of Materials in Civil Engineering, American
Society of Civil Engineers, V. 10, No. 3, 1998, pp. 128-134.
39. Underwood, E. E., Quantitative Stereology, Addison-Wesley Pub-
lishing Co., New Jersey, 1968.
40. Gettu, R.; Bazant, Z. P.; and Karr, M. E., “Fracture Properties and
Brittleness of High-Strength Concrete,” ACI Materials Journal, V. 87, No.
6, Nov.-Dec. 1990, pp. 608-618.
41. Carrasquillo, R. L.; Nilson, A. H.; and Slate, F. O., “Properties of
High-Strength Concrete Subject to Short-Term Loads,” ACI JOU RNA L,
Proceedings 1981, pp. 171-178.
42. Kranz, R. L., “Microcracks in Rocks: A Review,” Tectonophysics, V.
100, 1983, pp. 449-480.
43. Neville, A. M., Properties of Concrete, 4th Ed., John Wiley & Sons,
Inc., New York, 1996.
44. Shah, S. P., and Chandra, S., “Fracture of Concrete Subjected to
Cyclic and Sustained Loading,” ACI JOURNAL , Proceedings V. 67, No. 10,
pp. 816-825.
45. Shah, S. P., and Sankar, R., “Internal Cracking and Strain Softening
Response of Concrete under Uniaxial Compression,” ACI Materials Jour-
nal, V. 84, No. 3, Apr.-May 1987, p. 200.
46. Nakasa, K., and Nakatsuka, J., “Crack Initiation, Propagation and
Branching in a Disk if Brittle Material under Axisymmetric Tension,”
Engineering Fracture Mechanics, V. 39, No. 4, 1991, pp. 661-670.
47. Nakasa, K. and Nakatsuka, J., “Analysis of Crack Branching Mor-
phology in a Disk of Brittle Material under Axisymmetric Tension by
Using Branching Dimension,” Engineering Fracture Mechanics, V. 47, No.
3, 1994, pp. 403-415.
48. Mandelbrot, B. B., Fractal Geometry of Nature, W. H. Freeman,
New York, 1977.
Fig. 21—Crack-branching nodes as a function of confinement for normal- and high-strength concrete