aci materials journal technical paper size … · size effect in fatigue fracture of concrete ......
TRANSCRIPT

ACI MATERIALS JOURNAL TECHNICAL PAPER Title no. 88-M46
Size Effect in Fatigue Fracture of Concrete
by Zdenak P. Ba2ant and Kangming Xu
Crack growth caused by load repetitions in geometricaliy similar notched concrete specimens of various sizes is measured by means of the compliance method. It is found that the Paris law. which states that the crack length increment per cycle is a power function of the stress intensity factor amplitude. is valid only for one specimen size (the law parameters being adjusted for that size) or asymptotically. for very large specimens. To obtain a general law. the Paris law is combined with the size-effect law for fracture under monotonic loading. proposed previously by Ba!ant. This leads to a size-adjusted Paris law. which gives the crack length increment per cycle as a power function of the amplitude of a size-adjusted stress intensity factor. The size adjustment is based on the brittleness number of the structure. representing the ratio of the structure size d to the transitional size d., which separates the responses governed by nominal stress and stress intensity factor. Experiments show that do for cyclic loading is much larger than do for monotonic loading. which means that the brittleness number for cyclic loading is much less than that for monotonic loading. The crack growth is alternatively also characterized in terms of the nominal stress amplitude. In the latter form. the size effect vanishes for small structures while. in terms of the stress intensity factor amplitude. it vanishes for large structures. The curves of crack length versus the number of cycles are also calculated and are found to agree with data.
Keywords: concretes; crack propagation; cyclic loads; fatigue (materials): fraclure properties; loads (forces); tests.
The evolution of cracking in concrete structures requires rational modeling to obtain more reliable predictions of structural response to earthquake, traffic loads, environmental changes, and various other severe loads. Repeated loading causes cracks to grow. This phenomenon, called fatigue fracture, has been studied extensively for metals '-3 and ceramics-H and is now understood relatively well. For concrete, however, the knowledge of fatigue fracture is still rather restricted. Aside from fatigue studies outside the context of fracture mechanics,7-11 experimental investigation of fracture under cyclic loading has been limited. 12-16 These investigations indicated that application of the Paris law for crack growth under repeated loading 17.18 can, at least to some extent, be transferred from metals to concrete. However, one important aspect-size effect-has apparently escaped attention so far where fatigue is concerned.
390
The objective of the present study is to investigate size effect, both experimentally and theoretically. Microstructural mechanisms4-6 are beyond the scope of this investigation. The main goal is to identify the global (first-order) approximate description of the deviations from linear elastic fracture mechanics and Paris law.
FATIGUE TESTS OF SIMILAR NOTCHED BEAMS OF DIFFERENT SIZES
Two series of three concrete three-point-bend beam specimens of different sizes were tested in a closed-loop servo-controlled testing machine (see Fig. 1 and 2). The ratio of cement:sand:aggregate:water in the concrete mix was 1 :2:2:0.6, by weight. The aggregate was crushed limestone of maximum size 0.5 in. (12.7 mm). The sand was siliceous river sand passing through sieve No. 1 (5-mm). Type I portland cement with no admixtures was used. From each batch of concrete, three beam specimens of different sizes (one of each size) were cast, along with companion cylinders of diameter 3 in. (76.2 mm) and length 6 in. (152 mm) for strength measurement. After the standard 28-day curing of the companion cylinders, their mean compression strength was J: = 4763 psi (32.8 MPa), with a standard deviation of 216 psi (1.49 MPa). The average direct tensile strength (Which, however, is not needed for the present formulation) may be estimated asJi = 6JJ: psi = 414 psi (2.86 MPa), and Young's elastic modulus as E = 57,OOOJJ: psi = 3.93 x 1()6 psi (27,120 MPa). An additional series of nine notched beam specimens of three different sizes, three of each size, was cast from a different batch of concrete to determine fracture properties under monotonic loading by the size-effect method.
The specimens of different sizes, both for cyclic tests and companion monotonic tests, were geometrically similar in two dimensions, including the lengths of their
ACI Materials Journal. V. 88. No.4, July-August 1991. Received June 4, 1990, and reviewed under Institute publication polkies.
Copyright © 1991, American Concrete Institute. All rights reserved, including the making of copies unless permission is obtained from the copyright proprietors. Pertinent discussion will be published in the May-June 1992 ACI Malerials Journal if received by Feb. I, 1992.
ACI Materials Journal I July-August 1991
Zden~k P. &!ant, FACI, is Walter P. Murphy Professor of Civil Engineering at Northwestern University, Evanston Illinois, where he served as founding director of the Center for Concrete and Geomaterials. He is a registered structural engineer, a consultant to Argonne National Laboratory, and editor-inchief of the ASeE Journal of Engineering Mechanics. He is Chairman of ACI Committee 446, Fracture Mechanics; and member of ACI Committees 209, Creep and Shrinkage of Concrete; and 348, Structural Safety; and is Chairman of RlLEM Committee TC 107 on Creep, of ASCE-EMD Programs Committee, and of SMiRT Division of Concrete and Nonmetallic Materials; and is a member of the Board of Directors of the Society of Engineering Science. Currently, he conducts research at the Technical University in Munich under Humboldt A ward of u.s. Senior Scientist.
Kangming Xu is a graduate research assistant in the Department of Civil Engineering at Northwestern University. He received his BS and MS from Wuhan University of Hydraulic and Electric Engineering, Wuhan, China.
notches. The thickness of all the specimens was the same (b = 1.5 in. = 38.1 mm). The beam depths were d = 1.5, 3, and 6 in. (38.1, 76.2, and 127 mm); the span was L = 2.5d; and the notch depth was ao = d/6 (Fig. 3).
The specimens were cast with the loaded side on top and demolded after 24 hr. Subsequently, the specimens were cured in a moist room with 95 percent relative humidity and 79 F (26.1 C) temperature until the time of the test. Just before the test, the notches were cut with a band saw. When tested, the specimens were 1 month old. During the test, the specimens were positioned upside down with the notch on top. The effect of specimen weight was negligible. During the cyclic tests (as well as the monotonic control tests), the laboratory environment had a relative humidity of about 65 percent and temperature about 78 F (25.6 C). The crack-mouth opening displacement (CMOD) was measured by a linear variable differential transformer (L VDT) gage supported on metallic platelets glued to the concrete.
In view of the difficulty of optical and other direct measurements, the crack length was measured indirectly, by the CMOD-compliance method. The validity of this method for concrete has recently been confirmed. 19.20 The compliance-calibration curve of the specimen (Fig. 4) was experimentally determined as follows:
1. Mark the notch lengths on the beam flank surface according to a logarithmic scale.
2. Cut the notch at midspan with a band saw. 3. Mount the L VDT gage and set up the specimen in
the testing machine. 4. Apply the load at CMOD rate 0.0004 in.lmin and,
after several load cycles between zero and maximum, record, with an x-y recorder, the plot of load versus CMOD, from which the specimen compliance is later calculated (the load is small enough so that no crack would start).
5. Remove the specimen from the machine, extend the notch by sawing a cut up to the next mark, and repeat the procedure. The sawing is admissible due to using a small enough load for which the fracture process zone is so small that it is entirely removed each time a cut to the next mark is made; therefore, after each cut, the specimen responds nearly the same way as a virgin notched specimen. An example of the relevant portion of the calibration curve of specimen compliance versus
ACI Materials Journal I July-August 1991
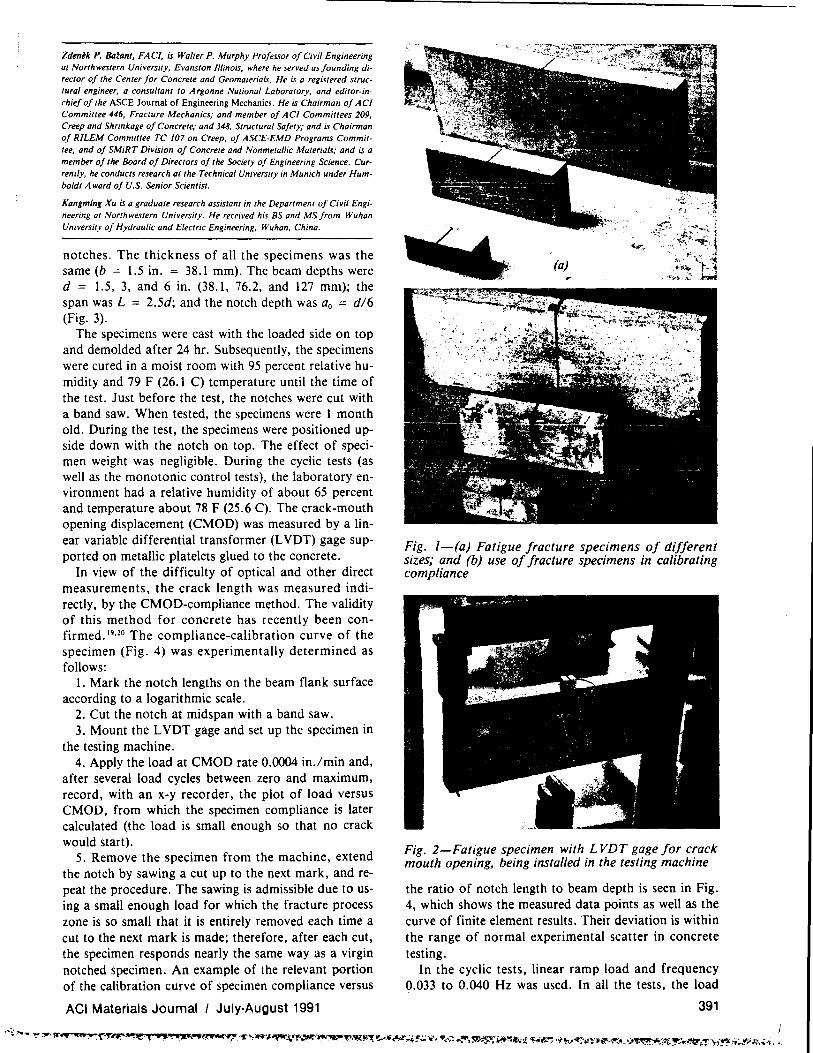
Fig. 1-(a) Fatigue fracture specimens of different sizes; and (b) use of fracture specimens in calibrating compliance
Fig. 2-Fatigue specimen with L VDT gage for crack mouth opening, being installed in the testing machine
the ratio of notch length to beam depth is seen in Fig. 4, which shows the measured data points as well as the curve of finite element results. Their deviation is within the range of normal experimental scatter in concrete testing.
In the cyclic tests, linear ramp load and frequency 0.033 to 0.040 Hz was used. In all the tests, the load
391

2
: ! ;or o IS 1-4-1 ';1.5 j.
i 1,05 D 13
~ 8
~ ~ •
I 6 , 6
16
~
( a )
125d 125d
-I R R
LVDT
0.375
Nold1 W1dII'I - 0.075
p
( b )
Fig. 3-Test specimen geometry
4~--------------------------------~
d - 3 in. ... ~ 3 a Test x 0 Test
-LFEM .Q ~
.5 2
-G) u c ~ a. E 0 0
o+---~--~--~----r---~--~---r--~ 0.1 0.2 0.3 0.4 0.5
Notch Length/Depth
Fig. 4-Example of calculated and measured compliance calibration curve
392
eoo
500
400
S 300
'tI • 0 -' 200
100
0 0.00.+0 2.00.·3 4.00.·3 6.008·3
CMOD ( In. )
( . ) 1285
~ 1.260 1270
N-1230 1.240 1250
II \ \
I x
1/111 III .5
~ II ·'.1 Q
tl' I ~ til , I
j
III i (,)
I II i
. I I II I I 0
510 520 530
TIme ( In minutes
( b )
Fig. 5-(a) Load-CMOD record for one specimen of medium size; and (b) measured load history for the same specimen (CMOD = crack mouth opening displacement, in.)
minima were zero and the load maxima were constant and equal to 80 percent of the monotonic peak Pmu
load for a specimen of the same size and the same notch length. The first loading to 0.8P max was to a prepeak state.
TEST RESULTS An automatic plotter was used to continuously rec
ord the load history [Fig. 5(a)] and the CMOD history [Fig. 5(b)] in each cycle (only the terminal part of these histories near failure is shown in Fig. 5). The effective crack length, representing the coordinate of the tip of an equivalent elastic crack, has been determined from the compliance given by the slope of the unloading segment of the measured load-CMOD curve, according to the compliance-calibration curve shown in Fig. 4. Based on the effective crack length, one can determine the equ;valent stress intensity factor K'ji. The maximum loads measured in the companion monotonic tests are given in Table 1. The table also gives the values obtained previously2' on the same type of concrete and the same specimens. The fact that these previous values were nearly identical confirms reproducibility. The measured curves of load P versus CMOD are shown in Fig. 6.
ACI Materials Journal/July-August 1991
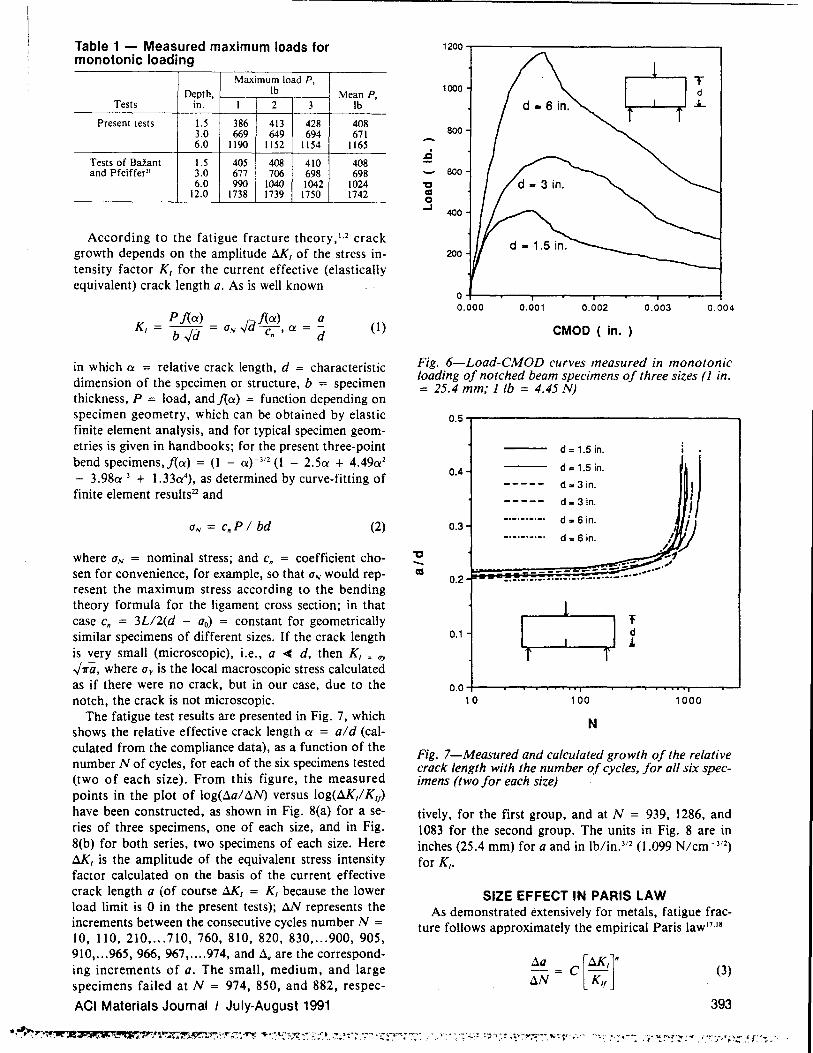
Table 1 - Measured maximum loads for monotonic loading
Maximum load P, Depth, Ib
Tests in. 1 2 3
Present tests 1.5 386 413 428 3.0 669 649 694 6.0 1190 1152 1154
Tests of Bazant 1.5 405 408 410 and Pfeiffer" 3.0 677 706 698
6.0 990 1040 1042 12.0 1738 1739 1750
Mean P, Ib
408 671
1165
408 698
1024 1742
According to the fatigue fracture theory.I.2 crack growth depends on the amplitude tJ(1 of the stress intensity factor KI for the current effective (elastically equivalent) crack length a. As is well known
(1)
in which a = relative crack length. d = characteristic dimension of the specimen or structure. b = specimen thickness. P = load. and j(a) = function depending on specimen geometry. which can be obtained by elastic finite element analysis. and for typical specimen geometries is given in handbooks; for the present three-point bend specimens.j(a) = (l - a)-J/2 (l - 2.5a + 4.49a2
- 3.98a J + 1.33(4). as determined by curve-fitting of
finite element results22 and
(2)
where UN = nominal stress; and Cn coefficient chosen for convenience. for example. so that UN would represent the maximum stress according to the bending theory formula for the ligament cross section; in that case Cn = 3L/2(d - ao) = constant for geometrically similar specimens of different sizes. If the crack length is very small (microscopic). i.e .• a <c d. then KI : qy
.fiO. where U y is the local macroscopic stress calculated as if there were no crack. but in our case. due to the notch. the crack is not microscopic.
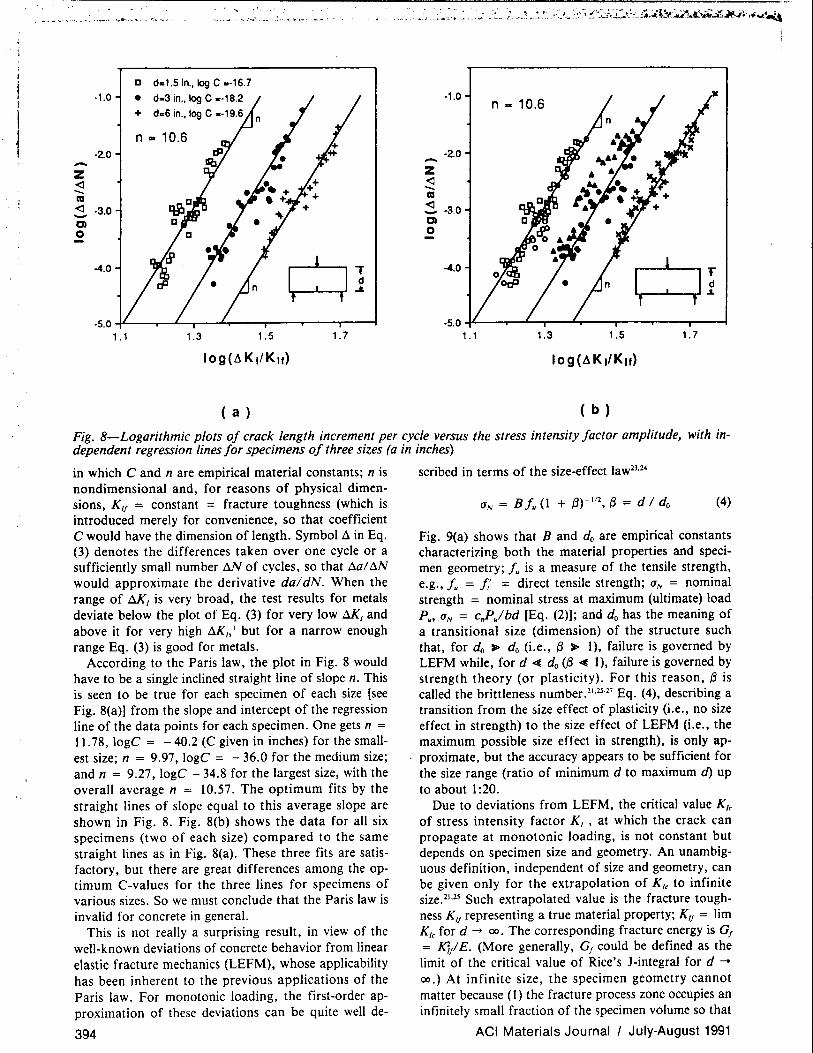
The fatigue test results are presented in Fig. 7. which shows the relative effective crack length a = aid (calculated from the compliance data). as a function of the number N of cycles. for each of the six specimens tested (two of each size). From this figure. the measured points in the plot of 10g(.1a/ tlN) versus 10g(.1.K/ Kif) have been constructed. as shown in Fig. 8(a) for a series of three specimens. one of each size. and in Fig. 8(b) for both series. two specimens of each size. Here tJ(1 is the amplitude of the equivalent stress intensity factor calculated on the basis of the current effective crack length a (of course tJ(1 = KI because the lower load limit is 0 in the present tests); .1N represents the increments between the consecutive cycles number N =
10. 110.210 .... 710. 760. 810. 820. 830 .... 900. 905. 910 .... 965.966.967 ..... 974. and .1. are the corresponding increment~ of a. The small. medium. and large specimens failed at N = 974. 850. and 882. respec-
ACt Materials Journal I July-August 1991
1200
1000
800
:9 soo
'g as 0 ...J
400
200
0 0.000 0.001 0.002 0.003 0.004
CMOD ( in. )
Fig. 6-Load-CMOD curves measured in monotonic loading oj notched beam specimens oj three sizes (1 in. = 25.4 mm; 1 Ib = 4.45 N)
0.5 -r--------------------,
d = 1.5 in.
0.4
d= 3 in.
d = 1.5 in.
0.3
!} :::::::::: ::::: 1 ~,' ------ --~-... .,....
..... _ .......... _ ........ _ ......... - •• 0
d =3 in.
'C -as 0.2
~~ 0.1 ~'"
0.0 ~--.-~-.-.,_,...,....,.....---.-~__._.........,r"TT'TT""-_.....---I 10 100 1000
N
Fig. 7-Measured and calculated growth oj the relative crack length with the number oj cycles, Jor al/ six specimens (two Jor each size)
tively. for the first group. and at N = 939. 1286. and 1083 for the second group. The units in Fig. 8 are in inches (25.4 mm) for a and in Iblin.l!2 (1.099 N/cm- J/2) for K I •
SIZE EFFECT IN PARIS LAW As demonstrated extensively for metals, fatigue frac
ture follows approximately the empirical Paris law 17•18
(3) .1a -- = .1N
393
, .'
D d,,1.5 in .• log C .. ·16.7 )I -1.0 • d,,3 in .• log C .-18.2 -1.0
n - 10.6 + d .. 6 in .• log C .-19.6
n - 10.6 -2.0 -2.0 -Z Z
<l <l - -CO CO
<l -3.0 <l ·3,0 - -CI CI 0 0
-4.0
~ 'T -4.0 d ....
-5.0 -f'-----.-L--r--.L.r--..,..--"""T---r---I -5.0 -f'-----.-L--,--...L.,---r--"""T---r---I 1.1 1.3 1.5 1.7 1.1 1.3 1.5 1.7
( a ) ( b )
Fig. 8-Logarithmic plots of crack length increment per cycle versus the stress intensity factor amplitude, with independent regression lines for specimens of three sizes (a in inches)
in which C and n are empirical material constants; n is nondimensional and, for reasons of physical dimensions, Kif = constant = fracture toughness (which is introduced merely for convenience, so that coefficient C would have the dimension of length. Symbol ~ in Eq. (3) denotes the differences taken over one cycle or a sufficiently small number AN of cycles, so that ~al AN would approximate the derivative dol dN. When the range of t.J(1 is very broad, the test results for metals deviate below the plot of Eq. (3) for very low t.J(1 and above it for very high t.J(/J 1 but for a narrow enough range Eq. (3) is good for metals.
According to the Paris law, the plot in Fig. 8 would have to be a single inclined straight line of slope n. This is seen to be true for each specimen of each size [see Fig. 8(a)] from the slope and intercept of the regression line of the data points for each specimen. One gets n =
11. 78, 10gC = - 40.2 (C given in inches) for the smallest size; n = 9.97, 10gC = - 36.0 for the medium size; and n = 9.27, loge - 34.8 for the largest size, with the overall average n = 10.57. The optimum fits by the straight lines of slope equal to this average slope are shown in Fig. 8. Fig. 8(b) shows the data for all six specimens (two of each size) compared to the same straight lines as in Fig. 8(a). These three fits are satisfactory, but there are great differences among the optimum C-values for the three lines for specimens of various sizes. So we must conclude that the Paris law is invalid for concrete in general.
This is not really a surprising result, in view of the well-known deviations of concrete behavior from linear elastic fracture mechanics (LEFM), whose applicability has been inherent to the previous applications of the Paris law. For monotonic loading, the first-order approximation of these deviations can be quite well de-
394
scribed in terms of the size-effect law23•24
aN = Bfu (1 + (3)-1/2, (3 = d I do (4)
Fig. 9(a) shows that B and do are empirical constants characterizing both the material properties and specimen geometry; J. is a measure of the tensile strength, e.g., fu = /,' = direct tensile strength; aN = nominal strength = nominal stress at maximum (ultimate) load Pw, aN = c"pjbd [Eq. (2)]; and do has the meaning of a transitional size (dimension) of the structure such that, for do >- do (i.e., (3 >- 1), failure is governed by LEFM while, for d ~ do ({3 ~ I), failure is governed by strength theory (or plasticity). For this reason, {3 is called the brittleness number. 21.25·27 Eq. (4), describing a transition from the size effect of plasticity (i.e., no size effect in strength) to the size effect of LEFM (i.e., the maximum possible size effect in strength), is only approximate, but the accuracy appears to be sufficient for the size range (ratio of minimum d to maximum d) up to about 1 :20.
Due to deviations from LEFM, the critical value Klc
of stress intensity factor KI , at which the crack can propagate at monotonic loading, is not constant but depends on specimen size and geometry. An unambiguous definition, independent of size and geometry, can be given only for the extrapolation of K lc to infinite size. 21.2l Such extrapolated value is the fracture toughness KIf representing a true material property; KIf = lim K lc for d --> 00. The corresponding fracture energy is Of = 10/£. (More generally, Of could be defined as the limit of the critical value of Rice's l-integral for d -->
00.) At infinite size, the specimen geometry cannot matter because (1) the fracture process zone occupies an infinitely smali fraction of the specimen volume so that
ACI Materials Journal I July-August 1991

0.2..,------------------.
Strength Criterion
0.0 +----------.. 2
-- --CD -Z -0.2 o -Q o
-C.4
B = 0.52
do = 2.86
x Tests of BaZant and Pfeiffer, 1987 o Present tests
- Size Effect Law
-0.6 +----.---.----r----,----.,.---r---l 0.2 0.6 1.0 1.4
log(d/d.)
( a )
1.2
infinite size 1.0
0.8
~ 0.6 --.2 ~
0.4 Klc = Kif J ~
1 + ~
0.2
0.0 0 2 4 6 8 10
~ = dId.
( b )
Fig. 9-Size-eJJect law Jor (a) nominal strength and (b) critical stress intensity Jactor
the whole specimen is in an elastic state, and (2) the near-tip asymptotic elastic field to which the fracture process zone is exposed at its boundary is the same for any specimen geometry.
To determine the size dependence of KIC' we first express Kle by substituting P = p. with p. = G.JJdl c. into Eq. (1). Then, substituting Eq. (4) for G, we obtain [Fig. 9(b)]
K _ B J. JTfdo j( Cio) _ K [_f3 _] 112
Ie - .J1+73 c. - If 1 + f3 (5)
in which KIf is a constant expressed as
(6)
where we recognized that KIf is the fracture toughness as defined previously because it represents the limit of Eq. (4) for d -+ 00 or f3 -+ 00. Eq. (6)21.2l means that the fracture toughness can be obtained from the size-effect law parameters B and do. These parameters, in turn, can be obtained if the values of (jj G N)2, calculated from the measured peak values p. of the curves in Fig. 6, are plotted versus d in Fig. 9(a). In this plot, the slope of the regression line is 1 I Bdo, and the vertical axis intercept is liB. Linear regression of the peak load values from the present monotonic fracture tests provided B = 0.520, do = 2.86 in. (72.6 mm), from which KIf = 73.S Ib/in. J
/2 (1.099 N/cm- J'2).
How should the size effect be manifested in fatigue fracture? The monotonic fracture represents the limiting case of fatigue fracture as tJ<1 -+ Kle at N -+ 1. If the value of tJ<1 is close to KIC' flal6.N must become very large whil~ KIc must at the same time agree with the size-effect law for monotonic loading. This can be
ACI Materials Journal I July-August 1991
modeled by replacing in the Paris law [Eq. (3)] the constant fracture toughness KIf with the size-dependent equivalent fracture toughness K/c given by Eq. (5). So a generalized, size-adjusted Paris law may be written as
(7)
The transition size do in the size-effect law [Eq. (3)] applies only to peak-load states at monotonic loading. For fatigue fracture, however, it is unclear whether the value of the transitional size do, needed to calculate Klc
[Eq. (5»), should be constant and the same as for monotonic fracture, or whether it should vary as a function of the ratio
(8)
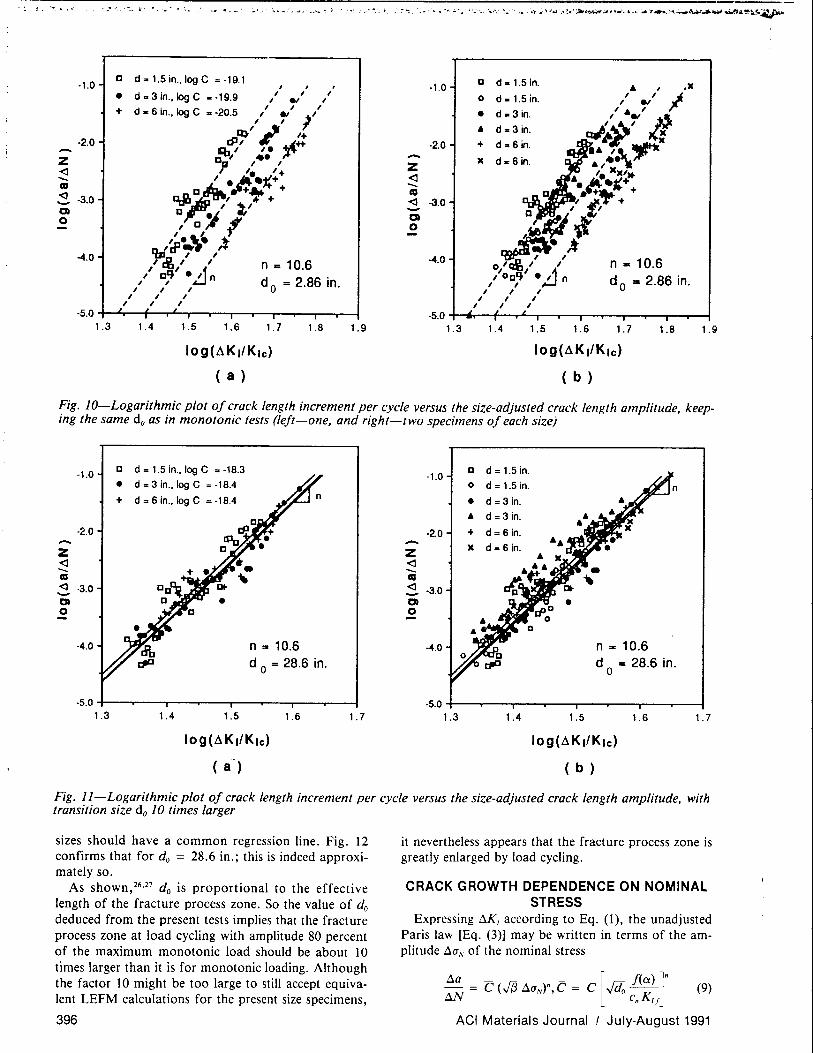
Assuming do = 2.86 in., the same as for monotonic fracture, the optimum fit of the present test data by the size-adjusted Paris law [Eq. (7)] is shown in Fig. lO(a) and (b) for the small, medium, and large specimens by the dashed straight lines. As can be seen, the fit has improved substantially compared to Fig. 8(a) and (b), but not enough. This finding means that the transitional size do cannot be constant but must depend on
PK' Assume that, for the present tests in which PK = 0.8,
the value of do is 28.6 in., i.e., 10 times larger. Then the optimum fit of the present test data becomes as shown by the three straight lines in Fig. ll(a) and (b). The closeness of fit is now satisfactory. (That the factor of 10 happens to achieve a good fit of the data is of course merely by chance.)
According to Eq. (7), if 10g(flal6.N) is plotted against 10g(M/ K/c), the data points for the specimens of all
395
~f:~~~~it;1~w.~.)t\~-!:"W;'!?(~1!:'l-.-"""»~·'·:"{~"·"~~~~,,:~~~~·;.#;:~r:.~":""'·'::~~·c·~".~"~-·-~~·~-~~'~.;.--~~~~~~~-:.:k .. ,:.,..~ .... ~ ... i':.:""'")"~~ .. ~~ .. ' ... _O""'--;_"_"''-'~~(~~~''''''''','' y :. .... .:~ '. ,";,
!. ' ... ,.' • ._ _" ~"' .-. -.... • .. 4". _ "
c d:l.5in.,logC =·19.1 0 d ~ 1.5in. ·1.0 I I I ·1.0 A I IX
• d .. 3in.,IogC =·19.9 , , ,
0 d .1.5in. , , , ., ,
I ., I' + d .. 6 in., log C = ·20.5
, , , d .. 3 in . ' A ' , ., l •
~~r II ' , Qlrt)' r '+ A d .. 3 in.
·2.0 'b/ I. ~++ ·2.0 + d .. 6 in.
A '~"" Z r;'1 •• - X d = 6 in. A,·· , , Z <I I '+ I Xx,
--- , ·A·-~+ <I A·Il_,,+M-CD ---<I c~ + .. + CD c • +¥ + - ·3.0 cJ!.~' of + <I -3.0 ' t + Q ' ~' - c " D ." Q AI 0 , c I 0
,{p __ \~ ,l -4.0 'Ui£' , -4.0 n - 10.6 , , ,
n = 10.6 o/~/ ~j' , , J ' ~ ., n do = 2.86 in.
,ooq. • I n do = 2.86 in. , I I , , I , , I , , I , , I , / ~' / I , ,
·5.0 ·5.0 1.3 1.4 1.5 1.6 1.7 1.8 1.9 1.3 1.4 1.5 1.6 1.7 1.8 1.9
log(L\KI/Kld log(L\KI/Kld
( a ) ( b )
Fig. lO-Logarithmic plot of crack length increment per cycle versus the size-adjusted crack length amplitude, keeping the same do as in monotonic tests (left-one, and right-two specimens of each size)
Z <I ---CD <I Q 0
·1.0
·2.0
·3.0
-4.0
D d = 1.5 in., log C = ·18.3 • d = 3 in., log C = ·18.4
+ d = 6 in., log C = ·18.4
n = 10.6 do = 28.6 in.
·5.0 +--.---,--.----r---.--"'T"'--r--~ 1.3 1.4 1.5
log(L\KI/Klc)
( it)
1.6 1.7
-Z <I --CD <I
01 0
·1.0
·2.0
·3.0
-4.0
D d = 1.5 in. o d = 1.5 in.
• d = 3 in.
A d = 3 in.
+ d = 6 in. x d = 6 in.
n = 10.6 do = 28.6 in.
·5.0 +---.---.----.-----,r---.----r---.--~ 1.3 1.4 1.5 1.6 1.7
Fig. II-Logarithmic plot of crack length increment per cycle versus the size-adjusted crack length amplitude, with transition size do 10 times larger
sizes should have a common regression line. Fig. 12 confirms that for do = 28.6 in.; this is indeed approximately so.
As shown,26.27 do is proportional to the effective length of the fracture process zone. So the value of do deduced from the present tests implies that the fracture process zone at load cycling with amplitude 80 percent of the maximum monotonic load should be about 10 times larger than it is for monotonic loading. Although the factor 10 might be too large to still accept equivalent LEFM calculations for the present size specimens,
396
it nevertheless appears that the fracture process zone is greatly enlarged by load cycling.
CRACK GROWTH DEPENDENCE ON NOMINAL STRESS
Expressing !1K/ according to Eq. (1), the unadjusted Paris law [Eq. (3)] may be written in terms of the amplitude .la" of the nominal stress
(9)
ACI Materials Journal I July·August 1991
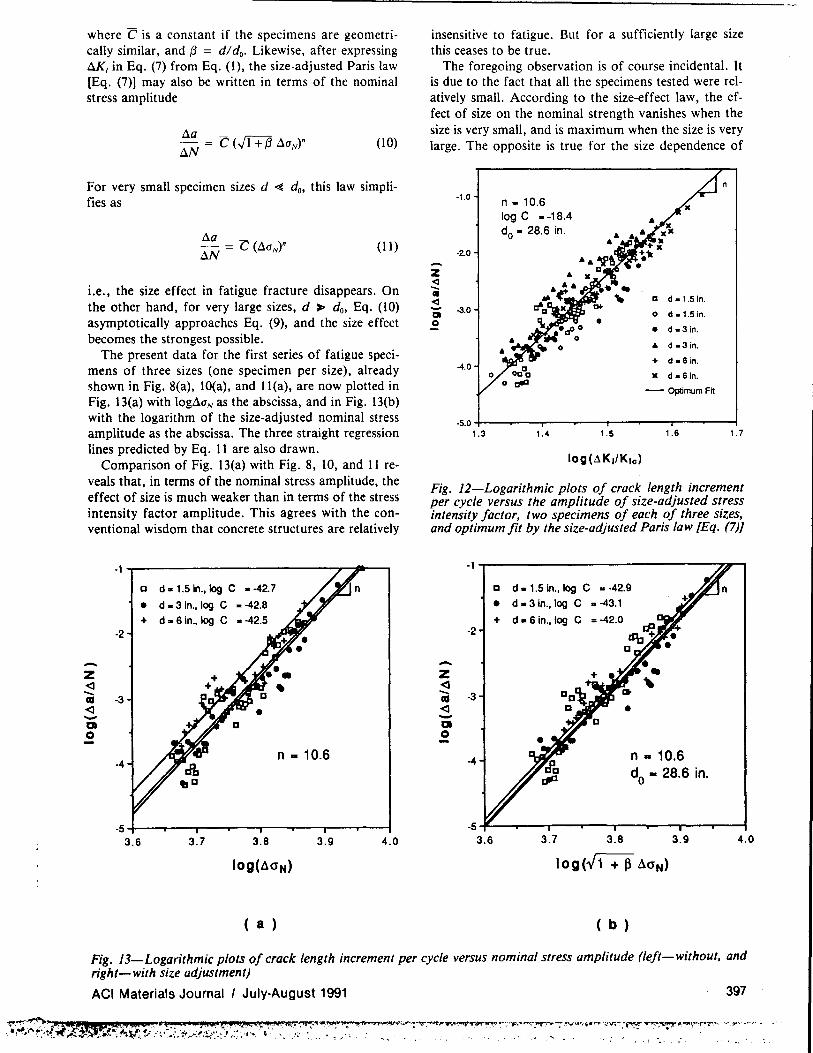
where C is a constant if the specimens are geometrically similar, and {3 = d/ do. Likewise, after expressing AK/ in Eq. (7) from Eq. (I), the size-adjusted Paris law [Eq. (7)) may also be written in terms of the nominal stress amplitude
(to)
For very small specimen sizes d ~ do, this law simplifies as
fla
IlN (11)
i.e., the size effect in fatigue fracture disappears. On the other hand, for very large sizes, d ~ do, Eq. (10) asymptotically approaches Eq. (9), and the size effect becomes the strongest possible.
The present data for the first series of fatigue specimens of three sizes (one specimen per size), already shown in Fig. 8(a), to(a), and II(a), are now plotted in Fig. 13(a) with 10gfluN as the abscissa, and in Fig. 13(b) with the logarithm of the size-adjusted nominal stress amplitude as the abscissa. The three straight regression lines predicted by Eq. 11 are also drawn.
Comparison of Fig. 13(a) with Fig. 8, to, and 11 reveals that, in terms of the nominal stress amplitude, the effect of size is much weaker than in terms of the stress intensity factor amplitude. This agrees with the conventional wisdom that concrete structures are relatively
-Z <l -
·1~----------------------~~'--'
·2
D d.1.5in.,1og C --42.7
• d • 3 in., log C • -42.8
+ d • 6 in., log C • -42.5
as -3 <l -D o
n - 10.6 -4
-51---~---r---r--~---'---.r---r---;
3.6 3.7 3.8 3.9 4.0
( a )
insensitive to fatigue. But for a sufficiently large size this ceases to be true.
The foregoing observation is of course incidental. It is due to the fact that all the specimens tested were relatively small. According to the size-effect law, the effect of size on the nominal strength vanishes when the size is very small, and is maximum when the size is very large. The opposite is true for the size dependence of
Z <l -• <l --CI 0
·1.0
-2.0
-3.0
4.0
n - 10.6 log C --18.4 do - 28.6 in.
II d .1.5 in.
o d .1.5 in.
• d. 3 in.
A d.3 in.
+ d.6 in.
K d.8in.
- Optimum Fit
n
-5.0 +--....,....--r---.--r--..,......--r--........ --! , .3 1.4 1.5 1.6 1.7
Fig. 12-Logarithmic plots of crack length increment per cycle versus the amplitude of size-adjusted stress intensity factor, two specimens of each of three sizes, and optimum fit by the size-adjusted Paris law [Eq. (7)]
-1~--------------------------~ro
-Z <l
-2
as -3 <l -Q o
c d _ 1.5 in., log C as -42.9
• d - 3 in., log C '" -43.1
+ d • 6 In., log C
n - 10.6 do - 28.6 in.
-5~--~---r---T---,--~~--r---~--~
3.6 3.7 3.8 3.9 4.0
( b )
Fig. 13-Logarithmic plots of crack length increment per cycle versus nominal stress amplitude (left-without, and right-with size adjustment)
ACI Materials Journal I July-August 1991 397

the stress intensity factor required for fracture growth [Eq. (4) and (7) and Fig. 7]. Thus, according to the present theory, the size effect in Fig. 13 should become very large, and in Fig. 8, 10, and 11 very small, when the specimen or structure is very large. For large structures, fatigue is better characterized in terms of the stress intensity factor amplitude, while for small structures, fatigue is better characterized in terms of the nominal stress amplitude. [Note that a good absolute measure of structure size is its brittleness number-the structure is very large if {j ,. 1 and very small if {j <c 1 (Reference 21)].
Recall from Fig. 8, 10, and 11 that the larger the size, the smaller the crack length increment per cycle for the same stress intensity factor amplitude. For the same nominal stress amplitude, though, the larger the size, the larger the crack length increment per cycle (see Fig. 13). The last property is the same as in monotonic fracture-a size effect in the usual sense of a weakening of the structure with an increase of its size.
CRACK LENGTH VERSUS NUMBER OF CYCLES It is also interesting to integrate Eq. (3). Replacing ~
with d, substituting do = dr!ia, and separating the variables gives N = I<Mq-"da dole. Then, by substituting Eq. (1), the following is obtained
N = (dolC)(b J(JIP)" I [fta))""da (12)
Numerical integration yields the three curves of the relative crack length a versus the number of cycles plotted in Fig. 7 for the three specimen sizes. As can be seen, these curves agree with the measurements relatively well. This again confirms that fracture mechanics is applicable, despite the fact that the size effect in terms of the nominal stress is quite mild in the present tests.
CONCLUSIONS 1. The Paris law for fatigue fracture is applicable to
concrete. But for structures with macroscopic (large) cracks this is so only for one size of the specimen or structure or, asymptotically, for very large sizes. Otherwise', a modification of this law is required.
2. The Paris law may be adjusted for the size effect by combining it with the size-effect law proposed23 for nominal strength in monotonic loading. This leads to a law in which the crack length increment per cycle is a power function of the amplitude of a size-adjusted stress intensity factor.
3. The size-adjusted Paris law is corroborated by the measurements of crack length growth due to fatigue loading of repeatedly loaded notched specimens of size range 1 :4. The calculated growth of the crack length with the number of cycles aiso agrees with tests.
4. The fatigue crack growth can also be represented as a function of the nominal stress amplitude and the brittleness number. In the latter form, the size effect vanishes for very small structures, while in terms of the stress intensity factor amplitude it vanishes for very large structures. For sufficiently large structures, fa-
398
tigue is better characterized in terms of the stress intensity factor amplitude, whereas for small structures fatigue is better characterized in terms of the nominal stress amplitude.
5. The transitional size, separating predominantly brittle failures from predominantly ductile (plastic or strength-governed) failures, appears to be much larger (roughly 10 times larger) for cyclic loading than it is for monotonic loading. Consequently, the brittleness number for a structure under cyclic loading is much smaller than it is for monotonic loading.
6. It must be emphasized that the scope of the present tests has been insufficient to check whether the foregoing conclusions are also valid when: (1) the stress intensity factor amplitude is varied; (2) the lower limit of the cyclic load is not zero; (3) the number of cycles per minute is varied; and (4) different specimen geometries and notch lengths are considered.
ACKNOWLEDGMENT Partial financial support has been received for development of the
theory from AFOSR Contract F49620-87·C-0030DEF with Northwestern University, and for experiments from NSF Science and Technology Center for Advanced Cement-Based Materials at Northwestern University (NSF Grant DMR 880-8432).
REFERENCES I. Kanninen, M. F., and Popelar, C. H., Advanced Fracture Me
chanics. Oxford University Press, 1985. 2. Broek, D., Practical Use of Fracture Mechanics. Kluwer Aca
demic Publishers, Boston, 1988. 3. Barsom, J. M., and Rolfe, S. T., Fracture and Fatigue Control
in Structures: Applications of Fracture Mechanics, Prentice-Hall, Englewood Cliffs, 1987.
4. Lawn, B. R.; Anstis, G. R.; Dabbs, T. P.; and Marshall, D. B., "Fatigue Analysis of Brittle Materials Using Indentation Flaws .1. General Theory," Journal Of Materials Science, V. 16, No. 10, 1981. pp. 2846-2854.
5. Cook, R. F.; Fairbanks, C. J.; and Lawn, B. R., "Microstructure-Strength Properties in Ceramics .1. Effect of Crack Size on Toughness, and .2. Fatigue Relations," Journal American Ceramic Society, V. 68, No. II, 1985, pp. 604-623.
6. Ritchie, R. 0., "Mechanisms of Fatigue Crack-Propagation in Metals, Ceramics and Composites-Role of Crack Tip Shielding," Materials Science and Engineering, V. 103, No. I, 1988, pp. 15-28.
7. Nordby, Gene M., "Fatigue of Concrete-A Review of Research," ACI JOURNAL, Proceedings V. 55, No.2, Aug. 1958. pp. L91-219.
8. Murdock, John W., and Kesler, Clyde E., "Effect of Range of Stress on Fatigue Strength of Plain Concrete Beams," ACI JOURNAL, Proceedings V. 55, No.2, Aug. 1958, pp. 221-231.
9. Stelson, Thomas E., and Cernica, John N., "Fatigue Properties of Concrete Beams," ACI JOURNAL, Proceedings V. 55, No.2, Aug. 1958, pp. 255-259.
10. Hilsdorf, Hubert K., and Kesler, Clyde E., "Fatigue Strength of Concrete under Varying Flexural Stresses," ACI JOURNAL, Proceedings V. 63, No. 10, Oct. 1966, pp. 1059-1075.
II. Kaplan, M. F., "Flexural and Compressive Strength of Concrete as Affected by the Properties of Concrete Aggregates," ACI JOURNAL, Proceedings V. 55, No. II, May 1959, pp. 1193-1208.
12. Baluch, M. H.; Qureshy, A. B.; and Azad, A. K., "Fatigue Crack Propagation in Plain Concrete," Fracture of Concrete and Rock, SEMIRILEM International Conference, Shah, S. P .• and Swartz, S. E., Eds. (Houston, June 1987). Springer-Verlag, New York, 1989, pp. 80-87.
13. Perdikaris, P. c., and Calomino. A. M., "Kinetics of Crack Growth in Plain Concrete," Fracture of Concrete and Rock,
ACI Materials Journal I July-August 1991

SEMIRILEM International Conference, Shah, S. P., and Swartz, S. E., Eds. (Houston, June 1987), Springer-Verlag, New York, 1989, pp. 64-69.
14. Suresh, S.; Tschegg, E. K.; and Brockenbrough, J. R., "Fatigue Crack Growth in Cementitious Materials under Cyclic Compressive Loads," Cement and Concrete Research, V. 19, No.5, Sept. 1989, pp. 827-833.
15. Suresh, S., "Fatigue Crack Growth in Cementitious Solids under Cyclic Compression: Theory and Experiments," Fracture of Concrete and Rock: Recent Developments, Elsevier Applied Science, London and New York, Sept. 1989, pp. 162-172.
16. Zhang, Binsheng; Zhu, Zhaohung; and Wu, Keru, "Fatigue Rupture of Plain Concrete Analyzed by Fracture Mechanics," Fracture of Concrete and Rock, SEMI RILEM International Conference, Shah, S. P., and Swartz, S. E., Eds. (Houston, June 1987), SpringerVerlag, New York, 1989, pp. 58-63.
17. Paris, P. c.; Gomez, M. P.; and Anderson, W. E., "Rational Analytic Theory of Fatigue," Trend in Engineering, V. 13, No. I, Jan. 1961.
18. Paris, P. c., and Erdogan, F., "Critical Analysis of Propagation Laws," Transactions of ASME, Journal of Basic Engineering, V. 85, 1963, pp. 528-534.
19. Swartz, S. E., and Go, C. G, "Validity of Compliance Calibration to Cracked Beams in Bonding," Journal of Experimental Mechanics, V. 24, No.2, June 1984, pp. 129-134.
20. Perdikaris, P. C.; Calomino, A. M.; and Chudnovsky, A., "Effect of Fracture on Fracture Toughness of Concrete," Journal of Engineering Mechanics, V. 112, No.8, Aug. 1986, pp. 776-791.
ACI Materials Journal I July-August 1991
21. Bafant, Zden~k P., and Pfeiffer, Phillip A., "Determination of Fracture Energy from Size Effect and Brittleness Number," ACI Materials Journal, V. 84, No.6, Nov.-Dec. 1987, pp. 463-480.
22. Gettu, R.; Bafant, Z. P.; and Karr, M. E., "Fracture Properties and Brittleness of High Strength Concrete," Report No. 89-IO/B627f, Center for Advanced Cement-Based Materials, McCormick School of Engineering and Applied Science, Northwestern University, Oct. 1989.
23. Bafant, Z. P., "Size Effect in Blunt Fracture: Concrete, Rock, Metal," Journal of Engineering Mechanics, ASCE, V. 110, No.4, Apr. 1984, pp. 518-535.
24. Bafant, Z. P., "Mechanics of Distributed Cracking," Applied Mechanics Reviews, V. 39, No.5, May 1986, pp. 675-705.
25. Bafant, Zden~k P., "Fracture Energy of Heterogeneous ~aterials and Similitude," Fracture of Concrete and Rock, SEMIRILEM International Conference, Shah, S. P., and Swartz, S. E., Eds. (Houston, June 1987), Springer-Verlag, New York, 1989, pp. 229-241.
26. Bafant, Z. P., and Kazemi, M. T., "Determination of Fracture Energy, Process Zone Length and Brittleness Number from- Size Effect, with Application to Rock and Concrete," Report No. 88-7/498d, Center for Concrete and Geomaterials, Technological Institute, Northwestern University, July 1988.
27. Bafant, Z. P., and Kazemi, M. T., "Size Effect in Fracture of Ceramics and Its Use to Determine Fracture Energy and Effective Process Zone Length," Report No. 89-6/498s, Center for Advanced Cement-Based Materials, McCormick School of Engineering and Applied Science, Northwestern University, June 1989.
399