acidication: eld and laboratory response of halimeda to ocean€¦ · in this pilot study, we...
TRANSCRIPT

Biogeosciences Discuss., 6, 4895–4918, 2009www.biogeosciences-discuss.net/6/4895/2009/© Author(s) 2009. This work is distributed underthe Creative Commons Attribution 3.0 License.
BiogeosciencesDiscussions
Biogeosciences Discussions is the access reviewed discussion forum of Biogeosciences
Response of Halimeda to oceanacidification: field and laboratoryevidenceL. L. Robbins1, P. O. Knorr1, and P. Hallock2
1US Geological Survey, 600 4th St. South, St. Petersburg, FL, 33701, USA2University of South Florida, College of Marine Science, St. Petersburg, FL, 33701, USA
Received: 31 March 2009 – Accepted: 2 April 2009 – Published: 12 May 2009
Correspondence to: L. L. Robbins ([email protected])
Published by Copernicus Publications on behalf of the European Geosciences Union.
4895
Abstract
Rising atmospheric pCO2 levels are changing ocean chemistry more dramatically nowthan in the last 20 million years. In fact, pH values of the open ocean have decreasedby 0.1 since the 1800s and are predicted to decrease 0.1–0.4 globally in the next90 years. Ocean acidification will affect fundamental geochemical and biological pro-5
cesses including calcification and carbonate sediment production. The west Floridashelf is a natural laboratory to examine the effects of ocean acidification on arago-nite production by calcareous green algae. Scanning electron microscopy (SEM) ofcrystal morphology of calcifying organisms reveals ultrastructural details of calcifica-tion that occurred at different saturation states. Comparison of archived and recent10
specimens of calcareous green alga Halimeda spp. from the west Florida shelf, demon-strates crystal changes in shape and abundance over a 40+ year time span. Halimedacrystal data from apical sections indicate that increases in crystal concentration anddecreases in crystal width occurred over the last 40+ years. Laboratory experimentsusing living specimens of Halimeda grown in environments with known pH values were15
used to constrain historical observations. Percentages of organic and inorganic carbonper sample weight of pooled species did not significantly change. However, individualspecies showed decreased inorganic carbon and increased organic carbon in more re-cent samples, although the sample sizes were limited. These results indicate that theeffect of increased pCO2 and decreased pH on calcification is reflected in the crystal20
morphology of this organism. More data are needed to confirm the observed changesin mass of crystal and organic carbon.
1 Introduction
Ocean pH and carbonate concentrations are declining, and fundamental chemical bal-ances are changing as a result of ocean CO2 uptake (Kleypas and Langdon, 2006;25
Doney et al., 2009). Ocean acidification is being studied widely to understand the
4896

magnitude of changes that are occurring both in physical environments and in biologi-cal systems. The impacts of recent (0.1 pH units over the last two centuries) and futureshifts in seawater carbonate chemistry on biocalcification and survival rates of marineorganisms are pressing topics that require both field and experimental study.
Critical questions include whether (and which) calcifying organisms can adapt to5
decreasing pH and saturation state. To date, corals, coccolithophorids, pteropods, andshallow-dwelling species of coralline red algae have been shown to reduce calcificationrates with decreases in pH (Feely et al., 1988; Fabry, 1990; Langdon et al., 2003;Kuffner et al., 2008) and have been predicted to respond negatively as a result of oceanacidification (Orr et al., 2005). However, the impacts on many organisms have not been10
established. Some results have been equivocal. Studies on coral calcification recordsfrom the previous decades to centuries have found little to no evidence of changes incalcification rates in response to changing ocean chemistry (Lough and Barnes, 1997,2000; Bessat and Buigues, 2001). Some photosynthetic organisms actually benefit inlower pH seawater (Langer et al., 2006; Iglesias-Rodriguez et al., 2008) by increasing15
both calcifying and noncalcifying carbon fixation rates (Doney et al., 2009). Therefore,while it is clear that some organisms could be negatively impacted, others may actuallybenefit from some degree of ocean acidification. The net effect however, will likelychange the functioning of many marine and coastal ecosystems.
Calcification in corals is predicted to decrease by 30±18% within 30–50 years (ISRS,20
2008). Will calcareous green algae respond similarly?
1.1 Halimeda responses
Calcareous green algae have demonstrated their versatility in adaptation through theirrange in habitat from tropical to subtropical/temperate environments and depth-rangesfrom shallow water to depths in excess of 110 m. One of the most important and well25
studied genera, Halimeda (Halimedaceae, Chlorophyta) (Fig. 1), has been recognizedin the geologic record as prolific sediment producers, in some cases comprising themajor portion of reef sands and nearshore algal banks (Milliman, 1974; Neumann and
4897
Land, 1975; Littler, 1976; Jensen et al., 1985). The genus has been documented in theCretaceous (Hillis-Colinvaux, 1980), and taxa that are either related or identical havebeen described in the Tethyan Upper Triassic (Flugel, 1988). Previous work indicatesthat Halimeda fragments contribute greatly to mass of carbonate sediment in manyatoll-type environments (Hillis-Colinvaux, 1980).5
Calcareous green algae such as Halimeda and Udotea appear to utilize the CO2 pro-duced by calcification to enhance photosynthesis and consequently primary productiv-ity (Borowitzka and Larkum, 1976; Reiskind et al., 1988), indicating that their ratesof photosynthesis can be CO2 limited. If this relationship holds, increases in pCO2of seawater may enhance primary productivity of these organisms by making more10
CO2 available for photosynthesis, but likely at the expense of calcification. For exam-ple, some taxa such as Halimeda discoidea Decaisne have deep water varieties (e.g.,v. platyloba Borgeson) with segments even larger and less calcified than typical H. dis-coidea (Taylor, 1960). James et al. (1999) noted weakly calcified, fleshy morphologiesof Halimeda from depths of 35–50 m on the southwest Australian shelf, where sedi-15
ments had a distinctive cool-water character, though larger foraminifers were abundantand some zooxanthellate corals were present. On the other hand, prolific Halimeda bio-herms occur at similar depths in the Sunda Straits, Nicaragua Rise, and Great BarrierReef lagoon where clear, oligotrophic surface water permits sufficient light penetration,and local hydrodynamics jet CO2 and nutrient-charged uppermost thermocline waters20
onto those shelves (Hallock, 2001 and references therein).How the calcareous green algae have responded in recent decades as ocean chem-
istry has begun to change in response to rising atmospheric CO2 and how they willrespond to changing seawater conditions are still unknown. Our study combines a ret-rospective look over 40 years at calcification in Halimeda with laboratory experiments25
to simulate predicted carbonate chemistry under which calcification will occur in thefuture. This approach allows evaluation of how ocean acidification has affected thisgreen alga and provides a tool for predicting future changes.
4898

In this pilot study, we analyzed two species of Halimeda from archived samples col-lected in the 1960s, 1970s and 1980s, with specimens collected in 2007–2008, todetermine if crystal and ultrastructural changes could be observed over the ∼40 yeartime span. In addition, laboratory experiments were performed in which adult Halimedafrom the west Florida shelf (WFS) were transplanted and grown in laboratory tanks at5
lower pH levels to document crystallographic change.
2 Materials and methods
2.1 Historical samples
Apical segments from 22 dried, archived Halimeda samples collected in the 1960sthrough 2008 were prepared for scanning electron microscopy (SEM). The samples10
came from either personal collections of PH or from the University of South FloridaHerbarium Collection. Locations of origin of these samples were used to inform collec-tion of recent living samples. Notably, we used samples from the west Florida shelf, offTampa Bay, Florida.
2.2 Laboratory experiments15
Specimens of live Halimeda spp. (Fig. 1a) were collected from field sites on the WFS(Fig. 2) or purchased from a dealer. H. tuna and H. opuntia were used for the labo-ratory experiments because of their availability. The specimens were obtained fromsites with a pH of 8.1. Apical and basal segments (Fig. 1b) used as controls were cutfrom Halimeda plants before the experiments and were rinsed in distilled water for ap-20
proximately one minute, dried and analyzed via SEM. Only apical data are reportedhere.
Four adult living Halimeda specimens were cleared of visible epiphytes and epizoa.The plants were immersed for 45 min in an Alizarin Red solution, thereby staining the
4899
thalli and facilitating visual identification of new growth. Plants were then rinsed withtank water and transferred into sealed artificial-seawater 37.8 liter aquaria containingautoclaved aragonite sand substrate (Fig. 3). A compact fluorescent light fixture wasinstalled ∼12 cm above the sealed acrylic cover. The fixture consisted of two 130 Wdaylight bulbs (6700 K and 10 000 K), two 130-W actinic bulbs (420 nm and 460 nm),5
and four LED lunar lights. An automatic timer was used to keep the lights on from07:00 to 19:00 daily. The tank was maintained at the following parameters: pH=7.5S=35.0; T=25.1–26.3◦C. A CO2 injection system was attached to the tank, consistingof an Aquacontroller 3 controller/monitor (AC3), temperature and pH probes, CO2 tankand bubble counter, CO2 reactor, and a water pump to maintain the parameters. CO210
was bubbled through the aquaria to adjust the seawater pH from recent levels (pH 8.1)to pH 7.5. Specimens were then allowed to grow for a period of 3 weeks. During thistime, additional apical sections were formed and subsequently sampled, rinsed in wa-ter from Millipore Elix 10 Water Purification System for less than one minute, driedand prepared for SEM (see below). The glass pH electrode was calibrated to the total15
hydrogen ion concentration pH scale before initially injecting CO2 and weekly there-after using a two-point calibration with pH 7.00 Na2HPO4/KH2PO4 buffer and pH 10.00NaHCO3/Na2CO3 buffer. The accuracy of the calibration was confirmed spectrophoto-metrically (Dickson et al., 2007).
2.3 Preparation of apical segments20
Living specimens of Halimeda sp. were collected, rinsed briefly in fresh water, and pre-pared for SEM. Apical segments from both archived and recently collected sampleswere removed from a thallus and placed on a glass plate under a stereomicroscope.Longitudinal sections of the segment were cut from near the center using a scalpel andthe section mounted on an SEM stub covered with double-stick tape. When available,25
a second segment was removed from near the base of the frond. Specimens weresputter coated with gold-palladium for approximately 6 min using a Hummer 6.2 Sput-tering system and imaged with a Hitachi S-3500N Variable Pressure scanning electron
4900

microscope. For comparative purposes, utricles were located on the segments and,with split screen, a close-up of interutricle crystals was scanned along with a lower-magnification location of the scan. Photomicrographs were taken of the segments.
2.4 Crystal counts and size data
All SEM photomicrographs of Halimeda were analyzed for crystal abundances and5
widths of crystals using ImageJ freeware. A 5µm×5µm or 10µm×10µm area wasrandomly selected, and total crystal counts were performed three times per micropho-tograph and averaged. The three data sets were then averaged. Widths of crystalswere measured using the ImageJ “measuring tool” calibrated to the micrometer scalebar embedded in the image file by the SEM. More than 30 crystals were randomly10
selected and measured within each square and the measurements averaged. Theresulting data set was then averaged for each photomicrograph.
2.5 CaCO3 and organic analyses
Total organic, CaCO3, and organic carbon of H. discoidea and H. incrassata platelets(1960–2008) were analyzed using a Lindberg/Blue Mini-Mite Tube Furnace TF55035A15
attached to a CM 5015 Coulometer. Apical segments from a plant were combined toachieve approximately 10 mg per sample and ground using a mortar and pestle. Analiquot was weighed for total organic carbon and combusted for approximately 5 min,and CO2 evolved was measured coulometrically. An additional aliquot was taken forinorganic carbon analysis and acidified using perchloric acid, and the CO2 evolved was20
measured coulometrically. This approach measured the average mass of aragoniteand organic carbon per normalized platelet. Because of the destructive nature of thisanalysis, limited amounts of sample were available for archived material.
4901
3 Results and discussion
3.1 Historical data
Scanning electron microscopy of apical platelets from all specimens demonstrated arange of crystal morphologies, from thick blocky forms to longer thinner blades. How-ever, each species showed crystal sizes and abundances specific to themselves. Our5
data showed that Halimeda collected from different locations demonstrated significantcrystal-width differences. For example, Fig. 4 shows that within the species Halimedaincrassata, crystal width and abundance differences were observed between apicalsegments from South Florida, Belize, and those collected on the WFS, corroboratingfindings of Hillis-Colinvaux (1980) regarding interlocality variability.10
Image analyses of crystals from apical sections of Halimeda spp. from the WFSshowed a trend of more abundant crystals in samples taken in 2007 and 2008 thanthose from older samples from the 1960s and 1970s (Fig. 5a–d). Further, crystalsdemonstrated an overall decrease of width in more recent specimens collected (Fig. 6)compared to those from the 1960’s. Specifically, apical crystals in Halimeda discoidea15
from the 1990’s and 2000 showed ∼48% decrease in width compared to those from the1960s, having a mean width of 0.253µm, versus a mean width of 0.486µm, respec-tively. Halimeda incrassata showed a more dramatic width decrease of ∼70%, withaverage width of 0.247µm in recent samples compared to average width of 0.821µmfrom the 1960s.20
In terms of crystal abundance (i.e., crystals per unit area), H. discoidea from theWFS showed a 39% increase in crystal abundance in apical platelets between 1966and 2008. Halimeda incrassata, again, showed a more dramatic increase than H. dis-coidea, with 62% crystal increase from 1971 to 2008.
In H. incrassata specimens, inorganic carbon, as a percentage of sample weight,25
decreased and organic carbon increased in more recent samples as compared toolder samples, while H. discoidea showed much smaller differences in both param-eters (Fig. 7). These results are intriguing but not statistically significant because of
4902

the limited number of samples available for analyses.
3.2 Laboratory experiments
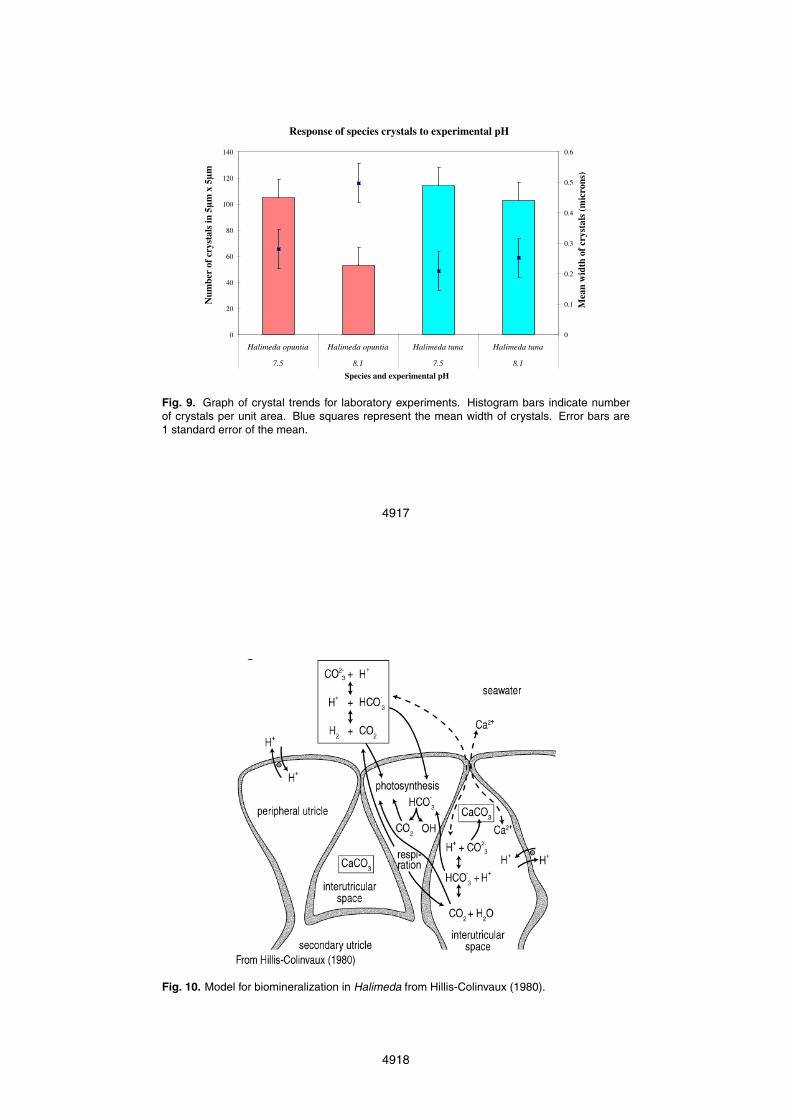
Laboratory results corroborate data from archived material: apical sections of seg-ments grown in pH 7.5 water have thinner crystal widths than those grown in pH 8.1water (Figs. 8a–d and 9). Halimeda opuntia crystals grown in pH 7.5 water were ∼43%5
smaller, having a mean width of 0.281µm compared to a mean width of 0.497µm forcrystals grown in pH 8.1 water. Halimeda tuna crystals grown in pH 7.5 water were∼18% smaller than those grown in pH 8.1, having a mean width of 0.209µm com-pared to a mean width of 0.253µm. Conversely, counts of crystals per unit area (pointdensity) of Halimeda opuntia grown in pH 7.5 water, were ∼66% greater than crystals10
grown in pH 8.1 water, while point density of Halimeda tuna crystals grown in pH 7.5water was 11% greater than crystals grown in pH 8.1 water.
4 Discussion
Extensive research on Halimeda has documented structure, crystallography, andchemistry of the organism (Hillis-Colinvaux, 1980; Jensen et al., 1985; Macintyre and15
Reid, 1995; Ries, 2005). Deposition of aragonite within interutricular spaces (Fig. 10)has been described as a physiological process (Hillis-Colinvaux, 1980; Borowitzka,1982a, b) that occurs through cellular metabolic processes and photosynthetically in-duced precipitation, i.e., the removal of carbon dioxide and bicarbonate during pho-tosynthesis raises pH and carbonate saturation to levels where CaCO3 precipitation20
can occur (Jensen et al., 1985). Indeed, this relationship between calcification andphotosynthesis has been demonstrated by a number of researchers (Goreau, 1963;Stark et al., 1969; Borowitzka and Larkum, 1976; Jensen et al., 1985). De Beer andLarkum (2001) recognized that calcification in H. discoidea is not regulated by the algabut is a consequence of pH increase during photosynthesis.25
4903
Calcification studies on H. tuna and H. cylindrical have shown that aragonite crys-tals are deposited in the intercellular spaces (Borowitzka and Larkum, 1976), sepa-rated from seawater by the utrical layer. It has been suggested that during photosyn-thesis the diffusion barrier allows the development of a microenvironment with a highpH suitable for aragonite precipitation. Thus, calcification is thought to be regulated5
by the morphology of the algae, the uptake of CO2 by photosynthesis, and the nucle-ation sites on the tissue (Borowitzka, 1989; De Beer and Larkum, 2001). De Beer andLarkum (2001) determined that photosynthesis, respiration, and the light-driven protonpump determine the pH of the intercellular spaces and that the calcification of H. dis-coidea is directly coupled to that localized pH; thus, they predicted that acidification10
of seawater would decrease calcification (De Beer and Larkum, 2001). On the otherhand, Reiskind et al. (1988) showed that Halimeda demonstrates increased primaryproductivity with elevated levels of CO2.
Hillis-Colinvaux (1980) reported that the size and numbers of crystals in the seg-ments vary with species, age of the segment, and from site to site. To constrain poten-15
tial differences, our study compared only the apical segments of species of Halimedaplants from a relatively localized area of the west Florida shelf. Laboratory experimentsconfirm trends seen in the historical record of apical segments, suggesting that thecrystal width and amounts of crystals may be associated with the chemistry of theseawater. Our data showed decreased crystal width and more abundant crystals with20
decreasing pH. This observation suggests that crystallization events may be initiatedand terminated more frequently with increased pCO2.
Some questions that still remain include: Are there more aragonitic plates producedwith increasing pCO2? Are the plates weaker with increasing pCO2? Do they morereadily become etched in lower saturation states? How do the organic substrates re-25
spond? Is there a linear size and density gradient in crystal morphologies associatedwith seawater pH between 8.1 and 7.5? What is the impact of decreased crystal sizeand increased abundance on taphonomy and sediment budgets?
4904

5 Conclusions
1. Halimeda species showed species specific differences in crystal morphologies(width and crystal abundances) and responses to changing pH/pCO2.
2. Field samples of species demonstrated changes in crystal morphologies over atime frame of <50 years.5
3. Similar trends were observed in laboratory studies in which pH was loweredthrough addition of CO2. Species showed more and thinner crystals per unitarea.
4. The thinner, more abundant crystals observed under reduced pH conditions indi-cates that crystallization events may be initiated and terminated more frequently10
with increased pCO2.
Acknowledgements. This work was partially funded by the USGS Coastal and Marine GeologyProgram. We gratefully acknowledge the help of Sherwood Liu, University of South Florida,for carbon analyses and Tony Greco, University of South Florida, for SEM support. Thanks tothe University of South Florida Herbarium for access of archived specimens. Any use of trade15
names is for descriptive purposes only and does not imply endorsement by the US Government.
References
Bessat, F. and Buigues, D.: Two centuries of variation in coral growth in a massive poritescolony from Moorea (French Polynesia): A response of ocean-atmosphere variability fromsouth central Pacific, Palaeogeogr. Palaeocl., 175, 381–392 2001.20
Borowitzka, M. A. and Larkum, A. W. D.: Calcification in the green alga Halimeda, III. Thesources of inorganic carbon for photosynthesis and calcification and a model of the mecha-nism of calcification, J. Exp. Bot., 27, 879–893, 1976.
Borowitzka, M. A.: Mechanisms in algal calcification, Progress in Phycological Research, 1,137–177, 1982a.25
4905
Borowitzka, M. A.: Morphological and cytological aspects of algal calcification, Int. Rev. Cytol.,74, 127–162, 1982b.
Borowitzka, M. A.: Carbonate calcification in algae-initiation and control, Chemical Perspec-tives on Biomineralization, 63–94, 1989.
De Beer, D. and Larkum, A.: Photosynthesis and calcification in the calcifying algae Halimeda5
discoidea studied with microsensors, Plant Cell Environ., 24, 1209–1217, 2001.Dickson, A. G., Sabine, C. L., and Christian, J. R. (Eds.): Guide to best practices for ocean CO2
measurements, PICES Special Publication, 3, 191 pp., 2007.Doney, S., Fabry, V., Feely, R., and Kleypas, J.: Ocean acidification: The other CO2 problem,
Annual Review of Marine Science, 1, 169–192, 2009.10
Fabry, V.: Shell growth rates of pteropod and heteropod mollusks and aragonite production inthe open ocean-implications for the marine carbonate system, J. Mar. Res., 48, 209–222,1990.
Feely, R. A., Byrne, R. H., Acker, J. G., Betzer, P. R., Chen, C. T., Gendron, J. F., and Lamb,M. F.: Winter-summer variations of calcite and aragonite saturation in the northeast Pacific,15
Mar. Chem., 25, 227–241, 1988.Flugel, E.: Halimeda: Paleontological record and palaeoenvironmental significance, Coral
Reefs, 6, 123–130, 1988.Goreau, T. E.: Calcium carbonate deposition by coralline algae and corals in relation to their
roles as reef builders, Ann. N.Y. Acad. Sci., 109, 127–167, 1963.20
Hallock, P.: Coral reefs, carbonate sedimentation, nutrients, and global change, in: The his-tory and sedimentology of ancient reef ecosystems, edited by: Stanley, G. D., Kluwer Aca-demic/Plenum Publishers, 387–427, 2001.
Hillis-Colinvaux, L.: Ecology and taxonomy of Halimeda: Primary producer of coral reefs, Adv.Mar. Biol., 1–312, 1980.25
Iglesias-Rodriguez, M. D., Halloran, P. R., Rickaby, R., Hall, I. R., Colmenero-Hidalgo, E., Git-tins, J. R., Green, D. R. H., Tyrrell, T., Gibbs, S. J., von Dassow, P., Rehm, E., Armbrust, E.V., and Boessenkool, K. P.: Phytoplankton calcification in a high-CO2 world, Science, 320,336–340, 2008.
ISRS: Coral reefs and ocean acidification, International Society for Reef Studies, Briefing Paper30
5, 9 pp., 2008.James, N. P., Collins, L. B., Bone, Y., and Hallock, P.: Rottnest shelf to Ningaloo reef: Cool-
water to warm-water carbonate transition on the continental shelf of western Australia, J.
4906

Sediment. Res., 69, 1297–1321, 1999.Jensen, P. R., Gibson, R. A., Littler, M. M., and Littler, D.: Photosynthesis and calcification
in four deep-water Halimeda species (Chlorophyceae: Caulerpales), Deep-Sea Res., 32,451–464, 1985.
Kleypas, J. A. and Langdon, C.: Coral reefs and changing seawater carbonate chemistry, in:5
Coral reefs and climate change: Science and management, edited by: Phinney, J. T., Hoegh-Guldberg, O., Kleypas, J., Skirving, W., Strong, A., American Geophysical Union, Washing-ton, DC, 73–110, 2006.
Kuffner, I. B., Andersson, A. J., Jokiel, P. L., Rodgers, K. S., and Mackenzie, F. T.: Decreasedabundance of crustose coralline algae due to ocean acidification, Nature Geoscience, 1,10
114–117, 2008.Langdon, C., Broecker, W. S., Hammond, D. E., Glenn, E., Fitzsimmons, K., Nelson,
S. G., Peng, T.-H., Hajdas, I., and Bonani, G.: Effect of elevated CO2 on the com-munity metabolism of an experimental coral reef, Global Biogeochem. Cy., 17, 1011,doi:10.1029/2002GB001941, 2003.15
Langer, G., Geisen, M., Baumann, K.-H., Klas, J., Riebesell, U., Thoms, S., and Young, J. R.:Species-specific responses of calcifying algae to changing seawater carbonate chemistry,Geochem. Geophy. Geosy., 7, Q09006, doi:10.1029/2005GC001227, 2006.
Littler, M.: Calcification and its role among the macroalgae, Micronesica, 12, 27–41, 1976.Lough, J. and Barnes, D.: Several centuries of variation in skeletal extension, density and20
calcification in massive Porites colonies from the great barrier reef: A proxy for seawatertemperature and a background of variability against which to identify unnatural change, J.Exp. Mar. Biol. Ecol., 211, 29–67, 1997.
Lough, J. and Barnes, D.: Environmental controls on growth of the massive coral Porites, J.Exp. Mar. Biol. Ecol., 245, 225–243, 2000.25
Macintyre, I. and Reid, P.: Crystal alteration in a living calcareous alga (Halimeda): Implicationsfor studies in skeletal diagenesis, J. Sediment. Res., 65, 143–153, 1995.
Milliman, J. D.: Recent Sedimentary Carbonates, Part 1: Marine Carbonates, Springer-Verlag,New York, 375 pp., 1974.
Neumann, C. and Land, L.: Lime mud deposition and calcareous algae in the bight of Abaco,30
Bahamas, a budget, J. Sediment. Petrol., 45, 763–786, 1975.Orr, J. C., Fabry, V. J., Aumont, O., Bopp, L., Doney, S. C., Feely, R. A., Gnanadesikan, A.,
Gruber, N., Ishida, A., Joos, F., Key, R. M., Lindsay, K., Maier-Reimer, E., Matear, R., Mon-
4907
fray, P., Mouchet, A., Najjar, R. G., Plattner, G.-K., Rodgers, K. B., Sabine, C. L., Sarmiento,J. L., Schlitzer, R., Slater, R. D., Totterdell, I. J., Weirig, M.-F., Yamanaka, Y., and Yool, A.:Anthropogenic ocean acidification over the twenty-first century and its impact on calcifyingorganisms, Nature, 437, 681–686, 2005.
Reiskind, J. B., Seamon, P. T., and Bowes, G.: Alternative methods of photosynthetic carbon5
assimilation in marine macroalgae, Plant Physiol., 87, 686–692, 1988.Ries, J.: Aragonite production in calcite seas: Effect of seawater mg/ca ratio on the calcification
and growth of the calcareous alga Penicillus capitatus, Paleobiology, 31(3), 445–458, 2005.Stark, L. M., Almodovar, L., and Krauss, R. W.: Factors affecting the rate of calcification of
Halimeda opuntia (L.) Lamouroux and Halimeda discoidea Decaisne, J. Phycol., 5(4), 305–10
312, 1969.Taylor, W. R.: Marine algae of the eastern tropical and subtropical coasts of the Americas,
University of Michigan Press, Ann Arbor, 870 pp., 1960.Yao, W. and Byrne, R. H.: Simplified seawater alkalinity analysis: Use of linear array spectro-
meters, Deep-Sea Res. Pt. I, 45(8), 1383–1392,1998.15
4908

Fig. 1. (a) Halimeda plant, (b) Thallus of Halimeda showing where apical segments are located,and (c) Longitudinal section through apical segment.
4909
Figure 2
14
Fig. 2. West Florida shelf sample locality (circle).
4910

Figure 3
15
Fig. 3. Equipment used for laboratory experiments as described in text.
4911
0
100
200
300
400
500
600
700
00.050.1
0.150.2
0.250.3
0.350.4
0.45
SFL, Apr 66 WFS, Sep 71 Belize, Jul 72
Avg
cou
nt /
10µm
x 1
0µm
Avg
Wid
th (µ
m)
Location and date of sample
H. incrassataAvg crystal abundances and widths
Avg WidthAvg Counts
Fig. 4. Comparison of apical crystal size of specimens of H. incrassata from west Floridashelf (WFS), South Florida (SFL), and Belize. Error bars are 1 standard error of the mean.
4912

(a)
Figure 5 A. H.incrassata 1966
UU
U
B. H. incrassata 2007
U
U
17
(b)
Figure 5 A. H.incrassata 1966
UU
U
B. H. incrassata 2007
U
U
17
(c)
C.
H.discoidea 1967
U
U
D. H. discoidea 2008
U
U
18
(d)
C.
H.discoidea 1967
U
U
D. H. discoidea 2008
U
U
18
Fig. 5. SEM photomicrographs of Halimeda crystals from archived material. (a) H. incrassata,1966, (b) H. incrassata, 2007, (c) H. discoidea, 1967, (d) H. discoidea, 2008. U=utricle.
4913
0
0.2
0.4
0.6
0.8
1
1.2
0
50
100
150
200
250
300
350
400
450
500
WFS WFS WFS WFS
Dec 66 A ug 67 Feb 08 Feb 08
Mea
n w
idth
of
crys
tals
(m
icro
ns)
Nu
mb
er o
f cr
ysta
ls in
10µ
m x
10µ
m g
rid
Year living specimens were collected
Fig. 6. Graph of crystal trends for Halimeda discoidea archived samples. Histogram barsindicate number of crystals per unit area. Blue squares represent the mean width of crystals.Error bars are 1 standard error of the mean.
4914

(a)0%
10%
20%
30%
40%
50%
60%
70%
80%
Total C Inorganic C Organic C CaCO3
Perc
ent c
arbo
n
Halimeda Platelet Carbon- combined species
1966-72
2007-8
0%
10%
20%
30%
40%
50%
60%
70%
80%
Total C Inorganic C Organic C CaCO3
Perc
ent c
arbo
n
Halimeda incrassata Platelet Carbon
1966-722007-8
0%
10%
20%
30%
40%
50%
60%
70%
80%
Total C Inorganic C Organic C CaCO3
Perc
ent c
arbo
n
Halimeda discoidea Platelet Carbon
1966-722007-8
(b)
0%
10%
20%
30%
40%
50%
60%
70%
80%
Total C Inorganic C Organic C CaCO3
Perc
ent c
arbo
n
Halimeda Platelet Carbon- combined species
1966-72
2007-8
0%
10%
20%
30%
40%
50%
60%
70%
80%
Total C Inorganic C Organic C CaCO3
Perc
ent c
arbo
n
Halimeda incrassata Platelet Carbon
1966-722007-8
0%
10%
20%
30%
40%
50%
60%
70%
80%
Total C Inorganic C Organic C CaCO3
Perc
ent c
arbo
n
Halimeda discoidea Platelet Carbon
1966-722007-8
(c)
0%
10%
20%
30%
40%
50%
60%
70%
80%
Total C Inorganic C Organic C CaCO3
Perc
ent c
arbo
n
Halimeda Platelet Carbon- combined species
1966-72
2007-8
0%
10%
20%
30%
40%
50%
60%
70%
80%
Total C Inorganic C Organic C CaCO3
Perc
ent c
arbo
n
Halimeda incrassata Platelet Carbon
1966-722007-8
0%
10%
20%
30%
40%
50%
60%
70%
80%
Total C Inorganic C Organic C CaCO3
Perc
ent c
arbo
n
Halimeda discoidea Platelet Carbon
1966-722007-8
Fig. 7. (a) Halimeda spp. platelet carbon from archived samples. (b) H. incrassata and (c)H. discoidea platelet carbon. Error bars are 1 standard error of the mean.
4915
(a)
igure 8 HaliF A
B
A. pH 8.1
B. pH 7.5
imeda opunttia
220
(b)
igure 8 HaliF A
B
A. pH 8.1
B. pH 7.5
imeda opunttia
220
(c)
Figure 8 Halimeda tuna C. pH 8.1
C. pH 7.5
21
(d)
Figure 8 Halimeda tuna C. pH 8.1
C. pH 7.5
21
Fig. 8. SEM photomicrographs of Halimeda crystals from laboratory experiments. (a) H. opun-tia pH 8.1, (b) H. opuntia pH 7.5, (c) H. tuna pH 8.1, and (d) H. tuna pH 7.5.
4916
0
20
40
60
80
100
120
140
Halimeda opuntia Halimeda opuntia Halimeda tuna Halimeda tuna
7.5 8.1 7.5 8.1
Response of species crystals to experimental pH
Num
ber
of c
ryst
als
in 5
µm
x 5
µm
0
0.1
0.2
0.3
0.4
0.5
0.6
Species and experimental pH
Mea
n w
idth
of
crys
tals
(m
icro
ns)
Fig. 9. Graph of crystal trends for laboratory experiments. Histogram bars indicate numberof crystals per unit area. Blue squares represent the mean width of crystals. Error bars are1 standard error of the mean.
4917
Figure 10
From Hillis-Colinvaux (1980)
25
Fig. 10. Model for biomineralization in Halimeda from Hillis-Colinvaux (1980).
4918