acidification, forestry and river basin management -...
TRANSCRIPT

Acidification, forestry and river basin management
Daniel DonoghueDepartment of GeographyDepartment of Geography
University of DurhamUniversity of Durham
Structure
! What causes environmental acidity?! What is acidification?! What impact can afforestation have?
! Evidence of a forest effect! Impact models! Management strategies


Environmental acidity
! Substance that dissociates in water to yield a solution containing H+ having a pH < 7
! H+ activity µ equivilants/litre! pH Inverse log of H+ concentration
! Rainfall pH ≅ 5.6 (ideal case)! Regional variation pH 4.0 to pH 5.0 in UK
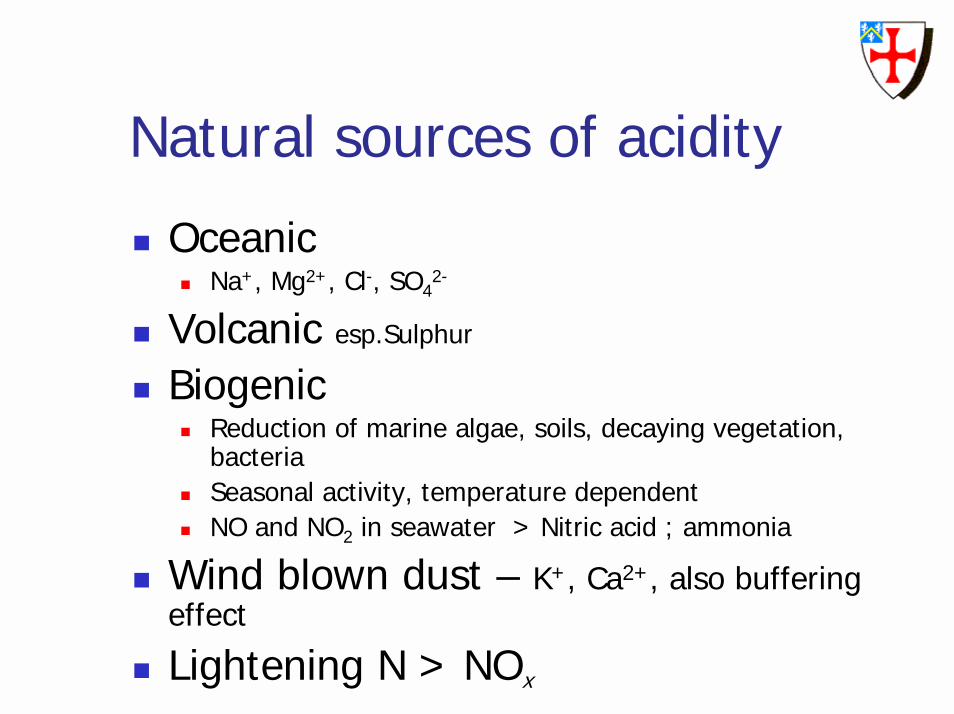
Natural sources of acidity
! Oceanic! Na+, Mg2+, Cl-, SO4
2-
! Volcanic esp.Sulphur
! Biogenic ! Reduction of marine algae, soils, decaying vegetation,
bacteria! Seasonal activity, temperature dependent! NO and NO2 in seawater > Nitric acid ; ammonia
! Wind blown dust – K+, Ca2+, also buffering effect
! Lightening N > NOx

Anthropogenic sources
! Watershed Sources! Coal mining – organic acids or oxidation of
sulphide minerals! Afforestation – organic acids: process needs
mobile anions to move H+
! Weathering! Sulphate retention
! Deposition! Wet deposition – sea salts! Dry (occult) deposition – sulphur scavenging
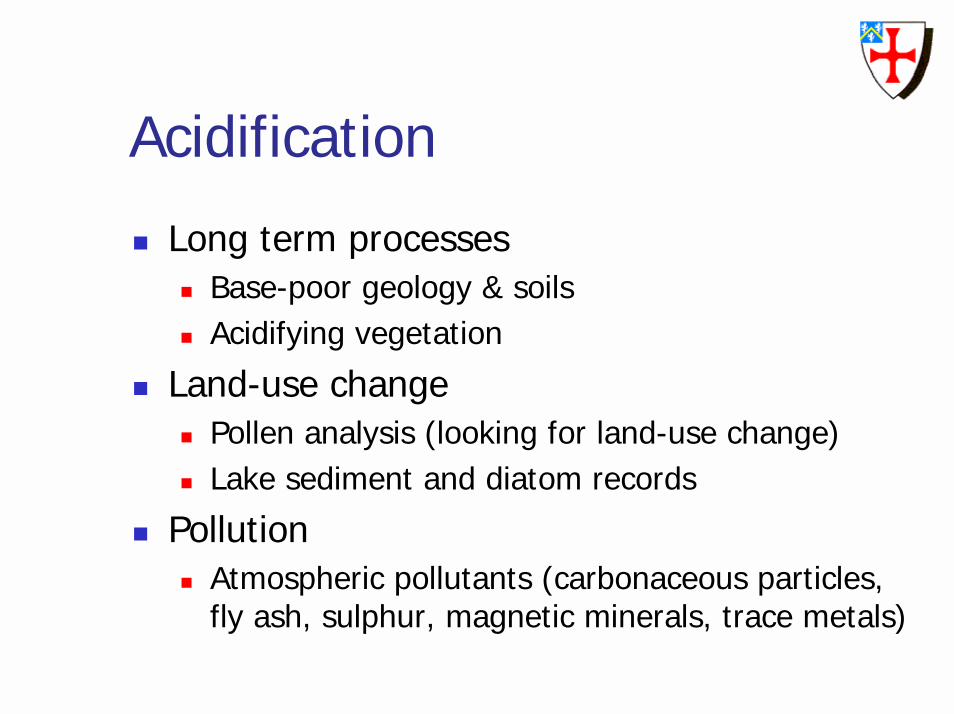
Acidification
! Long term processes! Base-poor geology & soils! Acidifying vegetation
! Land-use change! Pollen analysis (looking for land-use change)! Lake sediment and diatom records
! Pollution! Atmospheric pollutants (carbonaceous particles,
fly ash, sulphur, magnetic minerals, trace metals)

Impacts
! Aquatic biota! Fish deaths, Al toxicity, invertebrate populations
! Vegetation ! especially Nitrogen & Sulphur uptake
! Soils! sulphate saturation and increased base cation
leaching! Carbon dioxide
! Acts as a natural buffering agent; changes in CO2may affect acidification

0
20
40
60
80
100
120
140
160
180
12:0
0
18:0
0
00:0
0
06:0
0
12:0
0
18:0
0
00:0
0
06:0
0
12:0
0
18:0
0
00:0
0
06:0
0
12:0
0
Time 12:00 11/03/96 - 12:00 13/03/96
Dis
char
ge (C
umec
s)
Series7
Fleet
Minnoch
Cree
Bladnoch
Luce
Sampling
Galloway study Puhr, et al 1999


4
5
6
7
8
0 3 6 9 12
M ean Forest Height (m )
pH(a)
0369
1215
0 3 6 9 12
Mean Forest Height (m )
Ca
(mg/
l)
(b)
3456789
10
0 3 6 9 12
M ean Forest Height (m )
S04 (
mg/
l)
(c)
0150300450600750900
0 3 6 9 12
Mean Forest Height (m )
Dis
solv
ed A
l (µg
/l)
(e)
Evidence of a forest effect


0
5
10
15
20
0 2 4 6 8 10MFH (metres)
Sqrt
(Tot
al s
alm
onid
s)
(a)
048
121620
0 2 4 6 8 10MFH (metres)
Sqrt
(Tot
al s
alm
onid
s)
(a)
02468
10
0 2 4 6 8 10MFH (metres)
Sqrt
(Sal
mon
id p
arr)
(b)
02468
10
0 2 4 6 8 10MFH (metres)
Sqrt
(Sal
mon
id p
arr)
(b)
Poorly buffered geology
Well buffered geology


Value of Geographical Models
! Examine spatial patters! Predict future trends! Test predictions against empirical
observation! Test competing hypotheses! Suggest gaps in knowledge! Feed into other environmental models
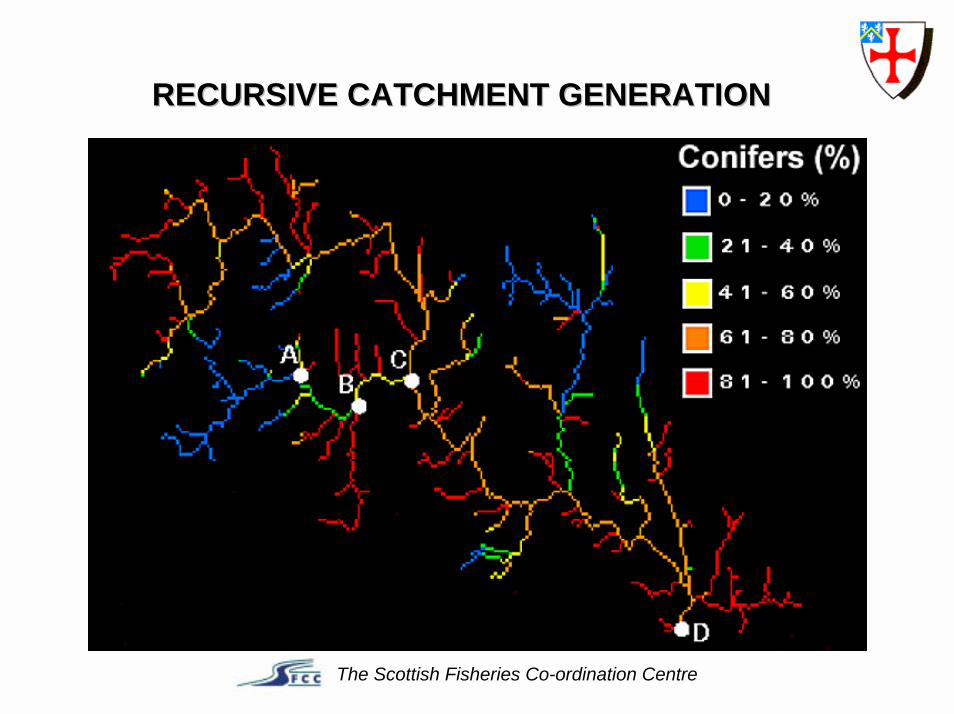
The Scottish Fisheries Co-ordination Centre
RECURSIVE CATCHMENT GENERATIONRECURSIVE CATCHMENT GENERATION

SFCC PARTNERSSFCC PARTNERS1. The Western Isles Fisheries Trust2. The West Sutherland Fisheries
Trust3. The Wester Ross Fisheries Trust4. The Conon DSFB5. The Spey Research Trust6. The Lochaber and District
Fisheries Trust7. The Tay Foundation8. The Awe Fisheries Trust9. The Tweed Foundation10. The West Galloway Fisheries
Trust & affiliated boards11. The Findhorn DSFB12. The Aberdeenshire Dee DSFB13. The Kyle of Sutherland DSFB14. The Scottish Office (Freshwater
Fisheries Laboratory)15. The Department of Geography,
University of Durham
50 0 50 100
Kilometres
The Scottish Fisheries Co-ordination Centre
21
3 411
125
67
8
9
10
14
15
13

DATAINTEGRATION
USERS
DATA COLLECTION
DATA DELIVERY
The Scottish Fisheries Co-ordination Centre
THE SFCCTHE SFCC

LIFE-ENVIRONMENT
! Financial Instrument of the EU in environmental protection and management
! Supports projects that set out to demonstrate new ideas, methods or technologies

ForestSAFE & Cree Valley
! Develop innovative scientific methods that combine satellite imagery and other ground survey data with planning and monitoring methods.
! Demonstrate how public authorities, forest companies and private forest owners can access up-to-date forestry and landscape information.
Objectives! Monitor changes in the forest due to
planting, harvesting and silviculturaloperations
! Identify areas of high environmental status e.g. riparian zones with large proportion of deciduous tree species, very old forests, wetland forests
! Estimate growing stock, age and tree species composition at stand, local and landscape level
! Demonstrate methods to track stands with poor or good growth potential, identify areas of damage from wind, snow or fire.


#
#
Windthrow
Forest Harvesting1989 -95 1995 -2001Closed canopy

Practical Developments
! Efficient Primary Data Recording! Data co-ordination and quality
assurance! Catchment area management plans! Forest Management Plans! Web based / GIS dissemination tool


Conclusions
! Geographical perspective valuable! Benefits of new technology
! Ability to look at regional / national problems! Improved quality of primary data
! Co-operative approach! Acidification research cuts across disciplines and
lines management responsibility! Data costs are a significant impediment to both
research and management

Daniel [email protected]
www.geography.dur.ac.uk/ForestSAFE
www.sfcc.co.uk
The Scottish Fisheries Co-ordination Centre

Acidity Models
! Biological! Diatoms! Fisheries
! Steady-state water chemistry (Henriksen)
! Dynamic models! MAGIC

Biological Impacts
! Recruitment failure! Egg hatching pH limited enzyme failure! Al toxicicity Gill damage and drowning
! Carrying capacity! Food availability! Suitable habitat
! Disruption of migration patterns! Chemical signature of water