acis international journal of computer & information science n1.pdf · international journal of...
TRANSCRIPT

ACIS International Journal of Computer &
Information ScienceA Publication of the International Association for Computer & Information Science
June 2014 VOLUME 15 NUMBER 1 ISSN 1525-9293
Dynamic Data Rebalancing in Hadoop -------------------------------------------------------------------------- 1Ashwin Kumar T K, Jongyeop Kim, K M George and Nohpill Park
A Study of Continual Usage Behavior for Online Stock Trading – Domestic Brokers of Securities Industry as Examples------------------------------------------------------------------------------------------------11Chung-Hung Tsai, Dauw-Song Zhu, Shiang-Ru Wang and Li-Yen Chien
Creation of Music Chord Progression Suited for User’s Feelings Based on Interactive Genetic Algorithm------------------------------------------------------------------------------------------------------------ 24Makoto Fukumoto
A Lazy-Updating Snoop Cache Protocol for Transactional Memory --------------------------------------- 31Sekai Ichii, Atsushi Nunome, Hiroaki Hirata and Kiyoshi Shibayama
The International Association for Computer & Information Science (ACIS)www.acisinternational.org [email protected]

International Journal ofComputer & Information Science
EDITOR-IN-CHIEF
Tokuro MatsuoGraduate School of Science & Engineering
Yamagata University, Japan [email protected]
MANAGING EDITOR
Roger Y. LeeDept. of Computer Science
Central Michigan University , U.S.A.Mt.Pleasant , MI 48859
EDITORIAL BOARD
Chia-Chu ChiangDept. of Computer ScienceUniversity of Arkansas, [email protected]
Chisu WuSchool of Computer Science and Eng.Seoul National University, [email protected]
Jixin MaDept. of Computer ScienceUniversity of Greenwich, [email protected]
Haeng-Kon KimDept. of Computer Info. & Comm. Eng.Catholic University of Daegu, [email protected]
Gongzhu Hu Dept. of Computer ScienceCentral Michigan University, USA [email protected]
Naohiro IshiiDept. of Info. Network Eng.Aichi Institute of Technology [email protected]
Dale KarolakIntier Automotive Closures, [email protected]
Joachim HammerDept. of Computer & Info. Sci.Univ. of Florida, [email protected]
Yucong DuanLaboratorie Electronique, Informtique et Image UMR CNRSUniversity of Bourgogne, [email protected]
Shaochun XuDept. of Computer ScienceAlgoma University, [email protected]
Brian MalloyDept. of Computer ScienceClemson University, [email protected]
Minglong ShaoAdvanced Technology GroupNetApp, Inc, Sunnyvale, CA, [email protected]
William LeighDept. of ManagementUniv. of Central Florida , USA [email protected]
Chao LuDept. of Computer and Information SciencesTowson University, [email protected]
Jiro TanakaDept. of Computer ScienceUniversity of Tsukuba, [email protected]
John McGregorDept of Computer ScienceClemson Univ. , [email protected]
Pascale MinetProject HIPERCOM-INRIARocquencourt, Francemailto:[email protected]
Ana MorenoFacultad de InformiticaUniversidad Politecnica de Madrid, [email protected]
Allen ParishDept. of Computer ScienceUniv. of Alabama -Tuscaloosa, USA [email protected]
Susanna PelagattiDept. of InformaticaUniversity of Pisa, [email protected]
Christophe NicolleLaboratoire LE2I - UMR CNRS 5158Université de Bourgogne, [email protected]
Huaikon MiaoComputer Engineering & ScienceShanghai University, [email protected]
2014
IJCIS is indexed by INSPEC
Dynamic Data Rebalancing in Hadoop
Ashwin Kumar T K 1, Jongyeop Kim1, K M George1, Nohpill Park1
Oklahoma State University, USA
Abstract
Current implementation of Hadoop is based on an assumption that all the nodes in a Hadoopcluster are homogenous with same processing capability. Data in a Hadoop cluster is split into blocks of predetermined size and are replicated to aset of data nodes based on the replication factor.Service time for jobs that accesses data stored in Hadoop considerably increases when the number of jobs is greater than the number of copies of dataand when the nodes in Hadoop cluster differ much in their processing capabilities. This paper addresses dynamic data rebalancing in aheterogeneous Hadoop cluster. Data rebalancing is done by replicating data dynamically with minimum data movement cost based on the number of incoming parallel mapreduce jobs. Once the jobs finish executing, unnecessary copies of data are eliminated. As a result of our approach, service time for these jobs is reduced significantly, as they do not have to wait for other jobs to finish. Our experiments indicate that as a result of dynamic data rebalancing service time of mapreduce jobs were reduced by over 30% and resource utilization is increased by over 50% when compared against Hadoop.
Keywords: Hadoop, Dynamic Data Rebalancing, Replication, service time, waiting time,heterogeneity
1. Introduction
Big-data is one of the fastest growing fields in recent years. Features that make big-data prominent are parallelism and data locality. Parallelism is achieved through the Mapreduce model [14], which was developed by Google. Mapreduce is a programming model for large scale distributed data [15] which distributes huge amounts of data and computing tasks to large and low cost commodity machines and it provides mass storage and parallelcomputation power [14]. Hadoop is an open source implementation of Mapreduce model [14]. Hadoop comprises of two key components namely HDFS and Mapreduce [1].
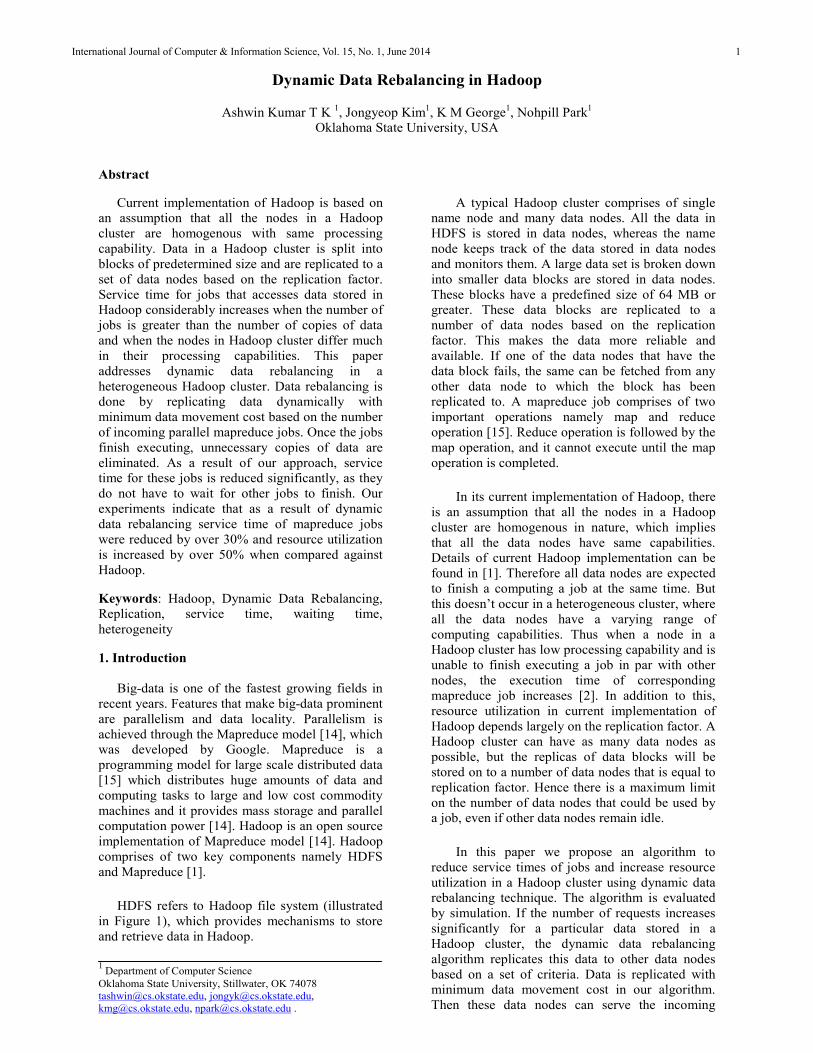
HDFS refers to Hadoop file system (illustrated in Figure 1), which provides mechanisms to store and retrieve data in Hadoop.
1 Department of Computer ScienceOklahoma State University, Stillwater, OK [email protected], [email protected],[email protected], [email protected] .
A typical Hadoop cluster comprises of single name node and many data nodes. All the data in HDFS is stored in data nodes, whereas the name node keeps track of the data stored in data nodes and monitors them. A large data set is broken down into smaller data blocks are stored in data nodes.These blocks have a predefined size of 64 MB or greater. These data blocks are replicated to a number of data nodes based on the replication factor. This makes the data more reliable and available. If one of the data nodes that have the data block fails, the same can be fetched from any other data node to which the block has been replicated to. A mapreduce job comprises of two important operations namely map and reduce operation [15]. Reduce operation is followed by the map operation, and it cannot execute until the map operation is completed.
In its current implementation of Hadoop, there is an assumption that all the nodes in a Hadoopcluster are homogenous in nature, which implies that all the data nodes have same capabilities.Details of current Hadoop implementation can be found in [1]. Therefore all data nodes are expected to finish a computing a job at the same time. But this doesn’t occur in a heterogeneous cluster, where all the data nodes have a varying range ofcomputing capabilities. Thus when a node in a Hadoop cluster has low processing capability and is unable to finish executing a job in par with other nodes, the execution time of corresponding mapreduce job increases [2]. In addition to this, resource utilization in current implementation of Hadoop depends largely on the replication factor. AHadoop cluster can have as many data nodes as possible, but the replicas of data blocks will be stored on to a number of data nodes that is equal toreplication factor. Hence there is a maximum limit on the number of data nodes that could be used by a job, even if other data nodes remain idle.
In this paper we propose an algorithm to reduce service times of jobs and increase resource utilization in a Hadoop cluster using dynamic data rebalancing technique. The algorithm is evaluated by simulation. If the number of requests increases significantly for a particular data stored in a Hadoop cluster, the dynamic data rebalancing algorithm replicates this data to other data nodes based on a set of criteria. Data is replicated with minimum data movement cost in our algorithm.Then these data nodes can serve the incoming
International Journal of Computer & Information Science, Vol. 15, No. 1, June 2014 1
requests, thereby eliminating the need for these jobs to wait. Major advantages of using dynamic data rebalancing techniques are it makes use of idle data nodes to replicate data and execute theincoming jobs thereby increasing resource utilization and decreasing service time for these jobs as they will no longer have to wait until the previous jobs finish their execution.
Rest of the paper is organized as follows. In section 2 we review various data rebalancing techniques. In section 3 we describe system architecture and provide a brief description of our data rebalancing algorithm. In section 4 we explain the tools we have used for our simulation. Before we conclude the paper we present our results and their interpretation in section 5.
Figure 1, Hadoop File System Architecture
(http://hadoop.apache.org/docs/r0.18.0/hdfs_design.pdf).
2. Related work
Dynamic load balancing techniques are being prevalently used in networking domain over a long period of time. Dynamic load balancing algorithm for a local access network (LAN) described in [7]optimizes load-transfer time by taking into account the heterogeneous nature of LAN. Web servers are another area of application of load rebalancing. When there is a huge traffic to websites, this traffic is split between a cluster of servers and hence alleviating bottlenecks. A number of dispatcher-based load balancing algorithms are described in [12], these algorithms are aimed to achieve full control on client requests and mask the request routing among multiple servers [12].
Some of the approaches that deal with data rebalancing in Hadoop are described below. Hadoop provides a mechanism to rebalance data manually [13].Rebalancing is necessary in a Hadoop cluster, as it avoids under-utilization or over-utilization of data nodes. By rebalancing, data is redistributed among the data nodes equally. Rebalancing does not cause any data loss or change
in number of replicas or reduce the number of racks that a block reside [13]. Data rebalancing is done by a rebalancing server and it obtains data node report and block-map from name node [13].Rebalancing server then iterates on block-map and data node list to find under-utilized and over-utilized data nodes. Then it copies data blocks from over-utilized to under-utilized data nodes and send the final data node report and block map to name node. The drawback of this method is that it has to be invoked by a Hadoop administrator manually whenever a new data node is added to the Hadoopcluster or when the cluster is imbalanced [13].
An improved Hadoop data load balancing algorithm [9], provides mechanisms to balance overloaded racks preferentially. This approach involves in the construction of prior balance lists, for balance lists and next for balance list [9]. Prior balance list contains data nodes, that are overloaded and these data nodes are rebalanced first. As a result of this algorithm, breakdown of racks due to overloading can be avoided in time [9].
Load rebalancing for distributed file systems in cloud [8], deals with data rebalancing in a cloud environment where nodes can be upgraded, added and removed from the cluster [8]. Data chunks (data blocks) are not distributed to all the nodes equally, as they are being dynamically created, updated and deleted. Further all the nodes depend on a single central node, which can be a single point of failure and also become a performance bottleneck, when the central node receives large number of requests [8]. An algorithm is proposed in [8] to distribute data as uniformly as possible by leveraging DHT (distributed hash table). Data movement cost is also reduced to a greater extent by this algorithm [8].
In [10], the load on Hadoop cluster is rebalanced using Pikachu task scheduler. Tradeoff between estimation accuracy using Tarazu [16] versus wasted work due to delayed load adjustment is computed first. This is factored in Pikachu task scheduler for load rebalancing [10]. Idea of load-balancing in [10] is straight forward, faster the reducer gets more data, task scheduler calculates the key range partition for fast and slow nodes in such way that they complete the process at the same time [10].
However [8] tries to rebalance data using DHT, [9] aims to rebalance data in overloaded racks preferentially and [10] rebalances load on Hadoopcluster by estimating the time taken by the slow and fast nodes to execute a mapreduce task, they do not factor in the number of requests for a data that can be dynamic. Apart from this, the resource utilization is still majorly determined by the replication factor.
International Journal of Computer & Information Science, Vol. 15, No. 1, June 2014 2
In adaptive load balancing in mapreduce using flubber [11], the number of reducers required for a mapreduce task is optimized. [11] also specifies that number of reducers for a mapreduce job is non-trivial and should be decided prior to the execution of mapreduce job. Flubber, a pre-job is sandwiched between actual job and Hadoop [11]. It decides the number of ideal reducers required for a job. This approach does not provide any leverage over data partitioning done in mappers. So there is no assurance of whether the load is balanced with the ideal number of reducers [11].
In [2], a heterogeneity-aware data distribution method is provided, in an attempt to solve the straggler task problem during execution. In this method data is migrated from a slow to a fast computing data node dynamically. However this paper addresses heterogeneity-aware data distribution dynamically, it doesn’t provide adequate mechanism to address data re-balancing when there are a number of jobs requesting a particular data set. In this scenario in [2], jobs will have to wait as it increases the service time and the resource utilization is determined by replication factor.
In this paper we propose solutions to the bottleneck in resource utilization and service time encountered in large Hadoop systems. We proposedynamic rebalancing of data, when there are many requests for a particular data set. Simulation resultsindicate that, service time of mapreduce jobs isreduced and resource utilization in the cluster is increased significantly.
3. Proposed dynamic data rebalancing algorithm
HDFS uses single-writer and multiple-reader model [17], where a single user can write the data whereas many users can read the data at the same time. Data files created in HDFS can be only appended or removed but not altered. When a HDFS client opens a file for writing, a lease is granted to the client [17]. The lease holds valid until the client closes the connection or until the connection is terminated. Name node gives unique ID’s to new data blocks and determines the list of data nodes to which the new block has to be replicated to [17]. A pipeline of data nodes is formed based on the order of minimizing network distance [17]. HDFS client writes data to the buffer and when the buffer (64 KB) is full, it is pushed to the pipeline. This process continues after receiving an acknowledgement from the data node. When HDFS client opens a file to read data, list of blocks and locations of each block replica is obtained from name node [17]. HDFS client tries to read the data from closest replica, if that fails the client attempts to read from next replica and so on.
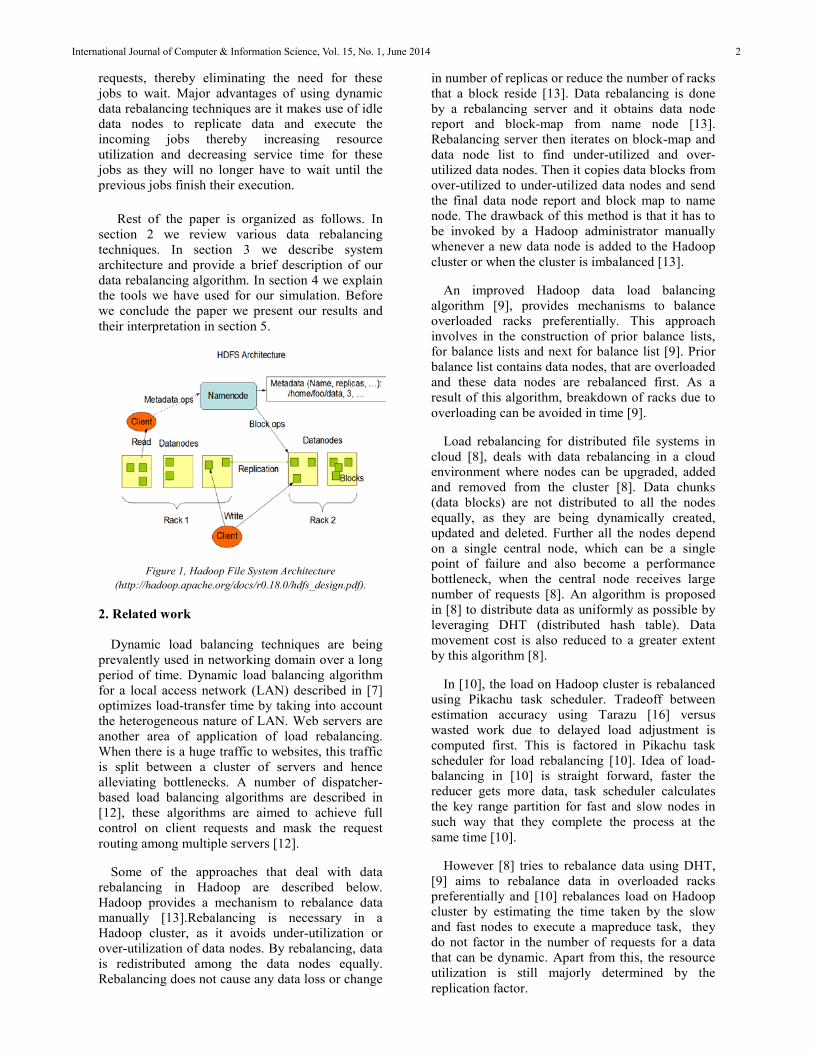
In proposing the dynamic data re-balancing approach, we have designed a system with high-level structure called “Dynamic data balancingmodule” (DDBM) as shown in Figure 2. Dynamic data rebalancing module has two major components data balancer and processing capability estimator. The DDBM is interfaced with Hadoop implementation. Details of Hadoop file system implementations can be found in several publications [1, 17]. In the following sections, we describe the components of the DDBM.
Figure 2, Dynamic Data balancer Architecture
3.1 Processing capability Estimator (PCE)
When a Hadoop cluster is not homogenous, the processing capabilities of different data nodes differs greatly and thereby suffering from performance degradation during map phase [2]. There are several direct factors affecting the processing capability such as processor speed, memory capacity. Besides these direct factors there are other factors such as the data node not live, malicious node, native work load – to be considered as well. In order to address this performance degradation, we use Processing capability estimator (PCE). PCE is used to estimate the processing capabilities of data nodes in a Hadoop cluster. Processing capability is the ability of a node to complete a task. The processing capability estimator keeps track of job completion details. Job completion details include when the job was posted, when it began its execution, nodes involved in the job, their computation time with respect to the amount of data they have processed and job completion time. Processing capability of a data node in a Hadoopcluster is determined by these job completion details. These jobs include current and historic jobs too. Method used to estimate processing capability is described below.
1) Processing capability Computation
Processing capabilities of data nodes are computed from the job completion details using the following formula
International Journal of Computer & Information Science, Vol. 15, No. 1, June 2014 3

𝑃𝑃𝑛𝑛 = 𝑇𝑇𝑛𝑛𝐵𝐵
(1)
Where n is a Data Node, Pn refers to the processing capability of a data node ‘n’, Tn refers to the time taken by the data node ‘n’ to process a data block of size ‘B bytes’ and B refers to a data block of size ‘B bytes’
3.2 Data balancer
Another important component of the data rebalancing module is data balancer. When the number of jobs exceeds available number of copies of data, they will have to wait until all the other jobs finish executing. This leads to increased processing time for the jobs, which will have to wait for other jobs to finish their execution. Further, this leads to under-utilization of other data nodes that do not have the corresponding data blocks. Increased waiting time and under-utilization of resources get compounded and leads to the performance degradation of Hadoop cluster. Our data balancer addresses this problem by replicating data blocks, based on algorithm described in the following section. These data blocks are replicated to the data nodes that do not have these blocks already. This aids in decreasing the service-time of jobs that will have to wait and maintaining higher resource utilization. The proposed dynamic data rebalancing algorithm used in the data balancer is given below:
1) Dynamic data rebalancing Algorithm
Dynamic data rebalancing algorithm is the key component of data balancer. The algorithm is as shown below:
If ( # requests for a data block > (total # requested data blocks available in the cluster – Sum of Requests that are using requested data block already))
For i=1to N // i ∈ { Data Nodes that do not have requested data block and are arranged in descending order of their computation capability}
If (Max. Disk Usage (DNi) < Size of requested data block + Current Disk Usage (DNi)) //check Max use
If Replication Time on DNi<Minimum Waiting Time
Replicate Data Block to DNi;Stop;
EndEnd
Loop
Do not replicate; //If no data node meets the above criteria
End
Where DN denotes Data Node and DNi denote the
ith data node in the order.
The dynamic data rebalancing algorithm comes into effect when the number of jobs that are requesting to read a particular data block is greater than the difference of the actual number of data copies available and the number of requests that are using that requested data block; this is done to verify whether the Hadoop cluster has sufficient resources to satisfy the incoming requests. If the above condition is true, then every data node from the list of data nodes that do not have the requested data block is selected.
For every such data node, its maximum disk usage is compared against the sum of size of the requested data block and current disk usage of the data node; this is done to ensure that no data node can store data more than its maximum disk usage. If the former is greater than the latter, no more data can be written on to the data node as its maximum disk usage exceeds by replicating the requested data block to it. In such case another data node is selected and the same comparison is carried out. If the maximum disk usage of a data node is less than the sum of size of requested data block and current disk usage of the data node, data block can be written to that data node as it has sufficient space. This data node can be a distant data node topologically, therefore the time taken to replicate data block to this node will be very large than the waiting time. In order to avoid it, time taken to replicate data to the selected data node is compared against the minimum waiting time of the job. If the former is lesser than the latter, data block is replicated to that corresponding data node. Otherwise, data replication to that corresponding data node is suspended, and another data node is selected from the list.
If there are no data nodes whose maximum disk usage is less than the sum of size of requested data block and current disk usage of the data node and/or replication time is less than minimum waiting time then the data blocks are not replicated. In this scenario, the jobs will have to wait for the other jobs that are using the resources to finish their execution.
3.3 Analysis of Data Rebalancing
As a result of our dynamic data rebalancing approach, service times of jobs are expected to decrease as they will no longer have to wait for
Dynamic Data Re-balancing Algorithm
International Journal of Computer & Information Science, Vol. 15, No. 1, June 2014 4
longer times. There are two possible scenarios encountered in our algorithm. The two scenarios are data rebalancing 1) with replication is performed and 2) without replication.
Analysis of these scenarios is given below:
1) Scenario 1 – Data Rebalancing with No Replication
In this scenario, the jobs will have to wait until the previous jobs release the resources used by them. Therefore, service time of a job is the sum of waiting time and execution time.
𝑡𝑡𝑆𝑆 = 𝑡𝑡𝑊𝑊 + 𝑡𝑡𝐸𝐸 (2)
Where tS refer to service time, tW refers to waiting time and tE refers to execution time of a job. Waiting time of a job, is defined by the following equation
𝑡𝑡𝑊𝑊 = min 0 ≤ i ≤ |N|( 𝑡𝑡𝑃𝑃(𝑖𝑖) − 𝑡𝑡𝑒𝑒(𝑖𝑖) ) (3)
Where tW is waiting time of the job, N is a set of data nodes that has the requested data block and is serving a request for that block, 𝑡𝑡𝑃𝑃(𝑖𝑖)is the time required to complete execution of a job by a datanode ‘i’ that has the requested data block and iscurrently serving a request and te(i) is the time elapsed at data node ‘i’.
Processing capability estimator plays an important role in determining the time required to complete executing a job by data node. This can be obtained as a function of the job details both previous and current those are stored in processing capability estimator. From equation (1) value of 𝑡𝑡𝑃𝑃(𝑖𝑖) can be computed as shown below
𝑇𝑇𝑛𝑛 = 𝑃𝑃𝑛𝑛 ∗ 𝐵𝐵 (4)
Processing capability (𝑃𝑃𝑖𝑖) can be fetched from the processing capability estimator, the size of data block can be obtained from Hadoop. With these details the time required to complete executing a job by a data node ‘i’ (𝑡𝑡𝑃𝑃) can be estimated usingequation 4.
Minimum value of the difference between execution time and elapsed time is considered as waiting time as this will be the time that the job that is waiting for the resources has to wait.
Based on the above equations (3) and (4),service time for this scenario is defined as
𝑡𝑡𝑆𝑆 = [min 0 ≤ i ≤ |N|( 𝑡𝑡𝑃𝑃(𝑖𝑖) − 𝑡𝑡𝑒𝑒(𝑖𝑖) )] + 𝑡𝑡𝑃𝑃(𝑖𝑖)(5)
Where tS is the service time and 𝑡𝑡𝑃𝑃(𝑖𝑖) is the time required for execution of the job by the data
node ‘i’. Notice that the ‘i’ is the data node selected from the minimum difference of 𝑡𝑡𝑃𝑃(𝑖𝑖) 𝑎𝑎𝑎𝑎𝑎𝑎 𝑡𝑡𝑒𝑒(𝑖𝑖).
2) Scenario 2 – Data Rebalancing with Replication
In this scenario, replication occurs and the jobs that were waiting makes use of these newly available data copies and begin their execution. Service time is defined as the sum of replication and execution time in this scenario.
𝑡𝑡𝑆𝑆 = 𝑡𝑡𝑅𝑅 + 𝑡𝑡𝐸𝐸 (6)
Where tS refers to service time, tR refers to replication time and tE refers to execution time of the job.
Replication time is the time to replicate the data block to a data node randomly selected, that does not have the data block to be replicated already. Replication time depends on the size of the data block that is to be replicated and also network bandwidth. Replication time is also impacted by topology, if a node to be replicated is far (for example in other data center), replication time tends to be large. Our algorithm takes this into account and reduces major data movement overhead by skipping the replication when there is a higher overhead. From processing capacity estimator, we can estimate the time required for execution by a data node. By substituting the values for execution time from equation (1) we have the following equation.
𝑡𝑡𝑆𝑆 = 𝑡𝑡𝑅𝑅(𝑖𝑖) + 𝑡𝑡𝑃𝑃(𝑖𝑖) (7)
Where 𝑡𝑡𝑅𝑅(𝑖𝑖)is the time taken to replicate a requested data block to a data node ‘i’, 𝑡𝑡𝑃𝑃(𝑖𝑖) is the time required by the data node ‘i’ to complete the execution of the job. Equations (5) and (7) are used to compute service times in our results section.
4. Simulation Setup
To simulate dynamic data re-balancing, we used Apache’s MapReduce simulator “Mumak” [3]. Large scale distributed systems are hard to verify and debug as every developer cannot afford large number of physical nodes, and it is time consuming to run benchmarks [5]. For our simulation we considered some parameters like waiting time, service time, resource utilization and data movement overhead. In this section we explainabout various simulation tools that we have used and how we achieved simulation of heterogeneityin Hadoop cluster.
4.1 Apache Mumak [3]
Mumak [3] is a mapreduce simulator project in apache foundation. Mumak can be used for
International Journal of Computer & Information Science, Vol. 15, No. 1, June 2014 5
discrete-event simulation, plugging in real job tracker and scheduler and to simulate all conditions of a production cluster [5]. In discrete event simulation, mumak [3] can simulate a cluster of many nodes ranging up to thousands. It makes use of virtual clocks, which are much faster than actual clocks. Mumak is able to mimic how actual Hadoop cluster performs with a certain degree of confidence. It inherits the actual Job Tracker [6] and Scheduler from Hadoop implementation. Mumak can also simulate the conditions of a production cluster making use of cluster configuration and job trace generated by Rumen [4]. Apache Rumen [4] is briefly described in the following section.
4.2 Apache Rumen [4]
Apache Rumen [4] is a data extraction and analysis tool built for apache Hadoop [1]. Rumenprocesses job history logs and extracts data from it. The data extracted from job history logs are stored in an easily-parsed or condensed format or as a digest [4]. Need for Rumen arouse because the simulators were not able to use the raw data from logs, as they intend to measure some conditions that haven’t occurred actually. For example, if a task ran locally in raw trace data but a simulation of the scheduler elects to run that task on a remote rack, the simulator requires a runtime its input cannot provide [4]. To solve all these issues Rumen provides a statistical analysis of the raw trace to estimate the variables that the trace doesn’t have. In our simulation we use the trace generated by Rumen as an input to Mumak.
There are two components of apache rumen namely trace builder [4] and folder [4]. Trace builder converts job history log files to easily-parsed format. Current form of output by the trace builder is in JSON data-interchange format. Folder is a utility to scale the input trace [4]. Trace obtained from trace builder summarizes all the events that happened during the job by making use of job history log files. Runtime of this trace can be scaled using Folder utility.
4.3 Simulating Heterogeneity in Mumak
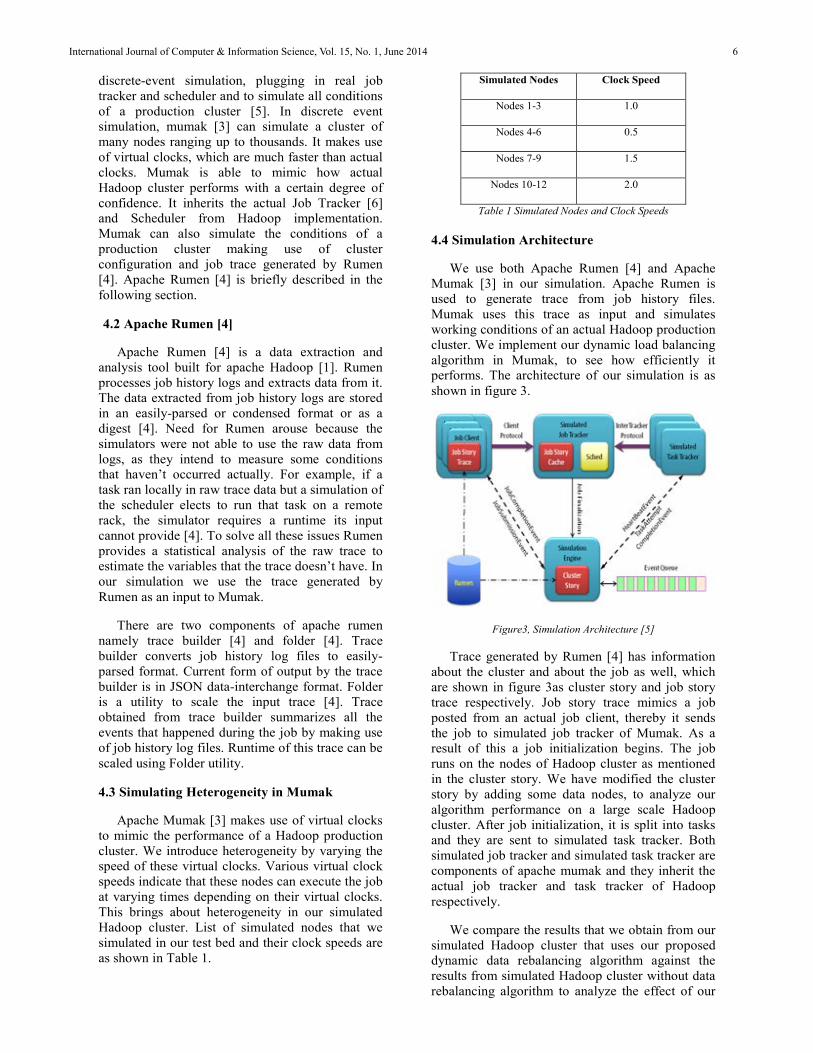
Apache Mumak [3] makes use of virtual clocks to mimic the performance of a Hadoop production cluster. We introduce heterogeneity by varying the speed of these virtual clocks. Various virtual clock speeds indicate that these nodes can execute the job at varying times depending on their virtual clocks. This brings about heterogeneity in our simulated Hadoop cluster. List of simulated nodes that we simulated in our test bed and their clock speeds are as shown in Table 1.
Simulated Nodes Clock Speed
Nodes 1-3 1.0
Nodes 4-6 0.5
Nodes 7-9 1.5
Nodes 10-12 2.0
Table 1 Simulated Nodes and Clock Speeds
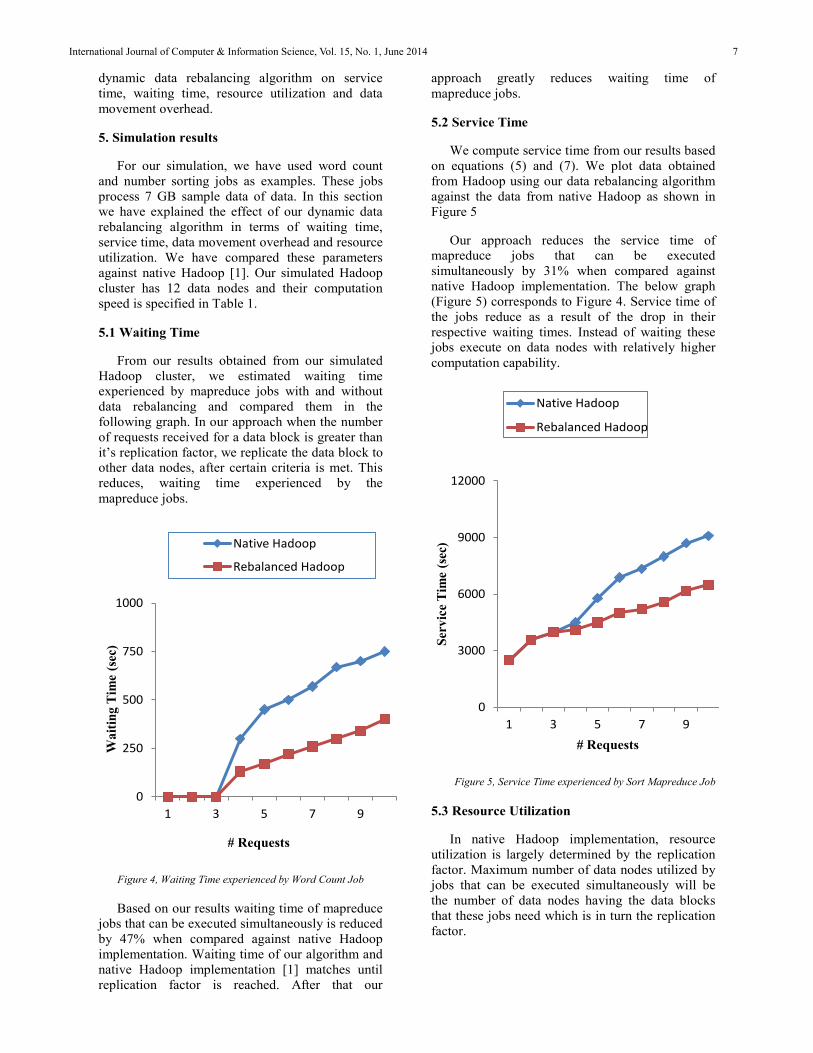
4.4 Simulation Architecture
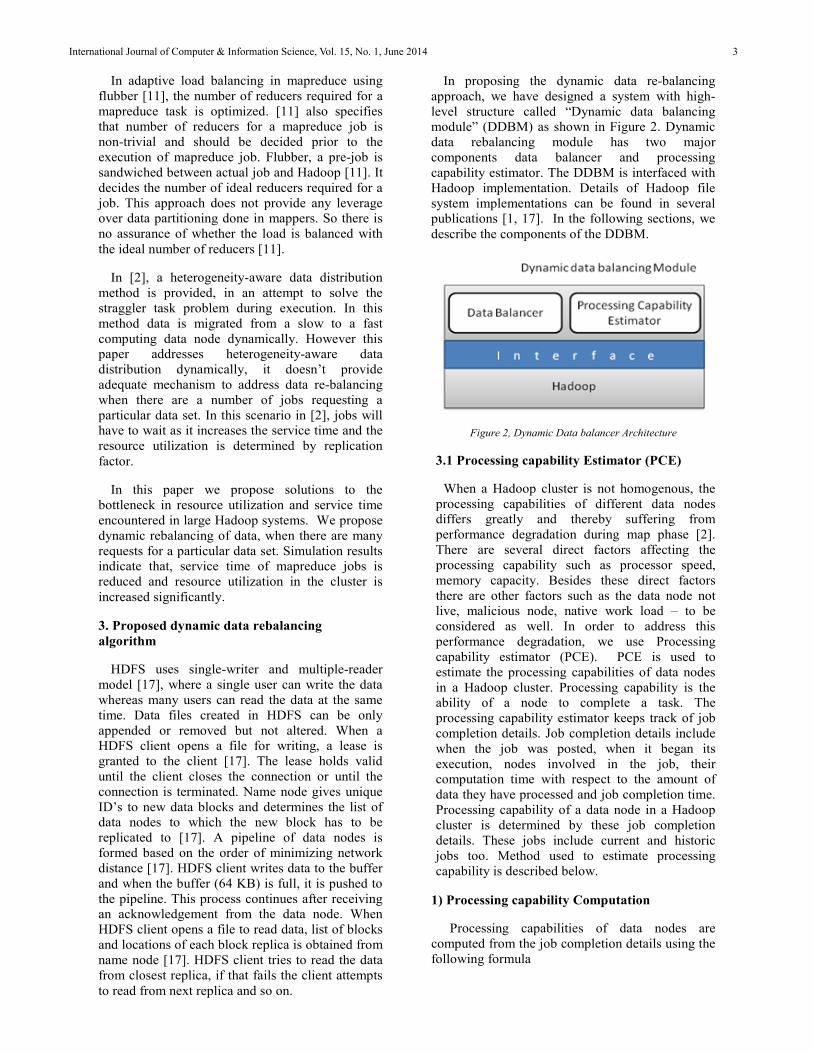
We use both Apache Rumen [4] and Apache Mumak [3] in our simulation. Apache Rumen is used to generate trace from job history files. Mumak uses this trace as input and simulates working conditions of an actual Hadoop production cluster. We implement our dynamic load balancing algorithm in Mumak, to see how efficiently it performs. The architecture of our simulation is as shown in figure 3.
Figure3, Simulation Architecture [5]
Trace generated by Rumen [4] has information about the cluster and about the job as well, which are shown in figure 3as cluster story and job story trace respectively. Job story trace mimics a job posted from an actual job client, thereby it sends the job to simulated job tracker of Mumak. As a result of this a job initialization begins. The job runs on the nodes of Hadoop cluster as mentioned in the cluster story. We have modified the cluster story by adding some data nodes, to analyze our algorithm performance on a large scale Hadoopcluster. After job initialization, it is split into tasks and they are sent to simulated task tracker. Both simulated job tracker and simulated task tracker are components of apache mumak and they inherit the actual job tracker and task tracker of Hadooprespectively.
We compare the results that we obtain from our simulated Hadoop cluster that uses our proposed dynamic data rebalancing algorithm against the results from simulated Hadoop cluster without data rebalancing algorithm to analyze the effect of our
International Journal of Computer & Information Science, Vol. 15, No. 1, June 2014 6
dynamic data rebalancing algorithm on service time, waiting time, resource utilization and data movement overhead.
5. Simulation results
For our simulation, we have used word count and number sorting jobs as examples. These jobs process 7 GB sample data of data. In this section we have explained the effect of our dynamic data rebalancing algorithm in terms of waiting time, service time, data movement overhead and resource utilization. We have compared these parameters against native Hadoop [1]. Our simulated Hadoopcluster has 12 data nodes and their computation speed is specified in Table 1.
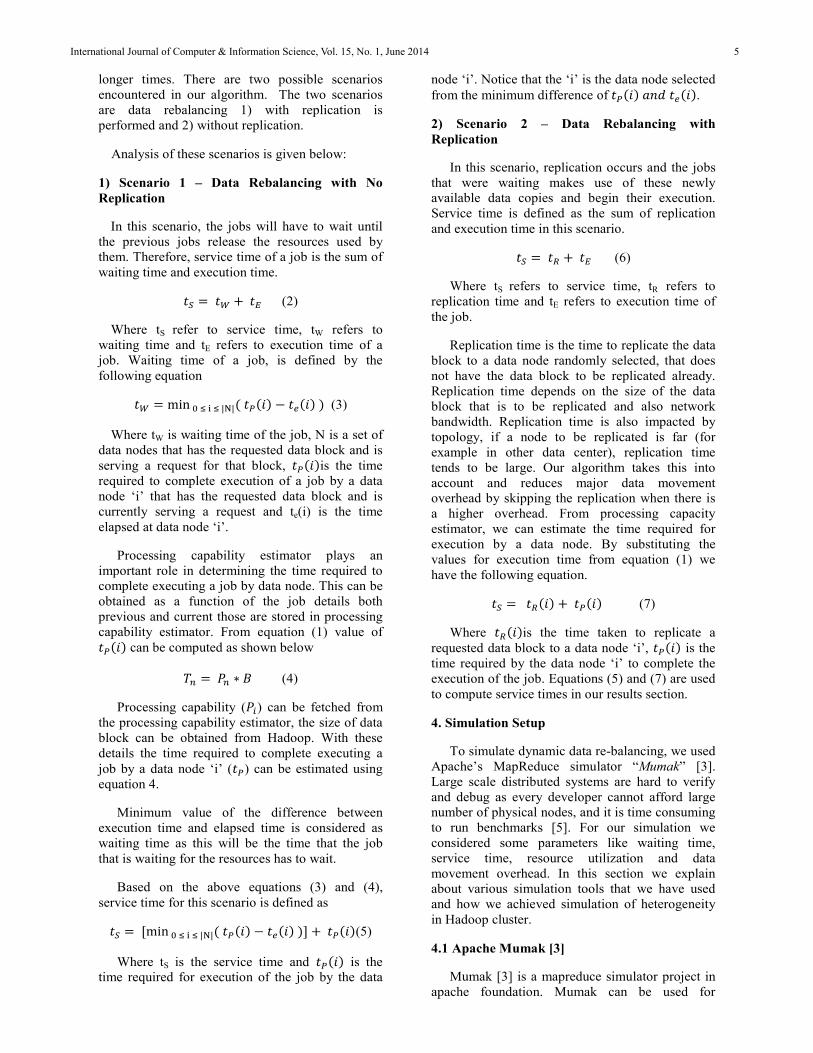
5.1 Waiting Time
From our results obtained from our simulated Hadoop cluster, we estimated waiting time experienced by mapreduce jobs with and without data rebalancing and compared them in the following graph. In our approach when the number of requests received for a data block is greater than it’s replication factor, we replicate the data block to other data nodes, after certain criteria is met. This reduces, waiting time experienced by the mapreduce jobs.
Figure 4, Waiting Time experienced by Word Count Job
Based on our results waiting time of mapreducejobs that can be executed simultaneously is reduced by 47% when compared against native Hadoopimplementation. Waiting time of our algorithm and native Hadoop implementation [1] matches until replication factor is reached. After that our
approach greatly reduces waiting time of mapreduce jobs.
5.2 Service Time
We compute service time from our results based on equations (5) and (7). We plot data obtained from Hadoop using our data rebalancing algorithm against the data from native Hadoop as shown in Figure 5
Our approach reduces the service time of mapreduce jobs that can be executed simultaneously by 31% when compared against native Hadoop implementation. The below graph (Figure 5) corresponds to Figure 4. Service time of the jobs reduce as a result of the drop in their respective waiting times. Instead of waiting these jobs execute on data nodes with relatively higher computation capability.
Figure 5, Service Time experienced by Sort Mapreduce Job
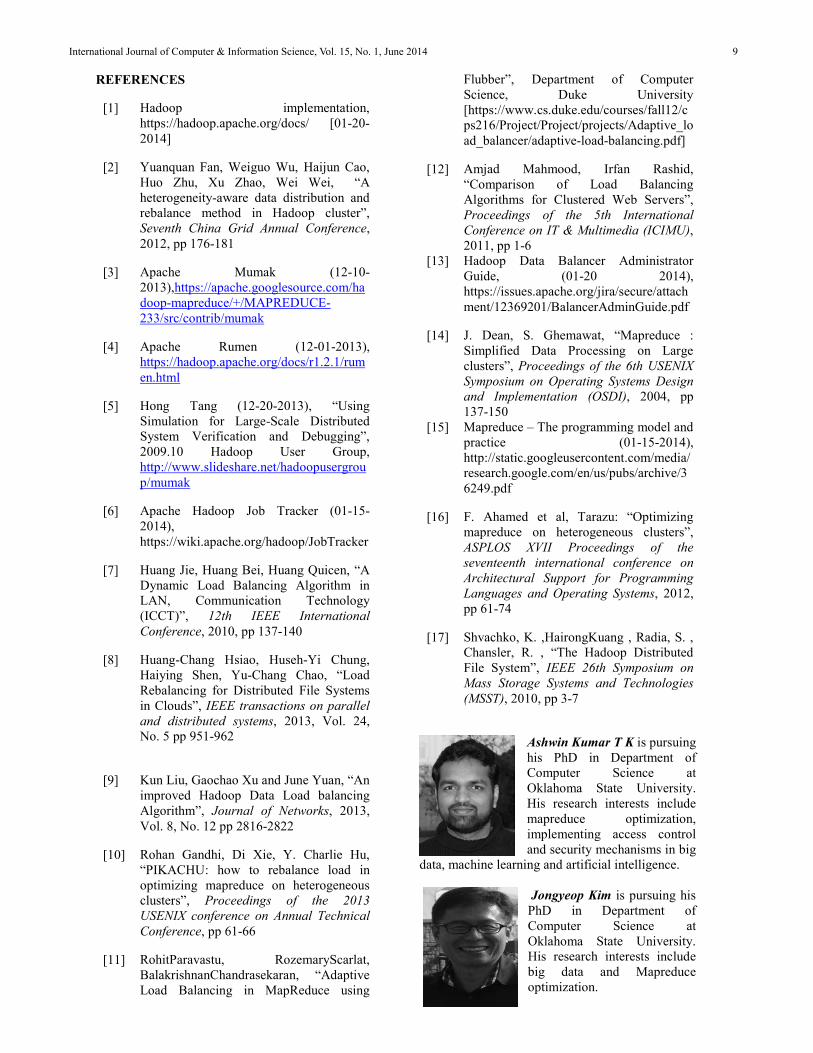
5.3 Resource Utilization
In native Hadoop implementation, resource utilization is largely determined by the replication factor. Maximum number of data nodes utilized by jobs that can be executed simultaneously will be the number of data nodes having the data blocks that these jobs need which is in turn the replication factor.
0
250
500
750
1000
1 3 5 7 9
Wai
ting
Tim
e (s
ec)
# Requests
Native Hadoop
Rebalanced Hadoop
0
3000
6000
9000
12000
1 3 5 7 9
Serv
ice
Tim
e (s
ec)
# Requests
Native Hadoop
Rebalanced Hadoop
International Journal of Computer & Information Science, Vol. 15, No. 1, June 2014 7
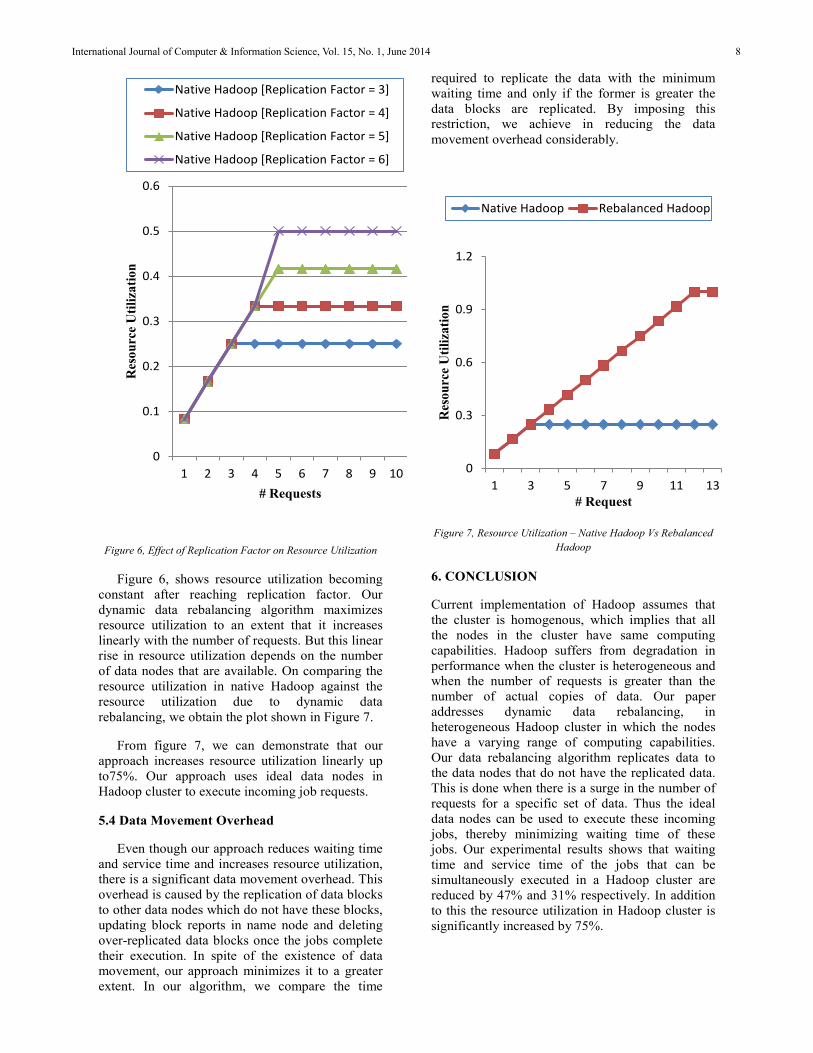
Figure 6, Effect of Replication Factor on Resource Utilization
Figure 6, shows resource utilization becoming constant after reaching replication factor. Our dynamic data rebalancing algorithm maximizes resource utilization to an extent that it increases linearly with the number of requests. But this linearrise in resource utilization depends on the number of data nodes that are available. On comparing the resource utilization in native Hadoop against the resource utilization due to dynamic data rebalancing, we obtain the plot shown in Figure 7.
From figure 7, we can demonstrate that our approach increases resource utilization linearly up to75%. Our approach uses ideal data nodes in Hadoop cluster to execute incoming job requests.
5.4 Data Movement Overhead
Even though our approach reduces waiting time and service time and increases resource utilization, there is a significant data movement overhead. This overhead is caused by the replication of data blocks to other data nodes which do not have these blocks, updating block reports in name node and deleting over-replicated data blocks once the jobs complete their execution. In spite of the existence of data movement, our approach minimizes it to a greater extent. In our algorithm, we compare the time
required to replicate the data with the minimum waiting time and only if the former is greater the data blocks are replicated. By imposing this restriction, we achieve in reducing the data movement overhead considerably.
Figure 7, Resource Utilization – Native Hadoop Vs Rebalanced Hadoop
6. CONCLUSION
Current implementation of Hadoop assumes that the cluster is homogenous, which implies that all the nodes in the cluster have same computing capabilities. Hadoop suffers from degradation in performance when the cluster is heterogeneous and when the number of requests is greater than the number of actual copies of data. Our paper addresses dynamic data rebalancing, in heterogeneous Hadoop cluster in which the nodes have a varying range of computing capabilities. Our data rebalancing algorithm replicates data to the data nodes that do not have the replicated data. This is done when there is a surge in the number of requests for a specific set of data. Thus the ideal data nodes can be used to execute these incoming jobs, thereby minimizing waiting time of these jobs. Our experimental results shows that waiting time and service time of the jobs that can be simultaneously executed in a Hadoop cluster are reduced by 47% and 31% respectively. In addition to this the resource utilization in Hadoop cluster is significantly increased by 75%.
0
0.1
0.2
0.3
0.4
0.5
0.6
1 2 3 4 5 6 7 8 9 10
Res
ourc
e U
tiliz
atio
n
# Requests
Native Hadoop [Replication Factor = 3]
Native Hadoop [Replication Factor = 4]
Native Hadoop [Replication Factor = 5]
Native Hadoop [Replication Factor = 6]
0
0.3
0.6
0.9
1.2
1 3 5 7 9 11 13
Res
ourc
e U
tiliz
atio
n
# Request
Native Hadoop Rebalanced Hadoop
International Journal of Computer & Information Science, Vol. 15, No. 1, June 2014 8
REFERENCES
[1] Hadoop implementation, https://hadoop.apache.org/docs/ [01-20-2014]
[2] Yuanquan Fan, Weiguo Wu, Haijun Cao, Huo Zhu, Xu Zhao, Wei Wei, “Aheterogeneity-aware data distribution and rebalance method in Hadoop cluster”,Seventh China Grid Annual Conference,2012, pp 176-181
[3] Apache Mumak (12-10-2013),https://apache.googlesource.com/hadoop-mapreduce/+/MAPREDUCE-233/src/contrib/mumak
[4] Apache Rumen (12-01-2013),https://hadoop.apache.org/docs/r1.2.1/rumen.html
[5] Hong Tang (12-20-2013), “Using Simulation for Large-Scale Distributed System Verification and Debugging”,2009.10 Hadoop User Group, http://www.slideshare.net/hadoopusergroup/mumak
[6] Apache Hadoop Job Tracker (01-15-2014),https://wiki.apache.org/hadoop/JobTracker
[7] Huang Jie, Huang Bei, Huang Quicen, “ADynamic Load Balancing Algorithm in LAN, Communication Technology (ICCT)”, 12th IEEE International Conference, 2010, pp 137-140
[8] Huang-Chang Hsiao, Huseh-Yi Chung, Haiying Shen, Yu-Chang Chao, “Load Rebalancing for Distributed File Systems in Clouds”, IEEE transactions on parallel and distributed systems, 2013, Vol. 24, No. 5 pp 951-962
[9] Kun Liu, Gaochao Xu and June Yuan, “An improved Hadoop Data Load balancing Algorithm”, Journal of Networks, 2013, Vol. 8, No. 12 pp 2816-2822
[10] Rohan Gandhi, Di Xie, Y. Charlie Hu, “PIKACHU: how to rebalance load in optimizing mapreduce on heterogeneous clusters”, Proceedings of the 2013 USENIX conference on Annual Technical Conference, pp 61-66
[11] RohitParavastu, RozemaryScarlat, BalakrishnanChandrasekaran, “Adaptive Load Balancing in MapReduce using
Flubber”, Department of Computer Science, Duke University [https://www.cs.duke.edu/courses/fall12/cps216/Project/Project/projects/Adaptive_load_balancer/adaptive-load-balancing.pdf]
[12] Amjad Mahmood, Irfan Rashid, “Comparison of Load Balancing Algorithms for Clustered Web Servers”,Proceedings of the 5th International Conference on IT & Multimedia (ICIMU),2011, pp 1-6
[13] Hadoop Data Balancer Administrator Guide, (01-20 2014),https://issues.apache.org/jira/secure/attachment/12369201/BalancerAdminGuide.pdf
[14] J. Dean, S. Ghemawat, “Mapreduce : Simplified Data Processing on Large clusters”, Proceedings of the 6th USENIX Symposium on Operating Systems Design and Implementation (OSDI), 2004, pp 137-150
[15] Mapreduce – The programming model and practice (01-15-2014),http://static.googleusercontent.com/media/research.google.com/en/us/pubs/archive/36249.pdf
[16] F. Ahamed et al, Tarazu: “Optimizing mapreduce on heterogeneous clusters”,ASPLOS XVII Proceedings of the seventeenth international conference on Architectural Support for Programming Languages and Operating Systems, 2012, pp 61-74
[17] Shvachko, K. ,HairongKuang , Radia, S. , Chansler, R. , “The Hadoop Distributed File System”, IEEE 26th Symposium on Mass Storage Systems and Technologies (MSST), 2010, pp 3-7
Ashwin Kumar T K is pursuing his PhD in Department of Computer Science at Oklahoma State University. His research interests includemapreduce optimization, implementing access control and security mechanisms in big
data, machine learning and artificial intelligence.
Jongyeop Kim is pursuing his PhD in Department of Computer Science at Oklahoma State University. His research interests include big data and Mapreduce optimization.
International Journal of Computer & Information Science, Vol. 15, No. 1, June 2014 9

Dr. K.M. George is the head of Department of Computer Science at Oklahoma State University. He received his PhD in Computer Science fromStony Brook University. His research interests include Reliability Theory, Risk
Analysis, Computer Architecture and Big data.
Dr. Nohpill Park is a professor in Department of Computer Science at Oklahoma State University. He received his PhD in Computer Science from Texas A&M University (1997) and his B.S and M.S in Computer Science from Seoul
National University. His research interests include computer architecture, Systems and Fault Tolerance, Performance Evaluation and Reliability.
International Journal of Computer & Information Science, Vol. 15, No. 1, June 2014 10

1
No page numbers
A Study of Continual Usage Behavior for Online Stock Trading-Domestic Brokers of Securities Industry as Examples
Chung-Hung TsaiTzu Chi College of Technology, Taiwan, R.O.C.
Dauw-Song Zhu*National Dong Hwa University, Taiwan, R.O.C.
*Corresponding AuthorShiang-Ru Wang
Tzu Chi College of Technology, Taiwan, R.O.C.Li-Yen Chien
Fubon Financial Holdings, Taiwan, R.O.C.
Abstract
Under the considerations of trading costs and efficiency, more and more investors choose the way of online stock trading which is fast, convenient, and has preferential fee. The cost of establishing a new customer is five times more than maintaining an old one. As a result, to explore the investors choose continual usage behavior of online security trading system as reference for security industry to promote and improve relevant business in the future. The model of this study is developed by combining DeLone and McLean’s Information System Success Model (D&M IS Success Model) and Technology Acceptance Model (TAM). The variable of “Habit” was collected from “Focus Group” to develop research model. This research consists of 340 valid samples who using domestic opened and operative ones of security e-trade accounts. Then we apply “Structural Equation Modeling” to analyze the data and test hypotheses. Depending on the analysis of real evidences, this study hasfour conclusions: 1. In overall model, according to exogenous variables, “Habit” is the most effective to “Continual Usage Behavior” of online stock trading, and followed by “System Quality”. It reveals that “Habit” have greatly influence on “Continual Usage Behavior”. 2. In three quality aspects, “System Quality” is the most important factor affecting “Continual Usage Behavior”; it is also the only significant factor affecting “Perceived usefulness” and “User Satisfaction”, it shows “System Quality” is the major requirement of continued users. 4. We demonstrate that not only “User Satisfaction” positively affects “Using Intention” and further affects “ContinualUsage Behavior” in this study, but also the most important discovery is “Habit” positive affects “Using Intention” and further affects “Continual Usage Behavior”.
Keywords: Information System Success Model, Technology Acceptance Model (TAM), System Quality, Information Quality, Service Quality, Perceived Usefulness, Perceived Ease of Use, User Satisfaction, Habit, Using Intention, Continual Usage Behavior
1. Introduction The onset of on-line trading can be traced back to
March, 1996 when Security Exchange Committee (SEC) formally approved that securities firms may process on-line trading transactions through Internet with electronic media. The securities industry in Taiwan inevitably experienced the impact from the rapid growth brought by on-line trading trend coming from abroad. In view of the development of domestic securities industry in Taiwan, it is found that most people in Taiwan are trading in the stock market today. The statistics given by Taiwan Stock Exchange shows that the number of trading accounts in the market has reached 15,886,714 as of the end of May, 2011; the number of those who have opened an account is 8,767,290; the numbers of active accounts and active traders are 1,561,595 and 1,446,778 respectively. The number of on-line trading account in the market has reached 12,236,659 as of the end of May, 2011. Data of one securities exchange firm show that it has on-line trading accounts as many as 412,885, about 3% of total onl-line trading accounts in the market, while its average market share is 6.2%. The on-line business takes 31% of the firm's total sale volume, i.e., 2% of the whole market. Judging from these statistical data, we can clearly see a trend that more investors are using on-line trading as one of their means of trading stocks.
In view of the ratio of on-line trading accounts verse all accounts, we can see that there are potential customers yet to be explored. For securities exchange firms, making active effort in understanding investors' impressions on on-linetrading system for the purposes of improving trading system, enhancing system features, creating incentives for using the system, and securing market share, are, among all, the most critical issues to be addressed in successfully expanding on-line customer base. This study thus aims at investigating investors' behavior of continual use of on-line trading system with scientific methods, in an attempt to present the result of the study to securities exchange firms for reference in ever changing market. The study also
International Journal of Computer & Information Science, Vol. 15, No. 1, June 2014 11

2
No page numbers
attempts to develop a more user-friendly interface that meets the requirements of the clients and improves the on-line trading system and the quality of the information provided, thus enabling the on-line trading system to have more diversified features and to minimize the risk of on-line trading through multiple-layer encryption. With all these efforts being made, customers' basic interests may be protected, and their acceptance to the system, increased. The securities exchange firms may thus expand market share and increase on-line trading business as well.
For these reasons, this study is expected to achieve these purposes: (1) to explore investors' attitudes toward on-line trading system and their preferences and the degrees to which they emphasize the value of the quality of the trading system. (2) To explore the influence of mediator on continual use of the system. (3) To explore the weakening and strengthening influences of variable "Habits" on continual use of the system. This study is expected to propose specific strategies and suggestions with respect to the industrial practice and follow-on studies in this area.
2. Literature Review
2.1 Information System Success Model
Based upon the Communication Theory suggested by Shannon and Weaver [1] and by Mason [2], DeLone and McLean [3] proposed the concept of IS Success Model which indicates that System Quality and Information Quality influence the Use of the system and User Satisfaction. DeLone and McLean included Service Quality in their model in 2003. The resulting updated IS Success Model of DeLone and McLean contains six variables which are Information Quality, System Quality, Service Quality, Use, User Satisfaction, and Net Interest.
System Quality, a variable in the technical dimension, has anything to do with how to effectively transform and deliver signals in the process of communication [1]. It includes features such as Flexibility, Stability, Credibility, Usefulness of Particular Function, User-friendly Interface, Ease of Use, and Acceptable Response Time. Scholars also used five characteristics such as Ease of use, Availability, Credibility, Acceptability, Response Time (such as download time) as the main indexes for measuring System Quality in an E-commerce scenario [4]. Information Quality, in the level of meaning, is relevant to how to express to the message recipient the message sent by the right message sender [1], including mainly Information Accuracy, Fitness of information for User, Credibility, Correlation, Completeness, Accuracy, Timeliness, and Brevity [5-6]. In 2003, some scholars further listed characteristics such as Personalization, Completeness, Correlation, Ease of Understanding, and Security as the main indexes for measuring System Quality in an E-commerce scenario [4]. Service Quality refers to the complete service provided by
the service provider [4], which also refers to the punctual, professional, and personalized service provided by the service provider [8]. Furthermore, scholars considered Service Quality as a very important part in E-commerce because poorer Service Quality led to customer loss and reduced consumption behavior of the consumers [4].
Use refers to the use of the system, such as frequency of system use, number of users, time of use, etc. Moreover,Scholars also suggested that user behavior be measured with User Intention because Intention was a kind of attitude while Use was a behavior; therefore, investigation in various dimensions may lead to the understanding of the effects coming from the dimensions of Process and Causality [9]. Scholars further used, in E-commerce scenario, behaviors such as information searching, trade execution, etc., as defined for the use of the web site [4]. User Satisfaction refers to consumers' view of and attitude toward Information System, which is also an important index for measuring customers' view of the system. This index includes repeated purchase and repeated use of the web site. Net Interest is an index for measuring interests of the past and the future in various dimensions, including the dimensions of customer, supplier, organization, and market. Scholars also listed the following indexes as the main ones for measuring Net Interests in E-commerce scenario: Cost Saving, Market Expansion, Sales Increase, Search Cost Reduction, and Time Saving.
In this study, Acceptance of Technology Theory was employed in combination with variables such as Information Quality, System Quality, Service Quality, and User Satisfaction; the proposition made by Seddon [9] was also used to include Use Intention in the study framework for further exploration. Net Interest was not listed as a result variable in this study mainly because Customer Satisfaction, instead of factors in the dimension of interest, was listed as the most important factor of success in the study of nationwide Taxation Information System [10]. As a result, how User Satisfaction affects subsequent usage behavior of on-line traders in the scenario of on-line trading was explored in this study.
2.2 Technology Acceptance Model (TAM)
The Technology Acceptance Model (TAM) is a well-accepted intention model for predicting and explaining IT usage [11]. TAM identifies two relevant beliefs, that is, perceived ease of use and perceived usefulness. Perceived ease of use is defined as the extent to which an individual believes that using the system will be free of effort, while perceived usefulness is defined as the extent to which an individual believes that using the system will enhance the job performance [12]. According to TAM, the usage of information technology is influenced by behavioral intention to use the information technology, while behavioral intention is determined jointly by perceived ease of use and perceived
International Journal of Computer & Information Science, Vol. 15, No. 1, June 2014 12
3
No page numbers
usefulness. Perceived usefulness is also influenced by perceived ease of use and external variables. TAM has been widely applied in practice, extended in academics, and empirically tested in the field of information management in the last decade. Based on TAM, some studies that have studied patients’ perceptions of healthcare information systems [13]. In addition, some studies have utilized TAM to investigate patients’ adoption of healthcare information systems and found TAM provides an appropriate theoretical basis [14-17].
2.3 User Satisfaction
Bauer, Grether and Leach [18] pointed that Satisfaction is defined as the evaluation of the difference between expected interest and received interest. Fornell [19] also pointed that User Satisfaction is overall impression over purchased product or used service, an attitude produced from the experience. Per Expected Value Theory developed byAjzen and Fishbein [20], external variables affect the result and the belief obtained from the execution of behavior, thus further shaping attitude toward the behavior. Attitude affects Behavior Intention, and the behavior itself eventually; thus the satisfaction experienced by the user will lead to different results. When a user is dissatisfied, negative attitude toward behavior may be produced, thus affecting Behavior Intention and Final User Behavior. Therefore, Satisfaction have great influence on behavior.
From the perspective of Information System, Satisfaction is an important factor for measuring Information Success [9]. DeLone and McLean [3] also suggested Satisfaction may be listed as an important influential factor in the studies related to Information System. The past studies also reveal that factors such as Information Quality, System Quality, Service Quality, Perceived Usefulness, and Perceived Ease of Use affect system user's satisfaction [10; 21-22]; therefore, User Satisfaction was added to the model of this study for exploring the influences of predisposing factors on on-line traders' satisfaction and subsequent usagebehavior.
2.4 Habits
Habit is understood as an automatic response produced as a result of repeated learning, through which certain functional objective or final status may be achieved [23-24]. Scholars also point out that habit is not something that one is born with, but it must be acquired through learning [23]. As opposed to intentional behavior, the development of habit does not need planning and deliberately controlled activity [25]; thus, it requires no deliberate attention; it is exercised automatically [24; 26]and requires the least amount of mental effort [27].
The concept of habit has been widely explored in studies of various areas, including Social Psychology, Health
Science, Market and Consumer Behavior, Organization Behavior, etc. This indicates that habit is one of the important influential factors in the study of Praxeology. However, habit was only mentioned in few studies concerning Information System [28]. Limayem, Hirt and Cheung [28] were few of the scholars who began to explore the influence of habit on Information System. This study points out that habit may make adjustment between website users' Intention of Use and Behavior of Use; it further defines habit, in accordance with the use scenario of Information System, as the degree to which one tends to use Information System automatically in order to respond to certain condition. Thus, habit is included in the model of this study and is listed as a predisposing factor to explore the influence of habit on the Intention of Use. This study further investigates if habit has any direct influence on the Intention of Use in addition to its effect of making adjustment to the Intention and behavior.
2.5 The Intention and Behavior of Continual Use
The Intention of Continual Use refers to user's idea about using the Information System continually in the future while the decision of such usage is dependent on the user's experience with the Information System and the degree of acceptance of such a system [29]. Scholars also point out that the factors which influence user's decision for continual useof Information System and the factors which influence consumer's decision for repeated purchase are similar because both kinds of decision may be influenced by the following three factors: (1) the first decision whether or not to accept or trade; (2) the first experience with the use of Information System or products; (3) the potential factors that may change the original decision [29]. The Intention of Continual Use of Information System is described as the user's idea about the decision of continual use after having used such a system. The Intention of Continual Use and User's experience with the first use pose different significances. From a long term perspective, the success of Information System depends on users' Behavior of Continual Use, but not merely on one-time usage behavior [30-31].
Behavior of Continual Use refers to the behavior pattern of continual use of Information System [28]. In many past studies factors such as Perceived Usefulness, Perceived Ease of Use, Satisfaction, and Attitude toward Behavior could influence users' Intention of Continual Use which further influenced the Behavior of Continual Use [32]. Therefore, Behavior of Continual Use was included and explored in this study.
2.6 Inter-variable Relationships and Hypotheses
2.6.1 Relationships of Perceived Usefulness with System Quality, Information Quality, and Service Quality
International Journal of Computer & Information Science, Vol. 15, No. 1, June 2014 13
4
No page numbers
Past studies in the field of Information Technology (IT) show that factors in Information System Success model, such as System Quality, Information Quality, and Service Quality, can influence Perceived Usefulness in the model of Acceptance of Technology. For example, in a study on taxation professionals' experience with the Tax Information System (TAXIS) of Greece, it was discovered that the factors experienced by users, such as System Quality, Information Quality, and Service Quality, influence Perceived Usefulness experienced by the user in a positive way [10]. In a study on the measurement of the Intention on using Healthcare Information System, it was discovered that Information Quality and Service Quality had significant positive influence on Perceived Usefulness [33]. In the relevant studies on how to provide a more efficient and cost-saving Government Operation Model for Gambia, it was found that Information Quality had significant positive influence on Perceived Usefulness [34]. Moreover, many studies also point out that System Quality, Information Quality, and Service Quality have significant positive influence on Perceived Usefulness [11; 35-36]. Thus, System Quality, Information Quality, Service Quality are used as predisposing factors for Perceived Usefulness; therefore, these hypotheses are proposed in this study:H1: System Quality has positive influence on Perceived
Usefulness.H2: Information Quality has positive influence on Perceived
Usefulness.H3: Service Quality has positive influence on Perceived
Usefulness.
2.6.2 Relationships of User Satisfaction with System Quality, Information Quality, and Service Quality
Past studies in the field of Information Technology (IT) show that factors in Information System Success model, such as System Quality, Information Quality, and Service Quality, have positive influence on User Satisfaction. For example, in a study on taxation professionals' experience with the Tax Information System (TAXIS) of Greece, it was discovered that the factors experienced by users, such as System Quality, Information Quality, and Service Quality influence Perceived Usefulness experienced by the user in a positive way [10]. In such a study, there was a weak correlation between System Quality and User Satisfaction. The researcher of the study inferred that this was so because subjects of the survey were very skillful users of computer and Internet. In a study about a test of Clinical Information System it was found that Information Quality had significant positive influence on Satisfaction [21]. In a study about a Virtual Information Exchange Community, it was discovered that the Information Quality and System Quality experienced by the user had positive influence on User Satisfaction. While in an Information Technology outsourcing study, it was found Service Quality had significant positive influence on User Satisfaction [11]. Moreover, many studies also point out that System Quality, Information Quality, and Service
Quality have significant positive influence on User Satisfaction [9; 37-45]. Thus, System Quality, Information Quality, Service Quality are used as predisposing factors for User Satisfaction; therefore, these hypotheses are proposed in this study:H4: System Quality has positive influence on User
Satisfaction.H5: Information Quality has positive influence on User
Satisfaction.H6: Service Quality has positive influence on User
Satisfaction.
2.6.3 Relationships of Perceived Ease of Use with Perceived Usefulness and User Satisfaction
In studies dealing with various subjects such as the measurement of the Intent about using Healthcare Information System, Cellphone Application System, and E-learning System, it was found that Perceived Ease of Use had significant positive influence on Perceived Usefulness [46-48]. It was also discovered that Perceived Usefulness had significant influence on User Satisfaction in other studies dealing with subjects like Information TechnologyOutsourcing, Cellphone Application System, User's Acceptance of On-line Video Software, Information-Oriented Cellphone System [29; 46; 49-51]. Perceived Usefulness and Perceived Ease of Use were also found to have significant positive influence on User Satisfaction in the study on Mobile Technology Application (Mobile technology usage and B2B). Although the assumption that Perceived Ease of Use may influence User Satisfaction indirectly through Perceived Usefulness was employed in the framework of many past studies, such an assumption was employed only in a study on Cellphone Application System made in 2012 when in search of recent literature. The result of such a study shows that Perceived Ease of Use does not have any influence on User Satisfaction [46]. Even so, this study still listed Perceived Usefulness and Perceived Ease of Use together as predisposing factors that influence User Satisfaction in accordance with the model of Acceptance of Technology Theory. These hypotheses are thus proposed:H7: Perceived Ease of Use has positive influence on
Perceived Usefulness.H8: Perceived Ease of Use has positive influence on User
Satisfaction.H9: Perceived Usefulness has positive influence on User
Satisfaction.
2.6.4 Relationships of User Satisfaction and Intention of Use with Behavior of Continual Use
According to Expectation Confirmation Theory (ECT) proposed by Oliver [52], it has been further verified that Satisfaction has significant positive correlation with Intention of Continual Use, and such a correlation has led to Behavior of Continual Use. User Satisfaction is found to
International Journal of Computer & Information Science, Vol. 15, No. 1, June 2014 14

5
No page numbers
have significant positive influence on users' Intention of Continual Use in studies dealing with subjects such as Information-Oriented Cellphone System, E-leaning System, Verification of Information System with ECT, and Social Network [29; 51; 53-54]. These hypotheses are thus proposed in this study:H10: User Satisfaction has positive influence on Intention of
Use.
2.6.5 Relationships of Habit, Intention of Use with Behavior of Continual Use
In a study on On-line Air Ticket Booking system, users' habit is found to have significant positive influence on their Intention of Continual Use; that is to say, the Intention of Continual Use may be enhanced when a user has developed a habit of booking ticket through a particular web site [55-56]. Similar findings are also found in studies dealing with the subjects like the use of Mini Blog, E-learning System, and the habit of using Information Technology [29; 57-58]. This clearly indicates that the habit of use is an important factor that influences users' Intention of Continual Use. In two studies that address On-line Air Ticket Booking and E-learning System respectively, users' Intention of Continual Use has significant positive influence on Behavior of Continual Use [29; 55-56]. These hypotheses are thus proposed in this study:H11: Habit has positive influence on Intention of Use.H12: Intention of Use has positive influence on Behavior of
Continual Use.
3. Research Method
3.1 System Quality
In light of studies on the subject of System Quality, this study summarized and employed their views, and defined System Quality as the degree to which the user benefits from the performance of information output by an on-line trading system.
3.2 Information Quality
In light of studies on the subject of Information Quality, this study summarized and employed their views, and defined Information Quality as the degree to which the user benefits from the performance of Information Technology (IT) processing and information delivery.
3.3 Service Quality
In light of studies on the subject of Service Quality, this study summarized and employed their views, and defined Service Quality as the degree to which the user benefits from the performance of a series of visible and invisible interactions between users and providers.
3.4 Perceived Usefulness
In light of studies on the subject of Perceived Usefulness, this study summarized and employed their views, and defined Perceived Usefulness as the degree to which the user believe that the on-line trading system may increase their investment return.
3.5 Perceived Ease of Use
In light of studies on the subject of Perceived Ease of Use, this study summarized and employed their views, and defined Perceived Ease of Use as the degree of ease to which the user may quickly learn how to operate or use the on-line trading system.
3.6 User Satisfaction
In light of studies on the subject of User Satisfaction, this study summarized and employed their views, and defined User Satisfaction as the degree of response with which the user experiences from the outputs of the on-line trading system.
3.7 Intention of Use
In light of studies on the subject of Intention of Use, this study summarized and employed their views, and defined Intention of Use as the degree of willingness of continual use that the user may show toward the on-line trading system.
3.8 Habits
In light of studies on the subject of Habits, this study summarized and employed their views, and defined Habits as the degree to which the use of on-line trading system has become an automatic response. Survey questions mainly come from those provided by Limayem, Hirt, and Cheung[28].
3.9 Behavior of Continual Use
In light of studies on the subject of Behavior of Continual Use, this study summarized and employed their views, and defined Behavior of Continual Use as the frequency of a repeated behavior that the investor may recently have in using the on-line trading system.
3.10 Data Collection Method
The study population of this study is based on the statistical numbers of on-line trading accounts and active accounts, provided by Taiwan Stock Exchange and the securities firms in Taiwan. Judgmental/Purposive Samplings were employed to determine subjects taken from on-line trading groups in Taiwan, including employees of all major
International Journal of Computer & Information Science, Vol. 15, No. 1, June 2014 15

6
No page numbers
securities firms, securities professionals, and senior on-line traders. Sampling data were collected from questionnaires, mainly in the form of paper and secondarily through web survey. Moreover, such a questionnaire was added to a professional survey web site MY3Q (http://www.my3q.com) for continual sampling data collection. Moreover, relevant information collected from focused interviews was summarized and compared against the theory model concept adopted in this study in order to determine the final study framework and propose study hypotheses.
The survey was open for a period of two months, from early April to middle June, 2011. A total of 523 samples were collected, including 71 web questionnaires (statistical significance not reached, according to chi-square test). There were 340 valid questionnaires (65% valid response rate) after invalid samples were screened and those with missing value(s) excluded.
4. Data Analysis
4.1 Descriptive Statistics Analysis
In gender analysis, 46.6% of subjects were male while 53.4% were female. Age groups of subjects. The group in the age of 31-40 years old was the majority (35.8%) while that of 41-50 years old came next (27.9%). With respect to marital status, 49.0% of all subjects were married; 41.3%, unmarried; and 9.7%, single. With respect to education, the majority of the subjects were those with college degree (69.2%); those with senior high school/vocational high school degree came next (17.3%). As for occupation, the majority of subjects worked in the service industry (41.1%) those who were government employees and teachers came next (16.4%). As for average monthly income, people with a monthly income between NTS 30,000 and 50,000 were the majority (44.7%); those between NTS 20,000 and 30,000 came next (25%). In the experience of investment in securities, those with 7-10 years of experience were the majority (19.9%), nearly one fifth of the total valid samples; those with 1-3 years of experience came next (17.3%).
Overall speaking, of all valid samples, most of the subjects worked in the service industry, indicating there exists a massive group of people working in the service industry in today's highly diversified industries and business world; government employees and teachers were next in number, seemingly indicating that people under this category, who already have stable incomes, hope to have alternative source of income. In the respect of gender, the ratio between male and female samples is 47:53 with female samples slightly more than male ones. Such a ratio matches well with that of female and male on-line traders (49:51), indicating that among active traders, female traders are more active than male ones, and that female is not inferior to male in holding concept of money management to certain degree
in today's society. The fact that subjects with college degree were the majority, means that those who would choose on-line trading as a means for stock exchange investment were those who possess certain degree of knowledge about technology.
4.2 Measurement Model ResultsTo validate the measurement model, three types of
validity were assessed: content validity, convergent validity, and discriminant validity. Content validity was done by interviewing senior system users and pilot-testing the instrument. And the convergent validity was validated by examining Cronbach’s α, composite reliability and average variance extracted from the measures [59]. As shown in Table 4-2-1, the Cronbach’s α of every subscale range from 0.84 to 0.98 was above the acceptability value 0.7(Nunnally, 1978). Moreover, the composite reliability values, which ranged from 0.85 to 0.98, and the average variances extracted by our measures, which ranged from 0.54 to 0.98, are all within the commonly accepted range greater than 0.5 [59]. In addition, all measures are significant on their path loadings at the level of 0.001. Therefore, the convergent validities of all constructs are confirmed.
TABLE I. 4-2-1. CONSTRUCT RELIABILITY AND CONVERGENTVALIDITY
Construct Cronbach’s α Composite ReliabilityAverage Variance Extracted
System Quality 0.96 0.96 0.77
Information Quality 0.97 0.96 0.74
Service Quality 0.98 0.88 0.98
Perceived Usefulness 0.97 0.97 0.73
Perceived Ease of Use 0.91 0.93 0.54
User Satisfaction 0.97 0.96 0.90
Intention of use 0.97 0.97 0.83
Habits 0.98 0.98 0.86
Behavior of Continual Use 0.84 0.85 0.59
In addition, according to Fornell and Larcker [60], discriminant validity can be tested among all constructs by comparing the average variance extracted (AVE) of each construct with the squared correlation of that construct and all the other constructs. All squared correlations between two constructs are less than the average variance extracted of both constructs. Therefore, the results confirm that the discriminant validity of constructs in the study is satisfactory.
4.3 Structural Model Results
International Journal of Computer & Information Science, Vol. 15, No. 1, June 2014 16
7
No page numbers
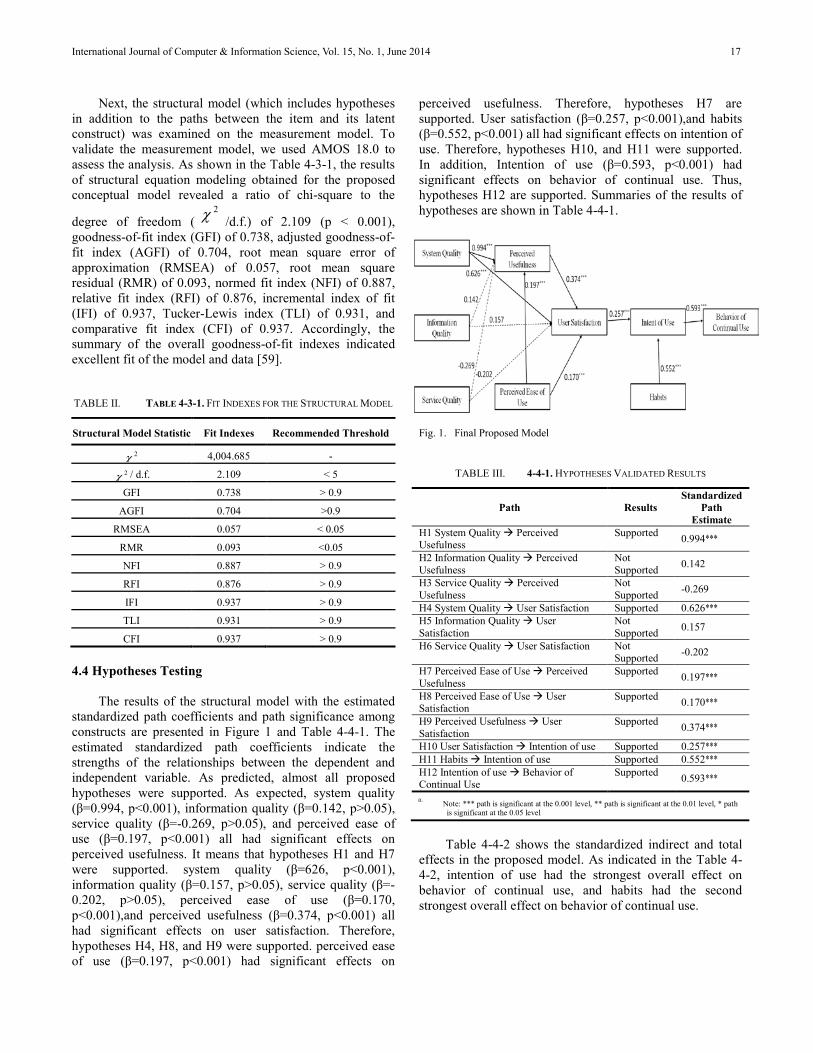
Next, the structural model (which includes hypothesesin addition to the paths between the item and its latent construct) was examined on the measurement model. To validate the measurement model, we used AMOS 18.0 to assess the analysis. As shown in the Table 4-3-1, the results of structural equation modeling obtained for the proposed conceptual model revealed a ratio of chi-square to the
degree of freedom (2χ /d.f.) of 2.109 (p < 0.001),
goodness-of-fit index (GFI) of 0.738, adjusted goodness-of-fit index (AGFI) of 0.704, root mean square error of approximation (RMSEA) of 0.057, root mean square residual (RMR) of 0.093, normed fit index (NFI) of 0.887,relative fit index (RFI) of 0.876, incremental index of fit (IFI) of 0.937, Tucker-Lewis index (TLI) of 0.931, and comparative fit index (CFI) of 0.937. Accordingly, the summary of the overall goodness-of-fit indexes indicatedexcellent fit of the model and data [59].
TABLE II. TABLE 4-3-1. FIT INDEXES FOR THE STRUCTURAL MODEL
Structural Model Statistic Fit Indexes Recommended Threshold
2χ 4,004.685 -2χ / d.f. 2.109 < 5
GFI 0.738 > 0.9
AGFI 0.704 >0.9
RMSEA 0.057 < 0.05
RMR 0.093 <0.05
NFI 0.887 > 0.9
RFI 0.876 > 0.9
IFI 0.937 > 0.9
TLI 0.931 > 0.9
CFI 0.937 > 0.9
4.4 Hypotheses Testing
The results of the structural model with the estimated standardized path coefficients and path significance among constructs are presented in Figure 1 and Table 4-4-1. The estimated standardized path coefficients indicate the strengths of the relationships between the dependent and independent variable. As predicted, almost all proposed hypotheses were supported. As expected, system quality(β=0.994, p<0.001), information quality (β=0.142, p>0.05),service quality (β=-0.269, p>0.05), and perceived ease of use (β=0.197, p<0.001) all had significant effects on perceived usefulness. It means that hypotheses H1 and H7 were supported. system quality (β=626, p<0.001),information quality (β=0.157, p>0.05), service quality (β=-0.202, p>0.05), perceived ease of use (β=0.170, p<0.001),and perceived usefulness (β=0.374, p<0.001) all had significant effects on user satisfaction. Therefore, hypotheses H4, H8, and H9 were supported. perceived ease of use (β=0.197, p<0.001) had significant effects on
perceived usefulness. Therefore, hypotheses H7 are supported. User satisfaction (β=0.257, p<0.001),and habits (β=0.552, p<0.001) all had significant effects on intention of use. Therefore, hypotheses H10, and H11 were supported. In addition, Intention of use (β=0.593, p<0.001) hadsignificant effects on behavior of continual use. Thus, hypotheses H12 are supported. Summaries of the results of hypotheses are shown in Table 4-4-1.
Fig. 1. Final Proposed Model
TABLE III. 4-4-1. HYPOTHESES VALIDATED RESULTS
Path ResultsStandardized
Path Estimate
H1 System Quality Perceived Usefulness
Supported 0.994***
H2 Information Quality Perceived Usefulness
Not Supported 0.142
H3 Service Quality Perceived Usefulness
Not Supported -0.269
H4 System Quality User Satisfaction Supported 0.626***H5 Information Quality User Satisfaction
Not Supported 0.157
H6 Service Quality User Satisfaction Not Supported -0.202
H7 Perceived Ease of Use Perceived Usefulness
Supported 0.197***
H8 Perceived Ease of Use User Satisfaction
Supported 0.170***
H9 Perceived Usefulness User Satisfaction
Supported 0.374***
H10 User Satisfaction Intention of use Supported 0.257***H11 Habits Intention of use Supported 0.552***H12 Intention of use Behavior of Continual Use
Supported 0.593***
a. Note: *** path is significant at the 0.001 level, ** path is significant at the 0.01 level, * path is significant at the 0.05 level
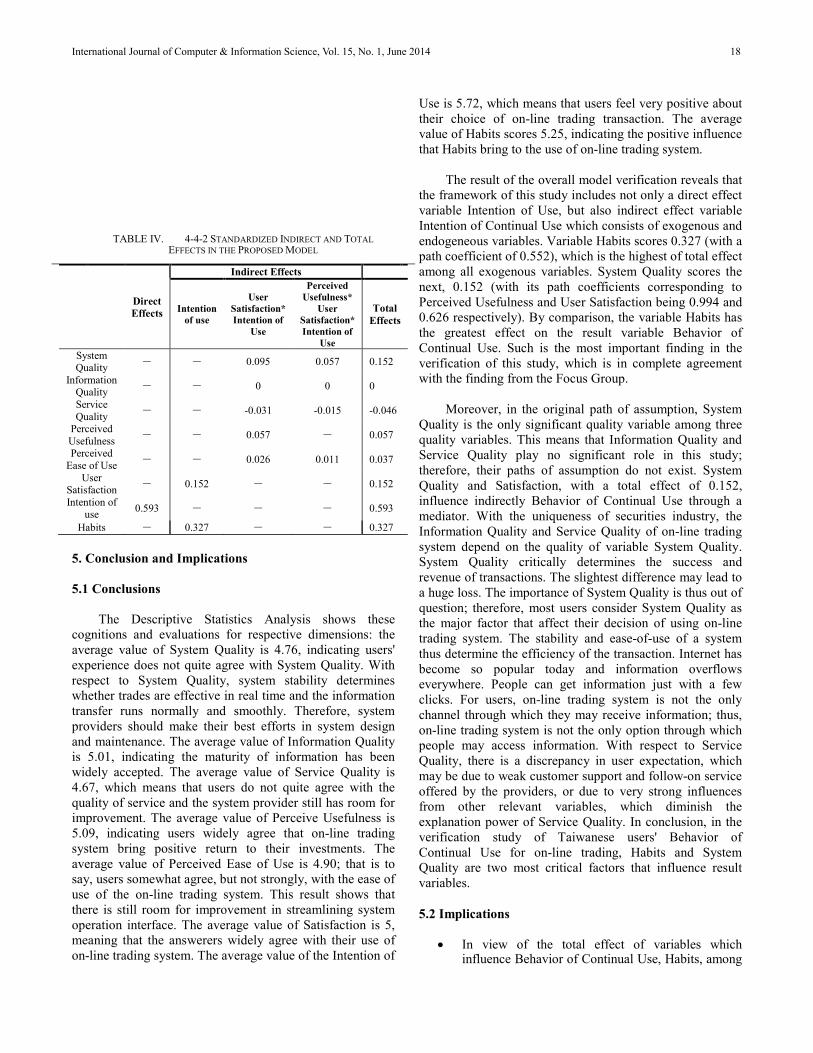
Table 4-4-2 shows the standardized indirect and total effects in the proposed model. As indicated in the Table 4-4-2, intention of use had the strongest overall effect on behavior of continual use, and habits had the second strongest overall effect on behavior of continual use.
International Journal of Computer & Information Science, Vol. 15, No. 1, June 2014 17
8
No page numbers
TABLE IV. 4-4-2 STANDARDIZED INDIRECT AND TOTAL EFFECTS IN THE PROPOSED MODEL
DirectEffects
Indirect Effects
Intention of use
User Satisfaction*Intention of
Use
Perceived Usefulness*
User Satisfaction*Intention of
Use
Total Effects
System Quality - - 0.095 0.057 0.152
Information Quality - - 0 0 0
Service Quality - - -0.031 -0.015 -0.046
Perceived Usefulness - - 0.057 - 0.057
Perceived Ease of Use - - 0.026 0.011 0.037
User Satisfaction - 0.152 - - 0.152
Intention of use 0.593 - - - 0.593
Habits - 0.327 - - 0.327
5. Conclusion and Implications
5.1 Conclusions
The Descriptive Statistics Analysis shows these cognitions and evaluations for respective dimensions: the average value of System Quality is 4.76, indicating users' experience does not quite agree with System Quality. With respect to System Quality, system stability determines whether trades are effective in real time and the information transfer runs normally and smoothly. Therefore, system providers should make their best efforts in system design and maintenance. The average value of Information Quality is 5.01, indicating the maturity of information has been widely accepted. The average value of Service Quality is 4.67, which means that users do not quite agree with the quality of service and the system provider still has room for improvement. The average value of Perceive Usefulness is 5.09, indicating users widely agree that on-line trading system bring positive return to their investments. The average value of Perceived Ease of Use is 4.90; that is to say, users somewhat agree, but not strongly, with the ease of use of the on-line trading system. This result shows that there is still room for improvement in streamlining system operation interface. The average value of Satisfaction is 5, meaning that the answerers widely agree with their use of on-line trading system. The average value of the Intention of
Use is 5.72, which means that users feel very positive about their choice of on-line trading transaction. The average value of Habits scores 5.25, indicating the positive influence that Habits bring to the use of on-line trading system.
The result of the overall model verification reveals that the framework of this study includes not only a direct effect variable Intention of Use, but also indirect effect variable Intention of Continual Use which consists of exogenous and endogeneous variables. Variable Habits scores 0.327 (with a path coefficient of 0.552), which is the highest of total effectamong all exogenous variables. System Quality scores the next, 0.152 (with its path coefficients corresponding to Perceived Usefulness and User Satisfaction being 0.994 and 0.626 respectively). By comparison, the variable Habits has the greatest effect on the result variable Behavior of Continual Use. Such is the most important finding in the verification of this study, which is in complete agreement with the finding from the Focus Group.
Moreover, in the original path of assumption, System Quality is the only significant quality variable among three quality variables. This means that Information Quality and Service Quality play no significant role in this study; therefore, their paths of assumption do not exist. System Quality and Satisfaction, with a total effect of 0.152, influence indirectly Behavior of Continual Use through a mediator. With the uniqueness of securities industry, the Information Quality and Service Quality of on-line trading system depend on the quality of variable System Quality. System Quality critically determines the success and revenue of transactions. The slightest difference may lead to a huge loss. The importance of System Quality is thus out of question; therefore, most users consider System Quality as the major factor that affect their decision of using on-line trading system. The stability and ease-of-use of a system thus determine the efficiency of the transaction. Internet has become so popular today and information overflows everywhere. People can get information just with a few clicks. For users, on-line trading system is not the only channel through which they may receive information; thus, on-line trading system is not the only option through which people may access information. With respect to Service Quality, there is a discrepancy in user expectation, which may be due to weak customer support and follow-on service offered by the providers, or due to very strong influences from other relevant variables, which diminish the explanation power of Service Quality. In conclusion, in the verification study of Taiwanese users' Behavior of Continual Use for on-line trading, Habits and System Quality are two most critical factors that influence result variables.
5.2 Implications
• In view of the total effect of variables which influence Behavior of Continual Use, Habits, among
International Journal of Computer & Information Science, Vol. 15, No. 1, June 2014 18
9
No page numbers
exogenous factors, scores the highest, and System Quality, next. That is to say, no variable is more important than the variable Habits when compared with both theories combined. If predictor variables of both theories are considered, System Quality is the most important one among the five variables (System Quality, Information Quality, Service Quality, Perceived Usefulness, and Perceived Ease of Use).
• Habits plays an important role in affecting Behavior of Continual Use. When an old system is phased out and a new system is introduced, issues such as how to deal with lower than expected use or the decrease of usage are often raised. When a new system is successfully introduced, its efficiency is however hampered by users' continual use (habit) of the old system. Any managerial intervening efforts that attempt to change users' Intention may likely fail The past studies also reveal that converting users' behavior of use to a habit may reduce conscious thinking that exist between Intention of Continual Use and Behavior of Use, thus leading to increased Behavior of Use [28; 53; 55]. As a result, how to nurture users' habit, making facilitation of a new behavior into the development of a habit is an important issue to managers.
• For managers with relevant responsibilities, focusing resources in the research and improvement of System Quality is of highest priority because poor System Quality increases users' cost in the process of researching for and processing data, leads to a waste of users' time, and produces irrelevant and useless information, thus leading to a decrease of users' intention of use [61]. This study suggests that managers may reference the use of the Focus Group and invite experienced on-line trading investors to participate in system operation on site so that managers may observe most users' methods of operation and their habits for reference in the improvement of system design.
• According to the studies on conformity behavior, group decision often overrides individual decision. If more information is shared and more views are considered, discussion with rich information presented can improve decision making process of a group. This is what brainstorming stands for. From the perspective of behavioral finance, this is also how stock market operates. Under the trading decisions made by millions of individual investors and corporate investors at the same time, all stocks may be properly priced. Although their predictions over future returns are often wrong, overall speaking, their predictions are seemingly more accurate than an individual investor. This also reflects a generally accepted phenomenon, known as Groupthink. Individuals in a group sometime may enhance each other's belief, making them believe
certain view is correct while in fact it is wrong. Investors now are deeply affected by this concept of conformity behavior and pay special attention to so-called Market Trend and Real-time Information. Therefore, if on-line trading system can enhance and excel in the provision of such information, this added value will surely attract more users.
• In practice, employees in this industry often receive complaints about the system from the clients whose feedbacks suggest that securities exchange firms spend more efforts in customer support and follow-on services, such as setting up privilege of privacy and confidentiality terms. Moreover, stronger emphasis should be laid on the development of features that will enhance user interaction, such as detailed and step-by-step instruction of on-line trading, stock price information links, customer care hot line, or on-line real time customer care system. With these efforts being made, users’ acceptance to the system may be enhanced and their use of on-line trading system may continue.
References
[1] C. E. Shannon, and W. Weaver, The mathematical theory of communication, Urbana, Illinois: University of Illinois Press, 1949.
[2] R. O. Mason, "Measuring information output: A communication systems approach", Information & Management, vol.15, pp. 219-234, 1978.
[3] W. H. DeLone, and E. R. McLean, "Information systems success: The quest for the dependent variable", Information System Research, vol. 3,no. 1, pp. 60-95, 1992.
[4] W. H. DeLone, and E. R. McLean, "The DeLone and McLean model of information systems success: A ten year update", Journal of Management Information Systems, vo1. 9, no.4,pp. 9-30, 2003.
[5] J. E. Bailey, and S. W. Pearson, "Development of a tool for measuring and analyzing computer user satisfaction", Management Science, vol. 29,no .5, pp. 530-545, 1983.
[6] A. Rai, S. S. Lang, and R. B. Welker, "Assessing the validity of IS success models: An empirical test and theoretical analysis",Information systems research, vol. 13, no. 1, pp. 50-69, 2002.
[7] R. Y. Wang, and D. M. Strong, "Beyond accuracy: What data quality means to data consumers", Journal of Management Information Systems, vol. 12, no. 4, pp. 5-34,1996.
[8] J. H. Chou, "Using DeLone and McLean model to analyze determinants of portal sites success",Journal of Information Management-Concepts,
International Journal of Computer & Information Science, Vol. 15, No. 1, June 2014 19
10
No page numbers
Systems, and Applications, vol. 8, no. 1, pp. 109-132, (2006.
[9] P. B. Seddon, "A Respecification and Extension of the DeLone and McLean Model of IS Success", Information systems research, vol. 8,no. 3, pp. 240-253, 1997.
[10] F. Jordan, S. Charalambos, H. Dimitrios, and T.Maria, "Measuring the success of the Greek taxation information system", International Journal of Information Management, vol. 30,no. 1, pp. 47-56, 2010.
[11] T. Ahn, S. Ruy, and I. Han, "The impact of the online and offline features on the user acceptance of Internet shopping malls",Electronic Commerce Research, vol. 3, no. 4,pp. 405–420, 2004.
[12] F. D. Davis, R. P. Bagozzi, and P. R. Warshaw,"User acceptance of computer technology: A comparison of two theoretical models",Management Science, vol. 35, no. 8, pp. 982-1003, 1989.
[13] C. Or, B. T. Karsh, D. J. Severtson, L. J. Burke, R. L. Brown, and P. F. Brennan, "Factors affecting home care patients’ acceptance of a web-based interactive self-management technology", J. Am. Med. Informat. Assoc. 2011, vol. 18, pp. 51–59, 2011.
[14] J. C. Huang, "Innovative health care delivery system – A questionnaire survey to evaluate the influence of behavioral factors on individuals’ acceptance of telecare", Comput. Biol. Med, vol. 43, pp. 281–286, 2013.
[15] C. F. Liu, Y. C. Tsai, and F. L. Jang, "Patients’acceptance towards a web-based personal health record system: An empirical study in Taiwan",Int. J. Environ. Res. Publ. Health, vol. 10, pp. 5191–5208, 2013.
[16] M. Rahimpour, N. H. Lovell, B. G. Celler, and J. McCormick, "Patients ’ perceptions of a home telecare system", Int. J. Med. Informat,vol. 77, pp. 486–498, 2008.
[17] R. Wade, C. Cartwright, and K. Shaw, "Factors relating to home telehealth acceptance and usage compliance", Risk Manag. Healthc. Pol, vol. 5,pp. 25–33, 2012.
[18] H. H. Bauer, M. Grether, and M. Leach,"Building customer relations over the internet",Industrial Marketing Management, vol. 31, no. 2, pp. 155-163, 2002.
[19] C. Fornell, "A national customer satisfaction barometer: the Swedish experience", The Journal of Marketing, vol. 56, no.1, pp. 6-21,1992.
[20] I. Ajzen, and M. Fishbein, Understanding
attitudes and predicting social behavior,Englewood Cliffs, NJ: Prentice-Hall, 1980.
[21] G. S. Dianna, and A. E. Judith, "Development and initial evaluation of the Clinical Information Systems Success Model (CISSM) ",International Journal of Medical Informatics,vol. 82, no. 6, pp. 539-552, 2013.
[22] P. Seddon, and S. K. Yip, "An Empirical Evaluation of User Information Satisfaction (UIS) Measures for Use with General Ledger Accounting Software", Journal of Information Systems, pp. 75-92, 1992.
[23] B. Verplanken, H. Aarts, A. Van. Knippenberg, and A. Moonen, "Habit versus planned behavior: A field experiment", British Journal of Social Psychology, vol. 37, no. 1, pp. 111–
128, 1998.[24] H. C. Triandis, Handbook of cross-cultural
psychology, Boston: Allyn and Bacon, 1980.[25] E. Lindbladh, and C. H. Lyttkens, "Habit versus
choice: the process of decision-making in health-related behaviour", Social Science & Medicine, vol. 55, no. 3, pp. 451-465, 2002.
[26] O. Sheina, B. Catherine, S. Kellie, and C. Mark, " The Theory of Planned Behavior and Ecstasy Use: Roles for Habit and Perceived Control Over Taking Versus Obtaining Substances",Journal of Applied Social Psychology, vol. 31,no. 1, pp. 31–47, 2001.
[27] J. A. Ouellette, and W. Wood, "Habit and intention in everyday life: The multiple processes by which past behavior predicts future behavior", Psychological Bulletin, vol. 124, no. 1, pp. 54–74, 1998.
[28] M. Limayem, S. G. Hirt, and M. K. Cheung, Christy, "How habit limits the predictive power of intention: The case of information systems continuance", MIS Quarterly, vol. 31, no. 4, pp. 705-737, 2007.
[29] A. Bhattacherjee, "Understanding information systems continuance: An expectation-confirmation model", Mis Quarterly, vol. 25, no. 3, pp. 351-370, 2001a.
[30] A. Bhattacherjee, "An empirical analysis of the antecedents of electronic commerce service continuance", Decision support systems, vol. 32,no. 2, pp. 201-214, 2001b.
[31] E. Karahanna, D. W. Straub, and N. L.Chervany, "Information technology adoption across time: A cross-sectional comparison of pre-adoption and post-adoption beliefs", MIS Quarterly, vol. 23, no. 2, pp. 183–213, 1999.
[32] Y. S. Kang, j. Min, J. Kim, and H. Lee, "Roles of alternative and self-oriented perspectives in
International Journal of Computer & Information Science, Vol. 15, No. 1, June 2014 20
11
No page numbers
the context of the continued use of social network sites", International Journal of Information Management, vol. 33, no. 3, pp. 496-511, 2013.
[33] F. U. Pai, and K. Huang, "Applying the Technology Acceptance Model to the introduction of healthcare information systems",Technological Forecasting & Social Change,vol. 78, no. 4, pp. 650-660, 2011.
[34] F. Lin, S. S. Fofanah, and D. Liang, "Assessing citizen adoption of e-Government initiatives in Gambia: A validation of the technology acceptance model in information systems success", Government Information Quarterly,vol. 28, no. 2, pp. 271-279, 2011.
[35] F. D. Davis, P. R. Bagozzi, and R. P. Warshaw, "Extrinsic and intrinsic motivation to use computers in the workplace", Journal of Applied Social Psychology, vol. 22, no. 14, pp. 1111–
1132, 1992.[36] V. Venkatesh, and F. D. Davis, "A theoretical
extension of the technology acceptance model: four longitudinal field studies", Management Science, vol. 46, no. 2, pp. 186–204, 2000.
[37] S. P. Brown, and W. W. Chin, "Satisfying and retaining customers through independent service representatives", Decision Sciences, vol. 35, no. 3, pp. 527-550, 2004.
[38] R. Hussein, N. S. A. Karim, and M. H. Selamat,"The impact of technological factors on information systems success in the electronic-government context", Business Process Management Journal, vol. 13, no. 5, pp. 613-627, 2007.
[39] J. Iavari, "An empirical test of the DeLone–
McLean model of information system success",The DATA BASE for Advances in Information Systems, vol. 36, no. 2, pp. 8-27, 2005.
[40] Y. J. Kim, M. T. I. Eom, and J. H. Ahn, "Measuring IS service quality in the context of the service quality-user satisfaction relationship", Journal of Information Technology Theory and Application, vol. 7, no. 2, pp. 53-70, 2005.
[41] T. McGill, and V. Hobbs, "User-developed applications and information systems success: A test of DeLone and McLean ’ s model",Information Resources Management Journal,vol. 16, pp. 24-45, 2003.
[42] A. Parasuraman, V. A. Zeithaml, and L. L.Berry, "A conceptual model of service quality and its implications for future research", Journal of Marketing, vol. 49, no. 4, pp. 41-50, 1985.
[43] P. B. Seddon, and M. Y. Kiew, "A partial test
and development of DeLone and McLean’s model of IS success", Australian Journal of Information Systems, vol. 4, no. 1, pp. 90-109,1996.
[44] Y. S. Wang, and Y. W. Liao, "Assessing eGovernment systems success: A validation of the DeLone and McLean model of information systems success", Government Information Quarterly, vol. 26, no. 4, pp. 717-733, 2008.
[45] Z. Zhang, M. K. O. Leeb, P. Huanga, L. Zhang, and X. Huang, "A framework of ERP systems implementation success in China: An empirical study", International Journal of Production Economics, vol. 98, pp. 56-80, 2005.
[46] F. Agudo-Peregrina, Hernandez-Garcia, and F. J. Pascual-Miguel, "Behavioral intention, use behavior and the acceptance of electronic learning systems: Differences between higher education and lifelong learning", Computers in Human Behavior, vol. 34, pp. 301-314, 2013.
[47] F. U. Pai, and K. Huang, "Applying the Technology Acceptance Model to the introduction of healthcare information systems",Technological Forecasting & Social Change,vol. 78, no. 4, pp. 650-660, 2011.
[48] H. Son, Y. Park, C. Kim, and J. S. Chou, "Toward an understanding of construction professionals' acceptance of mobile computing devices in South Korea: An extension of the technology acceptance model", Automation in Construction, vol. 28, no. 1, 82-90, 2012.
[49] D. Y. Lee, and M. R. Lehto, "User acceptance of YouTube for procedural learning: An extension of the Technology Acceptance Model",Computers and Education, vol. 61, pp. 193-208,2013.
[50] G. Narasimhaiah, and M. S. Toni, "The impact of IT outsourcing on information systems success", Information and Managent, vol. 51,no. 3, pp. 320-335, 2014.
[51] W. S. Lin, and C. H. Wang, "Antecedences to continued intentions of adopting e-learning system in blended learning instruction: A contingency framework based on models of information system success and task-technology fit", Computers and Education, vol. 58, pp. 88-99, 2012.
[52] R. L. Oliver, "A cognitive model of the antecedents and consequences of satisfaction decisions", Journal of marketing research, vol. 17, no. 4, pp. 460-469, 1980.
[53] L. Chen, T. O. Meservy, and M. Gillenson, "Understanding Information Systems Continuance for Information-Oriented Mobile Applications", Communications of the
International Journal of Computer & Information Science, Vol. 15, No. 1, June 2014 21
12
No page numbers
Association for Information Systems, vol. 30, no. 9, pp. 127-146, 2012.
[54] X. L. Jin, C. M. K. Cheung, M. K. O. Lee, and H. P. Chen, "How to keep members using the information in a computer-supported social network", Computers in Human Behavior, vol. 25, no. 5, pp. 1172-1181, 2009.
[55] E. R. Tomás, and C. T. Elena, "Online drivers of consumer purchase of website airline tickets",Journal of Air Transport Management, vol. 32,no. C, pp. 58-64, 2013.
[56] E. R. Tomás, and C. T. Elena, "Online purchasing tickets for low cost carriers: An application of the unified theory of acceptance and use of technology (UTAUT) model",Tourism Management, vol. 43, pp. 70-88, 2014.
[57] S. J. Barnes, and M. Bohringer, "Modeling continuance behavior in microblogging services: The case of twitter", Journal of Computer Information Systems, vol. 51, no. 4, pp. 1-10,2011.
[58] N. K. Lankton, E. V. Wilson, and E. Mao,"Antecedents and determinants of information technology habit", Information & Management,vol. 47, no. 5-6, pp. 300-307, 2010.
[59] J. F. Hair, and R. E. Anderson, R. L. Tatham and W. C. Black, Multivariate data analysis Upper Saddle River, New Jersey: Prentice-Hall International, 1998.
[60] C. Fornell, and D. F. Larcker, "Evaluating structural equation models with unobservable variables and measurement error", J. Market. Res, vol. 18, pp. 39–50, 1981.
[61] B. Gu, P. Konana, B. Rajagopalan, and H. M.Chen, "Competition among virtual communities and user valuation: the case of investing-related communities", Information Systems Research,vol. 18, no. 1, pp. 68-85, 2007.
Chung-Hung Tsai is an associate professor at Tzu Chi College ofTechnology. He received his Ph. D. degree from National Dong-Hwa University. He was one member of the editorial board and reviewer of Journal of Healthcare Management. His current research areas are knowledge
management system, health information system, e-commerce, and telemedicine/telecare/telehealth system management. His academic papers have been published in Technological Forecasting and Social Change (SSCI),Social Behavior and Personality (SSCI), International Journal of Environmental Research and Public Health (SCI), Journal of Medical Imaging and Health Informatics (SCI), International Journal of Information Technology and
Management (EI), Journal of Networks (EI), Journal of Computers (EI), Journal of Multimedia (EI), Advances in Information Sciences and Service Sciences (EI), Lecture Notes in Artificial Intelligence (EI), Key EngineeringMaterial (EI), International Journal for Quality Research(SCIndeks), Journal of e-Business (TSSCI), Journal ofTechnology Management, MIS Review, Journal of American Academy of Business (ABI), Electronic Commerce Studies, Journal of Business Administration, Journal Customer Satisfaction, and Journal of Health Management.
Dauw-Song Zhu is a professor of Marketing in the Department ofBusiness Administration of National Dong-Hwa University (Taiwan) and a fellow of Taiwan College of HealthcareExecutives. Dr. Zhu currently also serves for International Journal of Electronic Customer Relationship
Management (IJECRM) as associate editor, and International Journal of Value Chain Management (IJVCM) as an editorial board member. Professor Zhu served for four years as chairperson of the Department of Accounting in National Dong-Hwa University, as guest editor of International Journal of Management and Decision Making (IJMDM), hosted Supply Chain Management and Information Systems Conference (SCMIS 2006) as co-chairperson, and external examiner in examining DBA dissertation for University of South Australia. He received his Ph. D. degrees from National Sun Yat-Sen University (NSYSU) in Taiwan and from Guongzhou University of Chinese Medicine (College of Acupuncture and Moxibustion) in China and ever studied as a visiting scholar in the University of North Carolina at Greensboro (UNCG). As a consultant and scholar, he has been involved in management practices for a long time. Before earning his Ph. D, he worked for one year in Ministry of Economic Affairs as an officer, two years in Tungs’ Memorial (General) Hospital as special assistant to superintendent, and two years as consultant. Dr. Zhu has taught marketing management, managerial accounting, and research method for business at undergraduate, master, and Ph. D. programs. His current research interests include online consumer behavior and relationship marketing. He has published 50 refereed journal articles in behavioral accounting, consumer behavior and relationship marketing including: Sun Yat-Sen Management Review, Journal of Human ResourceManagement, Management Review, Journal of Management, The Journal of Tokyo International University, Journal of e-Business, National Taiwan University Management Review, International Journal of Accounting Studies, International Journal of Information Technology andManagement (IJITM), Total Quality Management & Business Excellence, Technological Forecasting and Social Change (TFSC) and Journal of Management & Organization (JMO) etc.
International Journal of Computer & Information Science, Vol. 15, No. 1, June 2014 22

13
No page numbers
Shiang-Ru Wang is a research assistant in the academic affair office at Tzu Chi College of Technology. Wang's research focus is e-commerce.She has investigated issues in social network sites, researching the antecedents and outcomes of network sites use.
Li-Yen Chien is section chief in FubonFinancial Holdings. She received MBAdegree from National Dong Hwa University in Taiwan.
International Journal of Computer & Information Science, Vol. 15, No. 1, June 2014 23

Creation of Music Chord Progression Suited for User's Feelings Based on Interactive Genetic Algorithm
Makoto Fukumotoa
Fukuoka Institute of Technology, Japan
Abstract Music chord progression is one of musical elements that compose music piece. The music chord progression can be created freely by a user, however, combination of music chords is innumerable to define the progression. To define the progression, chord progression theory and basic patterns are often used. However, with these methods, it is hard for general users to create a music progression suited for each user’s feelings. In order to create the chord progression suited for the user's feelings, user's own basic music knowledge and experience are required. A previous study has proposed an Interactive Genetic Algorithm (IGA) that creates music chord progression. This study focused on investigating the efficacies of the proposed IGA creating music chord progression through two listening experiments. As the experiments, searching and evaluating experiments were conducted. As targets of creation of the chord progression, "bright" and "dark" chord progressions were selected as experimental conditions. Each of fourteen subjects participated in the both of the experiments. In the result of the searching experiment, significant increases in fitness value were observed in both of the conditions. In the results of the evaluating experiment, in the 13th generation, large difference in impression between the conditions was observed. Keywords: Evolutionary Computation, Interactive Genetic Algorithm, User’s Feelings, Music Composition, Music Chord Progression. 1. Introduction
We enjoy of multi-media contents in our daily life. Music is one of the most important forms of media for us. Listening to music pieces is expected to change our mind, and the efficacy of listening music pieces is applied for various objectives, e.g, music therapy. Recent progress of information technology enables us to edit music pieces by using computer even if the user is a beginner. However, it is very difficult for the beginners to compose music pieces. To compose music pieces, the users need to have experiences and knowledge of music such as music melodies and chord progressions. aDepartment of Computer Science and Engineering 3-30-1 Wajirohigashi, Higashi-ku, Fukuoka, 8110925 Japan [email protected]
To create musical pieces suited for each user’s
preference and feeling, Interactive Evolutionary Computation (IEC) [1] is known as a simple and effective method to reflect user’s feeling on music pieces. IEC expands searching ability of Evolutionary Computation (EC) by obtaining user’s subjective evaluation. EC is a method that applies evolution of natural creatures to computational optimization. Genetic Algorithm (GA) [2, 3], Particle Swarm Optimization (PSO) [4], and Differential Evolution (DE) [5, 6] are examples of evolutionary algorithms.
Interactive GA (IGA) is an interactive type of GA and is
used for creating musical piece in previous studies. In the previous IGA studies, patterns of musical pieces correspond to solution candidates in IGA, and the solution candidates are evaluated by the user. Most of the previous IGA studies concentrated to create melody, and chord progression was dealt as basic condition: they have mainly tried to create melody suited to the chord progression [7-9]. Although the chord progression plays an important role to create atmosphere of music piece, there were few IEC studies to create the chord progression of music. As described above, the previous IEC studies created melody based on pre-defined the chord progression, therefore, creation of the music chord progression suited for the user will expands the ability of computational music.
Some previous studies have proposed methods providing
the chord progression with other algorithms such as hidden Markov model [10], neural network [11]. In these methods, the chord progression is provided from music notes included in a music melody. These methods seem to easily create the chord progression, however, these methods do not reflect user’s intention and feelings. In this point, creation of the chord progression with IEC is better than these methods. Nakashima et al. have proposed an IGA for creating music chord progression [12]. In the IGA method, music chord is corresponded to value in gene in IGA. However, the efficacy of the IGA method is not investigated.
Purpose of this study is to investigate the efficacy of the
proposed IGA method for creating music chord progression. Listening experiments are conducted to investigate the efficacy. In the listening experiments, the subjects evaluate music chord progressions presented from the IGA system.
International Journal of Computer & Information Science, Vol. 15, No. 1, June 2014 24
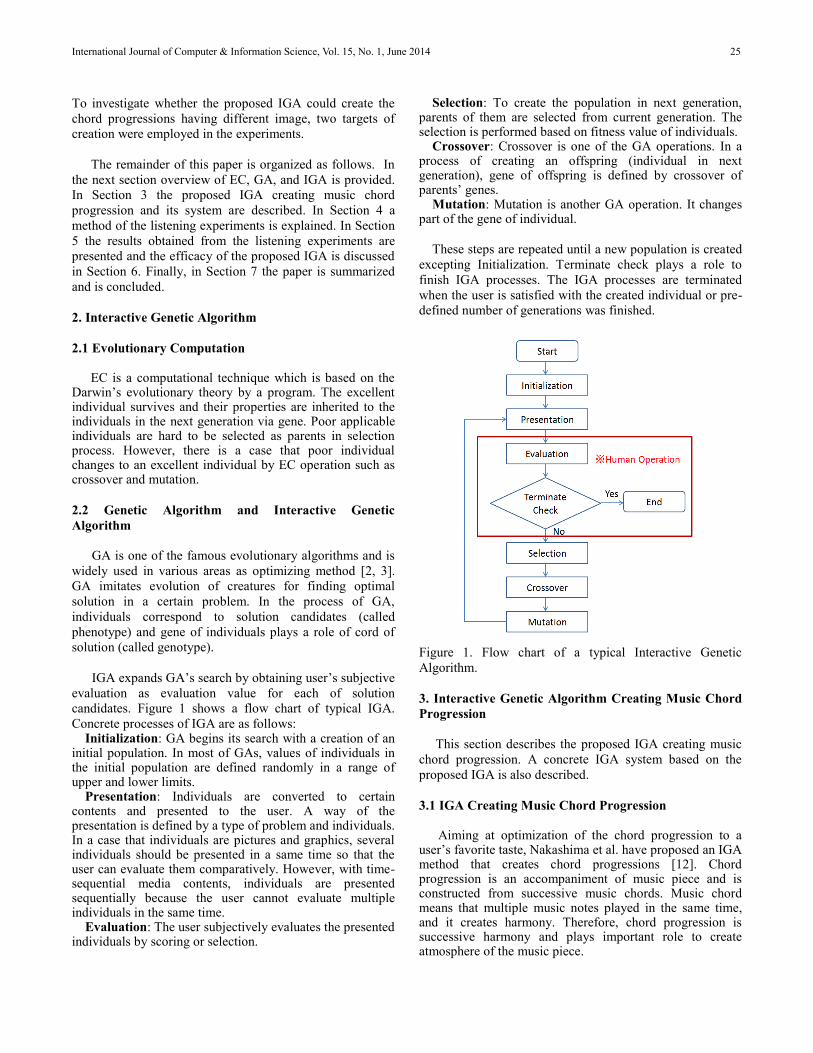
To investigate whether the proposed IGA could create the chord progressions having different image, two targets of creation were employed in the experiments.
The remainder of this paper is organized as follows. In
the next section overview of EC, GA, and IGA is provided. In Section 3 the proposed IGA creating music chord progression and its system are described. In Section 4 a method of the listening experiments is explained. In Section 5 the results obtained from the listening experiments are presented and the efficacy of the proposed IGA is discussed in Section 6. Finally, in Section 7 the paper is summarized and is concluded. 2. Interactive Genetic Algorithm 2.1 Evolutionary Computation
EC is a computational technique which is based on the Darwin’s evolutionary theory by a program. The excellent individual survives and their properties are inherited to the individuals in the next generation via gene. Poor applicable individuals are hard to be selected as parents in selection process. However, there is a case that poor individual changes to an excellent individual by EC operation such as crossover and mutation. 2.2 Genetic Algorithm and Interactive Genetic Algorithm
GA is one of the famous evolutionary algorithms and is widely used in various areas as optimizing method [2, 3]. GA imitates evolution of creatures for finding optimal solution in a certain problem. In the process of GA, individuals correspond to solution candidates (called phenotype) and gene of individuals plays a role of cord of solution (called genotype).
IGA expands GA’s search by obtaining user’s subjective
evaluation as evaluation value for each of solution candidates. Figure 1 shows a flow chart of typical IGA. Concrete processes of IGA are as follows:
Initialization: GA begins its search with a creation of an initial population. In most of GAs, values of individuals in the initial population are defined randomly in a range of upper and lower limits.
Presentation: Individuals are converted to certain contents and presented to the user. A way of the presentation is defined by a type of problem and individuals. In a case that individuals are pictures and graphics, several individuals should be presented in a same time so that the user can evaluate them comparatively. However, with time-sequential media contents, individuals are presented sequentially because the user cannot evaluate multiple individuals in the same time.
Evaluation: The user subjectively evaluates the presented individuals by scoring or selection.
Selection: To create the population in next generation, parents of them are selected from current generation. The selection is performed based on fitness value of individuals.
Crossover: Crossover is one of the GA operations. In a process of creating an offspring (individual in next generation), gene of offspring is defined by crossover of parents’ genes.
Mutation: Mutation is another GA operation. It changes part of the gene of individual.
These steps are repeated until a new population is created excepting Initialization. Terminate check plays a role to finish IGA processes. The IGA processes are terminated when the user is satisfied with the created individual or pre-defined number of generations was finished.
Figure 1. Flow chart of a typical Interactive Genetic Algorithm. 3. Interactive Genetic Algorithm Creating Music Chord Progression This section describes the proposed IGA creating music chord progression. A concrete IGA system based on the proposed IGA is also described. 3.1 IGA Creating Music Chord Progression
Aiming at optimization of the chord progression to a user’s favorite taste, Nakashima et al. have proposed an IGA method that creates chord progressions [12]. Chord progression is an accompaniment of music piece and is constructed from successive music chords. Music chord means that multiple music notes played in the same time, and it creates harmony. Therefore, chord progression is successive harmony and plays important role to create atmosphere of the music piece.
International Journal of Computer & Information Science, Vol. 15, No. 1, June 2014 25
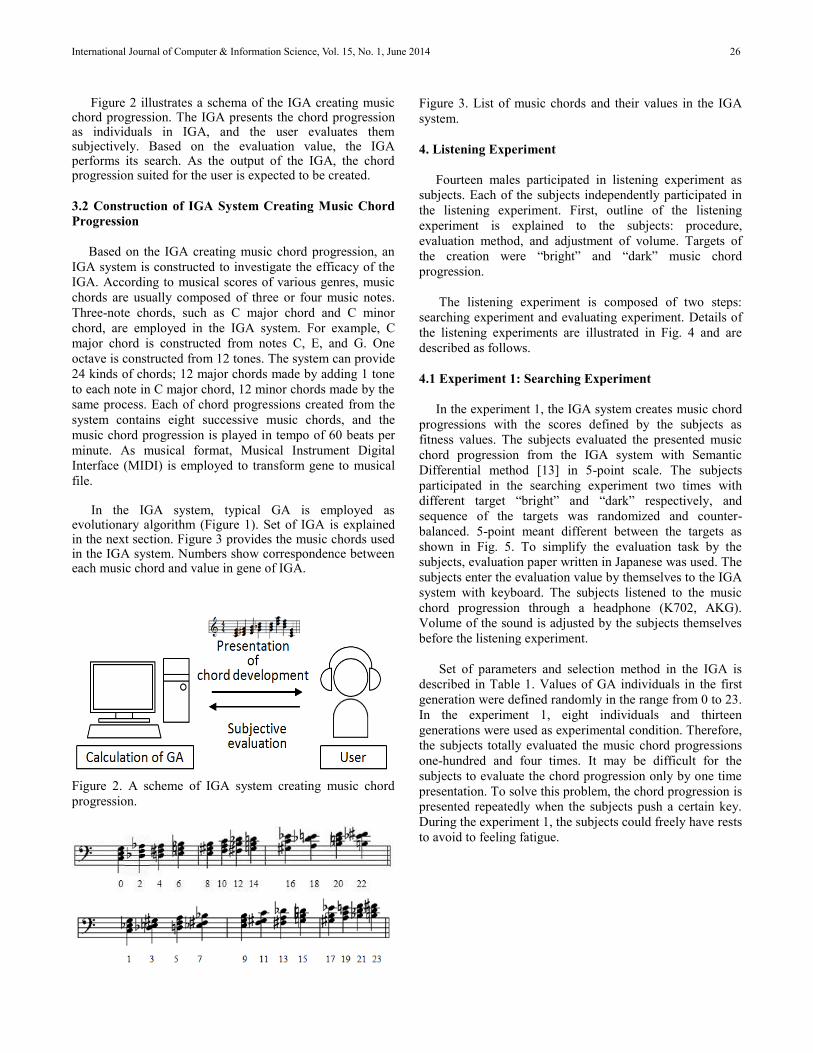
Figure 2 illustrates a schema of the IGA creating music chord progression. The IGA presents the chord progression as individuals in IGA, and the user evaluates them subjectively. Based on the evaluation value, the IGA performs its search. As the output of the IGA, the chord progression suited for the user is expected to be created. 3.2 Construction of IGA System Creating Music Chord Progression Based on the IGA creating music chord progression, an IGA system is constructed to investigate the efficacy of the IGA. According to musical scores of various genres, music chords are usually composed of three or four music notes. Three-note chords, such as C major chord and C minor chord, are employed in the IGA system. For example, C major chord is constructed from notes C, E, and G. One octave is constructed from 12 tones. The system can provide 24 kinds of chords; 12 major chords made by adding 1 tone to each note in C major chord, 12 minor chords made by the same process. Each of chord progressions created from the system contains eight successive music chords, and the music chord progression is played in tempo of 60 beats per minute. As musical format, Musical Instrument Digital Interface (MIDI) is employed to transform gene to musical file.
In the IGA system, typical GA is employed as
evolutionary algorithm (Figure 1). Set of IGA is explained in the next section. Figure 3 provides the music chords used in the IGA system. Numbers show correspondence between each music chord and value in gene of IGA.
Figure 2. A scheme of IGA system creating music chord progression.
Figure 3. List of music chords and their values in the IGA system. 4. Listening Experiment Fourteen males participated in listening experiment as subjects. Each of the subjects independently participated in the listening experiment. First, outline of the listening experiment is explained to the subjects: procedure, evaluation method, and adjustment of volume. Targets of the creation were “bright” and “dark” music chord progression.
The listening experiment is composed of two steps: searching experiment and evaluating experiment. Details of the listening experiments are illustrated in Fig. 4 and are described as follows. 4.1 Experiment 1: Searching Experiment In the experiment 1, the IGA system creates music chord progressions with the scores defined by the subjects as fitness values. The subjects evaluated the presented music chord progression from the IGA system with Semantic Differential method [13] in 5-point scale. The subjects participated in the searching experiment two times with different target “bright” and “dark” respectively, and sequence of the targets was randomized and counter-balanced. 5-point meant different between the targets as shown in Fig. 5. To simplify the evaluation task by the subjects, evaluation paper written in Japanese was used. The subjects enter the evaluation value by themselves to the IGA system with keyboard. The subjects listened to the music chord progression through a headphone (K702, AKG). Volume of the sound is adjusted by the subjects themselves before the listening experiment.
Set of parameters and selection method in the IGA is
described in Table 1. Values of GA individuals in the first generation were defined randomly in the range from 0 to 23. In the experiment 1, eight individuals and thirteen generations were used as experimental condition. Therefore, the subjects totally evaluated the music chord progressions one-hundred and four times. It may be difficult for the subjects to evaluate the chord progression only by one time presentation. To solve this problem, the chord progression is presented repeatedly when the subjects push a certain key. During the experiment 1, the subjects could freely have rests to avoid to feeling fatigue.
International Journal of Computer & Information Science, Vol. 15, No. 1, June 2014 26
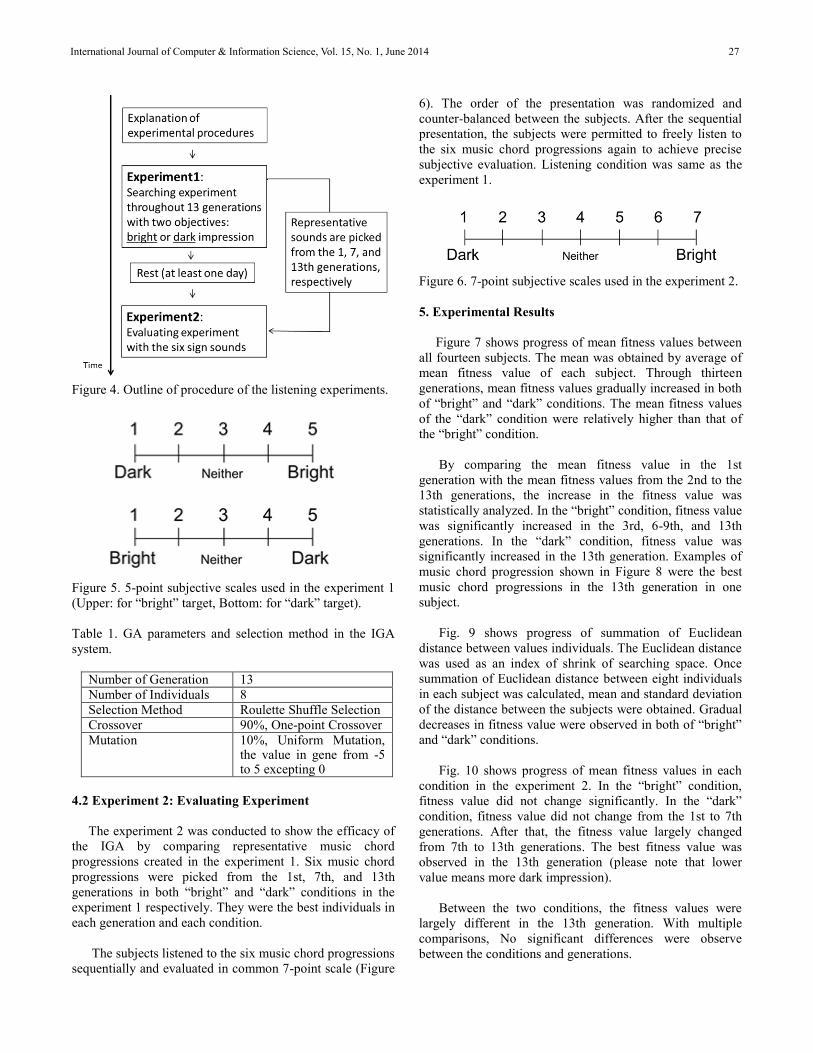
Figure 4. Outline of procedure of the listening experiments.
Figure 5. 5-point subjective scales used in the experiment 1 (Upper: for “bright” target, Bottom: for “dark” target). Table 1. GA parameters and selection method in the IGA system.
Number of Generation 13 Number of Individuals 8 Selection Method Roulette Shuffle Selection Crossover 90%, One-point Crossover Mutation 10%, Uniform Mutation,
the value in gene from -5 to 5 excepting 0
4.2 Experiment 2: Evaluating Experiment The experiment 2 was conducted to show the efficacy of the IGA by comparing representative music chord progressions created in the experiment 1. Six music chord progressions were picked from the 1st, 7th, and 13th generations in both “bright” and “dark” conditions in the experiment 1 respectively. They were the best individuals in each generation and each condition.
The subjects listened to the six music chord progressions
sequentially and evaluated in common 7-point scale (Figure
6). The order of the presentation was randomized and counter-balanced between the subjects. After the sequential presentation, the subjects were permitted to freely listen to the six music chord progressions again to achieve precise subjective evaluation. Listening condition was same as the experiment 1.
Figure 6. 7-point subjective scales used in the experiment 2. 5. Experimental Results Figure 7 shows progress of mean fitness values between all fourteen subjects. The mean was obtained by average of mean fitness value of each subject. Through thirteen generations, mean fitness values gradually increased in both of “bright” and “dark” conditions. The mean fitness values of the “dark” condition were relatively higher than that of the “bright” condition.
By comparing the mean fitness value in the 1st generation with the mean fitness values from the 2nd to the 13th generations, the increase in the fitness value was statistically analyzed. In the “bright” condition, fitness value was significantly increased in the 3rd, 6-9th, and 13th generations. In the “dark” condition, fitness value was significantly increased in the 13th generation. Examples of music chord progression shown in Figure 8 were the best music chord progressions in the 13th generation in one subject.
Fig. 9 shows progress of summation of Euclidean distance between values individuals. The Euclidean distance was used as an index of shrink of searching space. Once summation of Euclidean distance between eight individuals in each subject was calculated, mean and standard deviation of the distance between the subjects were obtained. Gradual decreases in fitness value were observed in both of “bright” and “dark” conditions.
Fig. 10 shows progress of mean fitness values in each condition in the experiment 2. In the “bright” condition, fitness value did not change significantly. In the “dark” condition, fitness value did not change from the 1st to 7th generations. After that, the fitness value largely changed from 7th to 13th generations. The best fitness value was observed in the 13th generation (please note that lower value means more dark impression).
Between the two conditions, the fitness values were
largely different in the 13th generation. With multiple comparisons, No significant differences were observe between the conditions and generations.
International Journal of Computer & Information Science, Vol. 15, No. 1, June 2014 27
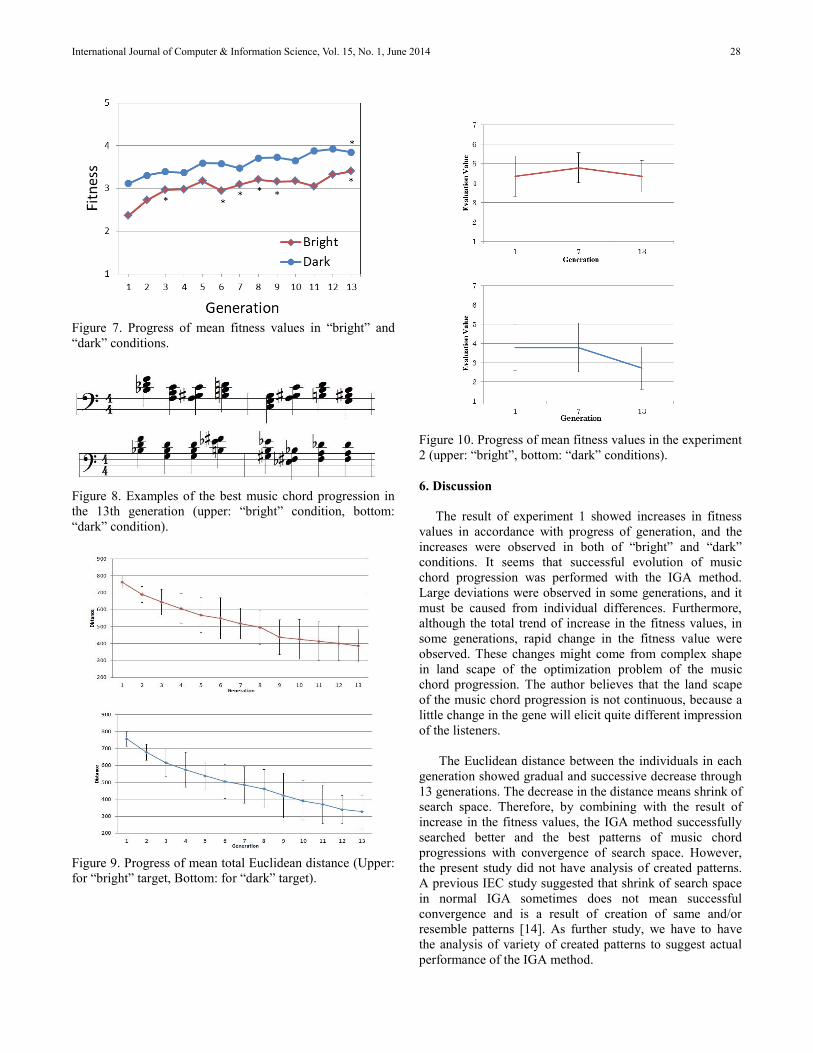
Figure 7. Progress of mean fitness values in “bright” and “dark” conditions. Figure 8. Examples of the best music chord progression in the 13th generation (upper: “bright” condition, bottom: “dark” condition). Figure 9. Progress of mean total Euclidean distance (Upper: for “bright” target, Bottom: for “dark” target).
Figure 10. Progress of mean fitness values in the experiment 2 (upper: “bright”, bottom: “dark” conditions). 6. Discussion The result of experiment 1 showed increases in fitness values in accordance with progress of generation, and the increases were observed in both of “bright” and “dark” conditions. It seems that successful evolution of music chord progression was performed with the IGA method. Large deviations were observed in some generations, and it must be caused from individual differences. Furthermore, although the total trend of increase in the fitness values, in some generations, rapid change in the fitness value were observed. These changes might come from complex shape in land scape of the optimization problem of the music chord progression. The author believes that the land scape of the music chord progression is not continuous, because a little change in the gene will elicit quite different impression of the listeners.
The Euclidean distance between the individuals in each generation showed gradual and successive decrease through 13 generations. The decrease in the distance means shrink of search space. Therefore, by combining with the result of increase in the fitness values, the IGA method successfully searched better and the best patterns of music chord progressions with convergence of search space. However, the present study did not have analysis of created patterns. A previous IEC study suggested that shrink of search space in normal IGA sometimes does not mean successful convergence and is a result of creation of same and/or resemble patterns [14]. As further study, we have to have the analysis of variety of created patterns to suggest actual performance of the IGA method.
International Journal of Computer & Information Science, Vol. 15, No. 1, June 2014 28
In the result of the experiment 2, drastic changes in the
fitness value were not observed in both of the conditions. The largest change was observed in the 13th generation in the “dark” condition. By observing these results, it seems that the proposed IGA method is hard to create better “bright” music chord progression: the result of the experiment 1 also suggested that fitness value in the “bright” condition was relatively lower than in the “dark” condition. Why is the IGA method difficult to create “bright” patterns? It might be come from definition of “dark” impression. Around the initial generations, created music chord progressions must be quite weird and are far from music-like chord progressions. There is a possibility that the subjects evaluated such weird chord progressions as relatively “dark” patterns. To create “bright” music chord progressions, it must be effective that the proposed IGA method adopts music theory as rules in the creation of patterns.
Relating to the above sentences, in the present study,
created music chord progressions were subjectively evaluated in both of the experiments, however, it was not evaluated objectively. Using objective function to evaluate the created music chord progression may effective to search better patterns. For example, Unehara et al. have proposed an IEC method that creates music melody based on chord progression [15]. In their IEC method, objective evaluation function that evaluates created melody patterns with music theory was also used. Furthermore, some previous IEC studies have utilized music chord progression of existing musical pieces to create musical melody. Applying these previous techniques in IEC on the proposed IGA method must contribute to enhance the proposed IGA method. 7. Conclusions This study investigated the efficacy of the IGA method that creates music chord progression. To investigate the efficacy, the IGA system was constructed based on the pro-posed. Through the two listening experiments, the efficacies of the proposed IGA were investigated. The results in the searching experiment showed that the IGA method could search better music chord progressions suited for each user’s “bright” and “dark” feelings. The search was performed with the convergence of searching space. How-ever, direct comparisons in the evaluating experiment did not show significant difference between generations and experimental conditions. These results showed that possibility of the IGA method to create music chord progression suited for each user’s feelings, however, further improvement of the IGA method and sys-tem to show significant performance.
As next steps, to investigate an efficacy of the proposed method, we have to perform comparing experiment with randomized condition as control after having improvements
of the IGA method. Moreover, we will introduce some techniques to improve our method such as music theory in chord progression, rotation in each chord, interfaces that the users can keep good GA individuals for them during the search process. Acknowledgments
This work was supported in part by Ministry of Education, Culture, Sports, Science and Technology, Grant-in-Aid for Young Scientists (B) and Grant from Computer Science Laboratory, Fukuoka Institute of Technology. References
[1] H. Takagi, “Interactive Evolutionary Computation: Fusion of the Capabilities of EC Optimization and Human Evaluation”, Proc. the IEEE, vol. 89, no. 9, pp. 1275-1296, 2001.
[2] J. H. Holland, Adaptation in Natural and Artificial Systems: An Introductory Analysis with Applications to Biology, Control and Artificial Intelligence, Ann Arbor, MI: The University of Michigan Press, 1975.
[3] Goldberg, Genetic Algorithms in Search, Optimization and Machine Learning, Reading, MA: Addison-Wesley Professional, 1989.
[4] J. Kennedy and R. Eberhart, “Particle swarm optimization”, in Proc. IEEE Int. Conf. Neural Network, pp. 1942–1948, 1995.
[5] R. Storn and K. V. Price, “Differential evolution–A simple and efficient adaptive scheme for global optimization over continuous spaces”, in Institute of Company Secretaries of India, Chennai, Tamil Nadu. Tech. Report, TR-95-012, 1995.
[6] K. V. Price, R. Storn, and J. Lampinen, Differential Evolution -A Practical Approach to Global Optimization, Berlin, Germany: Springer-Verlag, 2005.
[7] T. Yamada and H. Shiizuka, “Automatic Composition by Genetic Algorithm”, Information Processing Society of Japan, pp. 7-14, 1998 (in Japanese).
[8] S. Imai and T. Nagao, “Automated composition using a genetic algorithm”, Institute of Electronics, Information, and Communication Engineers, pp. 59-66, 1998 (in Japanese).
[9] T. Tanaka, F. Toyama, and K. Shoji, “Automatic Composition by Combination of Pitch Transition Patterns and Rhythm Using a Genetic Algorithm”, Information Processing Society of Japan, pp. 43-48, 2001 (in Japanese).
[10] T. Kawakami, M. Nakai, H. Shimodaira and S. Sagayama, “Hidden Markov Model Applied to Automatic Harmonization of Given Melodies”, Information Processing Society of Japan, SIG Notes 2000(19), pp. 59-66, 2000 (in Japanese).
International Journal of Computer & Information Science, Vol. 15, No. 1, June 2014 29
[11] M. Nishida, S. Kikuchi and M. Nakanishi, “Generating a Chord Progression using Neural Networks”, Information Processing Society of Japan, SIG Notes 2000(76), pp. 67-72, 2000 (in Japanese).
[12] S. Nakashima, S. Ogawa, Y. Imamura, and M. Fukumoto, “Generation of Appropriate User Chord Progression Based on Interactive Genetic Algorithm”, in Proc. 2010 International Conference on P2P, Parallel, Grid, Cloud and Internet Computing, pp. 450-453, 2010.
[13] C. E. Osgood, G. J. Suci, and P. Tannenbaum, The measurement of meaning, University of Illinois Press, 1957.
[14] M. Fukumoto S. Ogawa, and R. Yamamoto, “The Efficiency of Interactive Differential Evolution in Creation of Sound Contents: In Comparison with Interactive Genetic Algorithm”, International Journal of Software Innovation, vol. 1, no. 2, pp. 16-27, 2013.
[15] M. Unehara and T. Onisawa, “Music composition by interaction between human and computer”, New Generation Computing, vol. 23, no. 2, pp. 181-191, 2005.
Makoto Fukumoto is an associate professor in the department of Computer Science and Engineering at Fukuoka Institute of Technology. He earned his Doctor of Engineering degree in Muroran Institute of Technology, Japan. His research interests are human-media interaction, music information processing,
affective engineering, interactive evolutionary computation and psychophysiology of human. As a system combining these research areas, he has been trying to construct a system that creates media contents suited for user’s feelings. He is a member of the IEEE.
International Journal of Computer & Information Science, Vol. 15, No. 1, June 2014 30
No page numbers
A Lazy-Updating Snoop Cache Protocol for Transactional Memory
Sekai Ichii a Atsushi Nunome b Hiroaki Hirata c Kiyoshi Shibayama d
Kyoto Institute of Technology, Japan
Abstract In this paper, we propose a new Hardware Transactional Memory (HTM) system for a shared-memory multiproces-sor in which elementary processors are connected by a sin-gle common bus. One of the key features of our system is a modified snoop cache protocol to reduce overheads on the transactional memory consistency control. By publishing all of modified data in a transaction at once when the transac-tion commits, our system avoids the overhead on the com-mit, which would arise from a sequential publication (or write-back to main memory) of each data item written in the transaction otherwise. Another feature is a virtualization of a cache layer in the memory hierarchy. When a cache must replace a line which contains speculatively modified data, our system dynamically reallocates the address of the line to another location in main memory, and back up the evicted data to a lower layer cache or main memory. The backed-up data is still under the control of the transactional memory consistency through our snoop cache protocol. By enlarging a cache capacity virtually in this manner, our system can support unbounded transactions which are not limited by the hardware resources in the size and the duration. Keywords: Hardware transactional memory, cache coher-ency, shared-memory multiprocessor, parallel architecture, memory renaming. 1. Introduction Shared-memory multiprocessors are commonplace in current computers, and multi-core processor chips are used not only in high-end servers, but also in desktop, portable computers, and even embedded ones. To benefit from the increasing number of processor cores, however, application programmers have to write parallel programs. Convention-ally, lock-based techniques are employed to control mutual-ly-exclusive accesses to a shared variable. It is responsible stealthy-mark a Department of Information Science
Matsugasaki, Sakyo-ku, Kyoto, 606-8585 Japan [email protected]
b Department of Information Science Matsugasaki, Sakyo-ku, Kyoto, 606-8585 Japan [email protected]
c Department of Information Science Matsugasaki, Sakyo-ku, Kyoto, 606-8585 Japan [email protected]
d Department of Information Science Matsugasaki, Sakyo-ku, Kyoto, 606-8585 Japan [email protected]
for programmers to avoid the deadlock, but this is not easy for application programmers who develop large-scale paral-lel programs, because it is not always possible to arrange locking operations in some regular order when a program-mer combines several module packages which use locks privately. As an alternative to lock-base techniques, Transactional Memory (TM) [1] is promising to help programmers who develop shared-memory parallel programs. Here, a transac-tion is a code segment which should be executed atomically and in isolation with respect to other transactions, and it can fully replace a critical section if the critical section does not include system calls. When programmers use TM, they simply mark code segments as transactions on program text. The TM system starts the execution of transactions specula-tively, and if a transaction accesses inconsistently to the same location of memory as another transaction, the system aborts and restarts the execution of one of these two transac-tions. Therefore, TM can remove the burden on program-mers to write deadlock-free programs. There have been many TM systems proposed. Some sys-tems are implemented mainly in hardware (HTM) [6, 8-21] and others are implemented only in software (STM) [2]. STM is functionally superior to HTM in the practical use, and some STM libraries [3] are already available for multi-threaded programming environments. It is difficult for HTM systems to deal with thread switching or scheduling, but HTM is superior to STM in the performance. In order to reduce overheads of STM, hybrid TM systems [4, 5] which are implemented mainly in software and partially accelerat-ed by hardware have been proposed. But the performance of hybrid TM's is still less than that of HTM’s. We focus TM implementation on its performance issues, and propose a new HTM design. Our current design is ap-plicable to a common-bus type of UMA (Uniform Memory Access) architectures. We have developed a MESI-based 1 snoop cache protocol to support TM. Our system stores
1 This protocol marks each cache line with one of the four states: 1) M (Modified) which indicated the line is a unique “dirty” line in the system, 2) E (Exclusive) which indicates that the line is “clean” and no other cache in the system contains this line data, 3) S (Shared) which indicates that the line is “clean” but another cache may contain the same copy, and 4) I (In-valid) which indicates the line is empty. Here “clean” means that all values in a line are same to those in main memory, while “dirty” does that some values in a line are modified from the values in main memory.
International Journal of Computer & Information Science, Vol. 15, No. 1, June 2014 31

No page numbers
modified values in a transaction into caches until the trans-action commits, but it is able to support large transactions which include many memory accesses, without being re-stricted by the size of caches. 2. Transactional Memory TM systems execute a transaction speculatively in isola-tion with respect to other transactions. When a thread starts the execution of a transaction and writes to memory, no other threads can observe the value modified by the thread. At the point when the transaction has completed, or “com-mitted”, all of the modified data in the transaction can be observed by other threads. If two different threads simulta-neously execute transactions which modify the same loca-tion of memory, only one of the threads can commit its transaction. The other thread must abort the execution of its transaction and re-execute the transaction. There are two design issues to provide these properties of transaction ato-micity and isolation. One is data version management, and the other is conflict detection and resolution. Data version management handles the storage of both values before and after store operations in transactions. If a transaction commits, new values which are written by the transaction should be visible. Or, if the transaction aborts, old values at the point when the transaction starts should be retained. There are following two management policies; • Eager versioning: A TM system stores new values in the
target memory locations, and does old values in a special hardware storage for speculation, or in memory loca-tions which are allocated as an area for undo logs.
• Lazy versioning: A TM system stores new values in the
write-buffer area, whether the area is provided with a special hardware or allocated in main memory. Old val-ues remain in their memory locations with no change.
When a transaction aborts, TM systems which use eager versioning have to undo the memory modifications, while the ones which use lazy versioning simply flush the write-buffer. So, the overhead in eager versioning is larger than that in lazy versioning. On the other hand, when a transac-tion commits, TM systems which use eager versioning simply remove the undo logs, while the ones which use lazy versioning have to update the memory locations. So, the overhead in eager versioning is smaller than that in lazy versioning. Whether HTM systems use eager or lazy versioning, most of them make use of caches for data version manage-ment. For example, some HTM systems which use lazy ver-sioning store new values in data caches and keep old values in main memory. Only one extra bit per cache line is suffi-cient to indicate the line data should be discarded on abort.
Because a data cache cannot write back a line including new values to main memory before the transaction commits, another design consideration is required to support large transactions which write to many memory locations. TM systems have to detect conflicts between concurrent transactions, and resolve them by permitting one transaction to commit (or continue the execution) and by coercing other conflicting transactions into aborting. A set of memory loca-tions read in a transaction is called read set, and a set of locations written to in a transaction is called write set. If some elements of the write set of a transaction are included in the write or read set of other concurrent transactions, TM systems signal the conflict detection. There are following two policies of conflict detection and resolution; • Pessimistic (eager) detection: A TM system checks to
detect a conflict every time when a transaction executes a load or a store.
• Optimistic (lazy) detection: A TM system checks when a
transaction attempts to commit. In HTM systems which use the optimistic detection poli-cy, it may take multiple cycles for a transaction to commit, because they should check all of data accessed by the trans-action for conflicts and make all of updated values visible from other processors. This commit process itself must be done atomically. In HTM systems which use the pessimistic detection policy, such an overhead is distributed into com-munication overhead on each load or store. The pessimistic detection policy is useful to reduce wasted work of the transaction which will end up by aborting. When a conflict is detected, however, it is not easy to predict which one of competing transactions will win to commit in the end. 3. Related Works Proposed HTM designs are characterized by the combi-nation of the data version management policy and the con-flict detection policy, as shown in Table 1. Transactional Memory Coherence and Consistency (TCC) [6, 7] uses lazy versioning and optimistic detection policy. TCC buffers new values at the L1 cache and detects conflicts only when a transaction commits. Large Transactional Memory (LTM) [8] uses lazy versioning and pessimistic detection policy. LTM keeps old values in main memory and stores new val-ues in the cache, coercing the coherence protocol to store both of the new and old values at the same address. Repeat-ed transactions which modify the same cache line require a write-back of the line in every transaction, because old val-ues could be lost otherwise. Log-based Transactional Memory (LogTM) [9] uses eager versioning and pessimistic detection policy. LogTM stores new values “in place” and save old values in a before-image log, which is allocated per thread in cachable virtual address space. LogTM hardware
International Journal of Computer & Information Science, Vol. 15, No. 1, June 2014 32
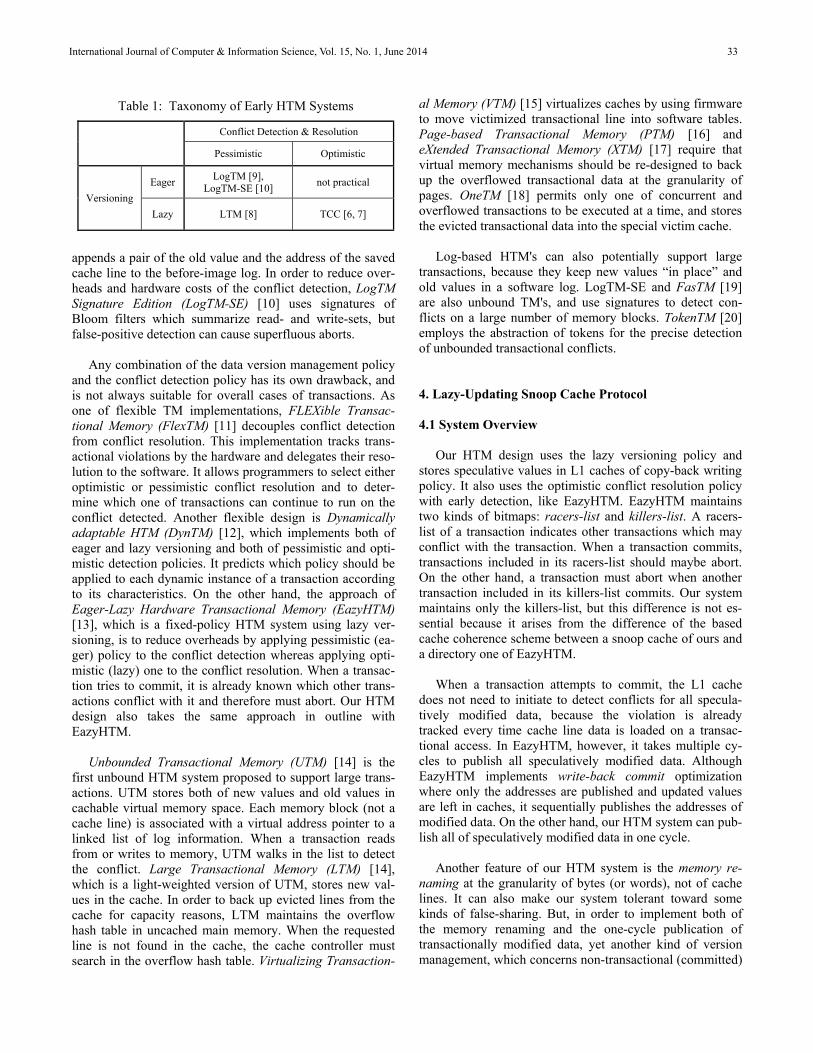
No page numbers
Table 1: Taxonomy of Early HTM Systems
Conflict Detection & Resolution
Pessimistic Optimistic
Versioning Eager LogTM [9],
LogTM-SE [10] not practical
Lazy LTM [8] TCC [6, 7]
# appends a pair of the old value and the address of the saved cache line to the before-image log. In order to reduce over-heads and hardware costs of the conflict detection, LogTM Signature Edition (LogTM-SE) [10] uses signatures of Bloom filters which summarize read- and write-sets, but false-positive detection can cause superfluous aborts. Any combination of the data version management policy and the conflict detection policy has its own drawback, and is not always suitable for overall cases of transactions. As one of flexible TM implementations, FLEXible Transac-tional Memory (FlexTM) [11] decouples conflict detection from conflict resolution. This implementation tracks trans-actional violations by the hardware and delegates their reso-lution to the software. It allows programmers to select either optimistic or pessimistic conflict resolution and to deter-mine which one of transactions can continue to run on the conflict detected. Another flexible design is Dynamically adaptable HTM (DynTM) [12], which implements both of eager and lazy versioning and both of pessimistic and opti-mistic detection policies. It predicts which policy should be applied to each dynamic instance of a transaction according to its characteristics. On the other hand, the approach of Eager-Lazy Hardware Transactional Memory (EazyHTM) [13], which is a fixed-policy HTM system using lazy ver-sioning, is to reduce overheads by applying pessimistic (ea-ger) policy to the conflict detection whereas applying opti-mistic (lazy) one to the conflict resolution. When a transac-tion tries to commit, it is already known which other trans-actions conflict with it and therefore must abort. Our HTM design also takes the same approach in outline with EazyHTM. Unbounded Transactional Memory (UTM) [14] is the first unbound HTM system proposed to support large trans-actions. UTM stores both of new values and old values in cachable virtual memory space. Each memory block (not a cache line) is associated with a virtual address pointer to a linked list of log information. When a transaction reads from or writes to memory, UTM walks in the list to detect the conflict. Large Transactional Memory (LTM) [14], which is a light-weighted version of UTM, stores new val-ues in the cache. In order to back up evicted lines from the cache for capacity reasons, LTM maintains the overflow hash table in uncached main memory. When the requested line is not found in the cache, the cache controller must search in the overflow hash table. Virtualizing Transaction-
al Memory (VTM) [15] virtualizes caches by using firmware to move victimized transactional line into software tables. Page-based Transactional Memory (PTM) [16] and eXtended Transactional Memory (XTM) [17] require that virtual memory mechanisms should be re-designed to back up the overflowed transactional data at the granularity of pages. OneTM [18] permits only one of concurrent and overflowed transactions to be executed at a time, and stores the evicted transactional data into the special victim cache. Log-based HTM's can also potentially support large transactions, because they keep new values “in place” and old values in a software log. LogTM-SE and FasTM [19] are also unbound TM's, and use signatures to detect con-flicts on a large number of memory blocks. TokenTM [20] employs the abstraction of tokens for the precise detection of unbounded transactional conflicts. 4. Lazy-Updating Snoop Cache Protocol 4.1 System Overview Our HTM design uses the lazy versioning policy and stores speculative values in L1 caches of copy-back writing policy. It also uses the optimistic conflict resolution policy with early detection, like EazyHTM. EazyHTM maintains two kinds of bitmaps: racers-list and killers-list. A racers-list of a transaction indicates other transactions which may conflict with the transaction. When a transaction commits, transactions included in its racers-list should maybe abort. On the other hand, a transaction must abort when another transaction included in its killers-list commits. Our system maintains only the killers-list, but this difference is not es-sential because it arises from the difference of the based cache coherence scheme between a snoop cache of ours and a directory one of EazyHTM. When a transaction attempts to commit, the L1 cache does not need to initiate to detect conflicts for all specula-tively modified data, because the violation is already tracked every time cache line data is loaded on a transac-tional access. In EazyHTM, however, it takes multiple cy-cles to publish all speculatively modified data. Although EazyHTM implements write-back commit optimization where only the addresses are published and updated values are left in caches, it sequentially publishes the addresses of modified data. On the other hand, our HTM system can pub-lish all of speculatively modified data in one cycle. Another feature of our HTM system is the memory re-naming at the granularity of bytes (or words), not of cache lines. It can also make our system tolerant toward some kinds of false-sharing. But, in order to implement both of the memory renaming and the one-cycle publication of transactionally modified data, yet another kind of version management, which concerns non-transactional (committed)
International Journal of Computer & Information Science, Vol. 15, No. 1, June 2014 33
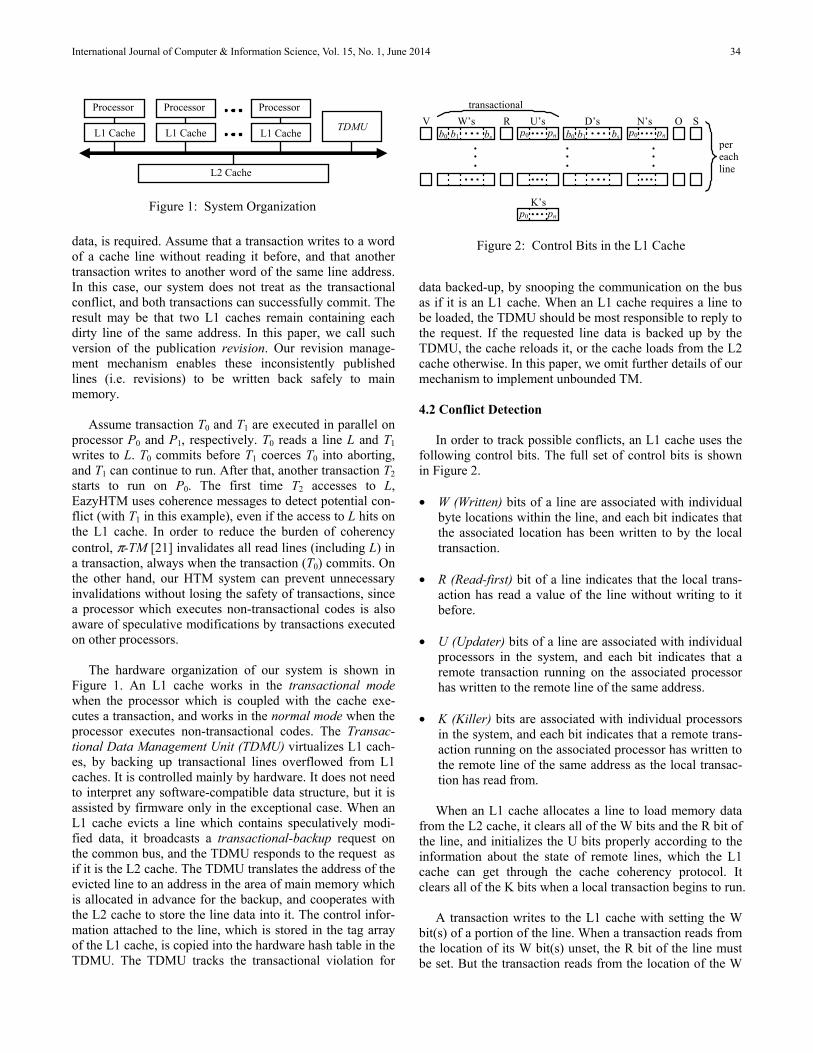
No page numbers
data, is required. Assume that a transaction writes to a word of a cache line without reading it before, and that another transaction writes to another word of the same line address. In this case, our system does not treat as the transactional conflict, and both transactions can successfully commit. The result may be that two L1 caches remain containing each dirty line of the same address. In this paper, we call such version of the publication revision. Our revision manage-ment mechanism enables these inconsistently published lines (i.e. revisions) to be written back safely to main memory. Assume transaction T0 and T1 are executed in parallel on processor P0 and P1, respectively. T0 reads a line L and T1 writes to L. T0 commits before T1 coerces T0 into aborting, and T1 can continue to run. After that, another transaction T2 starts to run on P0. The first time T2 accesses to L, EazyHTM uses coherence messages to detect potential con-flict (with T1 in this example), even if the access to L hits on the L1 cache. In order to reduce the burden of coherency control, π-TM [21] invalidates all read lines (including L) in a transaction, always when the transaction (T0) commits. On the other hand, our HTM system can prevent unnecessary invalidations without losing the safety of transactions, since a processor which executes non-transactional codes is also aware of speculative modifications by transactions executed on other processors. The hardware organization of our system is shown in Figure 1. An L1 cache works in the transactional mode when the processor which is coupled with the cache exe-cutes a transaction, and works in the normal mode when the processor executes non-transactional codes. The Transac-tional Data Management Unit (TDMU) virtualizes L1 cach-es, by backing up transactional lines overflowed from L1 caches. It is controlled mainly by hardware. It does not need to interpret any software-compatible data structure, but it is assisted by firmware only in the exceptional case. When an L1 cache evicts a line which contains speculatively modi-fied data, it broadcasts a transactional-backup request on the common bus, and the TDMU responds to the request as if it is the L2 cache. The TDMU translates the address of the evicted line to an address in the area of main memory which is allocated in advance for the backup, and cooperates with the L2 cache to store the line data into it. The control infor-mation attached to the line, which is stored in the tag array of the L1 cache, is copied into the hardware hash table in the TDMU. The TDMU tracks the transactional violation for
data backed-up, by snooping the communication on the bus as if it is an L1 cache. When an L1 cache requires a line to be loaded, the TDMU should be most responsible to reply to the request. If the requested line data is backed up by the TDMU, the cache reloads it, or the cache loads from the L2 cache otherwise. In this paper, we omit further details of our mechanism to implement unbounded TM. 4.2 Conflict Detection In order to track possible conflicts, an L1 cache uses the following control bits. The full set of control bits is shown in Figure 2. • W (Written) bits of a line are associated with individual
byte locations within the line, and each bit indicates that the associated location has been written to by the local transaction.
• R (Read-first) bit of a line indicates that the local trans-
action has read a value of the line without writing to it before.
• U (Updater) bits of a line are associated with individual
processors in the system, and each bit indicates that a remote transaction running on the associated processor has written to the remote line of the same address.
• K (Killer) bits are associated with individual processors
in the system, and each bit indicates that a remote trans-action running on the associated processor has written to the remote line of the same address as the local transac-tion has read from.
When an L1 cache allocates a line to load memory data from the L2 cache, it clears all of the W bits and the R bit of the line, and initializes the U bits properly according to the information about the state of remote lines, which the L1 cache can get through the cache coherency protocol. It clears all of the K bits when a local transaction begins to run. A transaction writes to the L1 cache with setting the W bit(s) of a portion of the line. When a transaction reads from the location of its W bit(s) unset, the R bit of the line must be set. But the transaction reads from the location of the W
b0 bs pnpereachline
W’s D’s O
K’s
SRtransactional
U’sV N’s b1 b0 b1 bs p0
p0 pn
p0 pn
Figure 2: Control Bits in the L1 Cache
Processor
L1 Cache
Processor
L1 Cache
Processor
L1 Cache
L2 Cache
TDMU
Figure 1: System Organization
International Journal of Computer & Information Science, Vol. 15, No. 1, June 2014 34
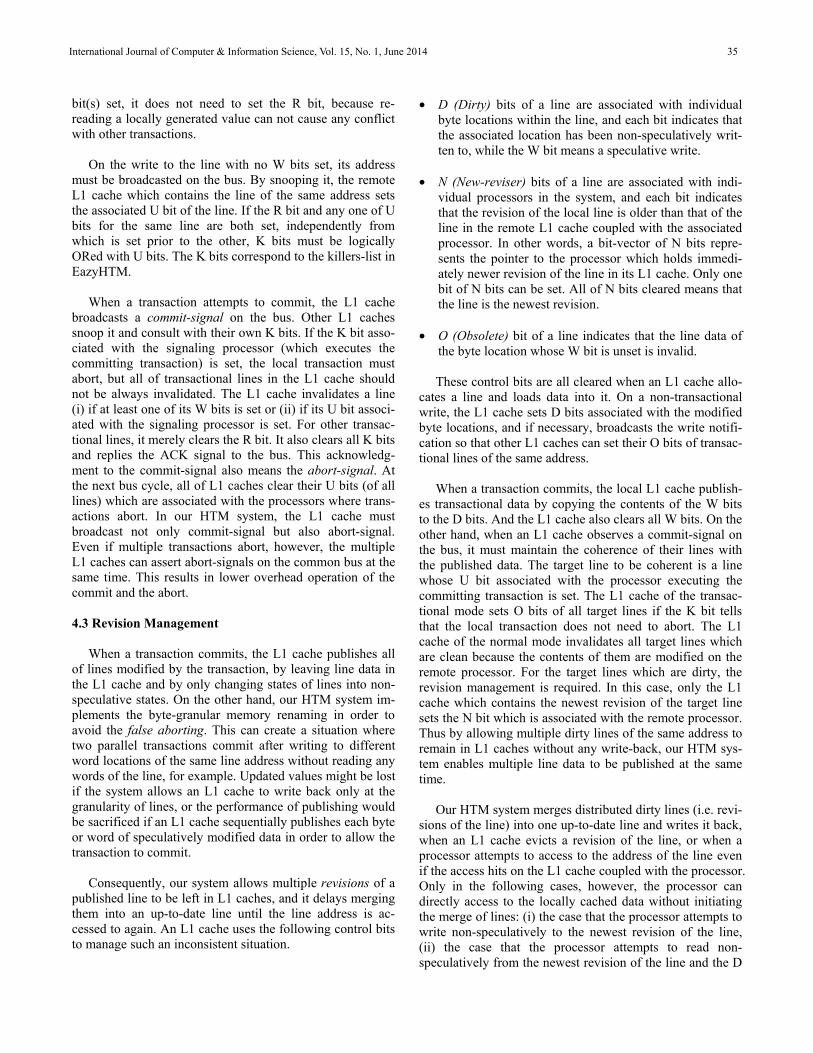
No page numbers
bit(s) set, it does not need to set the R bit, because re-reading a locally generated value can not cause any conflict with other transactions. On the write to the line with no W bits set, its address must be broadcasted on the bus. By snooping it, the remote L1 cache which contains the line of the same address sets the associated U bit of the line. If the R bit and any one of U bits for the same line are both set, independently from which is set prior to the other, K bits must be logically ORed with U bits. The K bits correspond to the killers-list in EazyHTM. When a transaction attempts to commit, the L1 cache broadcasts a commit-signal on the bus. Other L1 caches snoop it and consult with their own K bits. If the K bit asso-ciated with the signaling processor (which executes the committing transaction) is set, the local transaction must abort, but all of transactional lines in the L1 cache should not be always invalidated. The L1 cache invalidates a line (i) if at least one of its W bits is set or (ii) if its U bit associ-ated with the signaling processor is set. For other transac-tional lines, it merely clears the R bit. It also clears all K bits and replies the ACK signal to the bus. This acknowledg-ment to the commit-signal also means the abort-signal. At the next bus cycle, all of L1 caches clear their U bits (of all lines) which are associated with the processors where trans-actions abort. In our HTM system, the L1 cache must broadcast not only commit-signal but also abort-signal. Even if multiple transactions abort, however, the multiple L1 caches can assert abort-signals on the common bus at the same time. This results in lower overhead operation of the commit and the abort. 4.3 Revision Management When a transaction commits, the L1 cache publishes all of lines modified by the transaction, by leaving line data in the L1 cache and by only changing states of lines into non-speculative states. On the other hand, our HTM system im-plements the byte-granular memory renaming in order to avoid the false aborting. This can create a situation where two parallel transactions commit after writing to different word locations of the same line address without reading any words of the line, for example. Updated values might be lost if the system allows an L1 cache to write back only at the granularity of lines, or the performance of publishing would be sacrificed if an L1 cache sequentially publishes each byte or word of speculatively modified data in order to allow the transaction to commit. Consequently, our system allows multiple revisions of a published line to be left in L1 caches, and it delays merging them into an up-to-date line until the line address is ac-cessed to again. An L1 cache uses the following control bits to manage such an inconsistent situation.
• D (Dirty) bits of a line are associated with individual byte locations within the line, and each bit indicates that the associated location has been non-speculatively writ-ten to, while the W bit means a speculative write.
• N (New-reviser) bits of a line are associated with indi-
vidual processors in the system, and each bit indicates that the revision of the local line is older than that of the line in the remote L1 cache coupled with the associated processor. In other words, a bit-vector of N bits repre-sents the pointer to the processor which holds immedi-ately newer revision of the line in its L1 cache. Only one bit of N bits can be set. All of N bits cleared means that the line is the newest revision.
• O (Obsolete) bit of a line indicates that the line data of
the byte location whose W bit is unset is invalid. These control bits are all cleared when an L1 cache allo-cates a line and loads data into it. On a non-transactional write, the L1 cache sets D bits associated with the modified byte locations, and if necessary, broadcasts the write notifi-cation so that other L1 caches can set their O bits of transac-tional lines of the same address. When a transaction commits, the local L1 cache publish-es transactional data by copying the contents of the W bits to the D bits. And the L1 cache also clears all W bits. On the other hand, when an L1 cache observes a commit-signal on the bus, it must maintain the coherence of their lines with the published data. The target line to be coherent is a line whose U bit associated with the processor executing the committing transaction is set. The L1 cache of the transac-tional mode sets O bits of all target lines if the K bit tells that the local transaction does not need to abort. The L1 cache of the normal mode invalidates all target lines which are clean because the contents of them are modified on the remote processor. For the target lines which are dirty, the revision management is required. In this case, only the L1 cache which contains the newest revision of the target line sets the N bit which is associated with the remote processor. Thus by allowing multiple dirty lines of the same address to remain in L1 caches without any write-back, our HTM sys-tem enables multiple line data to be published at the same time. Our HTM system merges distributed dirty lines (i.e. revi-sions of the line) into one up-to-date line and writes it back, when an L1 cache evicts a revision of the line, or when a processor attempts to access to the address of the line even if the access hits on the L1 cache coupled with the processor. Only in the following cases, however, the processor can directly access to the locally cached data without initiating the merge of lines: (i) the case that the processor attempts to write non-speculatively to the newest revision of the line, (ii) the case that the processor attempts to read non-speculatively from the newest revision of the line and the D
International Journal of Computer & Information Science, Vol. 15, No. 1, June 2014 35

No page numbers
bits associated with the byte locations to be read are set, and (iii) the case that the processor attempts to access specula-tively to an already cached transactional line⎯this line may become newer revision in the future⎯of the same address to some revisions in other L1 caches. By traversing the pointer of the N bits recursively, our HTM system replaces the byte locations of the line indicated by its D bits. It may take mul-tiple cycles for this burst bus transaction, but our system delays it until it is needed. As compared with the optimistic scheme which modifies all memory locations on commit, our HTM system can distribute the overhead of publishing the transactional data. 4.4 State Definition of the Cache Line Our HTM system tracks the transactional violation at the granularity of cache lines, although it manages local modifi-cations at the granularity of bytes for the memory renaming and the quick publication. The opportunity of communica-tions for the coherence control is (i) a read/write which causes a cache miss and (ii) the first write to a cache line. It is unnecessary to broadcast a notification message every time a transaction reads or writes. In order to optimize the number of communications for the coherence control, it is also important for each L1 cache to know whether other L1 caches contain lines of the same address or not. But we can-not introduce the concept of shared-or-exclusive states di-rectly into TM, because a speculative data in a cache of the transactional mode is logically invisible from other caches of the normal mode. So, we provide L1 caches with the fol-lowing control bit. • S (Silent) bit of a line indicates that the first local write
access to the line does not need to be informed to any other L1 caches. The L1 cache actually broadcasts the write message only when the S bit is unset and any W/D bit is not set.
Our protocol marks each line of L1 caches with one of the following eight states, which are identified by using con-trol bits of V (Valid), W, R, D, N and S as shown in Table 2. • IV (InValid) state indicates the line is empty. • CE (Clean and Exclusive) state indicates the line is a
unique clean line in the system. • CS (Clean and Shared) state indicates that the line is
clean but another cache may contain a line of the same address. The state of a line in other caches can be either of CS or TR.
• DU (Dirty and Up-to-date) state indicates the line is a
dirty line which contains non-speculatively up-to-date data. There are not any other lines of the DU state in the system, but another cache may contain a line of the same address. The state of a line in other caches can be TR.
• PN (Partially dirty and Newest) state indicates that the data of the line is most recently modified (i.e. dirty) and other caches may contain another dirty line of the same address with the different contents. The state of a line in other caches can be either of PO or TR.
• PO (Partially dirty and Older) state indicates that the
data of the line is dirty and at least one of other caches contains another dirty line of the same address with the different contents. When a line transits its state from TR to PN on commit, the line of the PN state in another L1 cache transits to the PO state and the lines of the PO state stay in the PO state. The order of the visible modi-fications to the line address is managed with the N bits.
• TE (Transactional and Exclusive) state indicated that the
line is a unique clean line in the system and the data is speculatively read.
• TR (Transactional and Racing) state indicates that the
data of the line is speculatively read or modified and an-other cache may contain a line of the same address.
The line of the DU state is a dirty line and the value of any byte location of the line is available. On the other hand, the line of the PN/PO state is also dirty, but it is a residue of the quick publication of speculative data. The value of the location with the associated D bit unset is not always valid. So, our system merges those lines of the PN/PO state, (i) when a processor accesses to the local line of the PO state, (ii) when a processor accesses to the non-dirty portion of the local line of the PN state, (iii) when an L1 cache evicts a local line of the PN/PO state, or (iv) when a processor ac-cesses to the address of the remote line of the PN/PO state and this access causes an L1 cache miss. Before an L1 cache loads the memory data to be read speculatively or non-speculatively by the processor, our system enforces non-speculatively dirty lines in other cach-es to be merged and written back. Then our system guaran-tees the loaded line data is non-speculatively up-to-date and consistent with main memory. We can describe the state transition diagram based on the difference between the con-trol bits assigned to each state, but we omit it in this paper.
Table 2: State Definition of the Cache Line State V W’s R (U’s) D’s N’s (O) S IV 0 any any any any any any anyCE 1 ∀0 0 ∀0 ∀0 ∀0 0 1 CS 1 ∀0 0 any ∀0 ∀0 any 0 DU 1 ∀0 0 any ∃1 ∀0 0 1 PN 1 ∀0 0 any ∃1 ∀0 0 0 PO 1 ∀0 0 any ∃1 ∃1 0 0 TE 1 ∀0 1 ∀0 ∀0 ∀0 0 1 TR 1 ∃1 any ∀0 ∀0 any 0
∀0: All bits are cleared.∃1: At least one bit is set.
International Journal of Computer & Information Science, Vol. 15, No. 1, June 2014 36
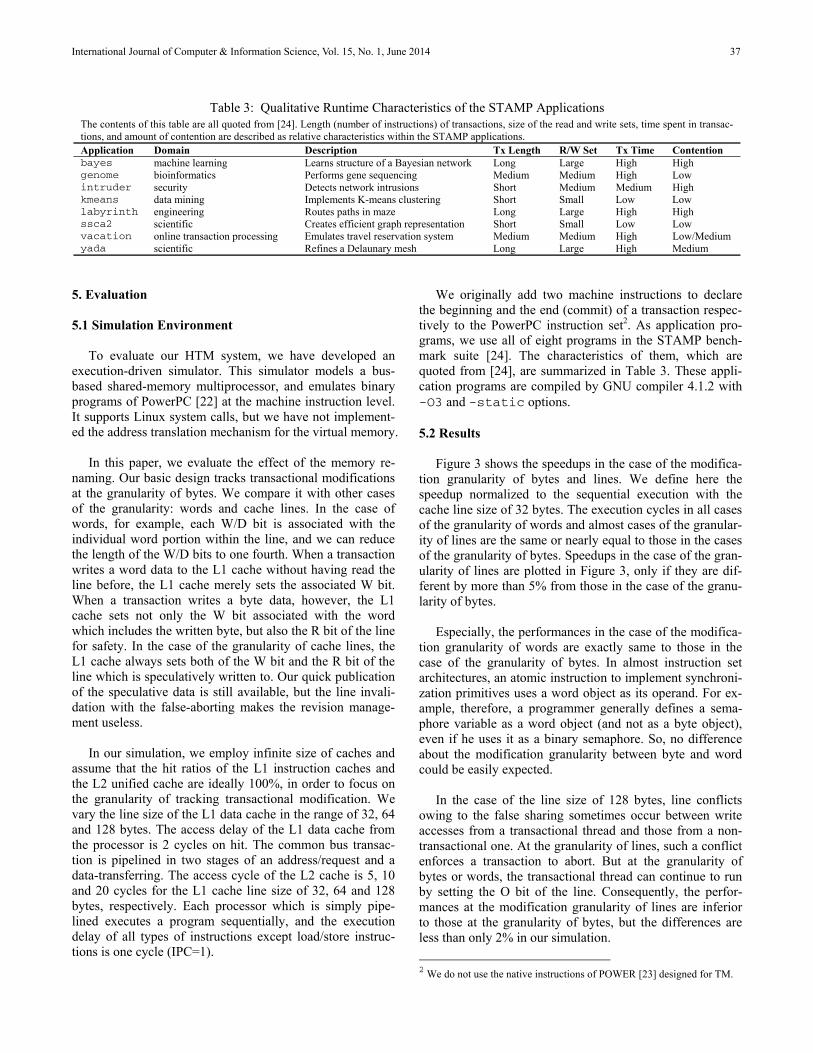
No page numbers
5. Evaluation 5.1 Simulation Environment To evaluate our HTM system, we have developed an execution-driven simulator. This simulator models a bus-based shared-memory multiprocessor, and emulates binary programs of PowerPC [22] at the machine instruction level. It supports Linux system calls, but we have not implement-ed the address translation mechanism for the virtual memory. In this paper, we evaluate the effect of the memory re-naming. Our basic design tracks transactional modifications at the granularity of bytes. We compare it with other cases of the granularity: words and cache lines. In the case of words, for example, each W/D bit is associated with the individual word portion within the line, and we can reduce the length of the W/D bits to one fourth. When a transaction writes a word data to the L1 cache without having read the line before, the L1 cache merely sets the associated W bit. When a transaction writes a byte data, however, the L1 cache sets not only the W bit associated with the word which includes the written byte, but also the R bit of the line for safety. In the case of the granularity of cache lines, the L1 cache always sets both of the W bit and the R bit of the line which is speculatively written to. Our quick publication of the speculative data is still available, but the line invali-dation with the false-aborting makes the revision manage-ment useless. In our simulation, we employ infinite size of caches and assume that the hit ratios of the L1 instruction caches and the L2 unified cache are ideally 100%, in order to focus on the granularity of tracking transactional modification. We vary the line size of the L1 data cache in the range of 32, 64 and 128 bytes. The access delay of the L1 data cache from the processor is 2 cycles on hit. The common bus transac-tion is pipelined in two stages of an address/request and a data-transferring. The access cycle of the L2 cache is 5, 10 and 20 cycles for the L1 cache line size of 32, 64 and 128 bytes, respectively. Each processor which is simply pipe-lined executes a program sequentially, and the execution delay of all types of instructions except load/store instruc-tions is one cycle (IPC=1).
We originally add two machine instructions to declare the beginning and the end (commit) of a transaction respec-tively to the PowerPC instruction set2. As application pro-grams, we use all of eight programs in the STAMP bench-mark suite [24]. The characteristics of them, which are quoted from [24], are summarized in Table 3. These appli-cation programs are compiled by GNU compiler 4.1.2 with -O3 and -static options. 5.2 Results Figure 3 shows the speedups in the case of the modifica-tion granularity of bytes and lines. We define here the speedup normalized to the sequential execution with the cache line size of 32 bytes. The execution cycles in all cases of the granularity of words and almost cases of the granular-ity of lines are the same or nearly equal to those in the cases of the granularity of bytes. Speedups in the case of the gran-ularity of lines are plotted in Figure 3, only if they are dif-ferent by more than 5% from those in the case of the granu-larity of bytes. Especially, the performances in the case of the modifica-tion granularity of words are exactly same to those in the case of the granularity of bytes. In almost instruction set architectures, an atomic instruction to implement synchroni-zation primitives uses a word object as its operand. For ex-ample, therefore, a programmer generally defines a sema-phore variable as a word object (and not as a byte object), even if he uses it as a binary semaphore. So, no difference about the modification granularity between byte and word could be easily expected. In the case of the line size of 128 bytes, line conflicts owing to the false sharing sometimes occur between write accesses from a transactional thread and those from a non-transactional one. At the granularity of lines, such a conflict enforces a transaction to abort. But at the granularity of bytes or words, the transactional thread can continue to run by setting the O bit of the line. Consequently, the perfor-mances at the modification granularity of lines are inferior to those at the granularity of bytes, but the differences are less than only 2% in our simulation. 2 We do not use the native instructions of POWER [23] designed for TM.
Table 3: Qualitative Runtime Characteristics of the STAMP Applications The contents of this table are all quoted from [24]. Length (number of instructions) of transactions, size of the read and write sets, time spent in transac-tions, and amount of contention are described as relative characteristics within the STAMP applications. Application Domain Description Tx Length R/W Set Tx Time Contention bayes machine learning Learns structure of a Bayesian network Long Large High High genome bioinformatics Performs gene sequencing Medium Medium High Low intruder security Detects network intrusions Short Medium Medium High kmeans data mining Implements K-means clustering Short Small Low Low labyrinth engineering Routes paths in maze Long Large High High ssca2 scientific Creates efficient graph representation Short Small Low Low vacation online transaction processing Emulates travel reservation system Medium Medium High Low/Mediumyada scientific Refines a Delaunary mesh Long Large High Medium
International Journal of Computer & Information Science, Vol. 15, No. 1, June 2014 37
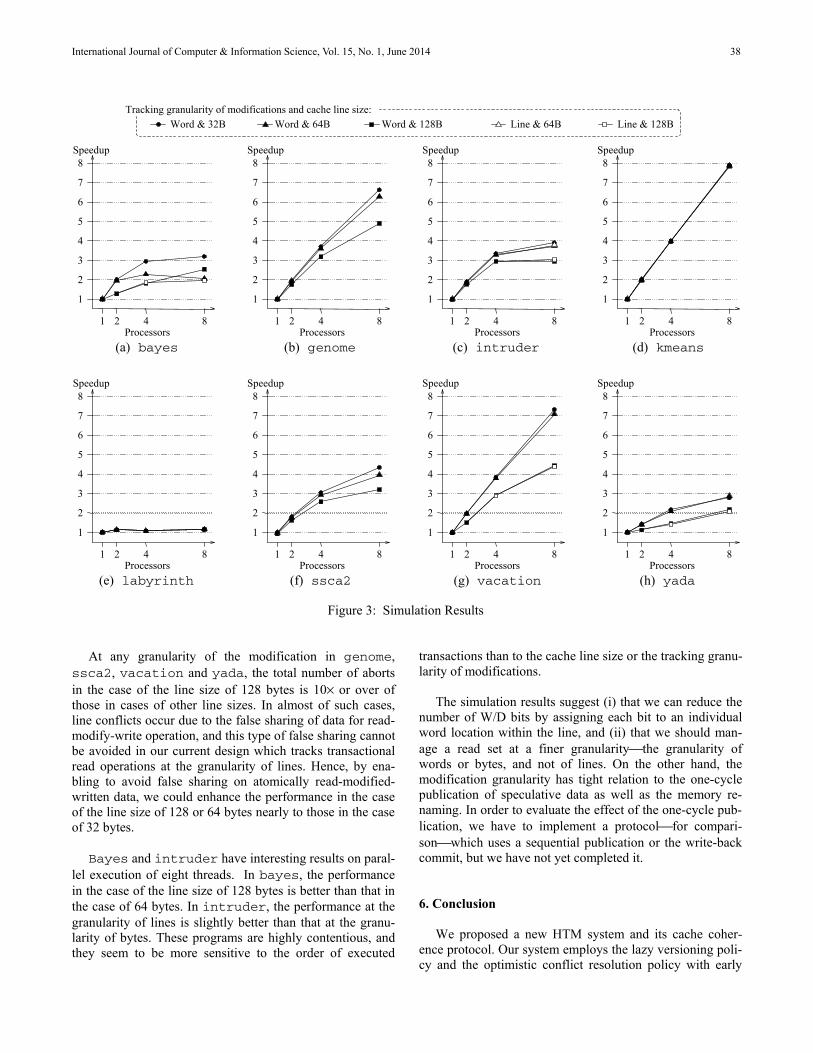
No page numbers
At any granularity of the modification in genome, ssca2, vacation and yada, the total number of aborts in the case of the line size of 128 bytes is 10× or over of those in cases of other line sizes. In almost of such cases, line conflicts occur due to the false sharing of data for read-modify-write operation, and this type of false sharing cannot be avoided in our current design which tracks transactional read operations at the granularity of lines. Hence, by ena-bling to avoid false sharing on atomically read-modified-written data, we could enhance the performance in the case of the line size of 128 or 64 bytes nearly to those in the case of 32 bytes. Bayes and intruder have interesting results on paral-lel execution of eight threads. In bayes, the performance in the case of the line size of 128 bytes is better than that in the case of 64 bytes. In intruder, the performance at the granularity of lines is slightly better than that at the granu-larity of bytes. These programs are highly contentious, and they seem to be more sensitive to the order of executed
transactions than to the cache line size or the tracking granu-larity of modifications. The simulation results suggest (i) that we can reduce the number of W/D bits by assigning each bit to an individual word location within the line, and (ii) that we should man-age a read set at a finer granularity⎯the granularity of words or bytes, and not of lines. On the other hand, the modification granularity has tight relation to the one-cycle publication of speculative data as well as the memory re-naming. In order to evaluate the effect of the one-cycle pub-lication, we have to implement a protocol⎯for compari-son⎯which uses a sequential publication or the write-back commit, but we have not yet completed it. 6. Conclusion We proposed a new HTM system and its cache coher-ence protocol. Our system employs the lazy versioning poli-cy and the optimistic conflict resolution policy with early
1
2
3
4
5
6
7
8
1
Speedup
8 4 2 Processors
(a) bayes
1
2
3
4
5
6
7
8
1 8 4 2 Processors
(e) labyrinth
Speedup
1
2
3
4
5
6
7
8
1
Speedup
842 Processors
(b) genome
1
2
3
4
5
6
7
8
1
Speedup
842Processors
(c) intruder
1
2
3
4
5
6
7
8
1
Speedup
842Processors
(d) kmeans
1
2
3
4
5
6
7
8
1
Speedup
842 Processors
(f) ssca2
1
2
3
4
5
6
7
8
1
Speedup
842Processors
(g) vacation
1
2
3
4
5
6
7
8
1
Speedup
842Processors
(h) yada
Tracking granularity of modifications and cache line size:Word & 32B Word & 64B Word & 128B Line & 64B Line & 128B
Figure 3: Simulation Results
International Journal of Computer & Information Science, Vol. 15, No. 1, June 2014 38

No page numbers
(pessimistic-like) conflict detection. In addition, when a transaction commits, our system quickly publishes all of speculative data modified by the transaction. Thus we can remove both of overheads on commit and abort of a transac-tion. Through more detailed performance analysis, we will investigate and enhance our current design (i) to shift the coherency control layer from the L1 cache to the L2 cache, (ii) to expand the coherence protocol for a NUMA (Non-Uniform Memory Access) architecture, and (iii) to develop a more tolerant scheme for the false-sharing. Acknowledgment This work was supported by JSPS KAKENHI Grant Number 25330058. References
[1] M. Herlihy and J. E. B. Moss, “Transactional Memory: Architectural Support for Lock-Free Data Structures”, in Proceedings of the 20th Annual International Symposium on Computer Architecture, May 1993, pp. 289-300.
[2] N. Shavit and D. Touitou, “Software Transac-tional Memory”, in Proceedings of the 14th An-nual Symposium on Principles of Distributed Computing, Aug. 1995, pp. 204-213.
[3] W. Baek, C. C. Minh, M. Trautmann, C. Kozyrakis and K. Olukotun, “The OpenTM Transactional Application Programming Inter-face”, in Proceedings of the 16th International Conference on Parallel Architecture and Com-pilation Techniques, Sept. 2007, pp. 376-387.
[4] P. Damron, A. Fedorova, Y. Lev, V. Luchangco, M. Moir and D. Nussbaum, “Hybrid Transac-tional Memory”, in Proceedings of the 12th In-ternational Conference on Architectural Support for Programming Languages and Operating Systems, Oct. 2006, pp.336-346.
[5] S. Kumar, M. Chu, C. J. Hughes, P. Kundu and A. Nguyen, “Hybrid Transactional Memory”, in Proceedings of the 11th ACM SIGPLAN Sympo-sium on Principles and Practice of Parallel Programming, Mar. 2006, pp. 209-220.
[6] L. Hammond, V. Wong, M. Chen, B. D. Carlstrom, J. D. Davis, B. Hertzberg, M. K. Prabhu, H. Wijaya, C. Kozyrakis and K. Olukotun, “Transactional Memory Coherence and Consistency”, in Proceedings of the 31st Annual International Symposium on Computer Architecture, June 2004, pp. 102-113.
[7] H. Chafi, J. Casper, B. D. Carlstrom, A. McDonald, C. C. Minh, W. Baek, C. Kozyrakis
and K. Olukotun, “A Scalable, Non-blocking Approach to Transactional Memory”, in Pro-ceedings of the 13th International Symposium on High-Performance Computer Architecture, Feb. 2007, pp. 97-108.
[8] C. S. Ananian, K. Asanovic, B. C. Kuszmaul, C. E. Leiserson and S. Lie, “Unbounded Transac-tional Memory”, in Proceedings of the 11th In-ternational Symposium on High-Performance Computer Architecture, Feb. 2005, pp. 316-327.
[9] K. E. Moore, J. Bobba, M. J. Moravan, M. D. Hill and D. A. Wood, “LogTM: Log-based Transactional Memory”, in Proceedings of the 12th International Symposium on High-Performance Computer Architecture, Feb. 2006, pp. 254-265.
[10] L. Yen, J. Bobba, M. R. Marty, K. E. Moore, H. Volos, M. D. Hill, M. M. Swift and D. A. Wood, “LogTM-SE: Decoupling Hardware Transac-tional Memory from Caches”, in Proceedings of the 13th International Symposium on High-Performance Computer Architecture, Feb. 2007, pp. 261-272.
[11] A. Shriraman, S. Dwarkadas and M. L. Scott, “Flexible Decoupled Transactional Memory Support”, in Proceedings of the 35th Annual International Symposium on Computer Architec-ture, June 2008, pp. 139-150.
[12] M. Lupon, G. Magklis and A. Gonzalez, “A Dynamically adaptable Hardware Transactional Memory”, in Proceedings of the 43rd Annual International Symposium on Microarchitecture, Dec. 2010, pp. 27-38.
[13] S. Tomic, C. Perfumo, C. Kulkarni, A. Armejach, A. Cristal, O. Unsal, T. Harris and M. Valero, “EazyHTM: Eager-Lazy Hardware Transactional Memory”, in Proceedings of the 42nd Annual International Symposium on Mi-croarchitecture, Dec. 2009, pp. 145-155.
[14] C. S. Ananian, K. Asanovic, B. C. Kuszmaul, C. E. Leiserson and S. Lie, “Unbounded transac-tional memory”, in Proceedings of the 11th In-ternational Symposium on High-Performance Computer Architecture, Feb. 2005, pp. 316-327.
[15] R. Rajwar, M. Herlihy and K. Lai, “Virtualizing Transactional Memory”, in Proceedings of the 32nd Annual International Symposium on Computer Architecture, June 2005, pp. 494-505.
[16] W. Chuang, S. Narayanasmy, G. Venkatesh, J. Sampson, M. V. Biesbrouck, G. Pokam, O. Colavin and B. Calder, “Unbounded Page-Based Transactional Memory”, in Proceedings of the 12th International Conference on Architectural Support for Programming Languages and Op-erating Systems, Oct. 2006, pp. 347-358.
[17] J. Chung, C. C. Minh, A. McDonald, H. Chafi, B. D. Carlstrom, T. Skare, C. Kozyrakis and K.
International Journal of Computer & Information Science, Vol. 15, No. 1, June 2014 39
No page numbers
Olukotun, “Tradeoffs in Transactional Memory Virtualization”, in Proceedings of the 12th In-ternational Conference on Architectural Support for Programming Languages and Operating Systems, Oct. 2006, pp. 371-381.
[18] C. Blundell, J. Devietti, E C. Lewis and M. M. K. Martin, “Making the fast case common and the uncommon case simple in unbounded trans-actional memory”, in Proceedings of the 34th Annual International Symposium on Computer Architecture, June 2007, pp. 24-34.
[19] M. Lupon, G. Magklis and S. Gonzalez, “FASTM: A Log-based Hardware Transactional Memory with Fast Abort Recovery”, in Pro-ceedings of the 18th International Conference on Parallel Architectures and Compilation Techniques, Sept. 2009, pp. 293-302.
[20] J. Bobba, N. Goyal, M. D. Hill, M. M. Swift and D.A. Wood, “TokenTM: Efficient Execution of Large Transactions with Hardware Transactional Memory”, in Proceedings of the 35th Annual International Symposium on Computer Architec-ture, June 2008, pp. 127-138.
[21] A. Negi, R. Titos-Gil, M. E. Acacio, J. M. Gar-cia and P. Stenstrom, “π-TM: Pessimistic Inval-idation for Scalable Lazy Hardware Transac-tional Memory”, in Proceedings of the 18th In-ternational Symposium on High-Performance Computer Architecture, Feb. 2012, pp. 141-152.
[22] Freescale Semiconductor Inc., Programming Environments Manual for 32-Bit Implementa-tions of the PowerPC Architecture, 2005.
[23] H. W. Cain, M. M. Michael, B. Frey, C. May, D. Williams and H. Le, “Robust Architectural Sup-port for Transactional Memory in the POWER Architecture”, in Proceedings of the 40th Annu-al International Symposium on Computer Archi-tecture, June 2013, pp. 225-236.
[24] C. C. Minh, J. Chung, C. Kozyrakis and K. Olukotun, “STAMP: Stanford Transactional Applications for Multi-Processing”, in Proceed-ings of IEEE International Symposium on Work-load Characterization, Sept. 2008, pp. 35-46.
Sekai Ichii is a master’s course stu-dent in the department of Information Science at Kyoto Institute of Tech-nology (KIT), Japan. He received B.Eng. degree from KIT. He investi-gates issues in the synchronization and memory architecture for multi-processors. He is a member of the
Institute of Electronics, Information and Communication Engineers (IEICE).
Atsushi Nunome is an assistant pro-fessor in the department of Infor-mation Science at Kyoto Institute of Technology (KIT), Japan. He re-ceived B.Eng., M.Eng. and D.Eng. degree from KIT. Dr. Nunome's re-search focus is computer architecture and distributed computing. He is a
member of the Association for Computing Machinery (ACM), the IEEE Computer Society, Information Pro-cessing Society of Japan (IPSJ), and the Institute of Elec-tronics, Information and Communication Engineers (IEICE).
Hiroaki Hirata is an associate pro-fessor in the department of Infor-mation Science at Kyoto Institute of Technology (KIT), Japan. He re-ceived B.Eng., M.Eng. and D.Eng. degree from Kyoto University, Japan. Dr. Hirata's research focus is comput-er architecture and parallel processing.
He is a member of the Association for Computing Machin-ery (ACM), the IEEE Computer Society, Information Pro-cessing Society of Japan (IPSJ), the Institute of Electronics, Information and Communication Engineers (IEICE), and the Institute of Image Information and Television Engineers (ITE). Dr. Hirata was an editorial board member of IPSJ Transactions, and he has reviewed papers for IPSJ Transac-tions/Journals, IEICE Transactions and international sympo-sia on computer architecture and parallel processing as a program committee member or an external reviewer.
Kiyoshi Shibayama is a professor in the department of Information Sci-ence at Kyoto Institute of Technology (KIT), Japan. He received B.Eng., M.Eng. and D.Eng. degree from Kyo-to University, Japan. Dr. Shibayama's research focus is computer system, computer architecture, parallel pro-
cessing and engineering design education. Also Dr. Shibayama has written by himself six textbooks in Japanese. He has received the annual best paper award, the excellent teaching tool developer award and the fellow from IPSJ, the annual distinguished service prize to the Information and Systems Society activity from IEICE and the annual JSEE award for distinguished author from JSEE. Dr. Shibayama is an active member of ACM, IEEE (Computer Society), IPSJ, IEICE, JSSST, JSAI and JSEE. Dr. Shibayama had been working an associate editor of "Transactions on Information and Systems" published with IEICE, a co-chair of the Kyoto site of the Asia programming contest of ACM Intl. colle-giate programming contest, a chairperson of IEICE comput-er systems technical committee and a research liaison com-mittee on computer science of the Science Council of Japan et al..
International Journal of Computer & Information Science, Vol. 15, No. 1, June 2014 40

Information for Authors
Scope The aim of the International Journal of Computer & Information Science is to present information on well defined theoretical results and empirical studies, to describe current and prospective practices and techniques, to provide critical analysis of the use of CASE tools and to present broad issues in the fields of Computer Science and Engineering, Software Engineering and Information Science and Engineering. A primary aim of the journal will be to make the research accessible and useful to practitioners through carefully written methodology section and discussions of research results in ways that relates to practitioners. Submission Policy 1. The IJCIS does not accept manuscripts or works that have been published in a journal, but accepts substantially revised and expanded versions of papers that were previously presented at conferences. In this case, the author should inform the Editor-in-Chief of the previous publication when the paper is submitted. 2. Submissions, referencing and all the correspondence will be conducted by e-mail. 3. Manuscripts should be in English and are subject to peer review before selection. Procedure for Submission for Review 1. Send your complete text of manuscript to the Editor-in-Chief (e-mail: [email protected]) via e-mail as an attachment document either in Word, PDF or PostScript format. 2. It may be useful for non-English speakers to have a native English speaker read through the article before submission. 3. Your e-mail message (to the Editor-in-Chief) should include the title of your paper, author(s) information (department/section, university/company, phone/fax numbers, e-mail address), the corresponding author’s complete address (mailing address), and area(s) of the paper. Style of Manuscript to be Submitted for Review 1. The text should be double-spaced, two columned, single- sided in Times 12-point type on 8.5-inch x 11-inch paper with margins of 1 inch on all four sides. It should not exceed 30 double-spaced pages. All pages must be numbered sequentially.
2. Provide a 200-250 word abstract, 5-7 keywords. Your abstract should briefly summarize the essential contents. 3. All figures/tables must be captioned, numbered and referenced in the text. 4. An acknowledgement section may be presented after the conclusion section. 5. References should appear at the end of the paper with items referred to by numbers in square brackets. Journal Papers: author’s first initials, followed by last name, title in quotation marks, journal (in Italics), volume and issue number, inclusive pages, month and year. For e.g.: [1] D.E. Perry, and G.E. Kaiser, “Models of Software Development Environments”, IEEE Trans. Software
Eng., vol. 17, no. 3, pp. 282-295, Mar. 1991. Papers of Proceedings: author’s first initials, followed by last name, title in quotation marks, proceedings / symposium / workshop name (in Italics), location, month, and year, and inclusive page numbers. For e.g.: [2] D.S. Wile, and D.G. Allard, “Worlds: An Organization
Structure for Object-Bases”, in Proc.ACM SIGSOFT/SIGPLAN Symp., Palo Alto, CA, Dec. 1986, pp. 130-142.
Books: author’s first initials, followed by last name, title (in Italics), edition, location: publisher, year. For e.g.: [3] R.S. Pressman, “Software Engineering: A
Practitioner’s Approach”, 4th Edition, New York: McGraw-Hill, 1997
Accepted Manuscript Submission All accepted papers are edited electronically. You are required to supply an electronic version of the accepted paper. The detailed guidelines for preparing your final manuscript will be sent upon article acceptance. It is also available on the ACIS website at http://acisinternational.org. Page Charges After a manuscript has been accepted for publication, the author will be invoiced a page charge of $400.00 USD for up to 10 pages if he/she is not a member of ACIS and thereafter an additional $30 per printed page to cover part of publication after the receipt of your final manuscript (camera ready).