acoustic insulation of single panel walls … · fem to predict the sound insulation between...
TRANSCRIPT
Journal of Sound and <ibration (2002) 257(3), 457}475doi:10.1006/jsvi.5048, available online at http://www.idealibrary.com on
ACOUSTIC INSULATION OF SINGLE PANEL WALLSPROVIDED BY ANALYTICAL EXPRESSIONS VERSUS
THE MASS LAW
A. TADEU AND J. M. P. ANTOD NIO
Department of Civil Engineering, ;niversity of Coimbra, 3030-290 Coimbra, Portugal.E-mail: [email protected]
(Received 30 July 2001, and in ,nal form 2 January 2002)
Analytical solutions are presented for the calculation of the acoustic insulation providedby an in"nite single panel wall when subjected to a spatially sinusoidal harmonic line load ora point pressure load (modelled as a superposition of spatially sinusoidal harmonic lineloads). The method used does not entail limiting the thickness of the layer, as the Kirchho!or Mindlin theory requires, and fully takes into account the coupling between the #uid (air)and the solid panel. All calculations are performed in the frequency domain. Time signaturesare obtained by means of inverse Fourier transforms. Special attention is given to thelimitations of the simpli"ed models, which are not able to predict dips of insulation such asthat due to the coincidence e!ect. It has been shown that, although time results may appearcomplicated, the arrival of various pulses at the receivers can be understood in terms of thetravelling body pulses and guided waves. Simulated results have been computed for ceramic,concrete and glass walls of di!erent thickness, when subjected to plane, linear and sphericalwaves. The insulation computed was found to be highly dependent on receiver position,given the interaction between the incident wave "eld and the directed re#ected "eld on thewall, when the wall is struck by a cylindrical or a spherical pulse wave.
� 2002 Elsevier Science Ltd. All rights reserved.
1. INTRODUCTION
The transmission of sound energy through a separation element proceeds by the vibrationof the element, with the mass and sound frequency being relevant variables. As the mass ofthe element increases, so does insulation, due to increasing forces of inertia. When thefrequency of sound incident on an element that maintains the same mass is increased, thevibration power of the element decreases and greater dissipation of sound energy isobserved, leading to a rise in acoustic insulation.Besides these two variables, there are others that may a!ect the acoustic insulation of
a separation element. These include the angle of incidence of the waves, the existence ofweak points in the insulation, rigidity, damping of the element and, in the case of multipleelements, the number of panels and their individual characteristics and separation. In a realsituation, the transmission of sound between two contiguous rooms depends not only onthe separation elements and the connections between the surrounding elements, but also onthe way in which propagation proceeds inside the emitting and receptor rooms. In thisprocess, the vibration eigenmodes of the rooms excited determine the manner ofpropagation.The mathematical description of the phenomena involved in acoustic insulation is thus
very complex. Studies are usually conducted with variations in only a limited number of the
0022-460X/02/$35.00 � 2002 Elsevier Science Ltd. All rights reserved.

458 A. TADEU AND J. M. P. ANTOD NIO
variables in question [1, 2]. This results in a set of simpli"ed predictive insulation modelssuch as the Law of Theoretic Mass.Other simpli"ed methods have been proposed for predicting the sound insulation
conferred by a single panel above, below, and in the vicinity of the coincidence e!ect [3}5].A combination of the prediction methods presented by Sewell [3], Sharp [4] and Cremer[5] was used by Callister et al. [6] to evaluate the sound transmission loss of a single-layerpanel. Novikov [7] proposed a method for expressing the sound insulation of "nite plates atlow excitation frequencies as the mass law plus a correction coe$cient.Osipov et al. [8] used three simpli"ed theoretical models to predict the airborne sound
transmission of single partitions at low frequencies, namely an in"nite plate model, a ba%edplate model and a room}plate}room model. In their models, the walls are assumed to bethin compared with the bending wavelength, and harmonic pure bending wave motion isadopted according to Kirchho!'s theory. The results reveal that sound insulation at lowfrequencies depends both on the properties of the separating wall and on the geometry andthe dimensions of the room}wall}room system.The sound transmission between adjacent rooms has also been addressed, using di!erent
numerical techniques such as the statistical energy analysis method (SEA), the "nite elementmethod (FEM) and the boundary element method (BEM).The SEA is particularly suitable for studying the sound transmission through large and
complex structures, where more accurate models would not be practical. This methoddivides the acoustic system into diverse subsystems. It is assumed that the response ofa subsystem is determined by its resonant modes. However, the SEA model is unreliable atlow frequencies due to the statistical uncertainties that occur where there are few resonantmodes in each of the subsystems. The "nite element model is not a!ected by this limitationat low frequencies. Steel and Craik [9] used both the SEA and the FEM to compute thesound transmission between walls, and compare these results with measured data.Comparison of the results showed that the FEM can be used for determining the couplingbetween subsystems. The SEA model was later used by HynnaK et al. [10] to predict thestructure}borne sound transmission in large welded ship's structures. In the numericaltechnique developed, the pre-processing programs used in the context of the FEM wereapplied to reduce the modelling work. Recently, Craik and Smith [11] used a SEAmodel tocompute the sound transmission through double-leaf lightweight partitions. At lowfrequencies the wall is modelled as a single subsystem, while at higher frequencies the SEAmodel makes use of a number of interconnected subsystems.The "nite element methods have not been used very often to compute sound insulation,
because of the high computation cost entailed. They have failed because the domain beinganalyzed has to be fully discretized, and very "ne meshes are needed to solve excitations athigh frequencies. The FEM has been used to study the e!ect of room dimension on thesound insulation of a separating wall at low frequencies [12]. Maluski and Gibbs used theFEM to predict the sound insulation between adjacent rooms at low frequency, andcompared the results with experimental data [13]. Results showed that the sound insulationprovided by a separating wall at low frequencies is strongly dependent on the modalcharacteristics of the sound "eld of both rooms of the partition.Sgard et al. [14] computed the low-frequency di!use "eld transmission loss through
double-wall sound barriers with elastic porous linings (composed of a porous-elasticdecoupling material sandwiched between an elastic skin and a septum), using a "niteelement model for the di!erent layers of the sound barrier coupled to a variationalboundary element method to account for #uid loading. The di!use "eld is assumed to bea combination of uncorrelated freely propagating plane waves with equal amplitude, no twoof which are travelling in the same direction. Recently, the BEM has been used by Tinnsten
ACOUSTIC INSULATION OF SINGLE PANEL WALLS 459
et al. [15] to compute the pressure and intensity amplitude for structures vibrating in opendomains, analyzing a vibrating sphere and an engine transmission cover.The present work describes analytical solutions for calculating the acoustic insulation
provided by a single panel wall when subjected to a spatially sinusoidal harmonic line loador a point pressure load (modelled as a superposition of spatially sinusoidal harmonic lineloads). The method used does not entail limiting the thickness of the layer, as the Kirchho!or Mindlin theory requires, and fully takes into account the coupling between the #uid(air) and the solid panel. It adapts the analytical equations developed by the authorsfor the steady state response of a homogeneous three-dimensional half-space and layeredacoustic and elastic formations subjected to spatially sinusoidal harmonic line loads[16, 17].This paper "rst describes the simpli"ed model predicting insulation in single elements,
known as the Law of Theoretic Mass, or the Law of Theoretical Frequency. There followsa description of the procedure for computing the analytical acoustic insulation provided bya single panel when subjected to a sinusoidal line pressure load. The full set of expressions iscompared with those provided by the BEM, for which a full discretization of the boundaryinterfaces is required. Finally, a number of applications are presented to illustrate how theanalytical solutions presented compare with those provided by the simpli"ed analyticalmodel.
2. SIMPLIFIED MODEL PREDICTING INSULATION IN SINGLE ELEMENTS
If an in"nite simple separation element is held to behave like a group of juxtaposedmasses, having independent displacement, and null damping forces, the sound reductionindex (R) for plane wave incidence follows a law, known as the Law of Theoretic Mass, orthe Law of Theoretical Frequency [18],
R"10 log �1#�� fM cos �
�����
�
� dB, (1)
where f is the frequency (Hz),M is the mass per unit area of the panel (kg/m�), � is the angleof incidence, �
�is the density of the air (+1)22 kg/m�), and �
�is the speed of sound in air
(for ¹"203C, ���340m/s). This equation predicts an increase in the sound reduction
index of about 6 dB for each doubling of the mass per unit area or frequency, but it does nottake into account the existence of a di!use "eld. Di!erent models have been proposed forrandom distribution of angles of incidence, but again they all lead to an increase in thesound reduction index of about 6 dB for each doubling of the mass per unit area andfrequency. The simpli"ed model given by equation (1) is used throughout this work, forcomparison with the computed results. The element's rigidity and damping a!ect itsdynamic behavior, which is not taken into account by the models described above, leadingto local dips in sound insulation. These can be predicted for frequencies relative to thenormal transversal vibration modes through #exion and due to the propagation of planewaves throughout the panel.The propagation of plane waves along a panel is frequently analyzed, assuming the
existence of an in"nitely long thin plate, not taking the presence of #uid on the two faces ofthe panel into account. The mathematical development of these assumptions leads to thedispersion relation [19]
c�"(D��/�h )���� � (2)

460 A. TADEU AND J. M. P. ANTOD NIO
where c�is the phase velocity of the propagating plane waves along the plate, � is the
density of the material (kg/m�), h is the thickness of the panel (m), �"2�f,D"h�E/[12(1!��)] with E and �, being Young's modulus and the Poisson ratiorespectively. It should be noted that this equation predicts unbounded wave velocity forvery short wavelength, high-frequency conditions, as a consequence of an imperfectmathematical model in which e!ects of shear and rotary inertia have been ignored. It isfrequently accepted in practical applied acoustics that when the wavelength of sound airprojected on a plate equals the wavelength of these bending waves, the movement of thepanel increases, leading to a low sound insulation. This happens when
�"(��/sin� )� ��h/D (3)
where � is the incidence angle of the sound relative to a direction perpendicular to theelement. This assumption does not introduce signi"cant misinterpretations in the insulationpredictions because the sound waves travel at a much lower velocity than the body wavevelocities in the plate.The critical frequency ( f
�) is taken as being that which corresponds to �"903,
f�"
���
1)8138h�� (1!��)
E. (4)
3. ANALYTICAL ACOUSTIC INSULATION PROVIDED BY A SINGLE PANEL
This section brie#y describes how the acoustic insulation provided by an elastic solidmedium bounded by two acoustic #at #uid media, when subjected to a spatially sinusoidalharmonic pressure load, is analytically evaluated (see Figure 1(b)).
x
z
y
(x0,y0)
x
z
y
h
(x0,y0)
Fluid
Fluid
Solid
Fluid
Fluid
Solidh
(a) (b)
(c)
Figure 1. De"nition of the problem: (a) spatially harmonic varying line load in an unbounded medium;(b) spatially sinusoidal harmonic line pressure load applied in the top #uid medium of a single panel structurebounded by two #uid parallel media; (c) geometry of the model.

ACOUSTIC INSULATION OF SINGLE PANEL WALLS 461
The solution uses the authors' previous work on deriving analytical solutions for thesteady state response of a homogeneous three-dimensional half-space and layered acousticand elastic formations subjected to spatially sinusoidal harmonic line loads [16, 17]. Thetechnique requires knowing the solid displacement potentials and #uid pressure potentials.The solid displacement potentials used to de"ne the present Green functions are thosede"ned in the method used by the authors [20] to evaluate the Green functions fora harmonic (steady state) line load with a sinusoidally varying amplitude in the thirddimension, in an unbounded medium. These are in complete agreement with the solutionfor moving loads given earlier by Pedersen et al. [21] and Papageorgiou et al. [22].A similar technique is employed for the #uid pressure potential. The displacement andpressure potentials are then written as a superposition of plane waves, following theapproach used "rst by Lamb [23] for the two-dimensional case, and then by Bouchon [24]and Kim et al. [25] to calculate the three-space dimension "eld by means of a discretewavenumber representation. The transformation of these integrals into a summation can beachieved if an in"nite number of such sources are distributed along the x direction, at equalintervals ¸
�(see Appendix A).
This procedure yields the following expressions for the pressure "eld in the two #uidmedia, when a spatially sinusoidal harmonic pressure load is applied in the top layer of the#uid (see Figures 1(b) and 1(c)), at point (x
�, y
�), in the vicinity of a solid layer of thickness h:
����}���"��!i
¸�
��� �
��� �E
�����
D��� E
�(when y(0),
����}������"!
i
¸�
��� �
��� �E�
�����
H�� � E
�(when y'h) (5)
where E�"e!ik
�(x!x
�), k
�"(2�)/(¸
�) n, ��
�"�k�p
�!k�
�!k�
�with Im(��
�))0, kp
�"�/�
�,
�, is the frequency of the load, k�is the wavenumber in z, �
�"��
�/�
�is the acoustic
(dilatational) wave velocity of the #uid, ��is the #uid LameH constant, �
�is the mass density
of the #uid, E��
"e!i���y , E�
��"e!i��
�y!h and �� is the direct incident pressure "eld
(computed as in unbounded space). The coe$cients D��and H�
�are determined from the
appropriate boundary conditions (����
"����
"0, ����
"����
"0, ����
"����
and u��"u�
�at
y"0 and at y"h), so that the "eld produced simultaneously by the source and surfaceterms should produce the continuity of normal displacements and stresses, and nulltangential stresses at the interface between the solid and the #uid media. The imposition ofthese boundary conditions, for each value of n yields a system of eight equations in the eightunknown constants (see Appendix B). Finally, the acoustic insulation is given by thedi!erence between ����}��� and ����}������, which can in turn be approximated by a "nite sumof equations (N).
4. NUMERICAL APPLICATIONS
The expressions described above were used to compute the acoustic insulation providedby a single in"nite wall subjected to plane loads, spatially sinusoidal harmonic line loads orpoint loads. The plane load is simulated ascribing single values of n and k
�in equations (5),
while the spatially sinusoidal harmonic line load is computed performing the fullsummation in k
�, again for a single value of k
�, using the same equations. The point load is

TABLE 1
Material properties
Material
Shearmodulus(GPa)
Modulusof
elasticity(GPa)
ThePoissonratio
Density(kg/m�) �(m/s) (m/s) Wall thickness (cm)
Concrete 12)6 28)98 0)15 2500 3498)6 2245 5 10 15 20Ceramicbrick 2)5 6)0 0)20 1400 2182)2 1336)3 5 10 15 20Glass 29)508 72 0)22 2500 5734)1 3435)6 0)4 0)8 1)2 1)6
462 A. TADEU AND J. M. P. ANTOD NIO
synthesized by performing an inverse spatial Fourier transform in the z direction, which isdiscretized, assuming the existence of an in"nite number of equally spaced virtual sources.The calculations are "rst performed in the frequency domain, which allows the insulation
to be determined. Time responses are computed by means of inverse Fourier transforms.The source is assumed to be a Ricker wavelet function de"ned in the frequency domain by
; (�)"A[2��t�e!i�t
�]��e!�� (6)
where A is the amplitude, �"�t�/2, t
�is the time when the maximum occurs, while �t
�is
the characteristic (dominant) period of the wavelet.Thus, the Fourier transformations are achieved by discrete summations over
wavenumbers and frequencies, which is mathematically the same as adding periodic sourcesat spatial intervals ¸"2�/�k
�(in the z-axis), and ¸
�"2�/�k
�(in the x-axis), and temporal
intervals ¹"2�/��, with �k�, �k
�, being the wavenumbers and �� the frequency steps
[26]. The spatial separations ¸ and ¸�must be large enough so that the periodic sources do
not contaminate the response. Thus, the contribution to the response by the "ctitioussources must occur at times later than ¹. This process is greatly helped if the frequency axisis shifted slightly downward, by considering complex frequencies with a small imaginarypart of the form �
�"�!i� (with �"0)7��). The periodic sources are thus practically
eliminated. In the time domain, this shift is later taken into account by applying anexponential window e�� to the response [27].In our examples, di!erent materials and thickness (h) were ascribed to the wall, as listed in
Table 1. The host acoustic medium is kept constant, allowing a pressure wave speed of340 m/s and a density of 1)22 kg/m� . The source is placed 2)0m away from the wall, whilea grid of receivers is placed on both sides of the wall, as shown in Figure 2.The computations are performed in the frequency range (2, 8192 Hz), with a frequency
increment of 2 Hz, which determines the total time duration (¹"0)5s) for the analysisin the time domain. The spatial distance between the virtual point sources has been setto 4�¹.A selection of results is given below, to illustrate the main "ndings. First, a ceramic brick
wall is used to illustrate how the acoustic insulation changes when subjected to plane waveswith di!erent incidence angles. Then, the time responses and insulation features aredescribed, again using a ceramic brick wall subjected to the incidence of cylindrical waves(k
�"0). Insulation curves for di!erent wall materials and thickness are also included. The
ceramic wall is used to show how the acoustic insulation varies when a panel is subjected tothe incidence of cylindrical waves with di!erent spatial sinusoidal variation along one

2 m
30 m
h
y
Source
2 m 2.5
m
1.5
m
0.5
m
Receivers
x
Figure 2. Position of the receivers and sources.
0
60
120
180
10 100 1000 8000
2609.4
652.3
417.5
301.6
Frequency (Hz)
Am
plitu
de(d
B)
Figure 3. Sound transmission loss provided by a 10)0 cm thick ceramic brick wall when subjected to plane waves(�, Mass law; �, v"340)0 m/s; �, v"400)0m/s; �, v"500)0 m/s; £"1000)0m/s; �, v"Rm/s).
ACOUSTIC INSULATION OF SINGLE PANEL WALLS 463
direction (k�O0). The last example provides the insulation response of a ceramic brick wall
subjected to a point source.
4.1. INCIDENCE OF PLANE WAVES
Figure 3 illustrates the sound transmission loss provided by a ceramic brick wall, 10)0 cmthick, in a dB scale, when subjected to plane waves with di!ering incidence angles, given bydi!erent apparent wave velocities, namely v"R, 1000)0, 500)0, 400)0, and 340)0 m/s. Thesecomputations have been performed ascribing k
�"0 in equations (5), and de"ning N in
these equations in such away as to model the di!erent plane waves. Thus, v"R m/s(N"0) corresponds to waves that are normally incident, while v"340)0 m/s correspondsto waves that travel parallel to the ceramic wall. The waves travelling along the plate withapparent wave speeds of v"1000)0, 500)0 and 400)0 m/s correspond to plane wavesreaching the surface with inclinations of 19)93, 42)83 and 58)23, respectively, in relation to thenormal direction of the wall.An additional curve, representing the mass law, given by equation (1), is also plotted in
Figure 3. The comparison of the analytical curves with the mass law curve reveals that the

464 A. TADEU AND J. M. P. ANTOD NIO
analytical results di!er from those provided by the mass law, unless the plane wave isnormal to the wall (v"R m/s and k
�"0). In this case there is agreement, except for high
frequencies. The other curves have dips at speci"c frequencies. When the apparent speed istaken to be equal to the sound speed in the air (340)0 m/s) the dip appears near to the criticalfrequency of the wall ( f
�"301)6 Hz), given by equation (4). However, the di!erences
between the results computed by equation (3), for the frequencies associated with the planewaves travelling along the plate at speeds of v"400)0, 500)0 and 1000)0 m/s, ( f"417)5,f"652)3 and 2609)4Hz), and those of the insulation dips provided by our model, grows asthe inclination of the waves decreases. Furthermore, as the apparent wave speed decreases,the insulation provided by the wall is observed to increase for high frequencies, whereas itdecreases for low frequencies.
4.2. INCIDENCE OF CYLINDRICAL WAVES
Next, the wall is assumed to be subjected to the incidence of cylindrical waves of k�"0.
This corresponds to waves arriving at the receivers with a 903 inclination in relation to thez-axis, which can be understood as a pure two-dimensional problem where the source islinear.
4.2.1. ¹ime responses
Synthetic waveforms have been computed to simulate the wave propagation in thevicinity of a ceramic brick wall, 10)0 cm thick. The response is computed at receivers placed0)5 m away from the wall surface, on both sides of the wall.Figure 4 displays the pressure time responses, modelling the result of the incidence of
a cylindrical dilatational Ricker pulse source with a characteristic frequency 3000 Hz on thewall. Figure 4(a) illustrates the response obtained in the #uid medium containing the source.Two pulses are clearly visible, the direct incident pulse, labelled I in the plot, and a pulsethat arrives at the receivers after being re#ected on the surface wall, labelled PP . However,the responses contain additional pulses, produced by refractions and mode conversions atthe wall interface, labelled PPP and PSP waves. The PPP wave begins as a dilatationalwave in the #uid; it is critically refracted onto the wall as a P wave and then refracted backinto the #uid as a dilatational wave. The so-calledPSPwave begins as a dilatational wave inthe #uid, it is critically refracted into the wall as an S wave, and is refracted into the #uid asa dilatational wave. After the PSP wave arrives, the response is marked by a dense pack ofpulses originating in the guided waves that travel along the wall. The scaling of the plotsshown in Figure 4(a) does not allow easy observation of the PPP and PSP body waves.Since the scale of the plots precludes identi"cation of the PPP and PSP body waves, wehave ampli"ed the graph so as to show these arrivals at the receiver placed at x"28)0 m(see Figure 4(b)).Figure 4(c) shows the synthetic signals computed in the #uid medium on the other side of
the wall. As expected, the response amplitudes are much lower than the ones calculated forthe side where the source is, due to the insulation provided by the wall. As before, a pack ofhigh-frequency pulses is visible after the arrival of the dilatational waves that are caused bythe incident waves critically refracting into the wall as S waves, followed by a ring oflow-frequency waves, up to the arrival of the later P body pulses. Analysis of the resultsshows that the receiver, placed at the same abscissa as the source (x"0)0 m), does notrecord the presence of the guided waves. The guided waves are dispersive and originate atsome distance from the source.

0.01.5E6
0 25 50 75 100
PPI
PPI
PSPPPP x=28.0m
x=24.0m
x=20.0m
x=16.0m
x=12.0m
x=8.0m
x=4.0m
x=0.0m
Time (ms)
0.0
3E3
0 25 50 75 100
PSPPPP x=28.0m
Time (ms)
0.01E3
0 25 50 75 100
PSPPPPx=28.0m
x=24.0m
x=20.0m
x=16.0m
x=12.0m
x=8.0m
x=4.0m
x=0.0m
Time (ms)
(a)
(b)
(c)
Figure 4. Synthetic waveforms at receivers placed 0)5m away from a 10)0 cm thick ceramic brick wall, subjectedto a cylindrical dilatational Ricker pulse source with a characteristic frequency 3000Hz (k
�"0): (a) in the #uid
medium containing the source. (b) in the #uid medium containing the source at x"28)0m; (c) in the #uid mediumnot containing the source.
ACOUSTIC INSULATION OF SINGLE PANEL WALLS 465
To illustrate the behavior of the propagation at low frequencies, Figure 5 includes theresponses obtained when the source excites a pulse with a frequency of 500 Hz, whichexhibits longer time duration. Figure 5(a) displays the results computed in the #uid mediumcontaining the source. The arrival of the incident and the directed re#ected pulses coincideswith the corresponding arrival times obtained when the frequency excitation of the source

0.06E5
0 25 50 75 100
x=28.0m
x=24.0m
x=20.0m
x=16.0m
x=12.0m
x=8.0m
x=4.0m
x=0.0m
Time (ms)
0.01E4
0 25 50 75 100
x=28.0m
x=24.0m
x=20.0m
x=16.0m
x=12.0m
x=8.0m
x=4.0m
x=0.0m
Time (ms)
(a)
(b)
Figure 5. Time signals at receivers placed 0)5m away from a 10)0 cm thick ceramic brick wall, subjected toa cylindrical dilatational Ricker pulse source with a characteristic frequency 500Hz (k
�"0). (a) in the #uid
medium containing the source; (b) in the #uid medium not containing the source.
466 A. TADEU AND J. M. P. ANTOD NIO
was set to 3000 Hz. At receivers placed further away from the source, however, a single pulseis detectable, caused by the incident pulse overlapping the directed re#ected pulses.Figure 5(b) shows the time responses calculated in the #uid medium on the other side of
the source. The wave propagation features registered at Figure 4(c) are still visible.However, the guided waves arrive at later times, owing to the absence of the high frequencycomponents, which exhibited faster velocities, as expected.
4.2.2. Insulation calculations
Next, a 10)0 cm thick ceramic wall is used to illustrate some basic insulation features andshow how the insulation is calculated. The insulation provided by the di!erent wall types isthen presented.Figure 6 plots the amplitude of the responses, on a dB scale, on both sides of the ceramic
wall at receivers placed at x"28)0, 0)5m from the wall. The amplitude response on the sideof the source (labelled top layer), evinces pronounced dips that result from the interaction ofthe incident wave "eld with the directly re#ected "eld, which happens when the di!erence intravel paths �s is a multiple of the wavelength (0)5�
�/�s"2386)4Hz and 1)5�
�/�s"
7159)3Hz). The amplitude response at the receiver on the other side of the wall (labelled&&bottom layer''), is smoother but it shows an ampli"cation at frequencies in the vicinity of

0
25
50
75
100
10 100 1000 2386.4 7159.3
Coincidence Effect
Frequency (Hz)
Am
plitu
de(d
B)
Figure 6. Amplitude of the responses on both sides of a 10)0 cm thick ceramic wall at x"28)0, 0)5m, away fromthe wall, and computed insulation curve when subjected to a cylindrical two-dimensional line source(£, insulation; �, top layer; �, bottom layer).
ACOUSTIC INSULATION OF SINGLE PANEL WALLS 467
the coincidence e!ect. This "gure includes the insulation curve, provided by the di!erencebetween the amplitudes of the previous curves. In this curve, the dips observed for thereceiver response placed in the side of the source are still evident, as is the coincidence e!ectobserved at the receiver placed in the other side of the wall.Figure 7(a) displays the insulation curves computed from the responses at receivers
placed 0)5m away from the wall, and at x"0)0, 8)0, 16)0m and 24)0m. The dips ofinsulation due to the interaction of the incident wave "eld with the directed re#ected "eld ofthe di!erent curves occurs at well-de"ned frequencies, as explained before. The insulationdip due to the coincidence e!ect is not observable at x"0)0 m . This was expected becausethe guided waves do not exist on the vertical plane containing the source, x"0)0m . Forthe other curves, the coincidence e!ect is clearly visible and occurs in the vicinity of( f
�"301)6 Hz), given by equation (4). Analysis of the results indicates that the insulation is
highly dependent on the position of the receivers. Additional calculations have beenperformed to compute the average energy of the responses along the grid of receivers,illustrated in Figure 2, on both sides of the wall, for each frequency of excitation. Figure 7(b)shows the average insulation curve obtained by the di!erence between these two responses.The resulting curve is smoother, with a pronounced dip due to the coincidence e!ect.Next, the average insulation curves computed for the various walls, with di!erent
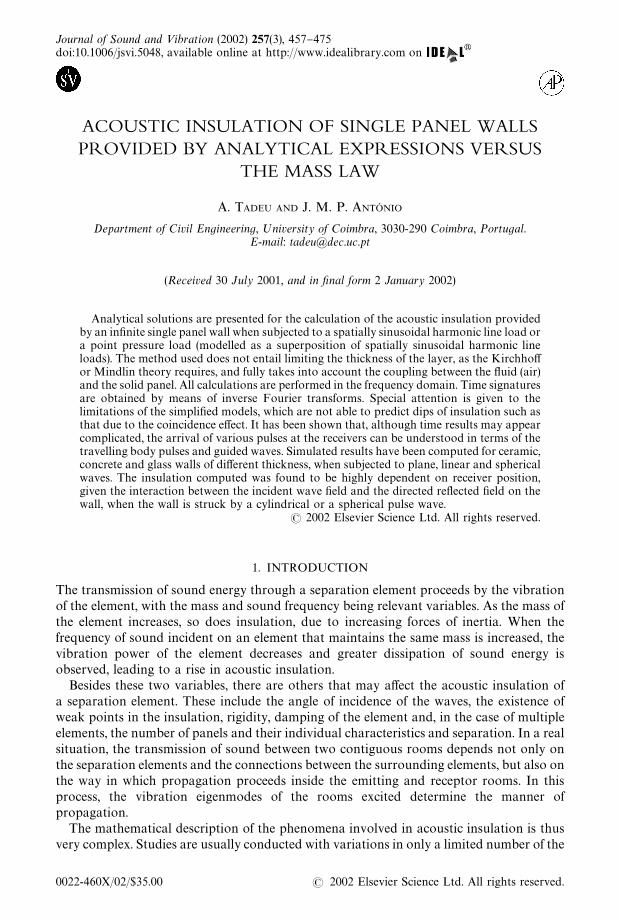
thickness and materials, as listed in Table 1, are displayed in Figure 8. In each plot theinsulation curve predicted by the mass law (equation (1)) for the thicker wall is also included,to illustrate the di!erences between the analytical model and the simpli"ed model. Thesimpli"ed curves for the other wall thickness are not plotted, to make it easier to interpretthe results, but they would appear as parallel, decreasing 6 dB for each half of mass.Additional vertical lines have been positioned in the plots according to the criticalfrequency obtained by equation (4) for each wall.The simpli"ed model predicts an increase in sound insulation of about 6 dB for each
doubling of frequency, which does not occur with the analytical solution. The increase ofsound insulation with frequency is indeed less than predicted. At low frequencies thesimpli"ed model predicts insulation values lower than those obtained by the analyticalmodel. It can also be seen that the discrepancies between the simpli"ed insulation curvesand analytical curves increase as the mass of the wall diminishes, that is, as the thicknessdecreases and with the change from the concrete to the ceramic wall and then to the glasswall. The position of the critical frequencies, predicted by the simpli"ed model, equation (4),

0
20
40
60
80
10 100 1000301.6 8000
Frequency (Hz)
Am
plitu
de(d
B)
0
20
40
60
80
10 100 1000301.6 8000
Frequency (Hz)
Am
plitu
de(d
B)
(a)
(b)
Figure 7. Computed insulation curves provided by a 10)0 cm thick ceramic wall when subjected to a cylindricalline source (k
�"0): (a) receivers placed 0)5m away from the wall, at x"0)0m (marked �), x"8)0m (marked �),
x"16)0m (marked £) and x"24)0m (marked �); (b) average insulation obtained for the full grid of receivers.
468 A. TADEU AND J. M. P. ANTOD NIO
is closer to the insulation dips calculated by the analytical model as we move from theceramic to concrete wall, and then from the concrete to the glass wall, that is, as the modulusof elasticity of the material from which the wall is made increases.A 10)0 cm thick ceramic wall is again used to illustrate how the acoustic insulation varies
when a panel is subjected to the incidence of cylindrical waves with di!erent spatialsinusoidal variation along one direction.This type of load simulates the propagation of a moving load along the z direction and
simulations are performed, following waves with di!erent apparent wave velocities alongthe z-axis. This apparent wave velocity (v
�) results from waves arriving at the z axis with
a path inclination given by arc cos (��/v
�), where �
�is the true wave speed. Thus, in the
equations presented above, k�is taken to be �/v
�. In the examples given, "ve apparent
speeds (v�) are chosen, namely v
�"R, 1000, 500, 400 and 340 m/s. The apparent speed
v�"Rm/s corresponds to waves arriving at the receivers with a 903 inclination in relation
to the z-axis, k�"0. As the path inclination ranges from 903 to 03, there is a lower bound
value for v�, which corresponds to the slowest wave speeds, v
�"340 m/s. Below this value,
there are inhomogeneous waves, which decay very quickly with decreasing values of v�.
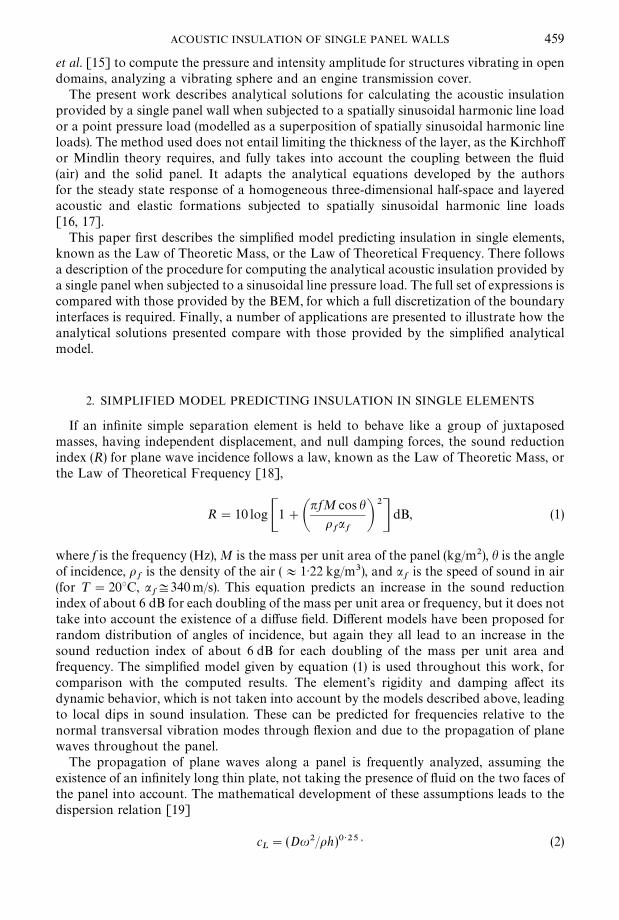
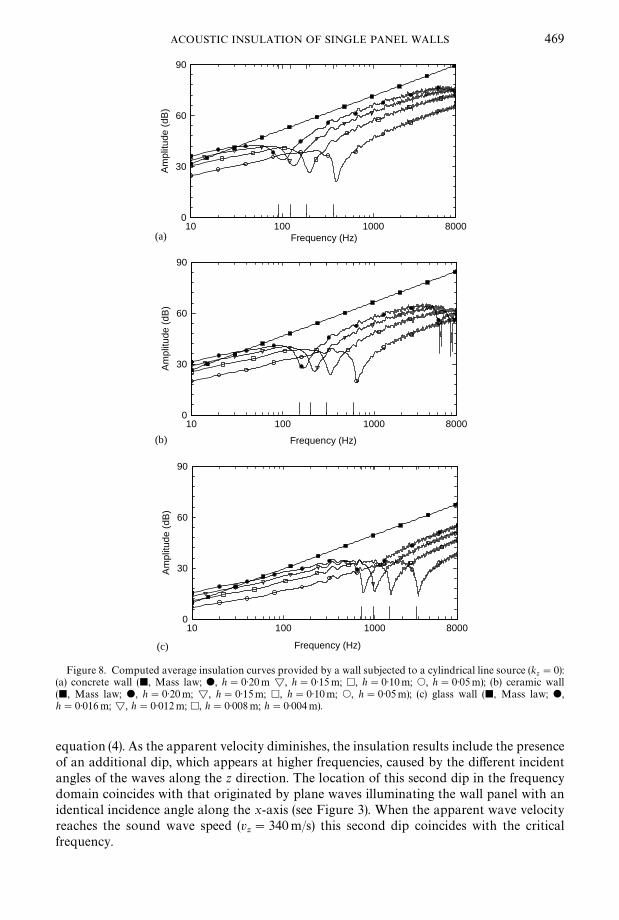
The average insulation curves computed for the di!erent apparent wave velocities ( v�)
are displayed in Figure 9. The insulation curve predicted by the mass law (equation (1)) isalso included. The insulation provided by the wall when struck by a linear source(v
�"Rm/s), exhibits a well-de"ned dip in the vicinity of the critical frequency given by
0
30
60
90
10 100 1000 8000Frequency (Hz)
Am
plitu
de(d
B)
0
30
60
90
10 100 1000 8000
Frequency (Hz)
Am
plitu
de(d
B)
0
30
60
90
10 100 1000 8000
Frequency (Hz)
Am
plitu
de(d
B)
(a)
(b)
(c)
Figure 8. Computed average insulation curves provided by a wall subjected to a cylindrical line source (k�"0):
(a) concrete wall (�, Mass law; �, h"0)20m £, h"0)15m; �, h"0)10m; �, h"0)05m); (b) ceramic wall(�, Mass law; �, h"0)20m; £, h"0)15m; �, h"0)10m; �, h"0)05m); (c) glass wall (�, Mass law; �,h"0)016m; £, h"0)012m; �, h"0)008m; h"0)004m).
ACOUSTIC INSULATION OF SINGLE PANEL WALLS 469
equation (4). As the apparent velocity diminishes, the insulation results include the presenceof an additional dip, which appears at higher frequencies, caused by the di!erent incidentangles of the waves along the z direction. The location of this second dip in the frequencydomain coincides with that originated by plane waves illuminating the wall panel with anidentical incidence angle along the x-axis (see Figure 3). When the apparent wave velocityreaches the sound wave speed (v
�"340m/s) this second dip coincides with the critical
frequency.
0
60
120
180
10 100 1000 8000
Frequency (Hz)
Am
plitu
de(d
B)
Figure 9. Average insulation curves computed when a 10)0 cm thick ceramic wall is subjected to the incidence ofcylindrical waves with di!erent spatial sinusoidal variation along the z direction (�, Mass law; �, v
�"340)0m/s;
�, v�"400)0 m/s; �, v
�"500)0 m/s; v
�"1000)0 m/s; �, v
�"Rm/s).
0
20
40
60
80
10 100 1000301.6 8000Frequency (Hz)
Am
plitu
de(d
B)
Figure 10. Average insulation curve computed when a 10)0 cm thick ceramic wall, is subjected to the incidenceof spherical wave.
470 A. TADEU AND J. M. P. ANTOD NIO
The insulation obtained for cylindrical waves with di!erent apparent wave speeds alongthe z direction approaches the mass law prediction at low frequencies. In the vicinity of thecoincidence e!ect, the computed insulation appears well below that given by the mass law.At high frequencies, lower insulation than that predicted by the mass law is calculated whenthe apparent wave speed, v
�, is high, while the computed insulation exceeds the prediction
provided by the mass law when the apparent speed, v�, is low.
4.3. INCIDENCE OF SPHERICAL WAVES (POINT LOAD)
The last example provides the insulation response of the 10)0 cm thick brick wall,subjected to a point pressure source. The results have been computed, fully integrating theresponse in the k
�wavenumber domain. Figure 10 displays the calculated average
insulation results. Again, the dip of insulation related to the coincidence e!ect appears at thesame frequency location as that for cylindrical waves (k
�"0). The level of computed
insulation is higher than before, particularly for high frequencies.The time responses computed on both sides of the wall, when the source is modelled as
a Ricker wavelet with a characteristic frequency of 3000 Hz, manifest similar trends to the

ACOUSTIC INSULATION OF SINGLE PANEL WALLS 471
ones de"ned for a linear cylindrical source (k�"0). However, the amplitude of the signals
decays faster than before (k�"0) as the receiver is placed further away from the source. This
was anticipated, as the energy of a spherical wave decays faster with the distance to thesource than that of a linear source (not displayed).
5. CONCLUSIONS
Analytical solutions for the steady state response of a spatially sinusoidal harmonic lineload, illuminating a single panel wall, bounded by two #at #uid media, have been presented.These solutions make it possible to compute both the time pressure responses and theinsulation provided by the solid wall, for plane, cylindrical and point pressure waves.The synthetic signals computed in the #uid medium reveal the presence of a complicated
wave"eld, generated by both body waves and guided surface waves. The guided waves werefound to be very dispersive, and faster phase velocities were associated with higherfrequencies of excitation. At high frequencies of excitation, the arrival of the guided wavesexhibits a pack of a high-frequency pulses, followed by a ring of low-frequency waves. Thefeatures of the time responses obtained when cylindrical waves are excited are similar tothose obtained when a spherical pulse is excited. However, the amplitude decay of theresponse obtained when a spherical wave is excited is faster with the distance to the sourcethan that of a linear source.The results obtained when the wall is illuminated by plane waves indicate that the dips of
insulation related to the coincidence e!ect occur in the vicinity of those computed using thedispersion relation for thin plates. However, the di!erence between the frequency positionsof these dips, provided by the simpli"ed model, and those computed by our model, grows asthe incidence angle of the plane waves increases.The computed insulation appears to be very dependent on receiver position, because of
the interaction between the incident wave "eld and the "eld directly re#ected on the wall,when the wall is struck by a cylindrical pulse wave. The average insulation calculated for thedi!erent wall materials and thickness is less than predicted by the simpli"ed model, forfrequencies above the coincidence e!ect. The computed insulation and the simpli"ed resultsshow more pronounced di!erences as the mass of the wall diminishes. The simpli"eddetermination of the critical frequencies approximates the insulation dips calculated by theanalytical model more closely as the modulus of elasticity of the material wall increases.The insulation results reveal the presence of an additional dip, which appears at higher
frequencies, when the line source is sinusoidal along the z direction. This second dip occursat the same frequency as that originated by plane waves illuminating the wall panel with anidentical incidence angle along the x-axis. When the wall is subject to a spherical pulse, thedip in insulation related to the coincidence e!ect occurs at the same frequency position asthat for cylindrical waves (k
�"0). The computed insulation is greater than for cylindrical
waves, particularly for high frequencies.
REFERENCES
1. M. H. CYRIL 1957 Handbook of Noise Control. New York: McGraw-Hill Book Company.2. A. C. C. WARNOCK and W. FASOLD 1997 Sound Insulation: Airborne and Impact, Encyclopedia of
Acoustics, Vol. 3, pp. 1129}1161. New York: Wiley-Interscience Publication.3. E. C. SEWELL 1970 Journal of Sound and <ibration 12, 21}32. Transmission of reverberant sound
through a single-leaf partition surrounded by an in"nite rigid ba%e.4. B. H. SHARP 1978 Noise Control Engineering 11, 53}63. Prediction methods for the sound
transmission of building elements.

472 A. TADEU AND J. M. P. ANTOD NIO
5. L. CREMER 1942 Akustische Zeitschrift 7, 81}102. Theorie der ShalldaK mmung duK nner WaK nde beischraK gem Einfall.
6. J. R. CALLISTER, A. R. GEORGE and G. E. FREEMAN 1999 Journal of Sound and <ibration 222,145}151. An empirical scheme to predict the sound transmission loss of single-thickness panels.
7. I. I. NOVIKOV 1998 Applied Acoustics 54, 83}90. Low-frequency sound insulation of thin plates.8. A. OSIPOV, P. MEES and G. VERMEIR 1997 Applied Acoustics 52, 273}288. Low-frequency
airborne sound transmission through single partitions in buildings.9. J. A. STEEL and R. J. M. CRAIK 1994 Journal of Sound and <ibration 178, 553}561. Statistical
energy analysis of structure-borne sound transmission by "nite element methods.10. P. HYNNAG , P. KLINGE and J. VUOKSINEN 1995 Journal of Sound and <ibration 180, 583}607.
Prediction of structure-borne sound transmission in large welded ship structures using statisticalenergy analysis.
11. R. J. M. CRAIK and R. S. SMITH 2000 Applied Acoustics 61, 223}245. Sound transmission throughdouble leaf lightweight partitions part I: airborne sound.
12. A. OSIPOV, P. MEES and G. VERMEIR 1997 Proceedings of Inter-Noise 2, 759}762. Numericalsimulation of airborne sound transmission at low frequencies: the in#uence of the room and thepartition parameters.
13. S. P. S. MALUSKI and B. M. GIBBS 2000 Journal of the Acoustical Society of America 108,1741}1751. Application of a "nite-element to low-frequency sound insulation in dwellings.
14. F. C. SGARD, N. ATALLA and J. NICOLAS 2000 Journal of Acoustitcal Society of America 108,2865}2872. A numerical model for the low frequency di!use "eld sound transmission loss ofdouble-wall sound barriers with elastic porous linings.
15. M. TINNSTEN, M. JONSSON and OG . JOHANSSON 2001 Acta Acustica 87, 117}127. Prediction andveri"cation of acoustic radiation.
16. A. TADEU, J. ANTOD NIO and L. GODINHO Computational Mechanics Journal 27, 484}491. Green'sfunction for two-and-a-half dimensional elastodynamic problems in a half-space.
17. A. TADEU and J. ANTOD NIO Journal of Computer Modeling in Engineering and Sciences, CMES 2,477}495. 2.5D Green's functions for elastodynamic problems in layered acoustic and elasticformations.
18. L. L. BERANEK and I. L. VED R 1992 Noise and <ibration Control Engineering. New York: Wiley.19. K. F. GRAFF 1975 =ave Motion in Elastic Solids. New York: Dover Publications, Inc.20. A. J. B. TADEU and E. KAUSEL 2000 Journal of Engineering Mechanics, American Society of Civil
Engineers 126, 1093}1097. Green's functions for two-and-a-half dimensional elastodynamic problems.21. H. A. PEDERSEN, F. J. SAD NCHEZ-SESMA and M. CAMPILLO 1994 Bulletin of the Seismological
Society of America 84, 1169}1183. Three-dimensional scattering by two-dimensionaltopographies.
22. A. S. PAPAGEORGIOU and D. PEI 1998 Earthquake Engineering and Structural Dynamics 27,619}638. A discrete wavenumber boundary element method for study of 3-D response of 2-Dscatterers.
23. H. LAMB 1904 Philosophical ¹ransactions of the Royal Society of ¸ondon A 203, 1}42. On thepropagation of tremors at the surface of an elastic solid.
24. M. BOUCHON 1979 Journal of Geophysical Research 84, 3609}3614. Discrete wave numberrepresentation of elastic wave "elds in three-space dimensions.
25. J. KIM and A. S. PAPAGEORGIOU 1993 Journal of Engineering Mechanics, American Society of CivilEngineers 119, 603}624. Discrete wavenumber boundary elementmethod for 3-D scattering problems.
26. M. BOUCHON, and K. AKI 1977 International Journal of Numerical Methods in Engineering 26,1709}1728. Time-domain transient elastodynamic analysis of 3D solids by BEM.
27. E. KAUSEL 1992 Journal of Engineering Mechanics, American Society of Civil Engineers 118,121}734. Frequency domain analysis of undamped systems.
28. I. S. GRADSHTEYN and I. M. RYZHIK 1980 ¹ables of Integrals, Series, and Products. New York:Academic Press.
APPENDIX A: THE GREEN FUNCTIONS FOR A TWO-AND-A-HALF-DIMENSIONALFULL SPACE
A.1. SOLID FORMATION
Consider an in"nite, homogeneous space subjected at point (x�, y
�) to a spatially varying
line load of the form p (x, y, z, t)"� (x!x�)� (y!y
�) ei���k
�� acting in one of the three

ACOUSTIC INSULATION OF SINGLE PANEL WALLS 473
co-ordinate directions. Here, � (x) and � (y) are Dirac-delta functions, � is the frequency ofthe load and k
�is the wavenumber in z (see Figure 1(a)). The response to this load can be
calculated by applying a spatial Fourier transform in the z direction to the Helmholtzequations for a point load (see, e.g., reference [28]).After some mathematical manipulations, a "nal set of the Green functions can be
expressed in terms of the compressional and rotational potentials. These functions can bewritten as a summation if an in"nite number of virtual sources are distributed along thex direction, at equal intervals ¸
�. In the case of a sinusoidal harmonic line load along the
z direction, acting in the direction of the y-axis, a "nal set of the Green functions can beexpressed in terms of the compressional and rotational potentials, ��, ��
�, ��
�and ��
�, from
which the following three components of displacement can be calculated (G��in direction
i due to a load applied in direction j )
G���
"G���
"E�
��� �
���
[!i sgn (y!y�)k
�E�#i sgn (y!y
�)k
�E�]E
�,
G���
"E�
��� �
��� �!i�
�E�#�
i����
��E�� E
�,
G���
"E�
��� �
���
[!i sgn (y!y�) k
�E
�#i sgn (y!y
�)k
�E
�]E
�, (A.1)
whereE�"1/(2���¸
�),E
�"e!i�
�y!y
�, E
�"e!i
�y!y
�, E
�"e!ik
�(x!x
�), �
��"�!k�
�!k�
�,
��"�k�
�!k�
�!k�
�and (Im(�
�))0),
�"�k�
�!k�
�!k�
�, with (Im(
�))0), k
�"(2�/¸
�)n,
k�"�/�, k
�"�/, �"�(�#2�)/� and "��/� are the speeds for P (pressure)
waves and S (shear) waves, respectively, � and � are the LameH constants, and � is themass density.Readers can "nd the complete derivation of these equations in references [16, 20].
A.2. FLUID FORMATION
The Green functions for a sinusoidal pressure line load applied at the point (x�, y
�), in
a #uid formation, can be obtained using a process similar to that described above, leading tothe expressions
G���
"!
1
¸�
��� �
��� ��
!���
�����k�
���
E��E�
,
G���
"!
1
¸�
��� �
��� ��
!���
����� sgn (y!y
�)E
��E�,
G���
"!
1
¸�
��� �
��� ��
!���
�����k�
���
E�� E
�, (A.2)
in which E�"e!ik
�(x!x
�), k
�"(2�/¸
�)n, ��
�"�k�p
�!k�
�!k�
�with (Im(��
�))0), kp
�"�/�
�,
��"��
�/�
�is the acoustic (dilatational) wave speed of the #uid, �
�is the #uid LameH
474 A. TADEU AND J. M. P. ANTOD NIO
constant, ��is the mass density of the #uid, E
�"e!i��
�y!y
� , ��
�"�k�p
�!k�
�!k�
�with
(Im(���))0), kp
�"�/�
�.
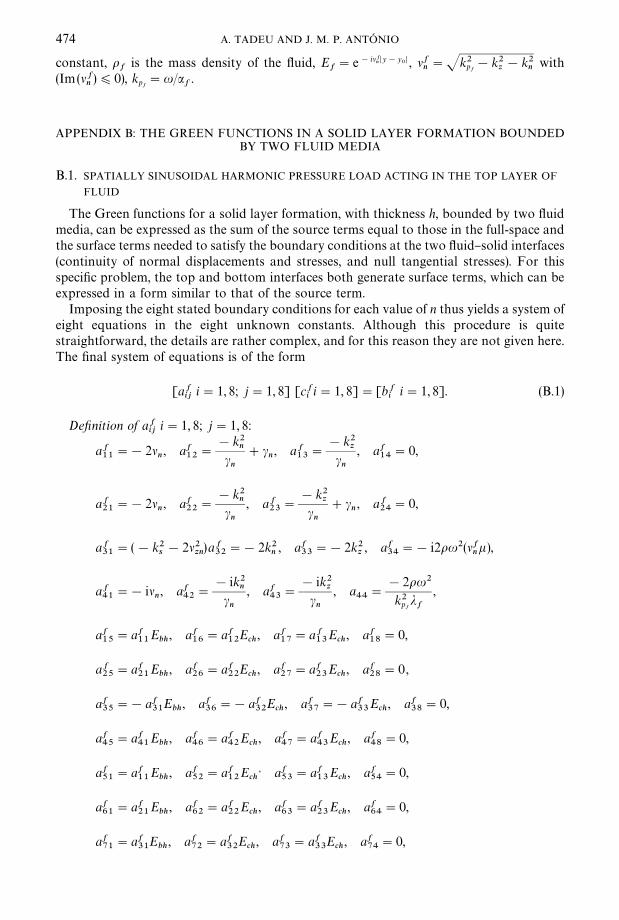
APPENDIX B: THE GREEN FUNCTIONS IN A SOLID LAYER FORMATION BOUNDEDBY TWO FLUID MEDIA
B.1. SPATIALLY SINUSOIDAL HARMONIC PRESSURE LOAD ACTING IN THE TOP LAYER OF
FLUID
The Green functions for a solid layer formation, with thickness h, bounded by two #uidmedia, can be expressed as the sum of the source terms equal to those in the full-space andthe surface terms needed to satisfy the boundary conditions at the two #uid}solid interfaces(continuity of normal displacements and stresses, and null tangential stresses). For thisspeci"c problem, the top and bottom interfaces both generate surface terms, which can beexpressed in a form similar to that of the source term.Imposing the eight stated boundary conditions for each value of n thus yields a system of
eight equations in the eight unknown constants. Although this procedure is quitestraightforward, the details are rather complex, and for this reason they are not given here.The "nal system of equations is of the form
[a���i"1, 8; j"1, 8] [c�
�i"1, 8]"[b�
�i"1, 8]. (B.1)
De,nition of a���i"1, 8; j"1, 8:
a���
"!2��, a�
��"
!k��
�
# �, a�
��"
!k��
�
, a���
"0,
a���
"!2��, a�
��"
!k��
�
, a���
"
!k��
�
# �, a�
��"0,
a���
"(!k��!2��
��)a�
��"!2k�
�, a�
��"!2k�
�, a�
��"!i2���(��
�� ),
a���
"!i��, a�
��"
!ik��
�
, a���
"
!ik��
�
, a��
"
!2���
k�p���
,
a���
"a���
E��, a�
� "a�
��E��, a�
��"a�
��E��, a�
��"0,
a���
"a���
E��, a�
� "a�
��E��, a�
��"a�
��E��, a�
��"0,
a���
"!a���E
��, a�
� "!a�
��E��, a�
��"!a�
��E��, a�
��"0,
a���
"a���
E��, a�
� "a�
��E
��, a�
��"a�
��E��, a�
��"0,
a���
"a���
E��, a�
��"a�
��E
��� a�
��"a�
��E��, a�
��"0,
a� �
"a���
E��, a�
�"a�
��E
��, a�
�"a�
��E��, a�
�"0,
a���
"a���E
��, a�
��"a�
��E��, a�
��"a�
��E��, a�
��"0,

ACOUSTIC INSULATION OF SINGLE PANEL WALLS 475
a���
"a���E
��, a�
��"a�
��E��, a�
��"a�
��E��, a�
��"0,
a���
"a���, a�
� "a�
��, a�
��"a�
��, a�
��"0,
a� �
"a���, a�
"a�
��, a�
�"a�
��, a�
�"0,
a���
"!a���, a�
� "!a�
��, a�
��"!a�
��, a�
��"a�
��,
a���
"a���, a�
� "a�
��, a�
��"a�
��, a�
��"!a�
��.
De,nition of c��i"1, 8:
c��"A�
�, c�
�"B�
�, c�
�"C�
�, c�
�"D�
�,
c��"E�
�, c�
"F�
�, c�
�"G�
�, c�
�"H�
�.
De,nition of b��i"1, 8:
b��"0, b�
�"0,
b��"
!i2���
����
E��, b�
�"
2���
k�p���
E��,
b��"0, b�
"0.
b��"0, b�
�"0
with E��
"e!i��y� , E
��"e!i
�y� , �
��"�!k�
�!k�
�, E
��"e!i��
�y� , E
��"e!i�
�h,
E��
"e!i �h .
Note that, if k�"0 is used, the system of equations derived above is reduced to six
unknowns, leading to the two-dimensional Green function for plane strain line loads.The reader can "nd a detailed derivation of these equations in reference [17].