acoustics for violin and guitar makers · pdf filejansson: akustik för fiol- och...
TRANSCRIPT
Dept of Speech, Music and Hearing
ACOUSTICS FOR
VIOLIN AND GUITAR
MAKERS
ERIK JANSSON
Chapter VII:
The Function of the Violin
Fourth edition 2002 http://www.speech.kth.se/music/acviguit4/part7.pdf
Index of chapters Preface/Chapter I Sound and hearing
Chapter II Resonance and resonators
Chapter III Sound and the room
Chapter IV Properties of the violin and guitar string
Chapter V Vibration properties of the wood and tuning of violin plates
Chapter VI The function, tone, and tonal quality of the guitar
Chapter VII The function of the violin
Chapter VIII The tone and tonal quality of the violin
Chapter IX Sound examples and simple experimental material – under preparation
Webpage: http://www.speech.kth.se/music/acviguit4/index.html
Jansson: Akustik för fiol- och gitarrbyggare sid 7.2
ACOUSTICS FOR VIOLIN AND GUITAR MAKERS Chapter 7. - Applied acoustics THE FUNCTION OF THE VIOLIN Part 1: PROPERTIES BUILT INTO THE VIOLIN
7.1. Construction of the violin
7.2. Resonances of the complete violin body
7.3. Resonances of the free top plate, the free back plate and the asembled body
7.4. Summary
7.5. Key words
Part 2: INFLUENCE OF DIFFERENT PARTS
7.6. The sound post
7.7. The bridge and the varnish
7.8. Vibration sensitivity and radiated sound
7.9. Summary
7.10. Key words
Jansson: Akustik för fiol- och gitarrbyggare sid 7.3
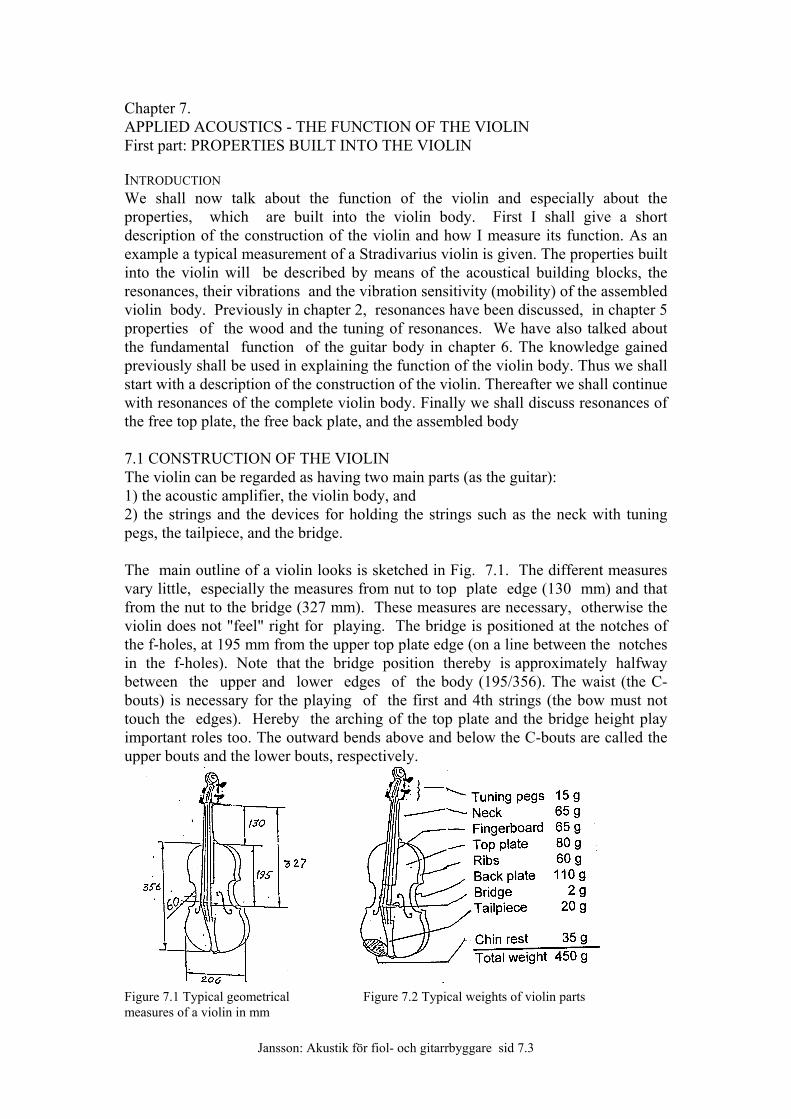
Chapter 7. APPLIED ACOUSTICS - THE FUNCTION OF THE VIOLIN First part: PROPERTIES BUILT INTO THE VIOLIN INTRODUCTION We shall now talk about the function of the violin and especially about the properties, which are built into the violin body. First I shall give a short description of the construction of the violin and how I measure its function. As an example a typical measurement of a Stradivarius violin is given. The properties built into the violin will be described by means of the acoustical building blocks, the resonances, their vibrations and the vibration sensitivity (mobility) of the assembled violin body. Previously in chapter 2, resonances have been discussed, in chapter 5 properties of the wood and the tuning of resonances. We have also talked about the fundamental function of the guitar body in chapter 6. The knowledge gained previously shall be used in explaining the function of the violin body. Thus we shall start with a description of the construction of the violin. Thereafter we shall continue with resonances of the complete violin body. Finally we shall discuss resonances of the free top plate, the free back plate, and the assembled body 7.1 CONSTRUCTION OF THE VIOLIN The violin can be regarded as having two main parts (as the guitar): 1) the acoustic amplifier, the violin body, and 2) the strings and the devices for holding the strings such as the neck with tuning pegs, the tailpiece, and the bridge. The main outline of a violin looks is sketched in Fig. 7.1. The different measures vary little, especially the measures from nut to top plate edge (130 mm) and that from the nut to the bridge (327 mm). These measures are necessary, otherwise the violin does not "feel" right for playing. The bridge is positioned at the notches of the f-holes, at 195 mm from the upper top plate edge (on a line between the notches in the f-holes). Note that the bridge position thereby is approximately halfway between the upper and lower edges of the body (195/356). The waist (the C-bouts) is necessary for the playing of the first and 4th strings (the bow must not touch the edges). Hereby the arching of the top plate and the bridge height play important roles too. The outward bends above and below the C-bouts are called the upper bouts and the lower bouts, respectively.
Figure 7.1 Typical geometrical Figure 7.2 Typical weights of violin parts measures of a violin in mm
Jansson: Akustik för fiol- och gitarrbyggare sid 7.4
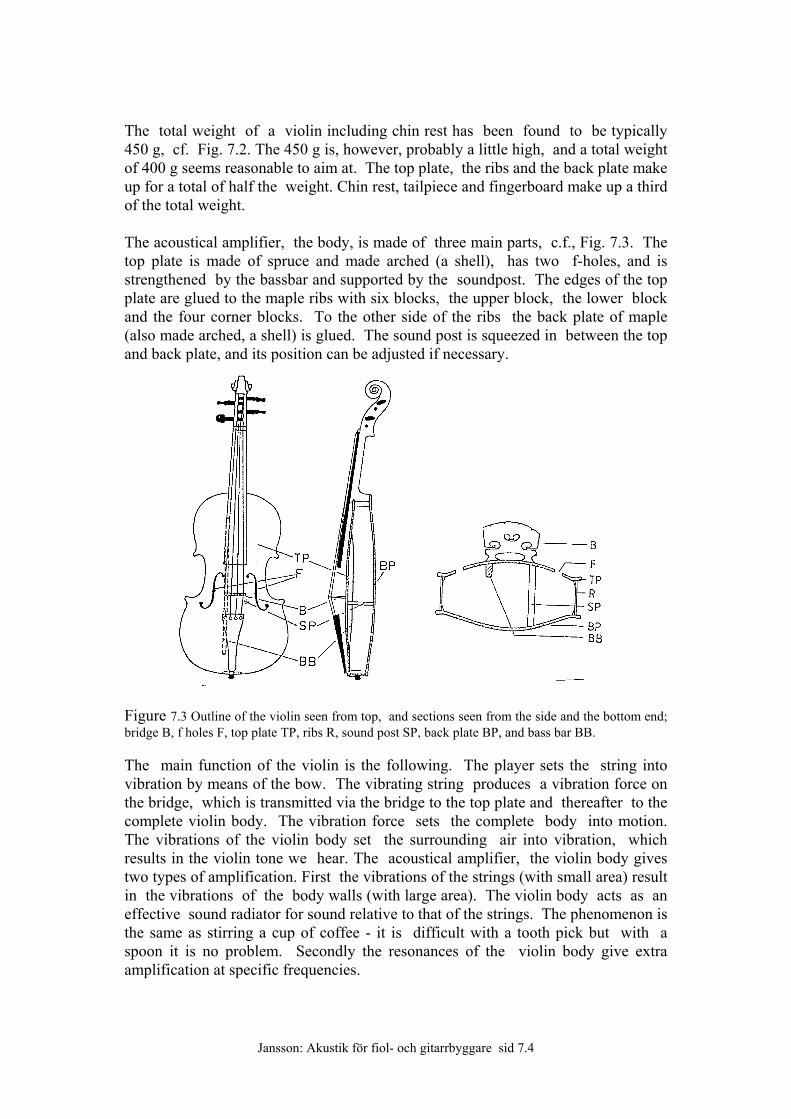
The total weight of a violin including chin rest has been found to be typically 450 g, cf. Fig. 7.2. The 450 g is, however, probably a little high, and a total weight of 400 g seems reasonable to aim at. The top plate, the ribs and the back plate make up for a total of half the weight. Chin rest, tailpiece and fingerboard make up a third of the total weight. The acoustical amplifier, the body, is made of three main parts, c.f., Fig. 7.3. The top plate is made of spruce and made arched (a shell), has two f-holes, and is strengthened by the bassbar and supported by the soundpost. The edges of the top plate are glued to the maple ribs with six blocks, the upper block, the lower block and the four corner blocks. To the other side of the ribs the back plate of maple (also made arched, a shell) is glued. The sound post is squeezed in between the top and back plate, and its position can be adjusted if necessary.
Figure 7.3 Outline of the violin seen from top, and sections seen from the side and the bottom end; bridge B, f holes F, top plate TP, ribs R, sound post SP, back plate BP, and bass bar BB. The main function of the violin is the following. The player sets the string into vibration by means of the bow. The vibrating string produces a vibration force on the bridge, which is transmitted via the bridge to the top plate and thereafter to the complete violin body. The vibration force sets the complete body into motion. The vibrations of the violin body set the surrounding air into vibration, which results in the violin tone we hear. The acoustical amplifier, the violin body gives two types of amplification. First the vibrations of the strings (with small area) result in the vibrations of the body walls (with large area). The violin body acts as an effective sound radiator for sound relative to that of the strings. The phenomenon is the same as stirring a cup of coffee - it is difficult with a tooth pick but with a spoon it is no problem. Secondly the resonances of the violin body give extra amplification at specific frequencies.
Jansson: Akustik för fiol- och gitarrbyggare sid 7.5
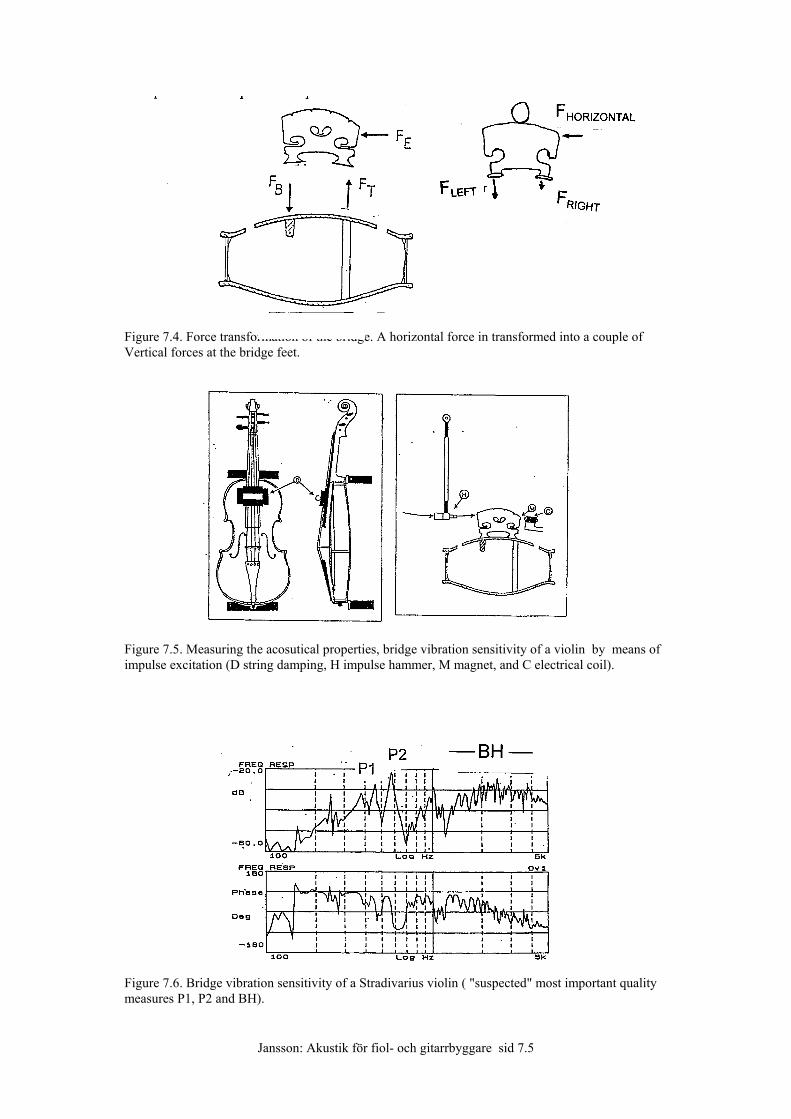
Figure 7.4. Force transformation of the bridge. A horizontal force in transformed into a couple of Vertical forces at the bridge feet.
Figure 7.5. Measuring the acosutical properties, bridge vibration sensitivity of a violin by means of impulse excitation (D string damping, H impulse hammer, M magnet, and C electrical coil).
Figure 7.6. Bridge vibration sensitivity of a Stradivarius violin ( "suspected" most important quality measures P1, P2 and BH).
Jansson: Akustik för fiol- och gitarrbyggare sid 7.6
A Stradivarius violin is generally assumed to be the best when it comes to violin quality. A natural question arises: How does a Stradivarius violin look acosutically? What is it that gives the acoustical quality? How can one make a similar violin? We shall work step by step trying to find answers to these questions. To find the answer to the first question the acoustical properties of a Stradivarius violin must be measured. The measurents must give a meaningful frequency response without any danger for the violin. Just to hold an art-object (and utility article) like a violin insured for several millions of Swedish crowns can make you nervous. At our department we have developed the following method of measurements which meets the demands, see fig. 7.5. 1) The violin is placed horisontally on top of two feltcovered supports. The
supporting points are in a plane and the “lower supporting” approaches the supporting in playing.
2) The resonant vibrations of the strings are damped to avoid extra complications (in the last version damp wedges of rubber between neighboring strings are used except for the A- and E-string damped by cloth against the fingerboard). In the soundproduction chain from string vibrations via bridge vibrations, body vibrations and sounding tone it is only the bridge that offers a meaningful and easily available measurement point. The bridge is furthermore a part frequently replaced.
3) A small ”supermagnet 3/100 g is waxed at the bridge corner and the bridge vibrations (velocity) generates a voltage in a small electrical coil at 1.5 mm distance. The bridge (and the violin resonances) are excited by a small impulse force hammer in a pendulum arragement. By using a mechnanical impulse problems with electrical disturbances at the coil are avoided.The hammer has a built-in force tranducer.
How does a Stradivarius violin look acoustically? Well, as the vibration sensitivity curve in fig. 7.6. The upper frame shows the level curve (i.e. vibrations divided by driving force) at each frequency and the lower frame shows the phase (the time lag between excitation force and resulting vibrations) also at each frequency. The Stradivarius violin belongs to the Järnåker foundation At the first glance the curves look very complicated and not at all as the ”friendly” curves within ±3dB usually shown for loudspeakers and microphones. From measurerments of other Stradivarius violins we know that the curves are typical. In cooperation with the Järnåker foundation (Dr. John Huber) we have been able to measure the vibration sensitivity of about 25 violins of soloist quality. From the measurements of these violins we have found three properties as ”suspected” for quality in the first approximation, see fig. 7.6. These are the peaks P1, P2 and the ”Bridge Hill” BH. P1 is between 400 and 500 Hz, P2 beween 500 and 600 Hz and the BH, here a gently smoothed (not peaky) hill with a maximum between 2 and 3 kHz. The Stradivarius violin has also a peak at about 1 kHz not included in our first set of suspected quality parameters. The level of the P2 peak is higher than the P1 peak. The BH maximum is level with the P1 peak. At P1 and P2 there are large and clear phase changes. At the BH maximum there is a smooth phase change (not a step) but still close to 180 degrees. Our working hypothesis is that P1, P2 and the BH are the main parameters to determine the quality of a violin (in technical terms we are measuring mobility, which will show single resonances effectively).
Jansson: Akustik för fiol- och gitarrbyggare sid 7.7
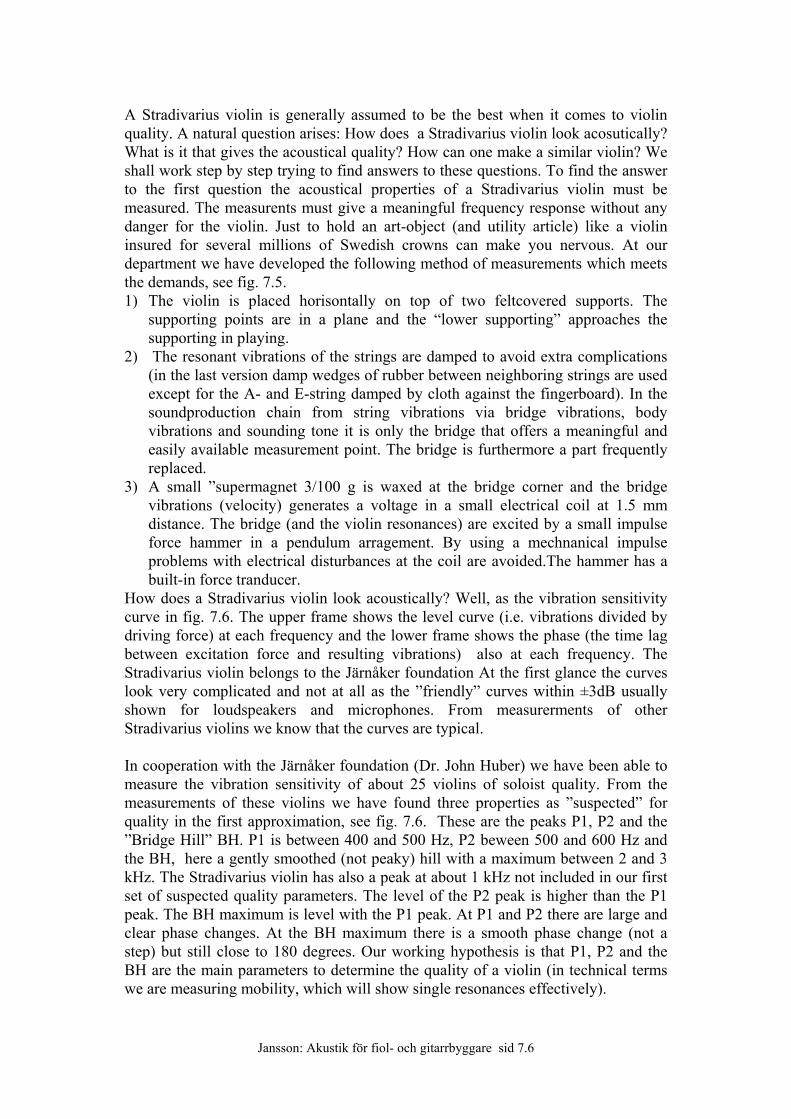
Figure 7.7. Top plate vibrations at the fundamental resonance of a violin photographed by means of hologram interferometry (rigidly clamped at upper corner blocks and chin rest, from Jansson, Molin and Sundin). 7.2 RESONANCES OF THE COMPLETE VIOLIN BODY The violin body works somewhat differently than the guitar body but has still the same fundamental function. The top-plate vibrations at the fundamental resonance of a violin clamped at three points are shown in Fig. 7.7. The figure shows three major effects: 1. The vibrations dominate in the left part, i.e., on the bass bar side and close to the bridge foot at the bass bar side. 2. The soundpost acts as a support and gives a nodal line in the top plate at the nearby bridge foot. 3. The vibrations have maximum amplitude (antinode) at the edge of the left f-hole, i.e., the f-hole efficiently cuts a part of the top plate free from its edges.
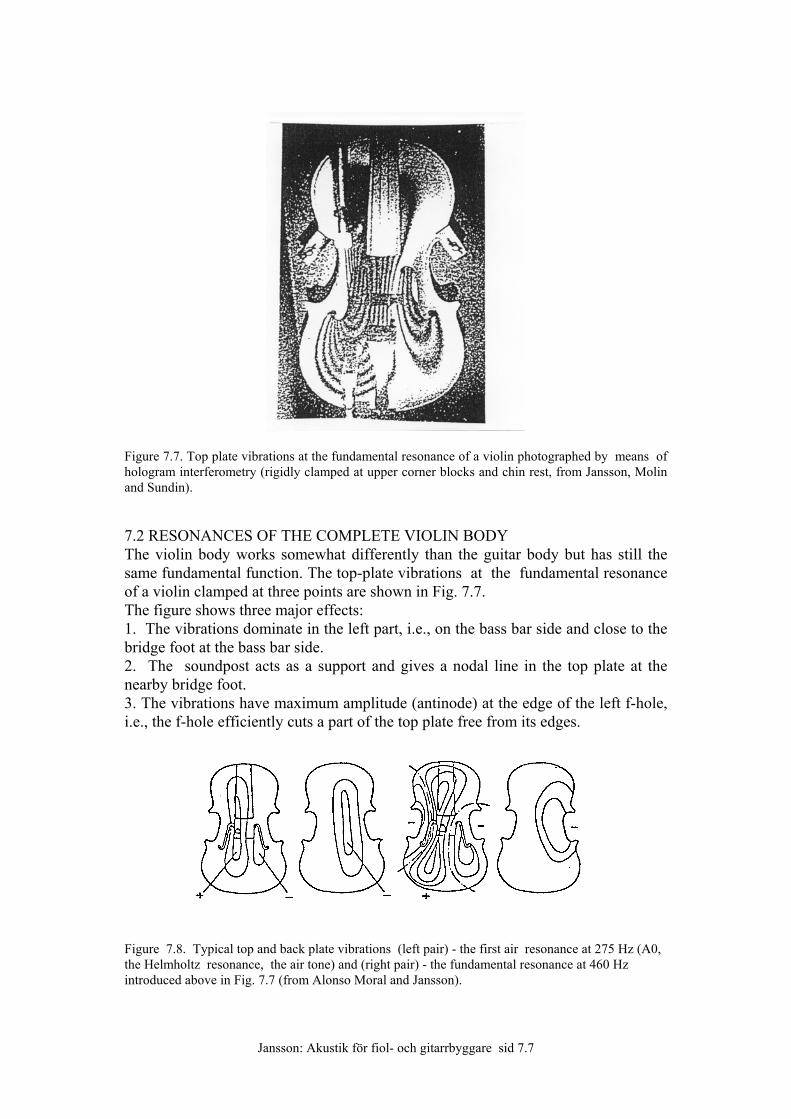
Figure 7.8. Typical top and back plate vibrations (left pair) - the first air resonance at 275 Hz (A0, the Helmholtz resonance, the air tone) and (right pair) - the fundamental resonance at 460 Hz introduced above in Fig. 7.7 (from Alonso Moral and Jansson).
Jansson: Akustik för fiol- och gitarrbyggare sid 7.8
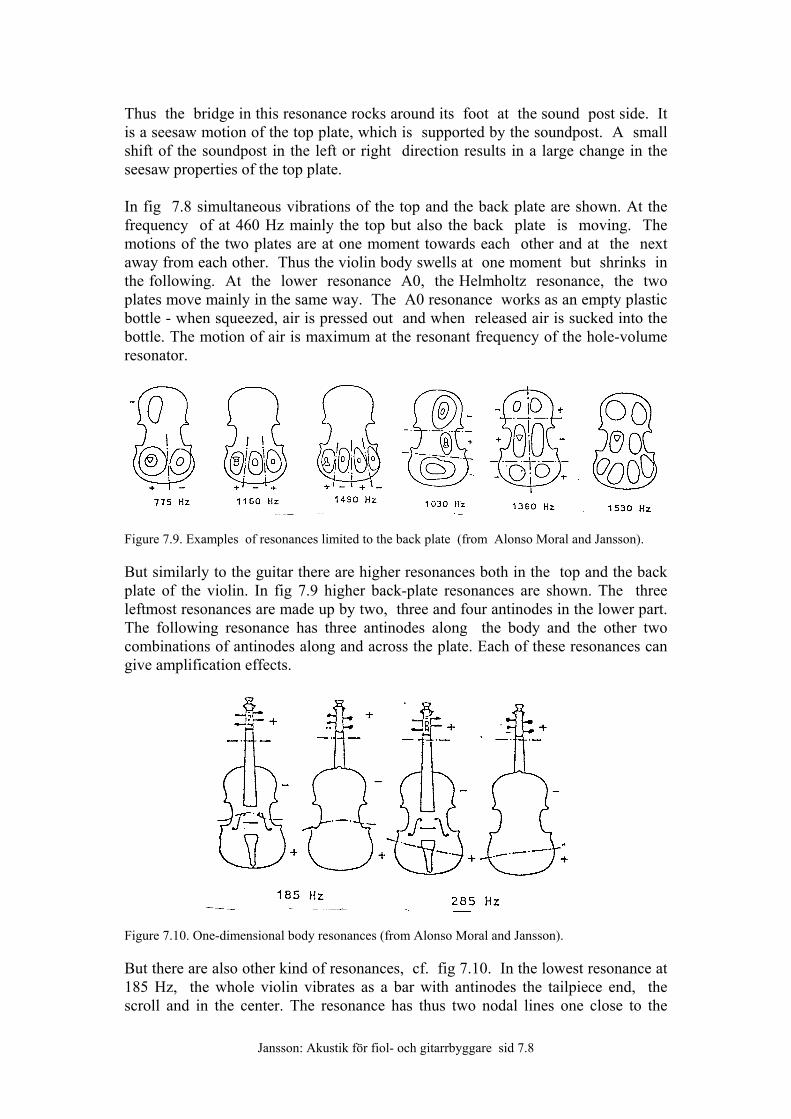
Thus the bridge in this resonance rocks around its foot at the sound post side. It is a seesaw motion of the top plate, which is supported by the soundpost. A small shift of the soundpost in the left or right direction results in a large change in the seesaw properties of the top plate. In fig 7.8 simultaneous vibrations of the top and the back plate are shown. At the frequency of at 460 Hz mainly the top but also the back plate is moving. The motions of the two plates are at one moment towards each other and at the next away from each other. Thus the violin body swells at one moment but shrinks in the following. At the lower resonance A0, the Helmholtz resonance, the two plates move mainly in the same way. The A0 resonance works as an empty plastic bottle - when squeezed, air is pressed out and when released air is sucked into the bottle. The motion of air is maximum at the resonant frequency of the hole-volume resonator.
Figure 7.9. Examples of resonances limited to the back plate (from Alonso Moral and Jansson). But similarly to the guitar there are higher resonances both in the top and the back plate of the violin. In fig 7.9 higher back-plate resonances are shown. The three leftmost resonances are made up by two, three and four antinodes in the lower part. The following resonance has three antinodes along the body and the other two combinations of antinodes along and across the plate. Each of these resonances can give amplification effects.
Figure 7.10. One-dimensional body resonances (from Alonso Moral and Jansson). But there are also other kind of resonances, cf. fig 7.10. In the lowest resonance at 185 Hz, the whole violin vibrates as a bar with antinodes the tailpiece end, the scroll and in the center. The resonance has thus two nodal lines one close to the
Jansson: Akustik för fiol- och gitarrbyggare sid 7.9
bridge and another one in the upper part of the neck. In a following resonance at 285 Hz the violin was found to work in a similar way, but now the neck with the finger board are the main vibrating parts. Modal analysis has shown that there is an additional nodal line in the position of the upper block for this resonance. There are further resonances in which the top and back plates move as a unit, as the upper and lower sides of a thick plate but presently the author regards these as of second order importance and has chosen to omit these.
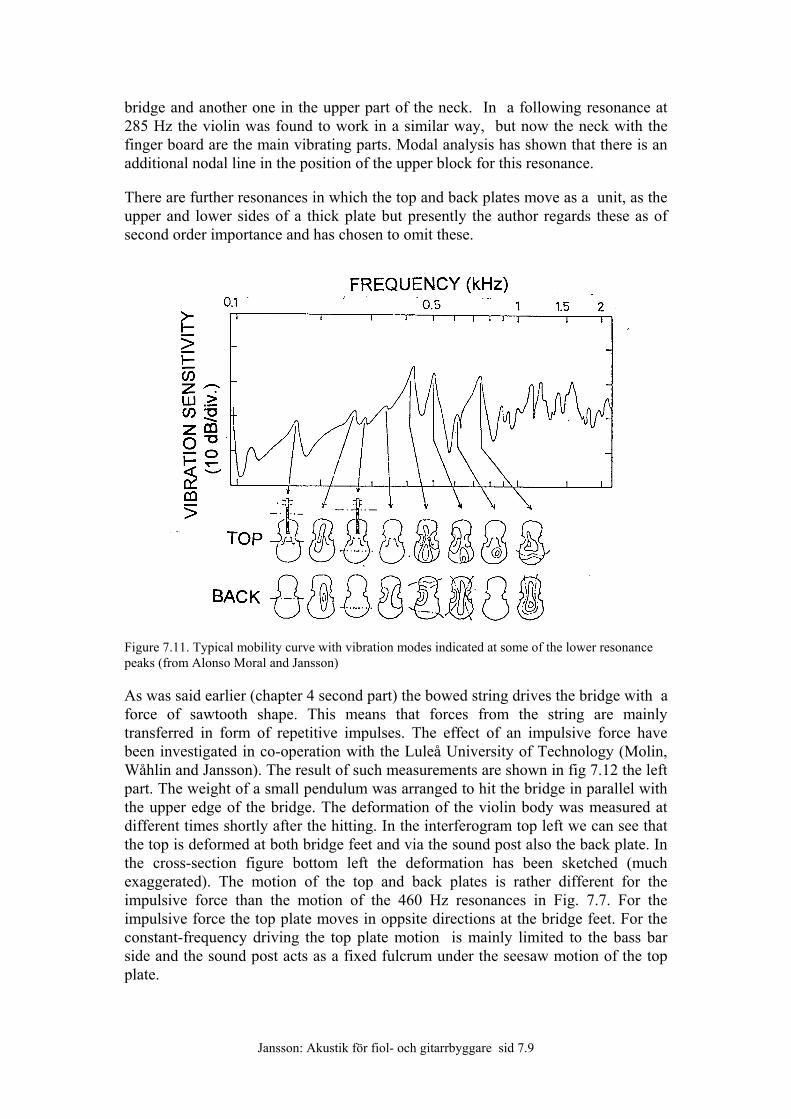
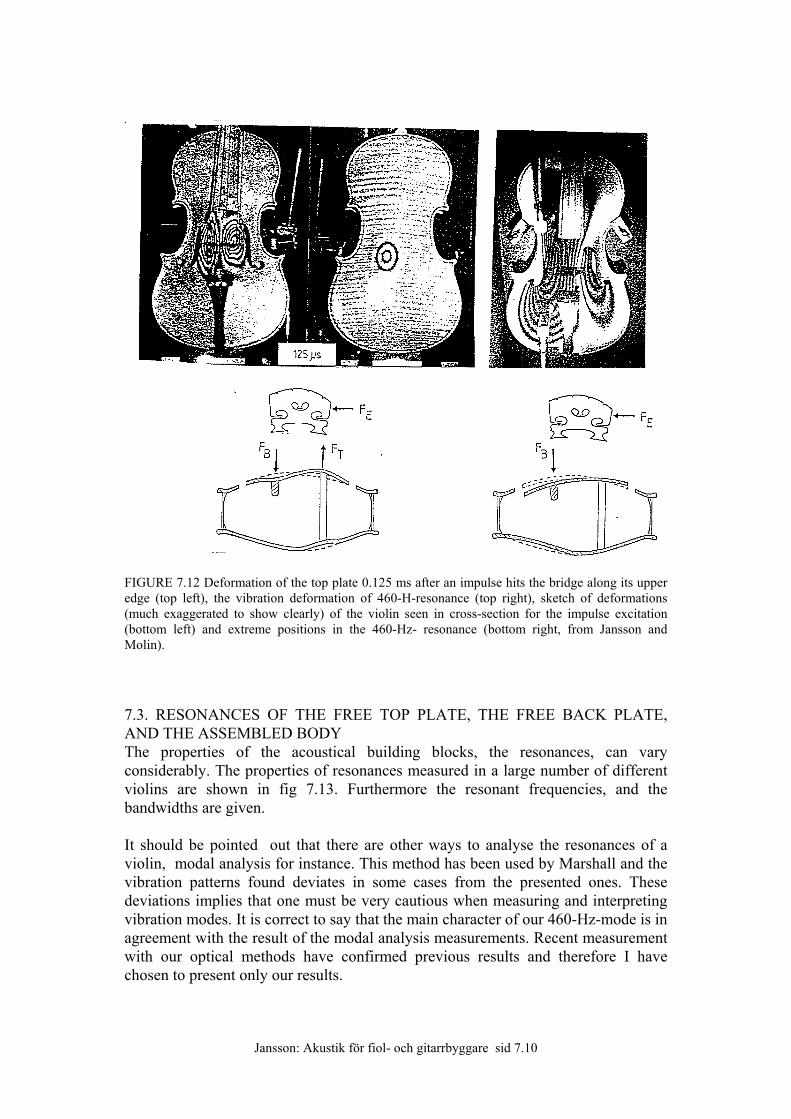
Figure 7.11. Typical mobility curve with vibration modes indicated at some of the lower resonance peaks (from Alonso Moral and Jansson) As was said earlier (chapter 4 second part) the bowed string drives the bridge with a force of sawtooth shape. This means that forces from the string are mainly transferred in form of repetitive impulses. The effect of an impulsive force have been investigated in co-operation with the Luleå University of Technology (Molin, Wåhlin and Jansson). The result of such measurements are shown in fig 7.12 the left part. The weight of a small pendulum was arranged to hit the bridge in parallel with the upper edge of the bridge. The deformation of the violin body was measured at different times shortly after the hitting. In the interferogram top left we can see that the top is deformed at both bridge feet and via the sound post also the back plate. In the cross-section figure bottom left the deformation has been sketched (much exaggerated). The motion of the top and back plates is rather different for the impulsive force than the motion of the 460 Hz resonances in Fig. 7.7. For the impulsive force the top plate moves in oppsite directions at the bridge feet. For the constant-frequency driving the top plate motion is mainly limited to the bass bar side and the sound post acts as a fixed fulcrum under the seesaw motion of the top plate.
Jansson: Akustik för fiol- och gitarrbyggare sid 7.10
FIGURE 7.12 Deformation of the top plate 0.125 ms after an impulse hits the bridge along its upper edge (top left), the vibration deformation of 460-H-resonance (top right), sketch of deformations (much exaggerated to show clearly) of the violin seen in cross-section for the impulse excitation (bottom left) and extreme positions in the 460-Hz- resonance (bottom right, from Jansson and Molin). 7.3. RESONANCES OF THE FREE TOP PLATE, THE FREE BACK PLATE, AND THE ASSEMBLED BODY The properties of the acoustical building blocks, the resonances, can vary considerably. The properties of resonances measured in a large number of different violins are shown in fig 7.13. Furthermore the resonant frequencies, and the bandwidths are given. It should be pointed out that there are other ways to analyse the resonances of a violin, modal analysis for instance. This method has been used by Marshall and the vibration patterns found deviates in some cases from the presented ones. These deviations implies that one must be very cautious when measuring and interpreting vibration modes. It is correct to say that the main character of our 460-Hz-mode is in agreement with the result of the modal analysis measurements. Recent measurement with our optical methods have confirmed previous results and therefore I have chosen to present only our results.
Jansson: Akustik för fiol- och gitarrbyggare sid 7.11
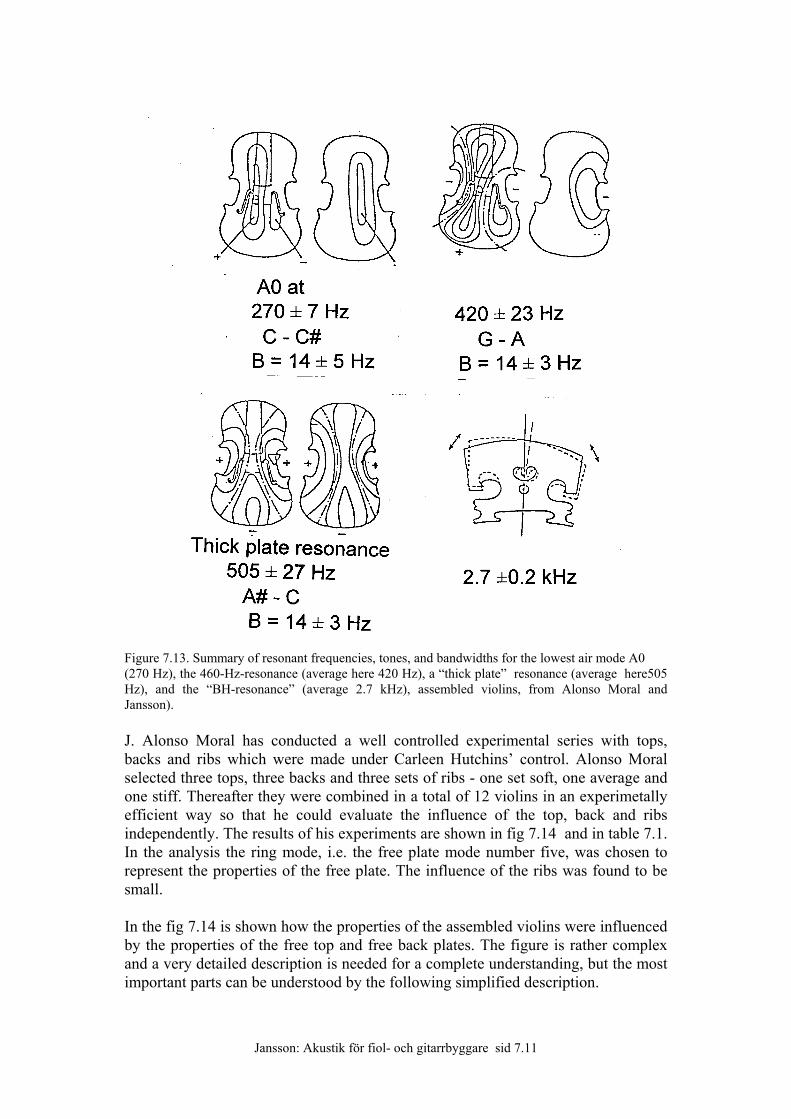
Figure 7.13. Summary of resonant frequencies, tones, and bandwidths for the lowest air mode A0 (270 Hz), the 460-Hz-resonance (average here 420 Hz), a “thick plate” resonance (average here505 Hz), and the “BH-resonance” (average 2.7 kHz), assembled violins, from Alonso Moral and Jansson). J. Alonso Moral has conducted a well controlled experimental series with tops, backs and ribs which were made under Carleen Hutchins’ control. Alonso Moral selected three tops, three backs and three sets of ribs - one set soft, one average and one stiff. Thereafter they were combined in a total of 12 violins in an experimetally efficient way so that he could evaluate the influence of the top, back and ribs independently. The results of his experiments are shown in fig 7.14 and in table 7.1. In the analysis the ring mode, i.e. the free plate mode number five, was chosen to represent the properties of the free plate. The influence of the ribs was found to be small. In the fig 7.14 is shown how the properties of the assembled violins were influenced by the properties of the free top and free back plates. The figure is rather complex and a very detailed description is needed for a complete understanding, but the most important parts can be understood by the following simplified description.
Jansson: Akustik för fiol- och gitarrbyggare sid 7.12
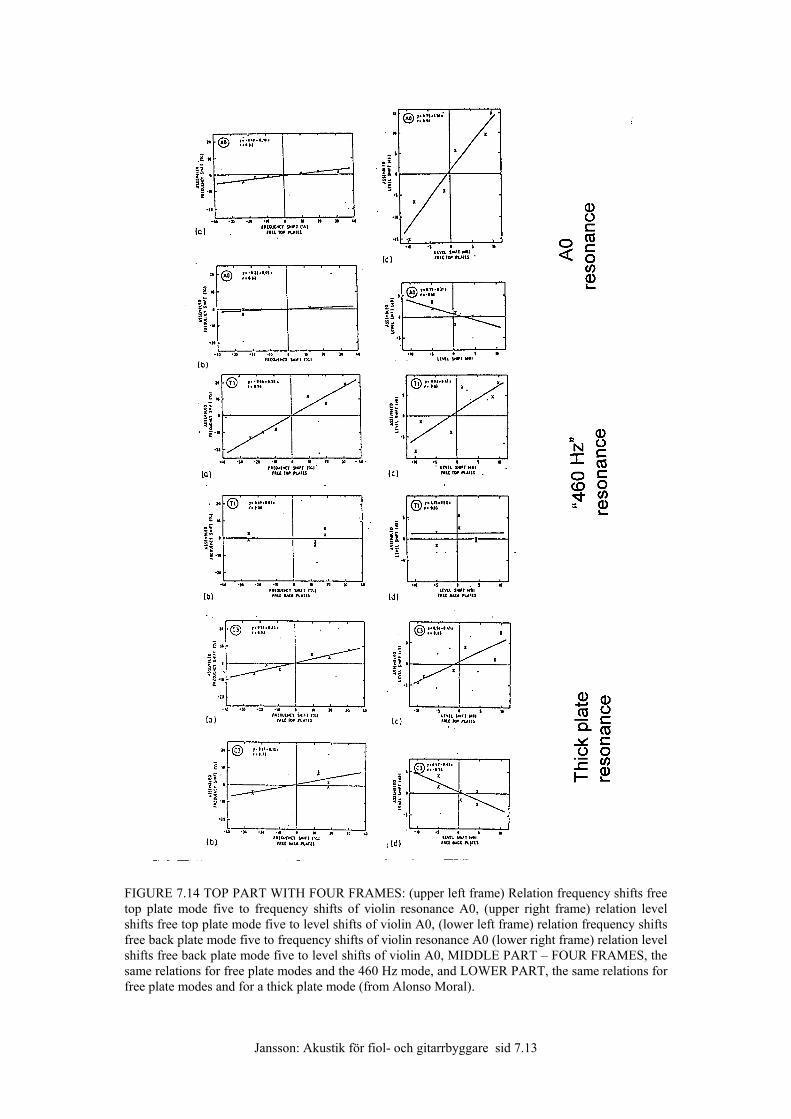
The figure have three parts. Each part contains four frames. In the upper left frame the relation between frequencies of the free top plates (their fifth resonances, the ring modes) and those of the A0 of the assembled violin is plotted. In the upper right frame the relation between levels of the free top plates (their fifth resonances, the ring modes for a specific driving) and those of the A0 of the assembled violin is plotted. In the lower left frame the relation between frequencies of the back top plates (their fifth resonances, the ring modes) and those of the A0 of the assembled violin is plotted. In the lower right frame the relation between levels of the back plates (their fifth resonances, the ring modes at a specific driving) and those of the A0 of the assembled violin is plotted. In the middle part the four frames show the relations between free plate properties and those of the 460 Hz modes and in the lower part the four frames frames show the relations between free plate properties and those of the thick plate mode at 500 Hz. The crosses in Fig. 7.14 mark measurement points and the straight lines show the relation between the assembled violin properties and the free plate properties. If the line is leaning 45o there is a strong dependence. If the line is leaning less or more there is a weaker dependence. A horizontal (or vertical) line means no dependence. The relation between the A0 resonance and the free plate resonances are shown in fig 7.14, top part figure. We see that there is no dependence between the frequencies, the lines are closely horizontal. Between the levels of the free top and the assembled violin A0 there is a strong dependence, the line is leaning close to 45o. This means that a high resonance peak of the free top plate resonance resulted in a high peak for the A0 resonance. For the back plate there is a moderate dependence, i.e. a lower level for the free back plate peak should result in a slightly higher A0 peak.
Jansson: Akustik för fiol- och gitarrbyggare sid 7.13
FIGURE 7.14 TOP PART WITH FOUR FRAMES: (upper left frame) Relation frequency shifts free top plate mode five to frequency shifts of violin resonance A0, (upper right frame) relation level shifts free top plate mode five to level shifts of violin A0, (lower left frame) relation frequency shifts free back plate mode five to frequency shifts of violin resonance A0 (lower right frame) relation level shifts free back plate mode five to level shifts of violin A0, MIDDLE PART – FOUR FRAMES, the same relations for free plate modes and the 460 Hz mode, and LOWER PART, the same relations for free plate modes and for a thick plate mode (from Alonso Moral).
Jansson: Akustik för fiol- och gitarrbyggare sid 7.14
Corresponding analysis for the assembled “460 Hz resonance” showed that it was strongly dependent on the properties of the free top plate, see fig 7.14 middle part. A free top with high mobility level and a high resonance frequency resulted in a high resonance frequency and a high peak level for the assembled “460 Hz resonance”. The back plate did not influence the properties of the assembled “460 Hz. resonance” In the same way it is shown that the resonant frequency of thick plate resonance is weakly dependent on the free top and back plate frequencies, see fig 7.14 lower part. The levels of the free plates influenced the levels of the thick plate resonance peak somewhat more. A higher level of the top plate gave a higher level, while a higher free back plate resonance gave a lower level thick plate resonance peak. TABLE 7.1. The dependence of A0, “460-Hz”, and “Thick plate” on the properties of the free top and back plates otherwise as Fig 7.13 (1 for maximum dependence, large or smaller than 1 less dependence, from Alonso Moral).
RESONANCE TOP Frequency/Level
BACK Frequency/Level
A0� 0/+1.3 � 0/-0.3� “460 Hz”� -0.6/+0.7 � 0/0�
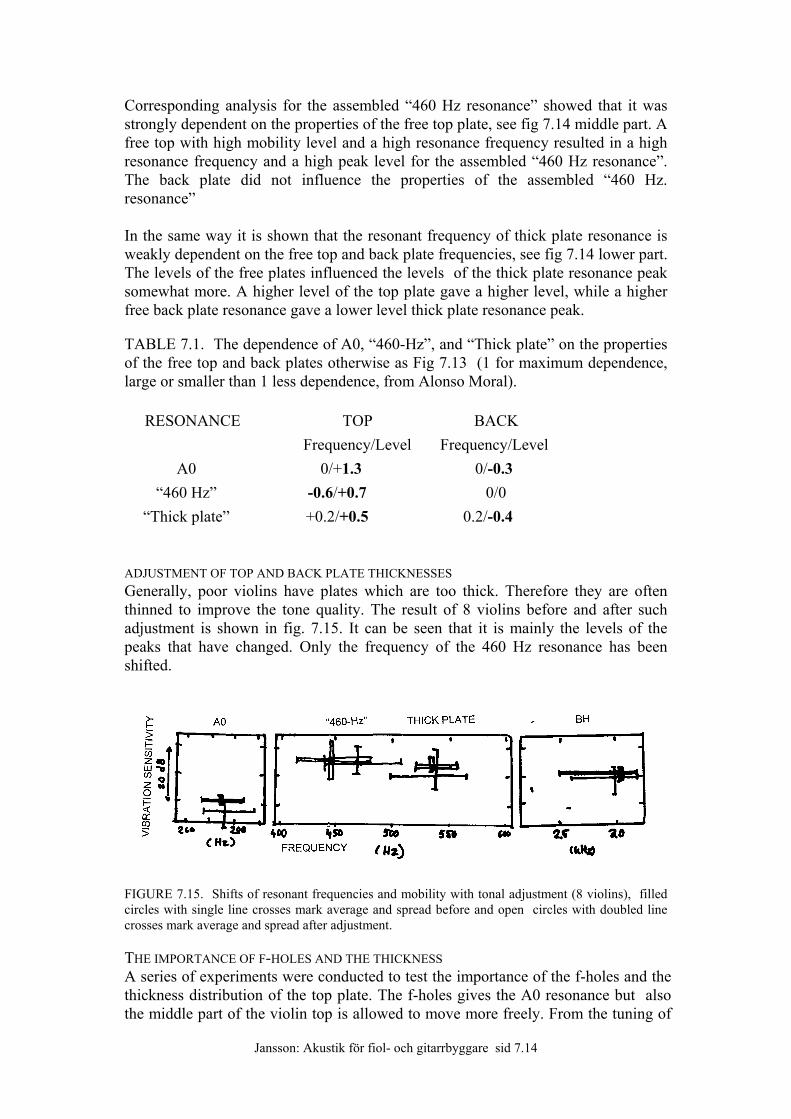
“Thick plate”� +0.2/+0.5 � 0.2/-0.4� ADJUSTMENT OF TOP AND BACK PLATE THICKNESSES Generally, poor violins have plates which are too thick. Therefore they are often thinned to improve the tone quality. The result of 8 violins before and after such adjustment is shown in fig. 7.15. It can be seen that it is mainly the levels of the peaks that have changed. Only the frequency of the 460 Hz resonance has been shifted.
FIGURE 7.15. Shifts of resonant frequencies and mobility with tonal adjustment (8 violins), filled circles with single line crosses mark average and spread before and open circles with doubled line crosses mark average and spread after adjustment. THE IMPORTANCE OF F-HOLES AND THE THICKNESS A series of experiments were conducted to test the importance of the f-holes and the thickness distribution of the top plate. The f-holes gives the A0 resonance but also the middle part of the violin top is allowed to move more freely. From the tuning of
Jansson: Akustik för fiol- och gitarrbyggare sid 7.15
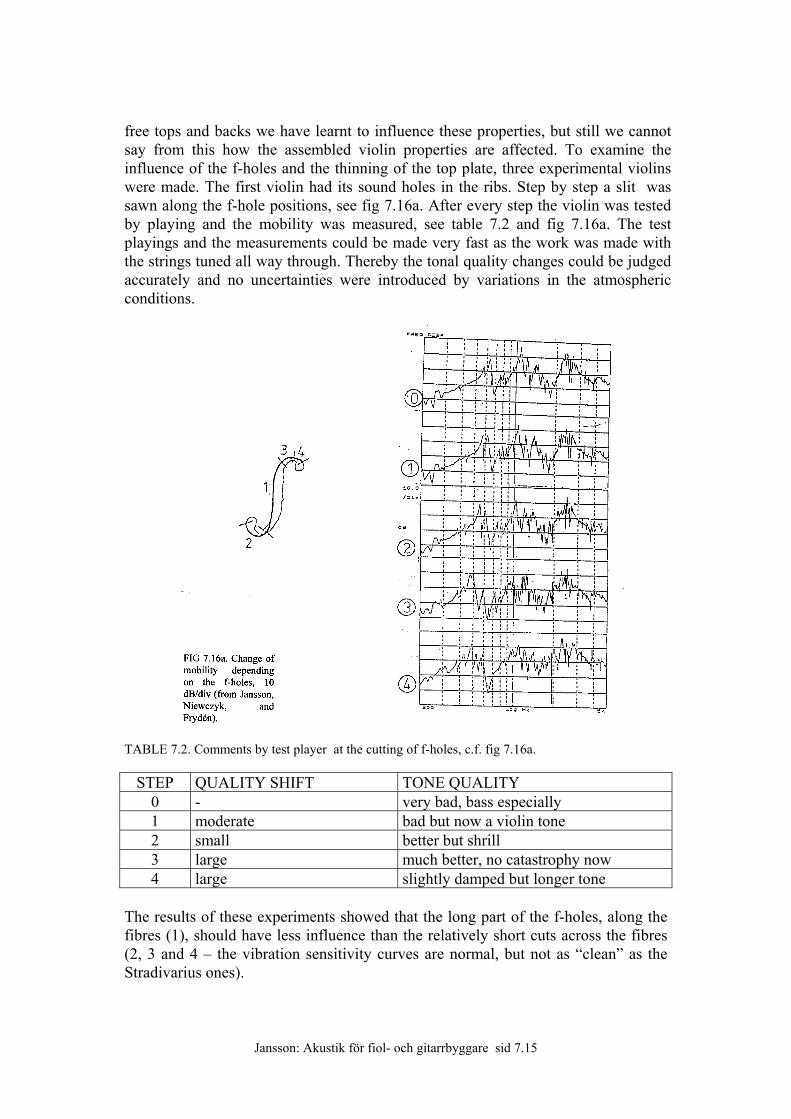
free tops and backs we have learnt to influence these properties, but still we cannot say from this how the assembled violin properties are affected. To examine the influence of the f-holes and the thinning of the top plate, three experimental violins were made. The first violin had its sound holes in the ribs. Step by step a slit was sawn along the f-hole positions, see fig 7.16a. After every step the violin was tested by playing and the mobility was measured, see table 7.2 and fig 7.16a. The test playings and the measurements could be made very fast as the work was made with the strings tuned all way through. Thereby the tonal quality changes could be judged accurately and no uncertainties were introduced by variations in the atmospheric conditions.
TABLE 7.2. Comments by test player at the cutting of f-holes, c.f. fig 7.16a.
STEP QUALITY SHIFT TONE QUALITY 0 - very bad, bass especially 1 moderate bad but now a violin tone 2 small better but shrill 3 large much better, no catastrophy now 4 large slightly damped but longer tone
The results of these experiments showed that the long part of the f-holes, along the fibres (1), should have less influence than the relatively short cuts across the fibres (2, 3 and 4 – the vibration sensitivity curves are normal, but not as “clean” as the Stradivarius ones).
Jansson: Akustik för fiol- och gitarrbyggare sid 7.16
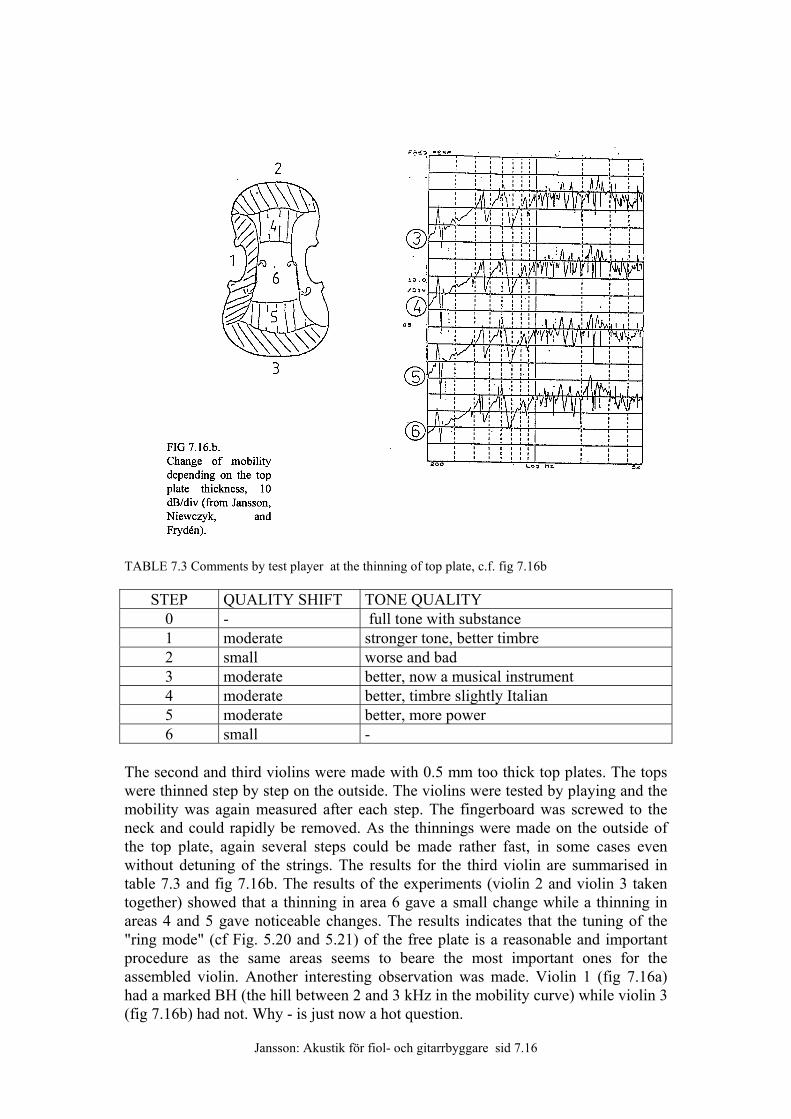
TABLE 7.3 Comments by test player at the thinning of top plate, c.f. fig 7.16b
STEP QUALITY SHIFT TONE QUALITY 0 - full tone with substance 1 moderate stronger tone, better timbre 2 small worse and bad 3 moderate better, now a musical instrument 4 moderate better, timbre slightly Italian 5 moderate better, more power 6 small -
The second and third violins were made with 0.5 mm too thick top plates. The tops were thinned step by step on the outside. The violins were tested by playing and the mobility was again measured after each step. The fingerboard was screwed to the neck and could rapidly be removed. As the thinnings were made on the outside of the top plate, again several steps could be made rather fast, in some cases even without detuning of the strings. The results for the third violin are summarised in table 7.3 and fig 7.16b. The results of the experiments (violin 2 and violin 3 taken together) showed that a thinning in area 6 gave a small change while a thinning in areas 4 and 5 gave noticeable changes. The results indicates that the tuning of the "ring mode" (cf Fig. 5.20 and 5.21) of the free plate is a reasonable and important procedure as the same areas seems to beare the most important ones for the assembled violin. Another interesting observation was made. Violin 1 (fig 7.16a) had a marked BH (the hill between 2 and 3 kHz in the mobility curve) while violin 3 (fig 7.16b) had not. Why - is just now a hot question.
Jansson: Akustik för fiol- och gitarrbyggare sid 7.17
Another interesting observation was made during the experiments. The E- and A-strings were fair in the beginning but the D- and G-strings were awfully bad. After a few steps the G-strings improved. Somewhat later the D-string improved. A few steps more the D-string improved but the G-string became less good. Thus the balance between G- and D-strings indicates when a violin is the best. No change of strings were made. It is believed though that the result is independent of strings.
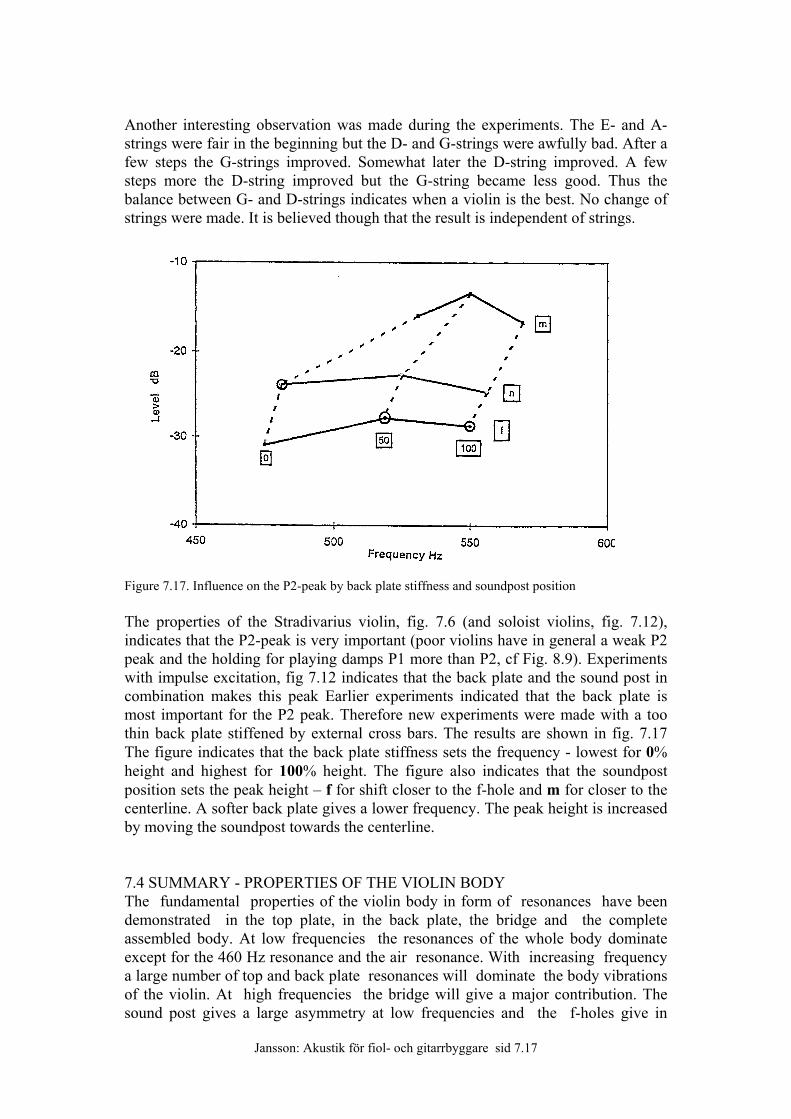
Figure 7.17. Influence on the P2-peak by back plate stiffness and soundpost position The properties of the Stradivarius violin, fig. 7.6 (and soloist violins, fig. 7.12), indicates that the P2-peak is very important (poor violins have in general a weak P2 peak and the holding for playing damps P1 more than P2, cf Fig. 8.9). Experiments with impulse excitation, fig 7.12 indicates that the back plate and the sound post in combination makes this peak Earlier experiments indicated that the back plate is most important for the P2 peak. Therefore new experiments were made with a too thin back plate stiffened by external cross bars. The results are shown in fig. 7.17 The figure indicates that the back plate stiffness sets the frequency - lowest for 0% height and highest for 100% height. The figure also indicates that the soundpost position sets the peak height – f for shift closer to the f-hole and m for closer to the centerline. A softer back plate gives a lower frequency. The peak height is increased by moving the soundpost towards the centerline. 7.4 SUMMARY - PROPERTIES OF THE VIOLIN BODY The fundamental properties of the violin body in form of resonances have been demonstrated in the top plate, in the back plate, the bridge and the complete assembled body. At low frequencies the resonances of the whole body dominate except for the 460 Hz resonance and the air resonance. With increasing frequency a large number of top and back plate resonances will dominate the body vibrations of the violin. At high frequencies the bridge will give a major contribution. The sound post gives a large asymmetry at low frequencies and the f-holes give in
Jansson: Akustik för fiol- och gitarrbyggare sid 7.18
addition to the air tone an effective release of a part of the top plate from the stiffening effects of the ribs at low frequencies. 7.5 KEY WORDS: Top plate resonances, back plate resonances, body resonances and the bridge hill (the BH-peak).
Jansson: Akustik för fiol- och gitarrbyggare sid 7.19
Chapter 7 Second part: INFLUENCE OF DIFFERENT PARTS INTRODUCTION In this part we shall introduce the influence of different parts, We start with the sound post, a very small part but acoustically a most important part. We continue with the bridge resonance and the varnish both their influence acoustically somewhat exaggerated Finally the vibration sensitivity (mobility) and radiated sound of very good violins will be presented.
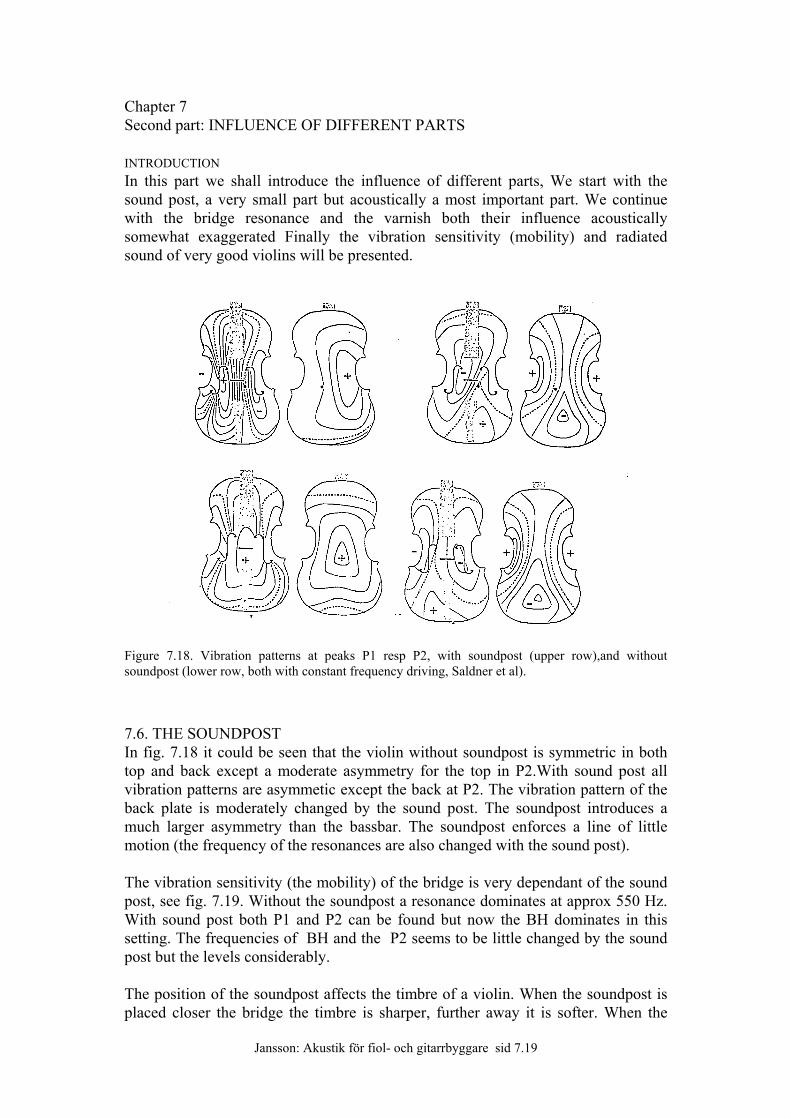
Figure 7.18. Vibration patterns at peaks P1 resp P2, with soundpost (upper row),and without soundpost (lower row, both with constant frequency driving, Saldner et al).
7.6. THE SOUNDPOST In fig. 7.18 it could be seen that the violin without soundpost is symmetric in both top and back except a moderate asymmetry for the top in P2.With sound post all vibration patterns are asymmetic except the back at P2. The vibration pattern of the back plate is moderately changed by the sound post. The soundpost introduces a much larger asymmetry than the bassbar. The soundpost enforces a line of little motion (the frequency of the resonances are also changed with the sound post). The vibration sensitivity (the mobility) of the bridge is very dependant of the sound post, see fig. 7.19. Without the soundpost a resonance dominates at approx 550 Hz. With sound post both P1 and P2 can be found but now the BH dominates in this setting. The frequencies of BH and the P2 seems to be little changed by the sound post but the levels considerably. The position of the soundpost affects the timbre of a violin. When the soundpost is placed closer the bridge the timbre is sharper, further away it is softer. When the
Jansson: Akustik för fiol- och gitarrbyggare sid 7.20
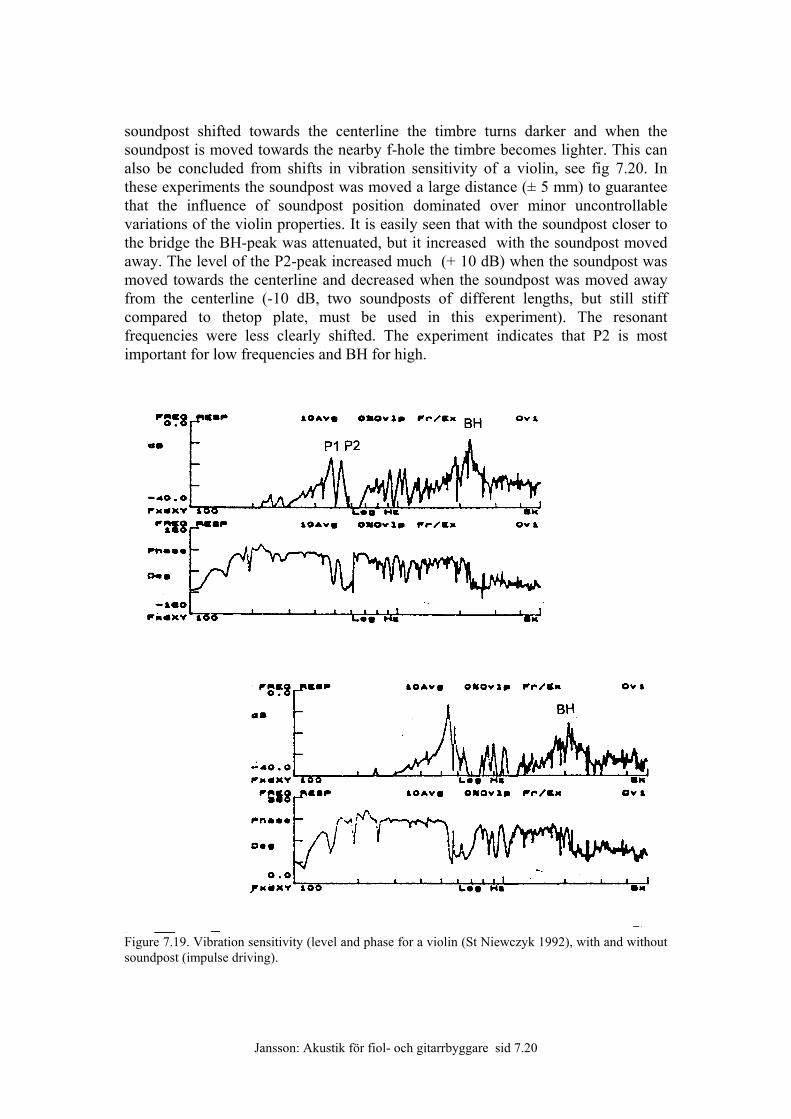
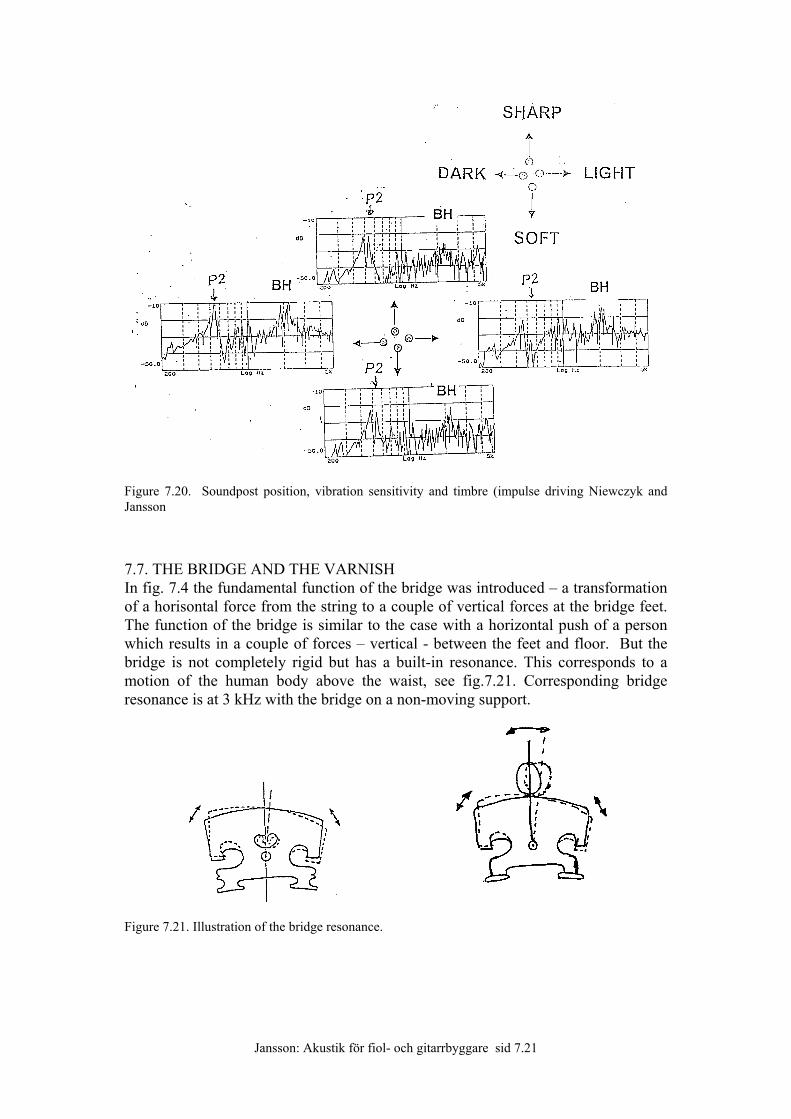
soundpost shifted towards the centerline the timbre turns darker and when the soundpost is moved towards the nearby f-hole the timbre becomes lighter. This can also be concluded from shifts in vibration sensitivity of a violin, see fig 7.20. In these experiments the soundpost was moved a large distance (± 5 mm) to guarantee that the influence of soundpost position dominated over minor uncontrollable variations of the violin properties. It is easily seen that with the soundpost closer to the bridge the BH-peak was attenuated, but it increased with the soundpost moved away. The level of the P2-peak increased much (+ 10 dB) when the soundpost was moved towards the centerline and decreased when the soundpost was moved away from the centerline (-10 dB, two soundposts of different lengths, but still stiff compared to thetop plate, must be used in this experiment). The resonant frequencies were less clearly shifted. The experiment indicates that P2 is most important for low frequencies and BH for high.
Figure 7.19. Vibration sensitivity (level and phase for a violin (St Niewczyk 1992), with and without soundpost (impulse driving).
Jansson: Akustik för fiol- och gitarrbyggare sid 7.21
Figure 7.20. Soundpost position, vibration sensitivity and timbre (impulse driving Niewczyk and Jansson
7.7. THE BRIDGE AND THE VARNISH In fig. 7.4 the fundamental function of the bridge was introduced – a transformation of a horisontal force from the string to a couple of vertical forces at the bridge feet. The function of the bridge is similar to the case with a horizontal push of a person which results in a couple of forces – vertical - between the feet and floor. But the bridge is not completely rigid but has a built-in resonance. This corresponds to a motion of the human body above the waist, see fig.7.21. Corresponding bridge resonance is at 3 kHz with the bridge on a non-moving support.
Figure 7.21. Illustration of the bridge resonance.
Jansson: Akustik för fiol- och gitarrbyggare sid 7.22
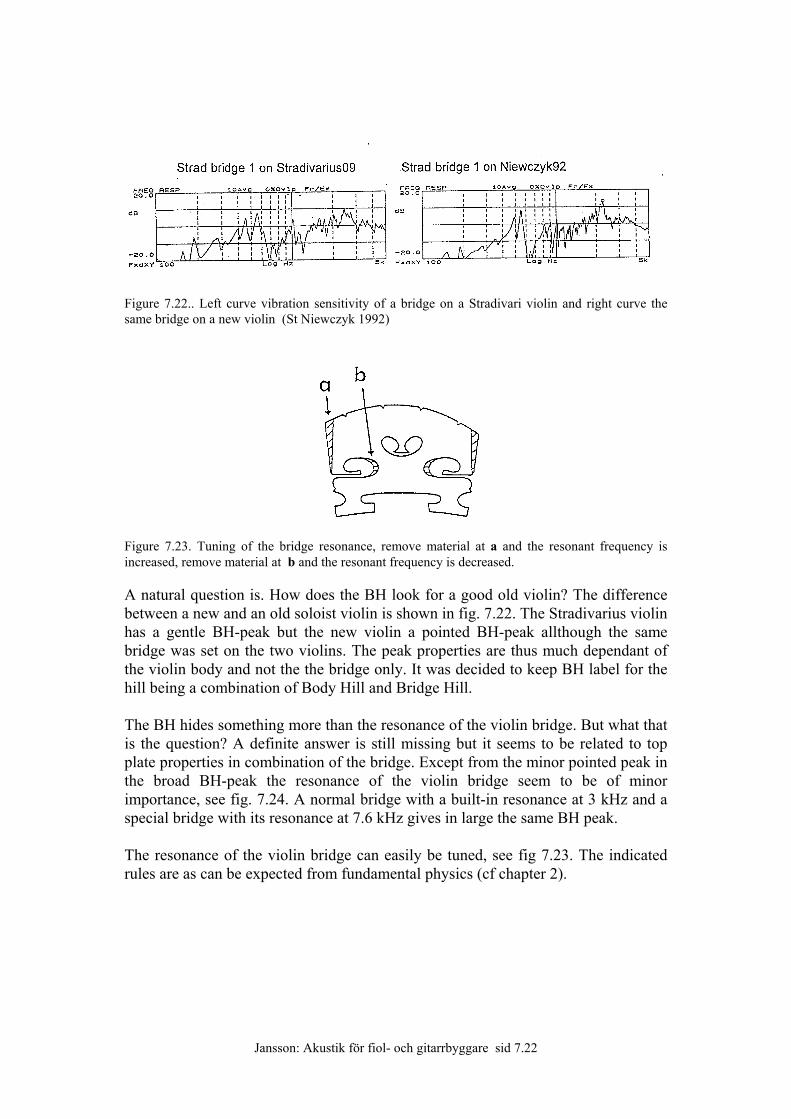
Figure 7.22.. Left curve vibration sensitivity of a bridge on a Stradivari violin and right curve the same bridge on a new violin (St Niewczyk 1992)
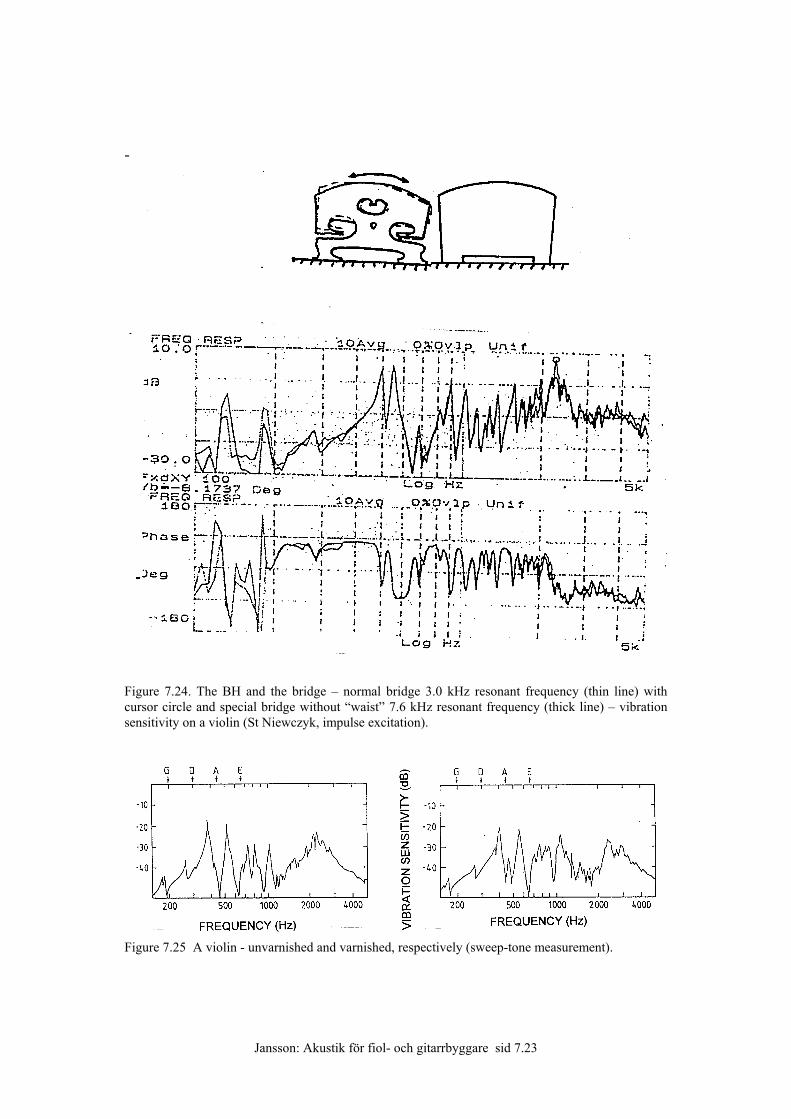
Figure 7.23. Tuning of the bridge resonance, remove material at a and the resonant frequency is increased, remove material at b and the resonant frequency is decreased. A natural question is. How does the BH look for a good old violin? The difference between a new and an old soloist violin is shown in fig. 7.22. The Stradivarius violin has a gentle BH-peak but the new violin a pointed BH-peak allthough the same bridge was set on the two violins. The peak properties are thus much dependant of the violin body and not the the bridge only. It was decided to keep BH label for the hill being a combination of Body Hill and Bridge Hill. The BH hides something more than the resonance of the violin bridge. But what that is the question? A definite answer is still missing but it seems to be related to top plate properties in combination of the bridge. Except from the minor pointed peak in the broad BH-peak the resonance of the violin bridge seem to be of minor importance, see fig. 7.24. A normal bridge with a built-in resonance at 3 kHz and a special bridge with its resonance at 7.6 kHz gives in large the same BH peak. The resonance of the violin bridge can easily be tuned, see fig 7.23. The indicated rules are as can be expected from fundamental physics (cf chapter 2).
Jansson: Akustik för fiol- och gitarrbyggare sid 7.23
-
Figure 7.24. The BH and the bridge – normal bridge 3.0 kHz resonant frequency (thin line) with cursor circle and special bridge without “waist” 7.6 kHz resonant frequency (thick line) – vibration sensitivity on a violin (St Niewczyk, impulse excitation).
Figure 7.25 A violin - unvarnished and varnished, respectively (sweep-tone measurement).
Jansson: Akustik för fiol- och gitarrbyggare sid 7.24
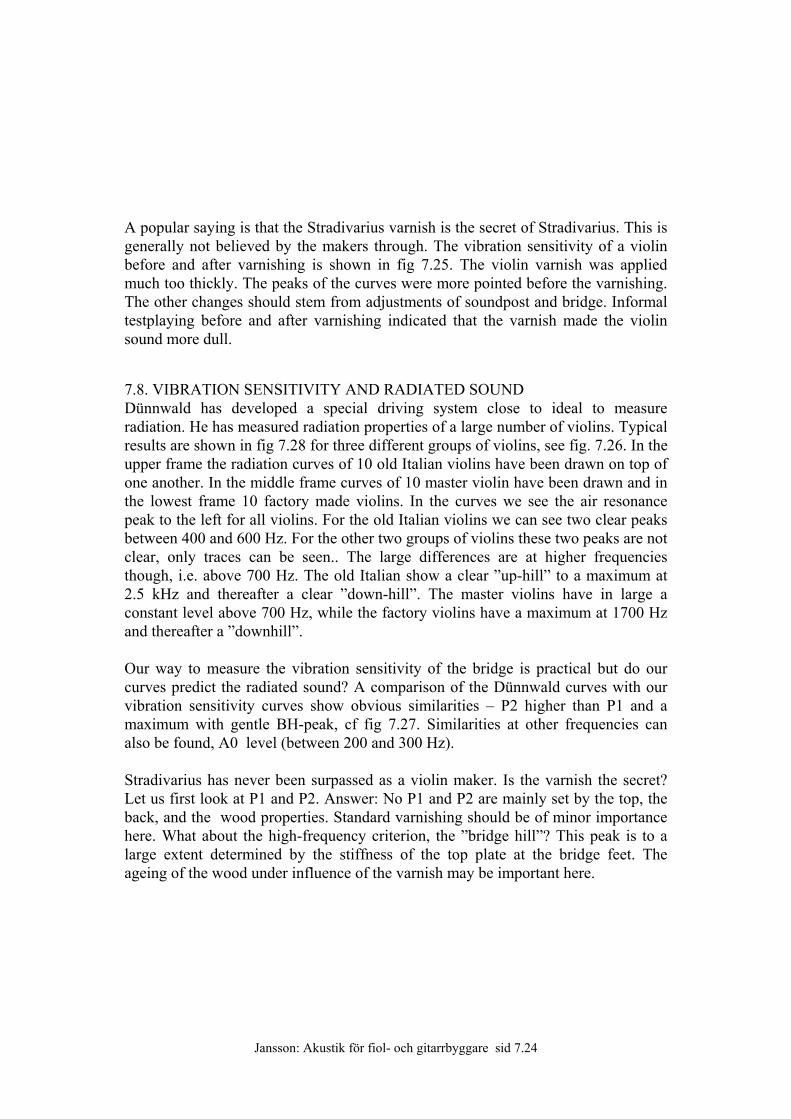
A popular saying is that the Stradivarius varnish is the secret of Stradivarius. This is generally not believed by the makers through. The vibration sensitivity of a violin before and after varnishing is shown in fig 7.25. The violin varnish was applied much too thickly. The peaks of the curves were more pointed before the varnishing. The other changes should stem from adjustments of soundpost and bridge. Informal testplaying before and after varnishing indicated that the varnish made the violin sound more dull.
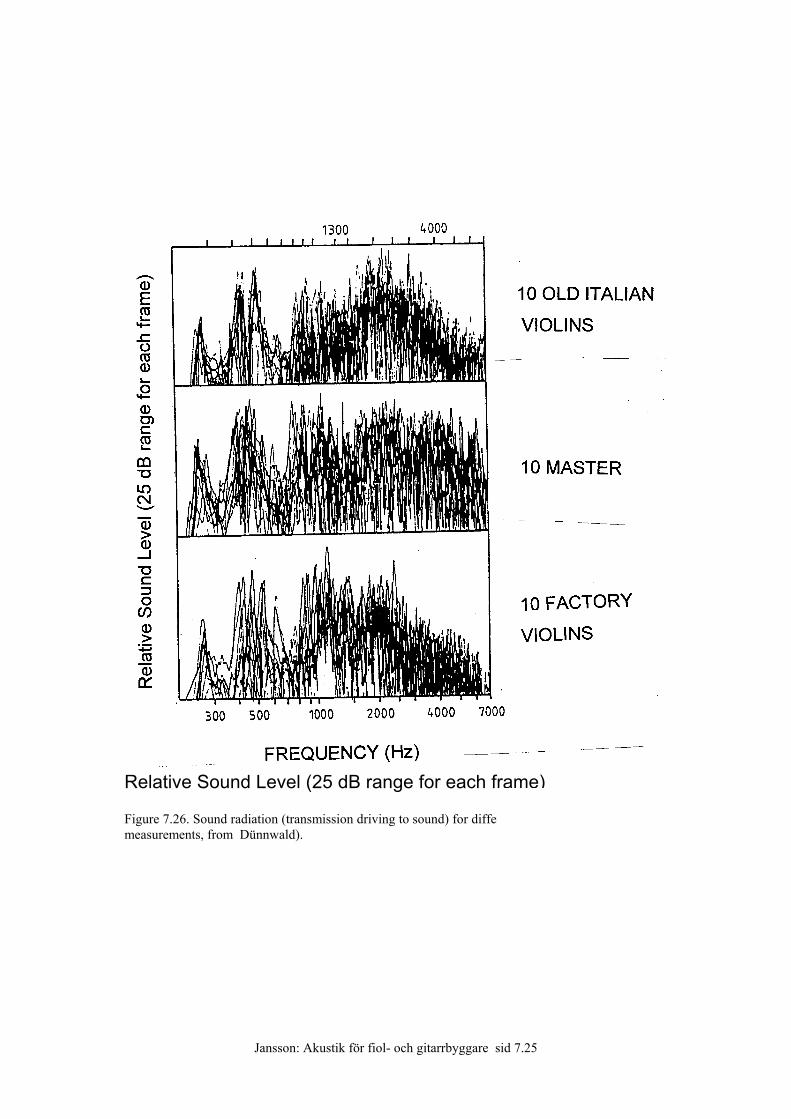
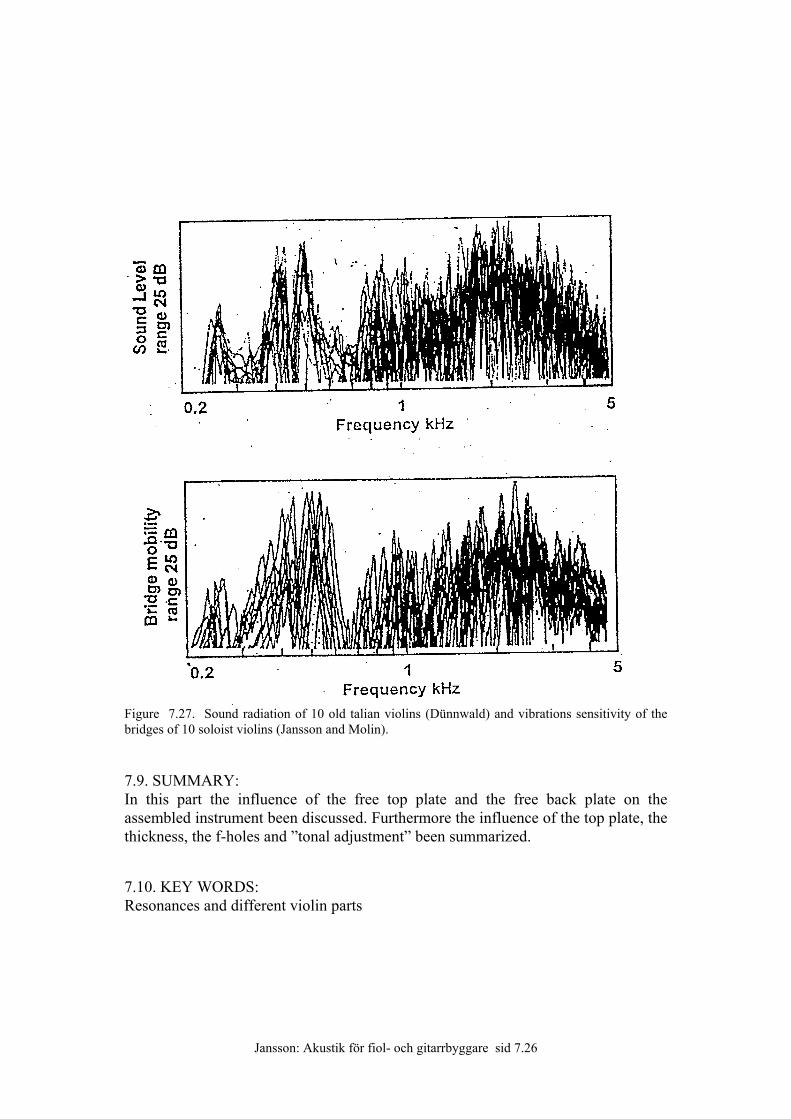
7.8. VIBRATION SENSITIVITY AND RADIATED SOUND Dünnwald has developed a special driving system close to ideal to measure radiation. He has measured radiation properties of a large number of violins. Typical results are shown in fig 7.28 for three different groups of violins, see fig. 7.26. In the upper frame the radiation curves of 10 old Italian violins have been drawn on top of one another. In the middle frame curves of 10 master violin have been drawn and in the lowest frame 10 factory made violins. In the curves we see the air resonance peak to the left for all violins. For the old Italian violins we can see two clear peaks between 400 and 600 Hz. For the other two groups of violins these two peaks are not clear, only traces can be seen.. The large differences are at higher frequencies though, i.e. above 700 Hz. The old Italian show a clear ”up-hill” to a maximum at 2.5 kHz and thereafter a clear ”down-hill”. The master violins have in large a constant level above 700 Hz, while the factory violins have a maximum at 1700 Hz and thereafter a ”downhill”. Our way to measure the vibration sensitivity of the bridge is practical but do our curves predict the radiated sound? A comparison of the Dünnwald curves with our vibration sensitivity curves show obvious similarities – P2 higher than P1 and a maximum with gentle BH-peak, cf fig 7.27. Similarities at other frequencies can also be found, A0 level (between 200 and 300 Hz). Stradivarius has never been surpassed as a violin maker. Is the varnish the secret? Let us first look at P1 and P2. Answer: No P1 and P2 are mainly set by the top, the back, and the wood properties. Standard varnishing should be of minor importance here. What about the high-frequency criterion, the ”bridge hill”? This peak is to a large extent determined by the stiffness of the top plate at the bridge feet. The ageing of the wood under influence of the varnish may be important here.
Jansson: Akustik för fiol- och gitarrbyggare sid 7.25
Relative Sound Level (25 dB range for each frame) Figure 7.26. Sound radiation (transmission driving to sound) for different types of violins (sweeptone measurements, from Dünnwald).
Jansson: Akustik för fiol- och gitarrbyggare sid 7.26
Figure 7.27. Sound radiation of 10 old talian violins (Dünnwald) and vibrations sensitivity of the bridges of 10 soloist violins (Jansson and Molin). 7.9. SUMMARY: In this part the influence of the free top plate and the free back plate on the assembled instrument been discussed. Furthermore the influence of the top plate, the thickness, the f-holes and ”tonal adjustment” been summarized.
7.10. KEY WORDS: Resonances and different violin parts