acoustics of vowels - mit opencourseware · acoustic and auditory phonetics. malden, ma: blackwell...
TRANSCRIPT
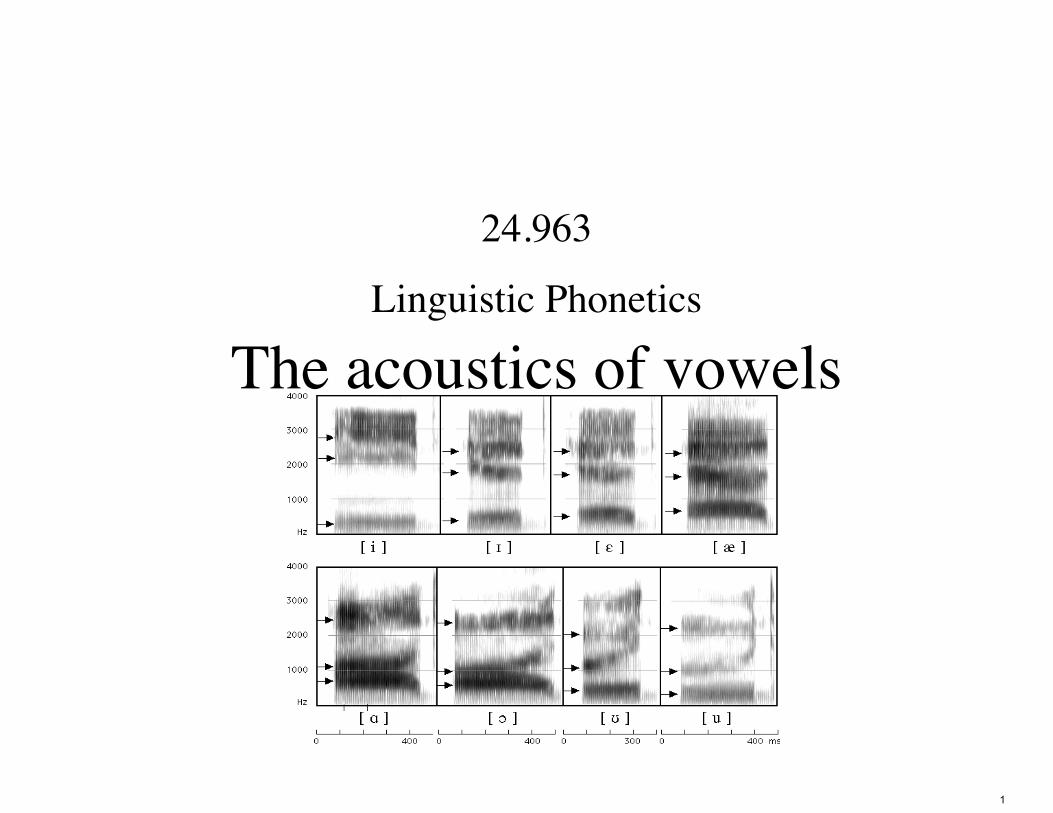
24.963
Linguistic PhoneticsThe acoustics of vowels
1

• No class on Tuesday 10/13 (Tuesday is a Monday) Readings: • Johnson chapter 6 (for this week) • Liljencrants & Lindblom (1972) (for next week) Assignment: • Modeling lip-rounding, due 10/15
2

3
© Nelson Education. All rights reserved. This content is excluded from our Creative Commons license. For more information, see http://ocw.mit.edu/help/faq-fair-use/

4
F2 (Hz)
F1 (Hz)
200
300
400
500
600
700
8002500 2000 1500 1000
iu
I
ε
Ω
c
Aæ
Image by MIT OCW.Adapted from Peter Ladefoged. A Course in Phonetics. 5th ed. Berlin, Germany: Heinle, 2005.ISBN: 9781413006889. Available at: https://www.phonetics.ucla.edu/course/contents.html.
The Acoustics of Vowels
Source-Filter models: • Source: voicing (usually) • Filter characteristics can be given a basic but
useful analysis using simple tube models. • Tube models can be supplemented by perturbation
theory for approximate analysis of the effects of wide constrictions.
5
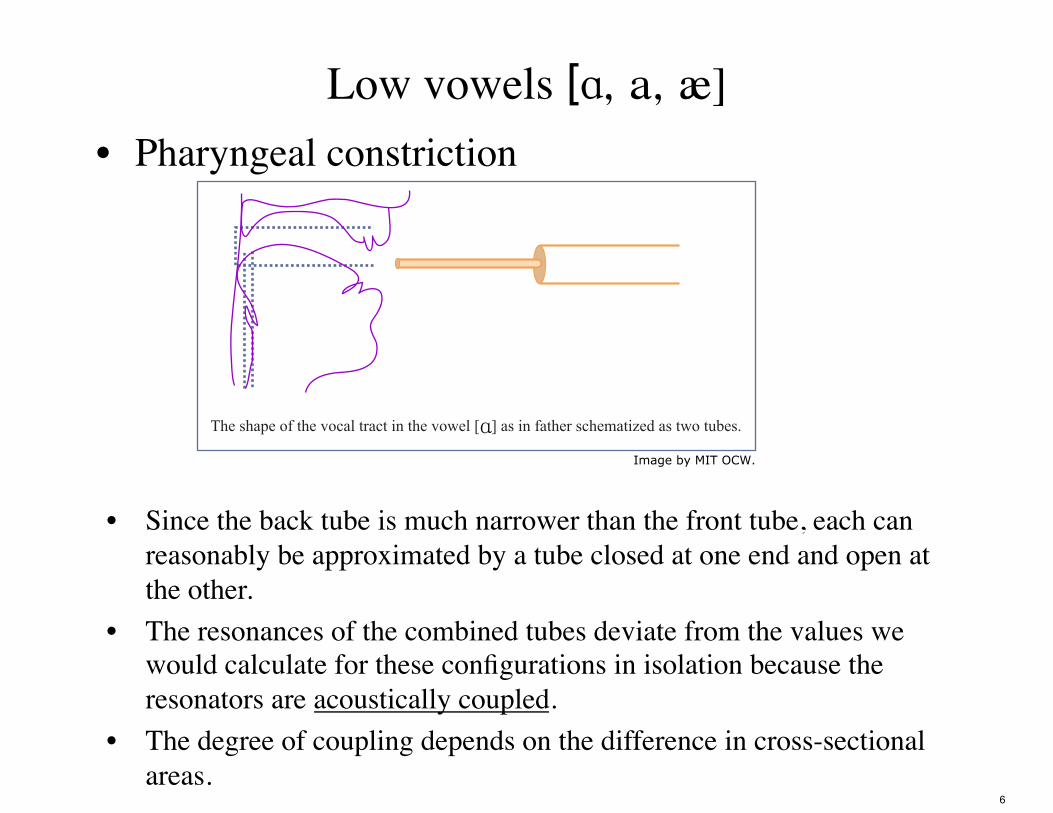
Low vowels [A, a, œ] • Pharyngeal constriction
• Since the back tube is much narrower than the front tube, each can reasonably be approximated by a tube closed at one end and open at the other.
• The resonances of the combined tubes deviate from the values we would calculate for these configurations in isolation because the resonators are acoustically coupled.
• The degree of coupling depends on the difference in cross-sectional areas.
6
ɑThe shape of the vocal tract in the vowel [ ] as in father schematized as two tubes.
Image by MIT OCW.
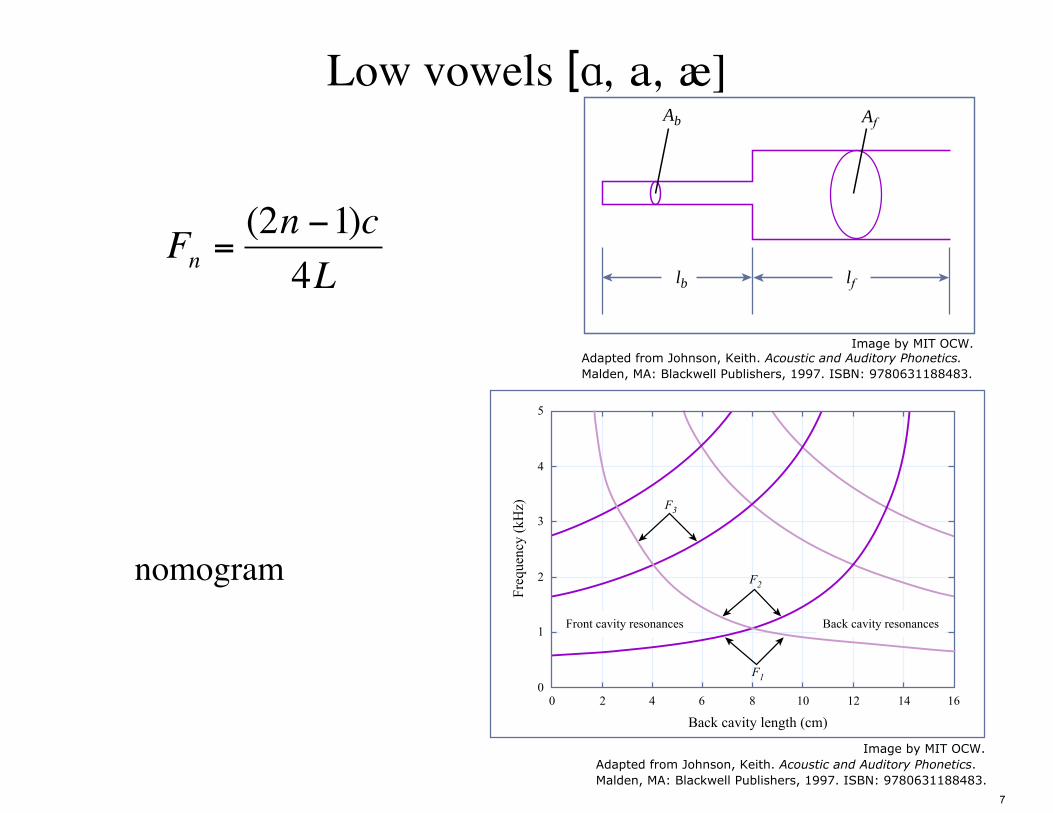
Low vowels [A, a, œ]
€
Fn =(2n −1)c4L
nomogram
7
lb
b f
lf
A A
Front cavity resonances Back cavity resonances
Freq
uenc
y (k
Hz)
Back cavity length (cm)
5
4
3
2
1
00 2 4 6 8 10 12 14 16
F3
F2
F1
Image by MIT OCW.Adapted from Johnson, Keith. Acoustic and Auditory Phonetics.Malden, MA: Blackwell Publishers, 1997. ISBN: 9780631188483.
Image by MIT OCW.Adapted from Johnson, Keith. Acoustic and Auditory Phonetics.Malden, MA: Blackwell Publishers, 1997. ISBN: 9780631188483.
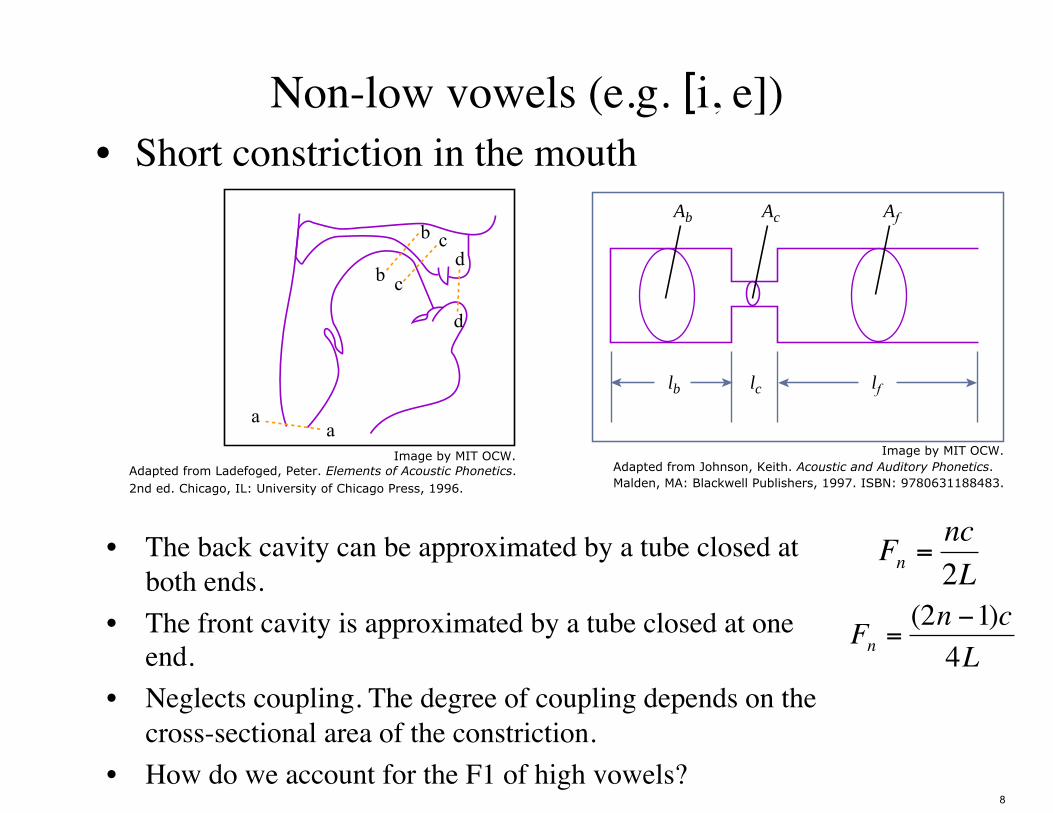
Non-low vowels (e.g. [i, e]) • Short constriction in the mouth
• The back cavity can be approximated by a tube closed at both ends.
• The front cavity is approximated by a tube closed at one end.
• Neglects coupling. The degree of coupling depends on the cross-sectional area of the constriction.
• How do we account for the F1 of high vowels?
€
Fn =nc2L
€
Fn =(2n −1)c4L
8
lb lc lf
Ab Ac Af
Image by MIT OCW.Adapted from Johnson, Keith. Acoustic and Auditory Phonetics.Malden, MA: Blackwell Publishers, 1997. ISBN: 9780631188483.
aa
b
b
c
cd
d
Image by MIT OCW.Adapted from Ladefoged, Peter. Elements of Acoustic Phonetics.2nd ed. Chicago, IL: University of Chicago Press, 1996.

Helmholtz resonators
• The back cavity and the constriction together form a resonant system called a Helmholtz resonator.
• If the length of the constriction is short, the air in it vibrates as a mass on the ‘spring’ formed by the air in the back cavity.
• Resonant frequency, f = c
2π Vl= c
c 2π Ablblc
€
c A c A
9
lb lc lf
Ab Ac Af
Image by MIT OCW.Adapted from Johnson, Keith. Acoustic and Auditory Phonetics.Malden, MA: Blackwell Publishers, 1997. ISBN: 9780631188483.
b cd
b c
d
aa
Image by MIT OCW.Adapted from Ladefoged, Peter. Elements of Acoustic Phonetics.2nd ed. Chicago, IL: University of Chicago Press, 1996.

Non-low vowels - nomogram
€
f =c2π
Ac
Ablblc€
Fn =nc2L
€
Fn =(2n −1)c4L
front cavity
back cavity
back cavity + constriction
• How would you model a mid vowel? 10
lb lc
Ab Ac Af
lf
Image by MIT OCW.Adapted from Johnson, Keith. Acoustic and Auditory Phonetics.
Malden, MA: Blackwell Publishers, 1997. ISBN: 9780631188483.€
Front cavity resonances Back cavity resonances
Freq
uenc
y (k
Hz)
Back cavity length (cm)
5
4
3
2
1
00 2 4 6 8 10 12 14 16
F3
F2
F1
Image by MIT OCW.Adapted from Johnson, Keith. Acoustic and Auditory Phonetics.Malden, MA: Blackwell Publishers, 1997. ISBN: 9780631188483.

Perturbation Theory (Chiba and Kajiyama 1941) • Constriction near a
point of maximum velocity (Vn) lowers the associated formant frequency.
• Constriction near a point of maximum pressure raises the associated formant frequency.
11
V1
V2
V2
F2 F4
V1 V3
V4
V4
F1 F3
V3 V3'
V2'
V2'
V3'
V4'
V4'
V4''
V4''
V4'''
V4'''
V3''
V3''
Image by MIT OCW.Adapted from Johnson, Keith. Acoustic and Auditory Phonetics. Malden,
MA: Blackwell Publishers, 1997. Based on Chiba and Kajiyama 1941.

Perturbation Theory (Chiba and Kajiyama 1941) • What is the effect of a
pharyngeal constriction? • Does this correspond to the
tube model above? • How do you raise F2
maximally?
12
V1
V2
V2
F2 F4
V1 V3
V4
V4
F1 F3
V3 V3'
V2'
V2'
V3'
V4'
V4'
V4''
V4''
V4'''
V4'''
V3''
V3''
Image by MIT OCW.Adapted from Johnson, Keith. Acoustic and Auditory Phonetics. Malden,
MA: Blackwell Publishers, 1997. Based on Chiba and Kajiyama 1941.
Perturbation Theory vs. two-tube models • Our simple tube models ignore acoustic coupling and are
therefore most valid where constrictions are narrow. Perturbation theory accounts for the effects of small perturbations of a uniform tube, and thus is most accurate for open constrictions. Mrayati et al (1988): perturbation theory is generally valid for constrictions greater than 0.8 cm2, and two-tube models are valid for a constriction of 0.05 cm2 or less, with a transitional region in between.
Mrayati, Carré & Guérin (1988). Distinctive regions and modes. Speech Communication 7, 257-286.
•
•
•
13

American English [ɹ] • American English [ɹ] is characterized by an exceptionally
low F3 (<2000 Hz).
Reproduced from Espy-Wilson, Carol Y., Suzanne E. Boyce, Michel Jackson, Shrikanth Narayanan, and Abeer Alwan."Acoustic modeling of American English/r." The Journal of the Acoustical Society of America 108, no. 1 (2000):343-356. doi: https://doi.org/10.1121/1.429469, with the permission of the Acoustical Society of America.
14

• American English [ɹ] is produced in a variety of ways across speakers and contexts (Alwan et al 1997 JASA, Westbury et al 1998, Speech Comm.).
• A basic distinction that is often made: ‘bunched’ vs. ‘retroflex’. – But there appears to be a
continuum of variants.
15
Reproduced from Narayanan, Shrikanth S., Abeer A. Alwan, and Katherine Haker."Toward articulatory-acoustic models for liquid approximants based on MRI andEPG data. Part I. The laterals." The Journal of the Acoustical Society of America101, no. 2 (1997): 1064-1077. doi: https://doi.org/10.1121/1.418030, withthe permission of the Acoustical Society of America.

Perturbation Theory (Chiba and Kajiyama 1941) A nice story about Am. Eng.
[®] • Three constriction: labial
(lip protrusion/rounding), palatal (bunching or retroflexion), and pharyngeal.
• All 3 are near velocity maxima for F3, hence very low F3.
• But Espy-Wilson et al (2000) argue actual constrictions are in the wrong place
16
V1
V2
V2
F2 F4
V1 V3
V4
V4
F1 F3
V3 V3'
V2'
V2'
V3'
V4'
V4'
V4''
V4''
V4'''
V4'''
V3''
V3''
Image by MIT OCW.Adapted from Johnson, Keith. Acoustic and Auditory Phonetics. Malden,
MA: Blackwell Publishers, 1997. Based on Chiba and Kajiyama 1941.

Espy-Wilson et al (2000) argue from MRI data that:
• Actual constrictions are in the wrong places, e.g. pharyngeal constriction is too high.
• Constrictions are too narrow to apply perturbation theory.
• Argue that F3 is a front cavity resonance.
• Low due to length (bunched) or sub-lingual cavity (retro) + lip constriction. (How long?)
• Or: lip constriction is narrow enough for the front cavity to form a Helmholtz resonator.
17
Reproduced from Narayanan, Shrikanth S., Abeer A. Alwan, and Katherine Haker."Toward articulatory-acoustic models for liquid approximants based on MRI andEPG data. Part I. The laterals." The Journal of the Acoustical Society of America101, no. 2 (1997): 1064-1077. doi: https://doi.org/10.1121/1.418030, withthe permission of the Acoustical Society of America.

Constriction locations and area functions for [i] vowels
Story et al (1998), MRI
Ladefoged & Maddieson (1996) – mean tongue positions
Fant (1960), Russian [i]F2 2250 Hz, F3 3200 Hz
18
.
© Journal of the Acoustical Society of America. All rights reserved. This content is excluded fromour Creative Commons license. For more information, see https://ocw.mit.edu/help/faq-fair-use/.Source: Story, Brad H., Ingo R. Titze, and Eric A. Hoffman. "Vocal tract area functions for an adult female speakerbased on volumetric imaging." The Journal of the Acoustical Society of America 104, no. 1 (1998): 471-487.
© Walter de Gruyter. All rights reserved. This content is excluded from our Creative Commons license. For more information, see http://ocw.mit.edu/help/faq-fair-use/
© MIT Press. All rights reserved. This content is excluded from our Creative Commons license. For more information, see http://ocw.mit.edu/help/faq-fair-use/

Hillenbrand et al (1995) – Michigan English vowel formants
2000
2200
2400
2600
2800
3000
3200
500 1000 1500 2000 2500
F3(Hz)
F2 (Hz)
a
ø
U
O
u
oU
i
eI I
œ œ E
Courtesy of The Acoustical Society of America. Used with permission.Source: Hillenbrand, James, Laura A. Getty, Michael J. Clark, and KimberleeWheeler. "Acoustic characteristics of American English vowels." The Journalof the Acoustical society of America 97, no. 5(1995): 3099-3111.

Lip rounding • Lip-rounding also involves lip protrusion so it both
lengthens the vocal tract and introduces a constriction at the lips.
• Perturbation theory: All formants have a velocity maximum at the lips, so a constriction at the lips should lower all formants.
• Lengthening the vocal tract also lowers formants. • Tube models: The effect of a constriction at the lips is
equivalent to lengthening the front cavity. Protrusion actually lengthens the front cavity.
• This lowers the resonances of the front cavity - in front vowels the lowest front cavity resonance is usually F3, in back vowels it is F2.
20

Lip rounding • Tube models 2: Fant (1960) suggests the front cavity plus
lip constriction can form a helmholtz resonator.
21
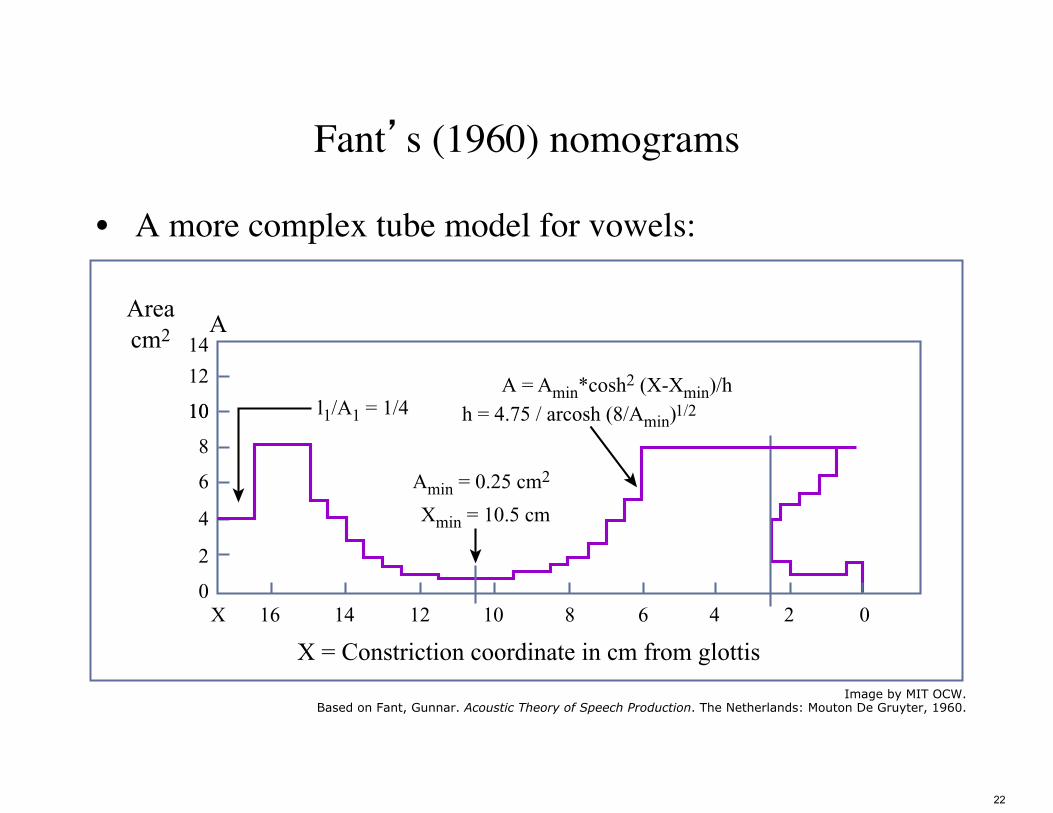
Fant’s (1960) nomograms
• A more complex tube model for vowels:
22
14 12
12
10
8
8
6
6
4
4
2
2 0
0
10
1016 14X
Area A
cm2
Amin = 0.25 cm2
Xmin = 10.5 cm
l1/A1 = 1/4 A = Amin*cosh2 (X-Xmin)/h
h = 4.75 / arcosh (8/Amin)1/2
X = Constriction coordinate in cm from glottis Image by MIT OCW.
Based on Fant, Gunnar. Acoustic Theory of Speech Production. The Netherlands: Mouton De Gruyter, 1960.
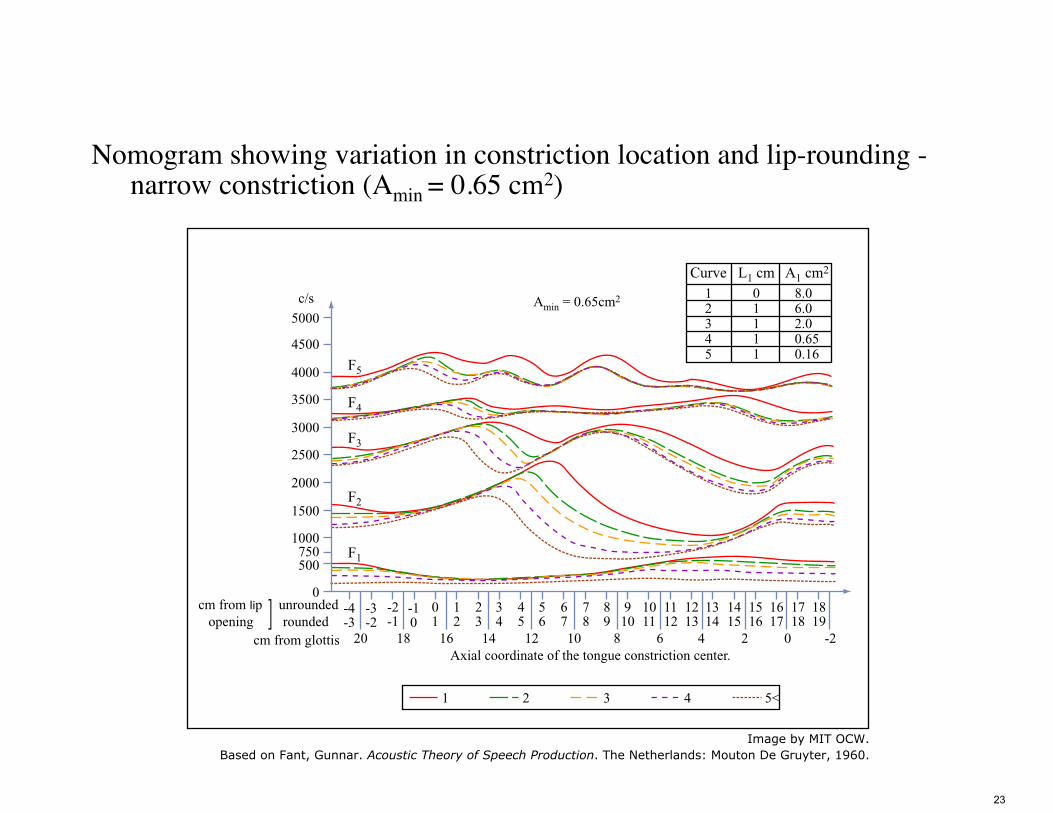
Nomogram showing variation in constriction location and lip-rounding - narrow constriction (Amin = 0.65 cm2)
23
c/s
5000
4500
4000
3500
3000
2500
2000
1500
1000 750 500
0 cm from lip unrounded
opening rounded -3-4 -2 -1 0 1 2 3 4 5 6 7 8 9 10 11 12 13 14 15 16 17 18 -2-3 -1 0
F5
F4
F3
F2
F1
Amin = 0.65cm2
1 2 3 4 5 6 7 8 9 10 11 12 13 14 15 16 17 18 19
Curve L1 cm A1 cm2
1 2 3 4 5
0 1 1 1 1
8.0 6.0 2.0 0.65 0.16
cm from glottis 20 18 16 14 12 10 8 6 4 2 0 -2Axial coordinate of the tongue constriction center.
1 2 3 4 5<
Image by MIT OCW.Based on Fant, Gunnar. Acoustic Theory of Speech Production. The Netherlands: Mouton De Gruyter, 1960.

Nomogram showing variation in constriction location and lip-rounding - wider constriction (Amin = 2.5 cm2)
24
20
-3-4cm from opening
unroundedrounded
cm from glottisAxial coordinate of the tongue constriction center.
-2 -1 0 1 2 3 4 5 6 7 8 9 10 11 12 13 14 15 16 17 18-2-3 -1 0
0
500750
1000
1500
2000
2500
3000
3500
4000
4500F5
F4
F3
F2
F1
5000c/s Amin = 2.6 cm2
1 2 3 4 5 6 7 8 9 10 11 12 13 14 15 16 17 18 1918 16 14 12 10 8 6 4 2 0 -2
Curve L1 cm A1 cm2
12345
01111
8.06.02.00.650.16
1 2 3 4 5
lip
Image by MIT OCW.Based on Fant, Gunnar. Acoustic Theory of Speech Production. The Netherlands: Mouton De Gruyter, 1960.

Nomogram showing variation in constriction location and degree.
25
20
-3-4cm from opening
unroundedstate
cm from glottisAxial coordinate of the tongue constriction center.
-2 -1 0 1 2 3 4 5 6 7 8 9 10 11 12 13 14 15 16 17 180
500750
1000
1500
2000
2500
3000
3500
4000
4500F5
F4
F3
F2
F1
5000c/s
Amin = 0.32 cm2
Amin = 1.3 cm2
Amin = 5.0 cm2
18 16 14 12 10 8 6 4 2 0 -2
Curve123
L1 cm000
A1 cm8.06.02.0
Amin cm2
0.321.35.0
1 2 3
lip
Image by MIT OCW.
MIT OpenCourseWarehttps://ocw.mit.edu
24.915 / 24.963 Linguistic PhoneticsFall 2015
For information about citing these materials or our Terms of Use, visit: https://ocw.mit.edu/terms.