acquisition and processing considerations for infrared
TRANSCRIPT
Brian F. Knisely1
Department of Mechanical Engineering,The Pennsylvania State University,
University Park, PA 16801e-mail: [email protected]
Reid A. BerdanierDepartment of Mechanical Engineering,
The Pennsylvania State University,University Park, PA 16801e-mail: [email protected]
Karen A. TholeDepartment of Mechanical Engineering,
The Pennsylvania State University,University Park, PA 16802
e-mail: [email protected]
Charles W. HaldemanPratt & Whitney,
East Hartford, CT 06108e-mail: [email protected]
James R. MarkhamAdvanced Fuel Research, Inc.,
East Hartford, CT 06108e-mail: [email protected]
Joseph E. CosgroveAdvanced Fuel Research, Inc.,
East Hartford, CT 06108e-mail: [email protected]
Andrew E. CarlsonAdvanced Fuel Research, Inc.,
East Hartford, CT 06108e-mail: [email protected]
James J. Scire, Jr.New York Institute of Technology,
Old Westbury, NY 11568e-mail: [email protected]
Acquisition and ProcessingConsiderations for InfraredImages of Rotating TurbineBladesAs designers aim to increase efficiency in gas turbines for aircraft propulsion and powergeneration, spatially resolved experimental measurements are needed to validate computa-tional models and compare improvement gains of new cooling designs. Infrared (IR) ther-mography is one such method for obtaining spatially resolved temperature measurements.As technological advances in thermal detectors enable faster integration times, surface tem-perature measurements of rotating turbine blades become possible to capture including thesmallest features. This paper outlines opportunities enabled by the latest IR detector tech-nologies for capturing spatially resolved rotating blade temperatures, while also address-ing some of the challenges of implementing IR for turbine rigs such as the one in the SteadyThermal Aero Research Turbine (START) Laboratory. This paper documents critical stepsin achieving accurate measurements including calibration, integration times, spatial noise,and motion blur. From these results, recommendations are provided for achieving accurateIR measurements collected in a rotating turbine facility to study film cooling.[DOI: 10.1115/1.4050143]
Keywords: heat transfer and film cooling, measurement techniques, turbine blade andmeasurement advancements
IntroductionManufacturers continue to strive for improved thermal efficiency
and reduced emissions with gas turbine engines through increasedfiring temperatures. These increases require improved coolingdesigns to maintain hardware integrity. Through the maturationprocess of turbine component designs, engineers have gained theability to model and predict component temperatures at any locationin an engine. However, many of these designs are based on globalaverages rather than discrete local surface temperatures, whichrequire spatially resolved measurements.Infrared (IR) thermography is a non-contact measurement techni-
que that captures a spatial map of surface temperatures. With thiscapability, IR thermography is one particular measurementmethod that is well-suited to gather high-fidelity measurementson turbine components. The application of IR has been widespread
in the turbine heat transfer community. Because of its ability toresolve spatial information, IR imaging has been used for aerospaceapplications since the late 1960s [1]. Coauthors on this paper havelong used IR thermography to capture details of film cooling effec-tiveness levels, heat transfer coefficients for airfoils and endwalls,combustor liner cooling, and blade tip heat transfer [2–6]. Thesestudies have shown the empowering benefits of spatially resolvedtemperatures relative to point-based temperature measurements.As these examples illustrate, the application of IR thermographyfor turbine cooling measurements has primarily been limited to sta-tionary experiments that circumvent the need to address effects ofrotation. Based on this, a primary challenge is the ability to imagehighly three-dimensional (3D) blades that are rotating in anengine-representative environment.The recent development of new infrared detectors capable of
operating with integration times of under 1 μs provides opportuni-ties previously not afforded for IR integration. These detector tech-nologies enable the use of IR in a turbine test rig such as the one inthe Steady Thermal Aero Research Turbine (START) facility [7] toassess the details of the performance of film cooling designs atengine-representative hardware scales with relevant axial and rota-tional Reynolds numbers. While there are many advantages in using
1Corresponding author.Contributed by the International Gas Turbine Institute (IGTI) of ASME for
publication in the JOURNAL OF TURBOMACHINERY. Manuscript received November 11,2020; final manuscript received January 16, 2021; published online March 24, 2021.Assoc. Editor: David G. Bogard.
Journal of Turbomachinery APRIL 2021, Vol. 143 / 041013-1Copyright © 2021 by ASME
Dow
nloaded from http://asm
edigitalcollection.asme.org/turbom
achinery/article-pdf/143/4/041013/6669743/turbo_143_4_041013.pdf by The Pennsylvania State University, Karen Thole on 13 April 2021
IR imaging to measure rotating blades, several challenges exist.This paper provides unique and detailed analyses related to specificchallenges in applying IR measurements in a turbine test rig usedfor film cooling studies, as well as how these challenges can beaddressed.
Review of LiteratureInfrared thermography operates on the basis of Planck’s law,
which describes the spectral radiance of a perfect emitter (or black-body) as a function of wavelength and absolute temperature [8].From Planck’s law, the peak blackbody emissive power for objectsfrom cryogenic temperatures up to approximately 4000 K occursin the infrared wave band, a portion outside of the visible light spec-trum comprising wavelengths of 0.74–1000 μm. Through the use ofa detector designed to measure radiant energy in a particular IR waveband, a signal measured by the detector can be correlated with anobject’s temperature. IR detectors commonly utilize the 3–5 μmmid-wave IR (MWIR) or 8–12 μm long-wave IR (LWIR) bandswhere atmospheric absorption is low. However, detectors in the1–3 μm short wave (SW) are also available [8].Several published experiments have used IR imaging for rotating
disks, and some have even used IR imaging for rotating blades.Some notable work involving rotating disks include studies per-formed by Cardone et al. [9] and Astarita et al. [10]. Cardoneet al. utilized a heated thin foil on the rotating disk that allowedfor Nusselt numbers to be calculated as a function of Reynoldsnumber. The imaged disks were axisymmetric and, therefore,image blur due to rotation and long integration times was not aprimary concern. Image blur due to motion, known as motionblur, is a result of subjects moving during the time the image is cap-tured (the integration time). In the study by Astarita et al., unsteadyspiral vortices were visualized during the rotation of an axisymmet-ric disk. To accomplish this goal, the line-scan function of an IRcamera was utilized to increase the frame rate from 15 Hz toabout 2500 Hz; the high frame rate afforded by scanning a singleline of the focal plane array (FPA) was essential in capturingunsteady heat transfer effects.The use of IR thermography to capture blade temperatures was
performed by Brunner et al. [11], although a focal plane arraywas not used and, therefore, a spatial map of temperature was notmeasured. Instead, two pyrometers (single-point IR sensors) wereused to simultaneously measure blade surface temperatures onsecond stage low-pressure turbine (LPT) blades in a heavy-dutygas turbine engine. The use of relatively low-cost pyrometers forengine monitoring was demonstrated. Thermal transients were mea-sured on the blade surfaces during operation as turbine conditionschanged. Optical access was achieved using probes with opticalfibers and sapphire lenses. While these tests were significant assome of the first temperature measurements on rotating blades,using an IR detector with an FPA to measure a spatial map of tem-perature provides more information for studying blade heat transfereffects.A spatially resolved IR system was developed for condition mon-
itoring of thermal barrier coated (TBC) blades in power generationturbines as described by LeMieux [12]. A custom infrared systemwas used that included an indium gallium arsenide (InGaAs) detec-tor sensitive to the 0.9–1.6 μm near-IR (NIR) band. An FPAallowed a spatial map of temperature to be measured with an inte-gration time as low as 0.5 μs for linear speeds of 400 m/s. Anuncoated sapphire window and a telescopic lens arrangement pro-vided optical access needing two blade views to image the entireblade. Following this development, IR was presented as an optionfor condition monitoring of power generation engines [13].Patent applications of industrial IR condition monitoring demon-
strate an interest in both the power generation [14,15] and aviation[16] sectors. In addition to industrial condition monitoring applica-tions, IR has also been used to measure temperatures of rotatingblades in academic research. Spatially resolved IR measurements
of rotating blades were captured by Mori et al. [17,18] and Novaket al. [19]. In these studies, uncooled blades in a room-temperatureturbine rig were rotated at speeds up to 1500 rpm and a high-speedIR camera was used to capture surface temperatures. Due to therelatively slow rotational speed, an integration time of 100 μs wassuitable to capture thermal images.Other researchers have since used IR systems at shorter integra-
tion times to capture rotating blades that are more relevant to turbineconditions. Markham et al. [20] measured blades coated with TBCin an aero engine using a custom-designed IR system. They alsomeasured rotating blades on a molecular turbopump at speeds ofup to 60,000 rpm using an integration time of 1.08 μs. Markhamet al. used a custom optical probe with zinc selenide (ZnSe)optics to allow the thermal detector to view the surface of rotatingcooled blades. Similar to Brunner et al. [11], Markham’s opticalprobe protruded from the wall near the vane casing and faced down-stream allowing blades to be imaged. This study demonstrated amethod to successfully measure rotating blades in an engine,further identifying that IR thermography may be used to measureheat transfer in areas critical to blade design, such as the endwall.Recently, IR thermography has been used to study endwall heat
transfer. Lazzi Gazzini et al. [21] and Hänni et al. [22] measuredcontoured rotor endwalls at 2700 rpm in a low-temperature, moder-ate speed, rotating turbine facility to assess effects of purge flow onNusselt number and adiabatic wall temperature. Three ZnSewindows mounted in the casing were used to grant optical access,so the blade endwalls could be imaged. In each of these studies,image processing and reconstruction were an integral componentof generating results.Post-processing often dictates the way in which data are col-
lected. Most IR camera manufacturers utilize their own softwarefor processing before the user sees any data [23]. For integrationtimes less than 10 μs for common detector types such as MCT, alarge number of images must be averaged together to reducenoise. Markham et al. [20] averaged 100 images together to forma representative measurement, while Lazzi Gazzini et al. [21] aver-aged 1000 images to form a single measurement. The number ofimages needed for averaging is likely a function of integrationtime, but no post-processing has previously been defined byresearchers utilizing IR imaging for rotating parts to determinethe optimal number of images for averaging.Lazzi Gazzini et al. [21] also describe an image deblurring and
reconstruction procedure which involves images collected at twodifferent integration times: 10 μs and 50 μs. Using these twoimage sets, the reduced image blur at 10 μs and the reducedspatial noise at 50 μs were combined to form a composite imagewith both low motion blur and low noise. Their research providedsome initial insight into the tradeoffs associated with the selectionof integration time and suggested that further investigation maybe of interest to optimize image quality to minimize spatial noiseand motion blur.Past applications of implementing IR have brought to light the
many challenges that exist for accurately capturing surface tempera-tures on rotating turbine blades where rotational speeds areengine-relevant: achieving optical access, using appropriatesurface coatings and calibration methods, and determining accept-able integration time and post-processing for rotating parts. Thisstudy addresses these primary challenges to provide insight intousing IR for making turbine blade temperature measurements. Inparticular, this paper addresses the implementation of IR thermogra-phy into the START experimental facility.
Infrared Calibration. For an opaque surface at temperature Tswith surroundings at temperature Tb, the energy balance at thesurface may be described by
I = εσT4s + (1 − ε)σT4
b (1)
where I is the total radiant energy measured by an IR detectorviewing the surface, ɛ is the emissivity of the surface, and σ is the
041013-2 / Vol. 143, APRIL 2021 Transactions of the ASME
Dow
nloaded from http://asm
edigitalcollection.asme.org/turbom
achinery/article-pdf/143/4/041013/6669743/turbo_143_4_041013.pdf by The Pennsylvania State University, Karen Thole on 13 April 2021
Stefan–Boltzmann constant. From Eq. (1), the amount of radiantenergy collected by an IR detector is affected by both the surfacetemperature, Ts, and the background temperature, Tb. However, ifthe emissivity of the surface is maximized, the impact of the back-ground temperature may be minimized. Researchers have usedcoatings to increase the emissivity of a target surface to reduce tem-perature measurement uncertainty.A commonly used high-emissivity coating is a matte paint with
previously reported emissivity values of 0.93–0.96 [3,5,24]. Twospecific high-emissivity coatings which have been used for IR ther-mography include Krylon flat black spray paint [25,26] and NextelSuede coating [27]. The emissivity of a particular Krylon spraypaint has been measured by the NASA MASTER project [28] tobe ɛ= 0.95. The Nextel Suede coating was measured by Adibekyanet al. [27] to be ɛ= 0.97.Due to the fact that these coatings are typically manually applied,
there is a likelihood for variation in thickness and emissivity. Forexample, Kerns et al. [29] showed that the application method(sprayed or brushed) and number of coats have a notable effecton optical properties. In their study, Kerns et al. measured the rela-tive reflectivity of various black paints with different applicationmethods and found that the reflectivity of Nextel Suede coatingvaried by over 50% depending on application method (spray orbrush) and number of coats. This result implies that a coatingwith an expected emissivity of ɛ = 0.95 may have an actual emis-sivity as low as ɛ= 0.90. This study emphasizes the need tomeasure the surface emissivity to ensure an accurate temperaturemeasurement.In each of the turbine cooling studies previously mentioned, the
emissivity is either deduced using an in situ thermocouple calibra-tion and Eq. (1) with a factory calibration [2–6], or the emissivity isnot measured at all. In studies with stationary targets, the in situ cal-ibration method is commonly used [2–6,24,30–32]. The in situ cal-ibration method employs temperature sensors placed on the targetsurface in the field of view of the camera. The raw value of thecamera near the temperature sensors is correlated with the surfacetemperature measurements to create a calibration curve betweenthe raw camera value of the total radiant energy and the surface tem-perature. This calibration method allows for simultaneous account-ing of background temperature effects and emissivity.When calibrating a camera for imaging rotating turbine blades,
the prospect of obtaining accurate surface temperature measure-ments is challenging. Surface-mounted thermocouples are difficultto achieve given wire routing issues and data transmission. As aresult, an in situ calibration with rotating blades requires significantcustom instrumentation. An alternate method is to calibrate the IRdetector externally as outlined by Mori et al. [17]. For the methoddescribed, a heated plate of high-thermal conductivity material iscoated with the same paint as the blades and then used to calibratethe detector. Ideally, the emissivity and background temperature arematched to that of the blade conditions. In the study by Mori et al.,an uncertainty in temperature measurement of 1–3% of full scale isreported.
Camera System and Optical AccessInfrared detector technologies fall into two categories: thermal
detectors and photon (or quantum) detectors. The off-the-shelf IRcameras for wind tunnel applications are thermal detectors, suchas uncooled microbolometers that are relatively inexpensive andhave integration times on the order of milliseconds. The integrationtime of these cameras is not generally important since time-averaged thermal images of stationary subjects are used. Photondetectors, such as InSb-based or HgCdTe (mercury cadmium tellur-ide, MCT)-based detectors, allow for integration times on the orderof microseconds. The newest generation of IR photon detectorsincludes type-II InAs/GaInSb strained-layer superlattice (SLS)architectures and also offers integration times under 1 μs [33].Table 1 shows a summary of these detectors. High-speed detectors
including InSb, MCT, and SLS have integration times on the orderof 1 μs that enable IR imaging for rotating applications.The thermal imaging system chosen for the present study is a
commercial Sofradir MiTIE MARS LW camera engine which uti-lizes a high-performance HgCdTe (MCT) IR detector that enablesmeasurements of fast-moving subjects using full-frame (320 × 240pixel) integration times of less than 1 μs. With on-chip binningand windowing, the frame rate can be increased above the specified244 Hz full-frame rate up to 130 kHz in the line-scan operation.This IR detector was integrated to create a custom-designedcamera system with optics and synchronization hardware. Thedetector operates in the LWIR band, which was chosen based onthe range of blade temperatures in the turbine facility at START.For a common main gas path temperature (122 °C), there is approx-imately twice the blackbody emissive power in the LW band as inthe MW band on the basis of Planck’s law.The non-contact approach of IR thermal imaging requires optical
accessibility, either through a viewing window or some sort oflensed probe. Flat optical windows are often used in wind tunneland cascade experiments. Optical access in turbine rigs, however,is challenging because the outer casing is cylindrical and there istypically blockage from upstream airfoils. The blockage, in partic-ular, restricts the ability to view every surface of a turbine bladefrom a single perspective, so it is beneficial to make use ofseveral views to measure the entire surface of a blade. The compro-mises and approaches that allow for optical access in an engine orrig are specific to the application and are not the main subject ofthis paper. In this regard, the detector and optics are treated as asystem that can be quantified by measurable parameters in apretest calibration setup, without requiring an understanding ofthe optical design. With this in mind, a general description of theoptical assembly is provided below.For the START test turbine, the optical access challenges were
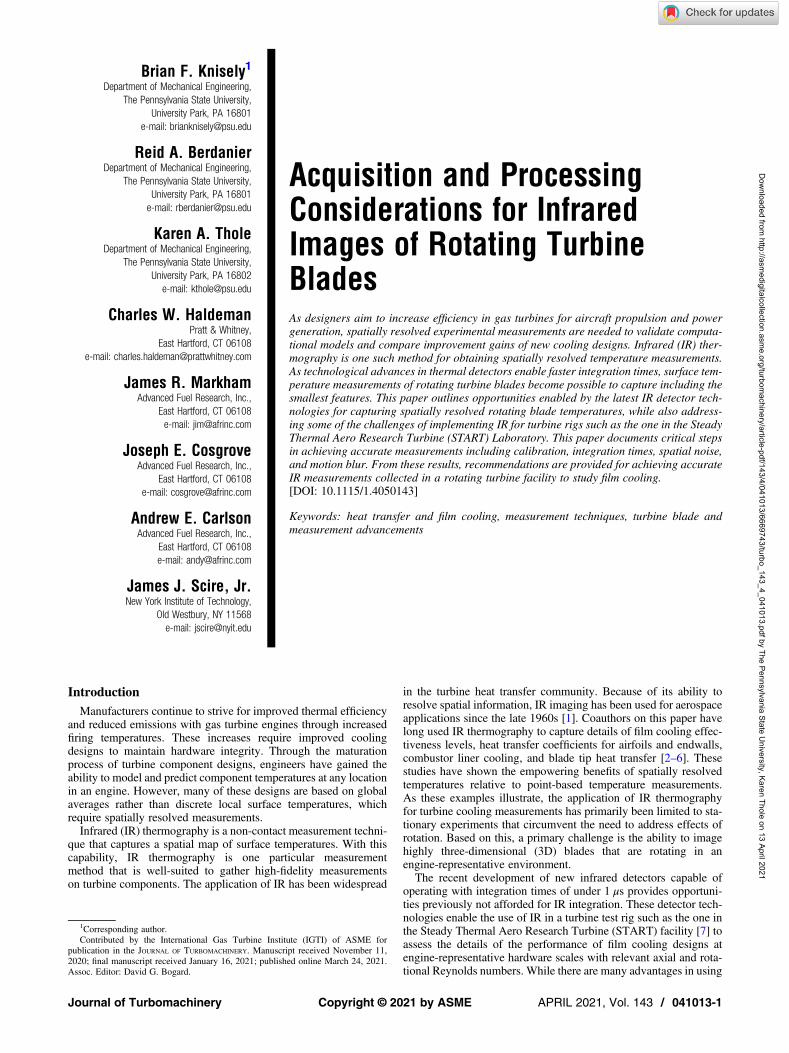
overcome through the use of a specially designed optical system.The detector is mounted in an enclosure outside of the casing,while the optical probe consists of a series of lenses and a 90 degprism that is inserted into an additively manufactured (AM) vanedesigned to enable direct viewing of the downstream blade whileminimizing probe impact on the target locations. The customvane was designed using industry-standard CFD practices withaerodynamic concerns in mind to ensure that the flowfield of theimaged blades would not be affected by the presence of the probein the vane.Figure 1 shows a notional representation of this optical access for
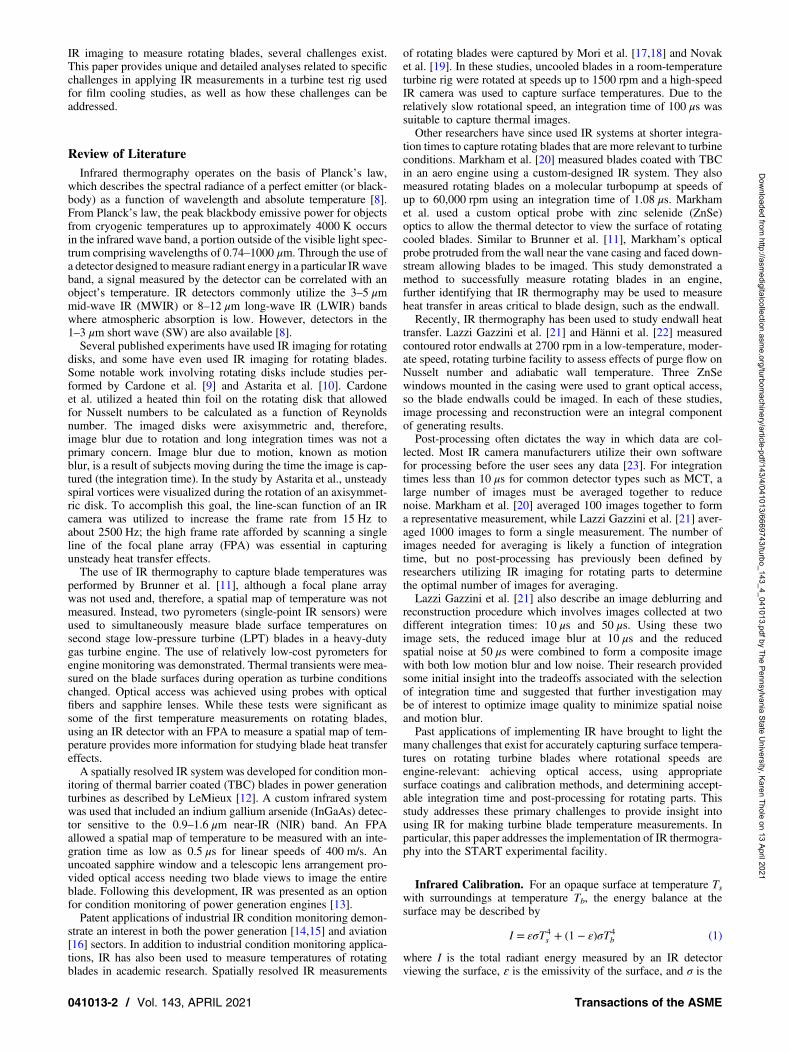
a particular blade view. By adjusting the position of the opticalprobe, the entire pressure side and leading edge of the blade isimaged, as shown in Fig. 2. The blade’s suction side is notvisible from this view. Adjacent views overlap such that phase-locked steady surface temperatures can be compared betweentests conducted at different times for different blade views. Theviews are designed to maximize blade coverage, ensuring theentire pressure side and leading edge can be imaged at viewingangles of less than 45 deg to ensure near-constant emissivity [8].Image triggering is accomplished through a custom-designed
controller that provides positional accuracy using an encodersignal from the rotating shaft and can maintain targeting evenduring engine transients. Frame rate is then dictated by the rigspeed, which is typically lower than the design frame rate of thecamera. Where speeds exceed that frame rate, the system can be
Table 1 Comparison of Infrared Detector Technologies
Detector Wave band(s) Integration time
Microbolometer [33] SW, MW, LW 1 msInSb [33] SW, MW ∼1 μsHgCdTe (MCT) [33] SW, MW, LW ∼1 μsSLS [34] LW ∼1 μs
Journal of Turbomachinery APRIL 2021, Vol. 143 / 041013-3
Dow
nloaded from http://asm
edigitalcollection.asme.org/turbom
achinery/article-pdf/143/4/041013/6669743/turbo_143_4_041013.pdf by The Pennsylvania State University, Karen Thole on 13 April 2021
designed to skip revolutions. Overall trigger timing of comparableelectronics has been measured with a standard deviation of 30 ns,which is well below the natural jitter in the rotating machinerytrigger sources.
Surface Coatings and CalibrationApplying a high-emissivity coating to the blades is essential to
reduce the effect of reflections and minimize surface temperaturemeasurement uncertainty. This is particularly important for aturbine blade row where the measurement surface sees a widevariety of background temperatures including other blades, whichmay be cooled, the casing, and even upstream into the supplypiping in the case of the START rig. The key components directlyimpacting the blade through radiative heat transfer are also coated tominimize reflections and to allow for direct temperature measure-ments to estimate the background temperature.For this study, emissivity and surface coating thicknesses were
evaluated for Krylon flat black spray paint and Nextel Suedecoating. To characterize the coatings in this study, coupons werecreated to test the emission and thickness of Krylon and Suedewith sprayed paints that consisted of three, four, or five coats. Toquantify the thickness of each coating, smooth acrylic couponsmeasuring 25.4 × 25.4 × 3 mm were painted with half of thecoupon covered in masking tape. The Krylon paint was appliedusing a spray can and the Suede coating was applied with a
pneumatic, V-nozzle spray gun at 50 psig, each at a distance ofapproximately 30 cm from the coupon and in a 20 °C, low-humidityenvironment. With these coupons, the thickness was determined byusing a Zeiss Smartzoom 5 digital 3D microscope to measure theheight of the coating relative to an uncoated section.To quantify the relative (rather than absolute) emissivity of each
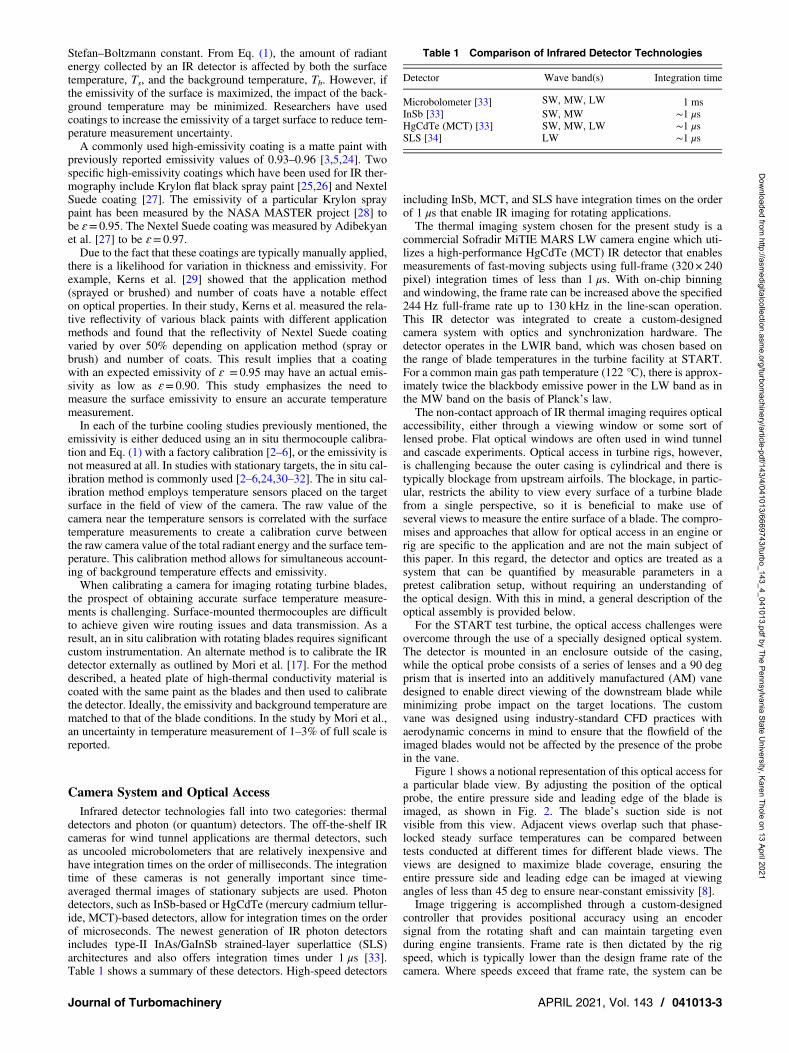
surface coating as a function of wavelength for each coating thick-ness, a set of copper coupons measuring 25.4 × 25.4 × 1 mm werecharacterized using a Bruker Vertex 70 Fourier Transform Infrared(FTIR) spectrometer. Each coupon was mounted to a copper blockwith thermocouples at the coupon interface, and a cylindrical car-tridge heater was installed in the block for temperature control.The temperature of the coupon was controlled using the heaterwith the thermocouple as feedback to reach a coupon temperatureof 100 °C, an expected blade temperature with cooling, andsteady-state conditions were achieved before collecting FTIR mea-surements. Figure 3 shows the relative emission of each sampleacross the 4–12 μm wavelength band. The relative emission Erel
is plotted as the emission of a sample divided by the emission ofSuede, three coats, which had the highest average emission. Thenoise in the 5–7 μm range is due to atmospheric absorption, butthe selected detector operates outside of these wavelengths. Fromthese measurements, the relative emissivities of each coupon wereknown, but the absolute values were not known without a referenceemission value. A custom calibrator was used to determine theabsolute emissivity of one coating as a reference value and appro-priately convert the non-normalized emission results into usableemissivities.A custom calibrator was developed for camera calibration at ele-
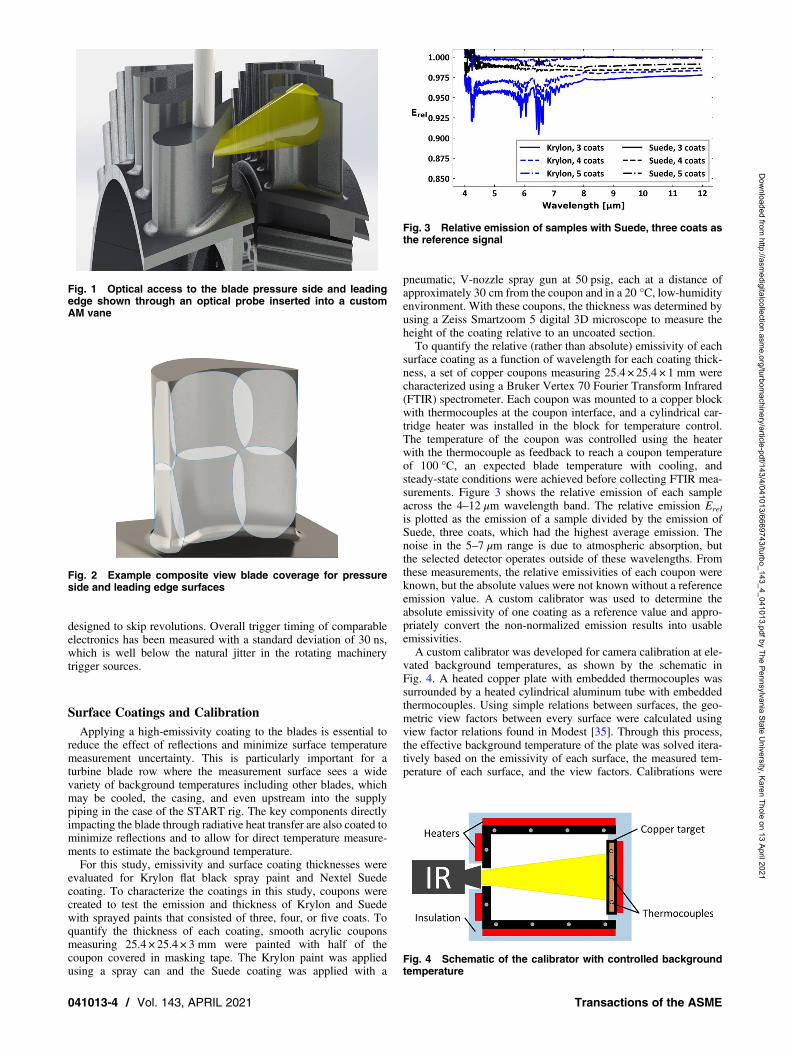
vated background temperatures, as shown by the schematic inFig. 4. A heated copper plate with embedded thermocouples wassurrounded by a heated cylindrical aluminum tube with embeddedthermocouples. Using simple relations between surfaces, the geo-metric view factors between every surface were calculated usingview factor relations found in Modest [35]. Through this process,the effective background temperature of the plate was solved itera-tively based on the emissivity of each surface, the measured tem-perature of each surface, and the view factors. Calibrations were
Fig. 2 Example composite view blade coverage for pressureside and leading edge surfaces
Fig. 3 Relative emission of samples with Suede, three coats asthe reference signal
Fig. 1 Optical access to the blade pressure side and leadingedge shown through an optical probe inserted into a customAM vane
Fig. 4 Schematic of the calibrator with controlled backgroundtemperature
041013-4 / Vol. 143, APRIL 2021 Transactions of the ASME
Dow
nloaded from http://asm
edigitalcollection.asme.org/turbom
achinery/article-pdf/143/4/041013/6669743/turbo_143_4_041013.pdf by The Pennsylvania State University, Karen Thole on 13 April 2021
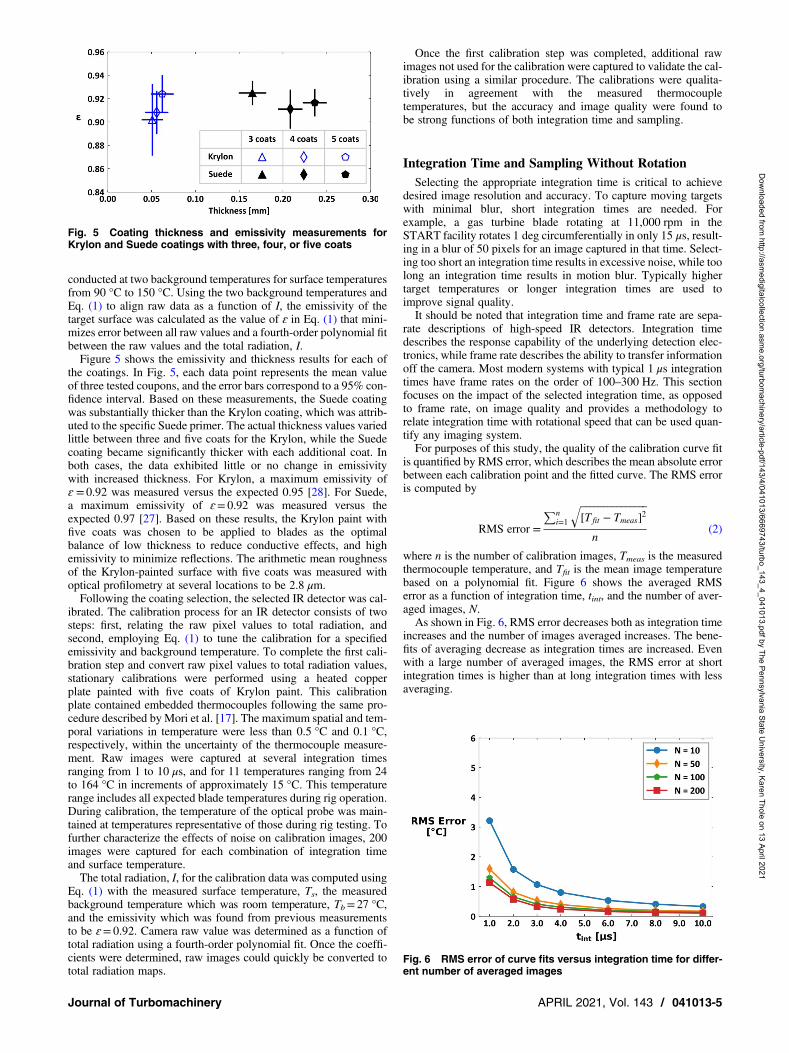
conducted at two background temperatures for surface temperaturesfrom 90 °C to 150 °C. Using the two background temperatures andEq. (1) to align raw data as a function of I, the emissivity of thetarget surface was calculated as the value of ɛ in Eq. (1) that mini-mizes error between all raw values and a fourth-order polynomial fitbetween the raw values and the total radiation, I.Figure 5 shows the emissivity and thickness results for each of
the coatings. In Fig. 5, each data point represents the mean valueof three tested coupons, and the error bars correspond to a 95% con-fidence interval. Based on these measurements, the Suede coatingwas substantially thicker than the Krylon coating, which was attrib-uted to the specific Suede primer. The actual thickness values variedlittle between three and five coats for the Krylon, while the Suedecoating became significantly thicker with each additional coat. Inboth cases, the data exhibited little or no change in emissivitywith increased thickness. For Krylon, a maximum emissivity ofɛ = 0.92 was measured versus the expected 0.95 [28]. For Suede,a maximum emissivity of ɛ= 0.92 was measured versus theexpected 0.97 [27]. Based on these results, the Krylon paint withfive coats was chosen to be applied to blades as the optimalbalance of low thickness to reduce conductive effects, and highemissivity to minimize reflections. The arithmetic mean roughnessof the Krylon-painted surface with five coats was measured withoptical profilometry at several locations to be 2.8 μm.Following the coating selection, the selected IR detector was cal-
ibrated. The calibration process for an IR detector consists of twosteps: first, relating the raw pixel values to total radiation, andsecond, employing Eq. (1) to tune the calibration for a specifiedemissivity and background temperature. To complete the first cali-bration step and convert raw pixel values to total radiation values,stationary calibrations were performed using a heated copperplate painted with five coats of Krylon paint. This calibrationplate contained embedded thermocouples following the same pro-cedure described by Mori et al. [17]. The maximum spatial and tem-poral variations in temperature were less than 0.5 °C and 0.1 °C,respectively, within the uncertainty of the thermocouple measure-ment. Raw images were captured at several integration timesranging from 1 to 10 μs, and for 11 temperatures ranging from 24to 164 °C in increments of approximately 15 °C. This temperaturerange includes all expected blade temperatures during rig operation.During calibration, the temperature of the optical probe was main-tained at temperatures representative of those during rig testing. Tofurther characterize the effects of noise on calibration images, 200images were captured for each combination of integration timeand surface temperature.The total radiation, I, for the calibration data was computed using
Eq. (1) with the measured surface temperature, Ts, the measuredbackground temperature which was room temperature, Tb= 27 °C,and the emissivity which was found from previous measurementsto be ɛ= 0.92. Camera raw value was determined as a function oftotal radiation using a fourth-order polynomial fit. Once the coeffi-cients were determined, raw images could quickly be converted tototal radiation maps.
Once the first calibration step was completed, additional rawimages not used for the calibration were captured to validate the cal-ibration using a similar procedure. The calibrations were qualita-tively in agreement with the measured thermocoupletemperatures, but the accuracy and image quality were found tobe strong functions of both integration time and sampling.
Integration Time and Sampling Without RotationSelecting the appropriate integration time is critical to achieve
desired image resolution and accuracy. To capture moving targetswith minimal blur, short integration times are needed. Forexample, a gas turbine blade rotating at 11,000 rpm in theSTART facility rotates 1 deg circumferentially in only 15 μs, result-ing in a blur of 50 pixels for an image captured in that time. Select-ing too short an integration time results in excessive noise, while toolong an integration time results in motion blur. Typically highertarget temperatures or longer integration times are used toimprove signal quality.It should be noted that integration time and frame rate are sepa-
rate descriptions of high-speed IR detectors. Integration timedescribes the response capability of the underlying detection elec-tronics, while frame rate describes the ability to transfer informationoff the camera. Most modern systems with typical 1 μs integrationtimes have frame rates on the order of 100–300 Hz. This sectionfocuses on the impact of the selected integration time, as opposedto frame rate, on image quality and provides a methodology torelate integration time with rotational speed that can be used quan-tify any imaging system.For purposes of this study, the quality of the calibration curve fit
is quantified by RMS error, which describes the mean absolute errorbetween each calibration point and the fitted curve. The RMS erroris computed by
RMS error =
∑ni=1
���������������[T fit − Tmeas]2
√n
(2)
where n is the number of calibration images, Tmeas is the measuredthermocouple temperature, and Tfit is the mean image temperaturebased on a polynomial fit. Figure 6 shows the averaged RMSerror as a function of integration time, tint, and the number of aver-aged images, N.As shown in Fig. 6, RMS error decreases both as integration time
increases and the number of images averaged increases. The bene-fits of averaging decrease as integration times are increased. Evenwith a large number of averaged images, the RMS error at shortintegration times is higher than at long integration times with lessaveraging.
Fig. 5 Coating thickness and emissivity measurements forKrylon and Suede coatings with three, four, or five coats
Fig. 6 RMS error of curve fits versus integration time for differ-ent number of averaged images
Journal of Turbomachinery APRIL 2021, Vol. 143 / 041013-5
Dow
nloaded from http://asm
edigitalcollection.asme.org/turbom
achinery/article-pdf/143/4/041013/6669743/turbo_143_4_041013.pdf by The Pennsylvania State University, Karen Thole on 13 April 2021
Another important image quality parameter to quantify is thespatial noise, sT, defined as the standard deviation in temperatureof all pixels when an isothermal surface is imaged
sT =
����������������∑mi=1 (Ti − �T)2
m − 1
√(3)
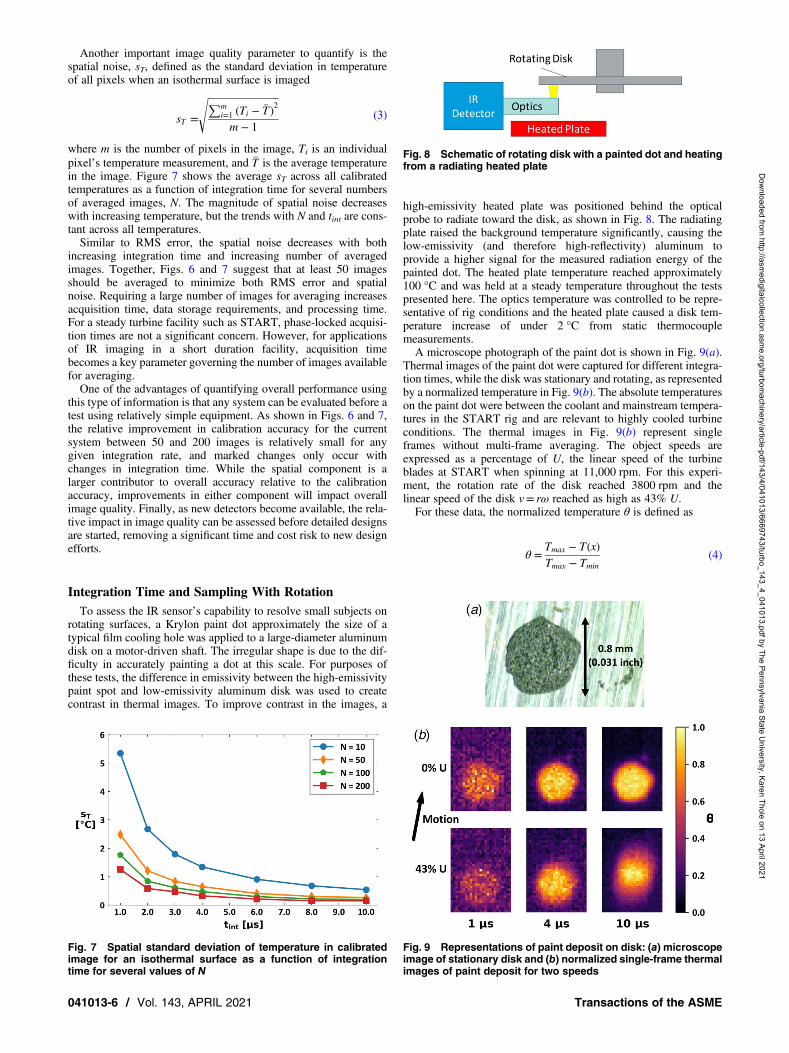
where m is the number of pixels in the image, Ti is an individualpixel’s temperature measurement, and �T is the average temperaturein the image. Figure 7 shows the average sT across all calibratedtemperatures as a function of integration time for several numbersof averaged images, N. The magnitude of spatial noise decreaseswith increasing temperature, but the trends with N and tint are cons-tant across all temperatures.Similar to RMS error, the spatial noise decreases with both
increasing integration time and increasing number of averagedimages. Together, Figs. 6 and 7 suggest that at least 50 imagesshould be averaged to minimize both RMS error and spatialnoise. Requiring a large number of images for averaging increasesacquisition time, data storage requirements, and processing time.For a steady turbine facility such as START, phase-locked acquisi-tion times are not a significant concern. However, for applicationsof IR imaging in a short duration facility, acquisition timebecomes a key parameter governing the number of images availablefor averaging.One of the advantages of quantifying overall performance using
this type of information is that any system can be evaluated before atest using relatively simple equipment. As shown in Figs. 6 and 7,the relative improvement in calibration accuracy for the currentsystem between 50 and 200 images is relatively small for anygiven integration rate, and marked changes only occur withchanges in integration time. While the spatial component is alarger contributor to overall accuracy relative to the calibrationaccuracy, improvements in either component will impact overallimage quality. Finally, as new detectors become available, the rela-tive impact in image quality can be assessed before detailed designsare started, removing a significant time and cost risk to new designefforts.
Integration Time and Sampling With RotationTo assess the IR sensor’s capability to resolve small subjects on
rotating surfaces, a Krylon paint dot approximately the size of atypical film cooling hole was applied to a large-diameter aluminumdisk on a motor-driven shaft. The irregular shape is due to the dif-ficulty in accurately painting a dot at this scale. For purposes ofthese tests, the difference in emissivity between the high-emissivitypaint spot and low-emissivity aluminum disk was used to createcontrast in thermal images. To improve contrast in the images, a
high-emissivity heated plate was positioned behind the opticalprobe to radiate toward the disk, as shown in Fig. 8. The radiatingplate raised the background temperature significantly, causing thelow-emissivity (and therefore high-reflectivity) aluminum toprovide a higher signal for the measured radiation energy of thepainted dot. The heated plate temperature reached approximately100 °C and was held at a steady temperature throughout the testspresented here. The optics temperature was controlled to be repre-sentative of rig conditions and the heated plate caused a disk tem-perature increase of under 2 °C from static thermocouplemeasurements.A microscope photograph of the paint dot is shown in Fig. 9(a).
Thermal images of the paint dot were captured for different integra-tion times, while the disk was stationary and rotating, as representedby a normalized temperature in Fig. 9(b). The absolute temperatureson the paint dot were between the coolant and mainstream tempera-tures in the START rig and are relevant to highly cooled turbineconditions. The thermal images in Fig. 9(b) represent singleframes without multi-frame averaging. The object speeds areexpressed as a percentage of U, the linear speed of the turbineblades at START when spinning at 11,000 rpm. For this experi-ment, the rotation rate of the disk reached 3800 rpm and thelinear speed of the disk v= rω reached as high as 43% U.For these data, the normalized temperature θ is defined as
θ =Tmax − T(x)Tmax − Tmin
(4)
Fig. 7 Spatial standard deviation of temperature in calibratedimage for an isothermal surface as a function of integrationtime for several values of N
Fig. 8 Schematic of rotating disk with a painted dot and heatingfrom a radiating heated plate
Fig. 9 Representations of paint deposit on disk: (a) microscopeimage of stationary disk and (b) normalized single-frame thermalimages of paint deposit for two speeds
041013-6 / Vol. 143, APRIL 2021 Transactions of the ASME
Dow
nloaded from http://asm
edigitalcollection.asme.org/turbom
achinery/article-pdf/143/4/041013/6669743/turbo_143_4_041013.pdf by The Pennsylvania State University, Karen Thole on 13 April 2021
such that θ= 1 corresponds to the minimum temperature in theimage and θ= 0 corresponds to the maximum temperature.As shown by the vector in Fig. 9(b), the direction of motion is
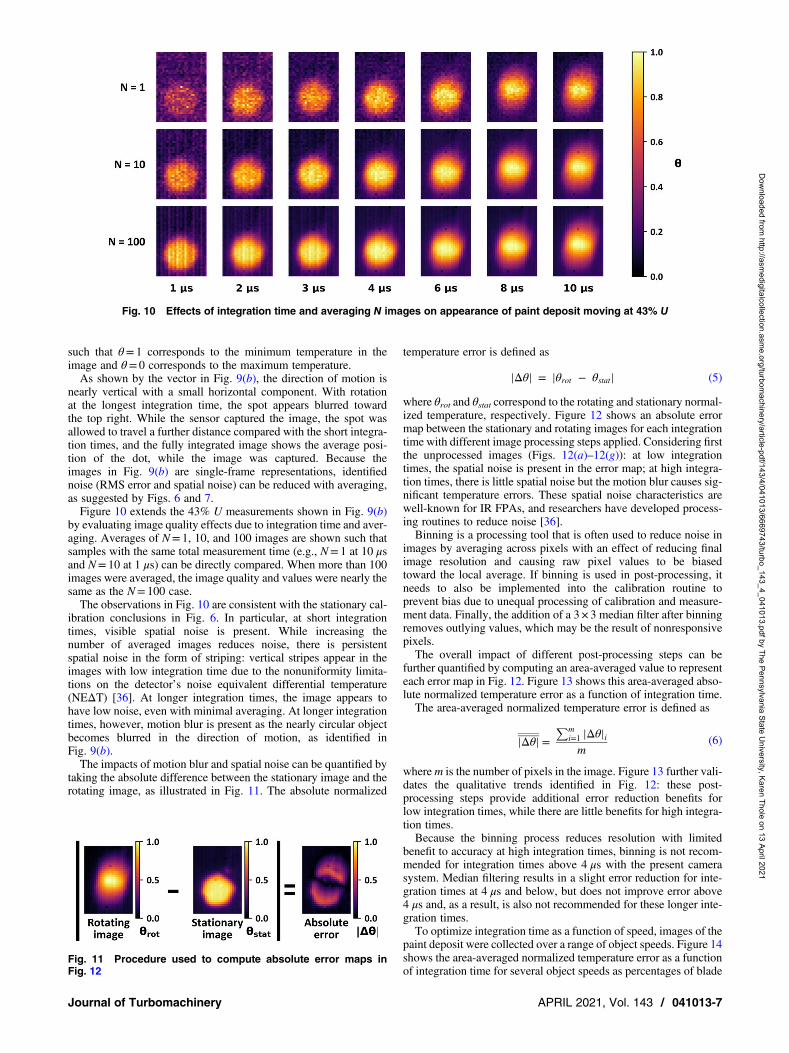
nearly vertical with a small horizontal component. With rotationat the longest integration time, the spot appears blurred towardthe top right. While the sensor captured the image, the spot wasallowed to travel a further distance compared with the short integra-tion times, and the fully integrated image shows the average posi-tion of the dot, while the image was captured. Because theimages in Fig. 9(b) are single-frame representations, identifiednoise (RMS error and spatial noise) can be reduced with averaging,as suggested by Figs. 6 and 7.Figure 10 extends the 43% U measurements shown in Fig. 9(b)
by evaluating image quality effects due to integration time and aver-aging. Averages of N= 1, 10, and 100 images are shown such thatsamples with the same total measurement time (e.g., N= 1 at 10 μsand N= 10 at 1 μs) can be directly compared. When more than 100images were averaged, the image quality and values were nearly thesame as the N= 100 case.The observations in Fig. 10 are consistent with the stationary cal-
ibration conclusions in Fig. 6. In particular, at short integrationtimes, visible spatial noise is present. While increasing thenumber of averaged images reduces noise, there is persistentspatial noise in the form of striping: vertical stripes appear in theimages with low integration time due to the nonuniformity limita-tions on the detector’s noise equivalent differential temperature(NEΔT) [36]. At longer integration times, the image appears tohave low noise, even with minimal averaging. At longer integrationtimes, however, motion blur is present as the nearly circular objectbecomes blurred in the direction of motion, as identified inFig. 9(b).The impacts of motion blur and spatial noise can be quantified by
taking the absolute difference between the stationary image and therotating image, as illustrated in Fig. 11. The absolute normalized
temperature error is defined as
|Δθ| = |θrot − θstat| (5)
where θrot and θstat correspond to the rotating and stationary normal-ized temperature, respectively. Figure 12 shows an absolute errormap between the stationary and rotating images for each integrationtime with different image processing steps applied. Considering firstthe unprocessed images (Figs. 12(a)–12(g)): at low integrationtimes, the spatial noise is present in the error map; at high integra-tion times, there is little spatial noise but the motion blur causes sig-nificant temperature errors. These spatial noise characteristics arewell-known for IR FPAs, and researchers have developed process-ing routines to reduce noise [36].Binning is a processing tool that is often used to reduce noise in
images by averaging across pixels with an effect of reducing finalimage resolution and causing raw pixel values to be biasedtoward the local average. If binning is used in post-processing, itneeds to also be implemented into the calibration routine toprevent bias due to unequal processing of calibration and measure-ment data. Finally, the addition of a 3 × 3 median filter after binningremoves outlying values, which may be the result of nonresponsivepixels.The overall impact of different post-processing steps can be
further quantified by computing an area-averaged value to representeach error map in Fig. 12. Figure 13 shows this area-averaged abso-lute normalized temperature error as a function of integration time.The area-averaged normalized temperature error is defined as
|Δθ| =∑m
i=1 |Δθ|im
(6)
wherem is the number of pixels in the image. Figure 13 further vali-dates the qualitative trends identified in Fig. 12: these post-processing steps provide additional error reduction benefits forlow integration times, while there are little benefits for high integra-tion times.Because the binning process reduces resolution with limited
benefit to accuracy at high integration times, binning is not recom-mended for integration times above 4 μs with the present camerasystem. Median filtering results in a slight error reduction for inte-gration times at 4 μs and below, but does not improve error above4 μs and, as a result, is also not recommended for these longer inte-gration times.To optimize integration time as a function of speed, images of the
paint deposit were collected over a range of object speeds. Figure 14shows the area-averaged normalized temperature error as a functionof integration time for several object speeds as percentages of blade
Fig. 10 Effects of integration time and averaging N images on appearance of paint deposit moving at 43% U
Fig. 11 Procedure used to compute absolute error maps inFig. 12
Journal of Turbomachinery APRIL 2021, Vol. 143 / 041013-7
Dow
nloaded from http://asm
edigitalcollection.asme.org/turbom
achinery/article-pdf/143/4/041013/6669743/turbo_143_4_041013.pdf by The Pennsylvania State University, Karen Thole on 13 April 2021
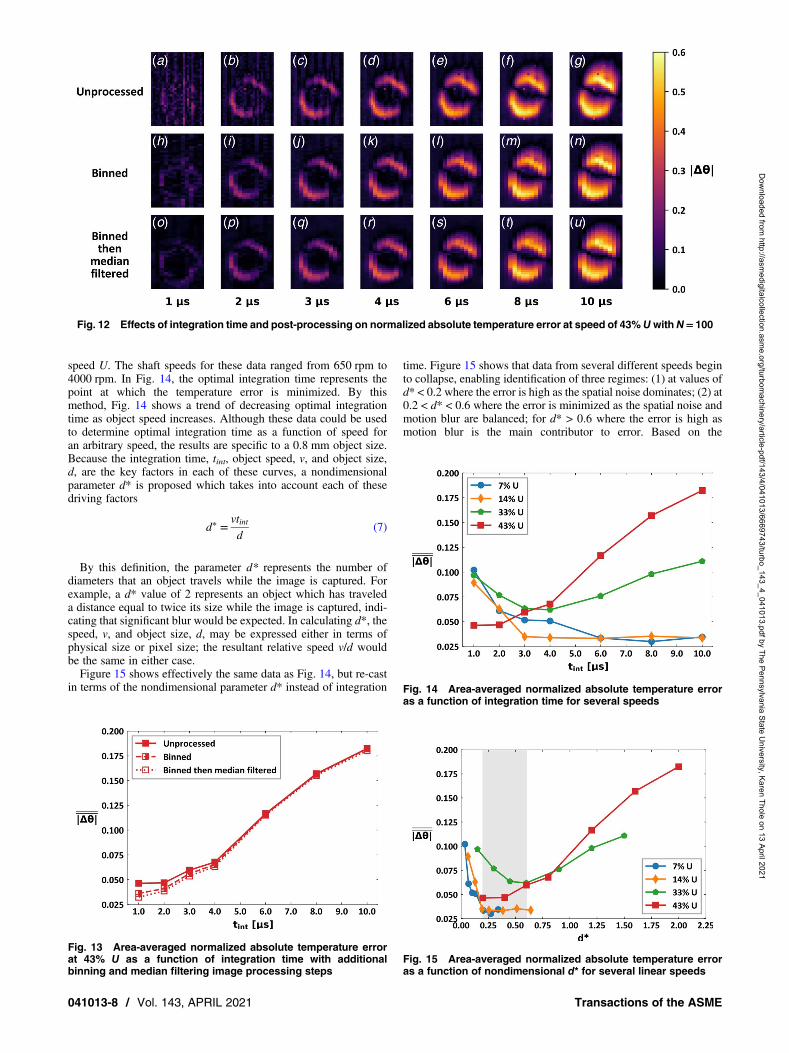
speed U. The shaft speeds for these data ranged from 650 rpm to4000 rpm. In Fig. 14, the optimal integration time represents thepoint at which the temperature error is minimized. By thismethod, Fig. 14 shows a trend of decreasing optimal integrationtime as object speed increases. Although these data could be usedto determine optimal integration time as a function of speed foran arbitrary speed, the results are specific to a 0.8 mm object size.Because the integration time, tint, object speed, v, and object size,d, are the key factors in each of these curves, a nondimensionalparameter d* is proposed which takes into account each of thesedriving factors
d∗ =vtintd
(7)
By this definition, the parameter d* represents the number ofdiameters that an object travels while the image is captured. Forexample, a d* value of 2 represents an object which has traveleda distance equal to twice its size while the image is captured, indi-cating that significant blur would be expected. In calculating d*, thespeed, v, and object size, d, may be expressed either in terms ofphysical size or pixel size; the resultant relative speed v/d wouldbe the same in either case.Figure 15 shows effectively the same data as Fig. 14, but re-cast
in terms of the nondimensional parameter d* instead of integration
time. Figure 15 shows that data from several different speeds beginto collapse, enabling identification of three regimes: (1) at values ofd* < 0.2 where the error is high as the spatial noise dominates; (2) at0.2 < d* < 0.6 where the error is minimized as the spatial noise andmotion blur are balanced; for d* > 0.6 where the error is high asmotion blur is the main contributor to error. Based on the
Fig. 12 Effects of integration time and post-processing on normalized absolute temperature error at speed of 43%Uwith N=100
Fig. 13 Area-averaged normalized absolute temperature errorat 43% U as a function of integration time with additionalbinning and median filtering image processing steps
Fig. 14 Area-averaged normalized absolute temperature erroras a function of integration time for several speeds
Fig. 15 Area-averaged normalized absolute temperature erroras a function of nondimensional d* for several linear speeds
041013-8 / Vol. 143, APRIL 2021 Transactions of the ASME
Dow
nloaded from http://asm
edigitalcollection.asme.org/turbom
achinery/article-pdf/143/4/041013/6669743/turbo_143_4_041013.pdf by The Pennsylvania State University, Karen Thole on 13 April 2021
information in Fig. 15, a value of d* between 0.2 and 0.6 is recom-mended for the particular imaging system evaluated in this study.For example, if a gas turbine blade is rotating at 11,000 rpm at aradius of 0.3 m (v= 346 m/s) and feature resolution of d= 0.8 mmis desired, (3) the recommended d* values would yield recom-mended integration times of 0.5–1.4 μs.While the recommended values for d* would vary with each
camera system as noise levels continue to decrease with improveddetector technologies, this method can be used to benchmark differ-ent cameras to compare performance at capturing moving objectsand determine the integration time that optimally balances motionblur and spatial noise for a particular application. In addition tothe spatial noise and motion blur which are both taken intoaccount by |Δθ|, the RMS error in calibration curve fitting shouldalso be considered before selecting an integration time. Theoptimal integration time would balance all three factors: spatialnoise, motion blur, and RMS calibration error.
Projected Motion Blur on Film CoolingOne of the key cooling features of turbine airfoils is film cooling
holes that eject coolant onto the surface. To evaluate the effects ofmotion blur from the chosen camera on film cooling effectivenessmeasurements, projected errors were calculated using data for abaseline shaped hole published by Schroeder and Thole [37]. Themotion blur was simulated corresponding to two different valuesof d*. The magnitude of the motion blur (in pixels) for a givenobject speed was generated by applying blur to stationary imagesand comparing the results to measured rotating images. The selectedmagnitude for each speed minimized error between the simulatedand rotating images. Motion blur was applied in several directionsof motion including 0 deg (motion in the flow direction), 30 deg,45 deg, 60 deg, and 90 deg.Schroeder and Thole [37] utilized scaled-up film cooling holes to
collect high-resolution effectiveness measurements. Since the d*parameter is normalized based on the object size d, the motionblur applied to the temperature map was scaled based on the sizeof the cooling hole in pixels. The following results are generalizedto holes of any size, as the error due to motion blur is not dependentsolely on hole size, but depends on object speed and integrationtime as well. For example, a value of d*= 2.0 would correspondto imaging a 2 mm object on a blade traveling at 11,000 rpm at aradius of 0.3 m (v= 346 m/s) using an integration time of 12 μsor d*= 2.0 would equally correspond to imaging a 1 mm objectat the same speed using an integration time of 6 μs. To quantifythe motion blur, the difference in effectiveness Δη is defined as
Δη = η – ηref (8)
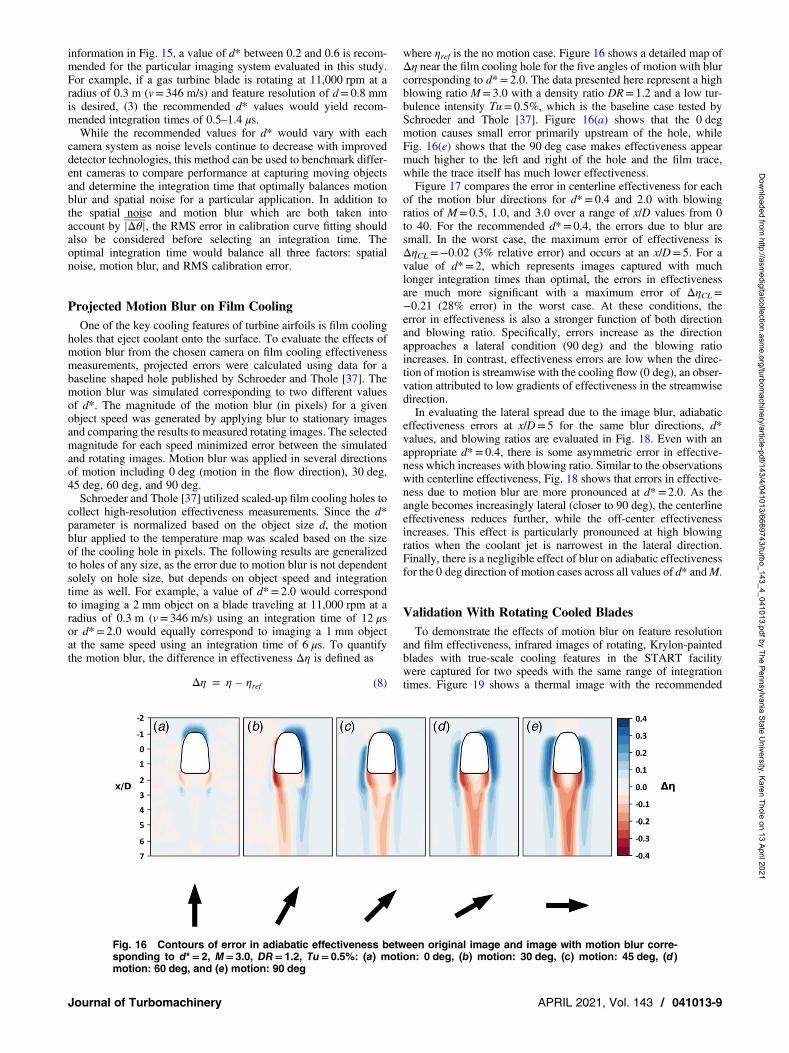
where ηref is the no motion case. Figure 16 shows a detailed map ofΔη near the film cooling hole for the five angles of motion with blurcorresponding to d*= 2.0. The data presented here represent a highblowing ratio M= 3.0 with a density ratio DR= 1.2 and a low tur-bulence intensity Tu= 0.5%, which is the baseline case tested bySchroeder and Thole [37]. Figure 16(a) shows that the 0 degmotion causes small error primarily upstream of the hole, whileFig. 16(e) shows that the 90 deg case makes effectiveness appearmuch higher to the left and right of the hole and the film trace,while the trace itself has much lower effectiveness.Figure 17 compares the error in centerline effectiveness for each
of the motion blur directions for d*= 0.4 and 2.0 with blowingratios of M= 0.5, 1.0, and 3.0 over a range of x/D values from 0to 40. For the recommended d*= 0.4, the errors due to blur aresmall. In the worst case, the maximum error of effectiveness isΔηCL=−0.02 (3% relative error) and occurs at an x/D= 5. For avalue of d*= 2, which represents images captured with muchlonger integration times than optimal, the errors in effectivenessare much more significant with a maximum error of ΔηCL=−0.21 (28% error) in the worst case. At these conditions, theerror in effectiveness is also a stronger function of both directionand blowing ratio. Specifically, errors increase as the directionapproaches a lateral condition (90 deg) and the blowing ratioincreases. In contrast, effectiveness errors are low when the direc-tion of motion is streamwise with the cooling flow (0 deg), an obser-vation attributed to low gradients of effectiveness in the streamwisedirection.In evaluating the lateral spread due to the image blur, adiabatic
effectiveness errors at x/D= 5 for the same blur directions, d*values, and blowing ratios are evaluated in Fig. 18. Even with anappropriate d*= 0.4, there is some asymmetric error in effective-ness which increases with blowing ratio. Similar to the observationswith centerline effectiveness, Fig. 18 shows that errors in effective-ness due to motion blur are more pronounced at d*= 2.0. As theangle becomes increasingly lateral (closer to 90 deg), the centerlineeffectiveness reduces further, while the off-center effectivenessincreases. This effect is particularly pronounced at high blowingratios when the coolant jet is narrowest in the lateral direction.Finally, there is a negligible effect of blur on adiabatic effectivenessfor the 0 deg direction of motion cases across all values of d* andM.
Validation With Rotating Cooled BladesTo demonstrate the effects of motion blur on feature resolution
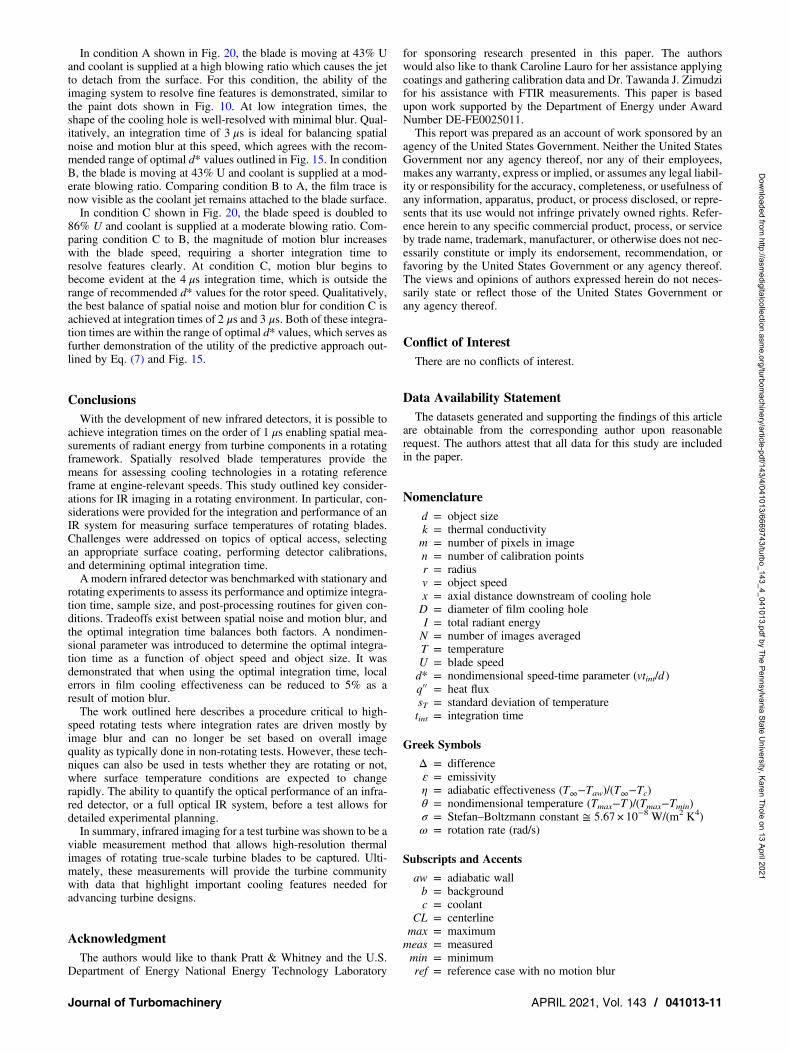
and film effectiveness, infrared images of rotating, Krylon-paintedblades with true-scale cooling features in the START facilitywere captured for two speeds with the same range of integrationtimes. Figure 19 shows a thermal image with the recommended
Fig. 16 Contours of error in adiabatic effectiveness between original image and image with motion blur corre-sponding to d*=2, M=3.0, DR=1.2, Tu=0.5%: (a) motion: 0 deg, (b) motion: 30 deg, (c) motion: 45 deg, (d )motion: 60 deg, and (e) motion: 90 deg
Journal of Turbomachinery APRIL 2021, Vol. 143 / 041013-9
Dow
nloaded from http://asm
edigitalcollection.asme.org/turbom
achinery/article-pdf/143/4/041013/6669743/turbo_143_4_041013.pdf by The Pennsylvania State University, Karen Thole on 13 April 2021
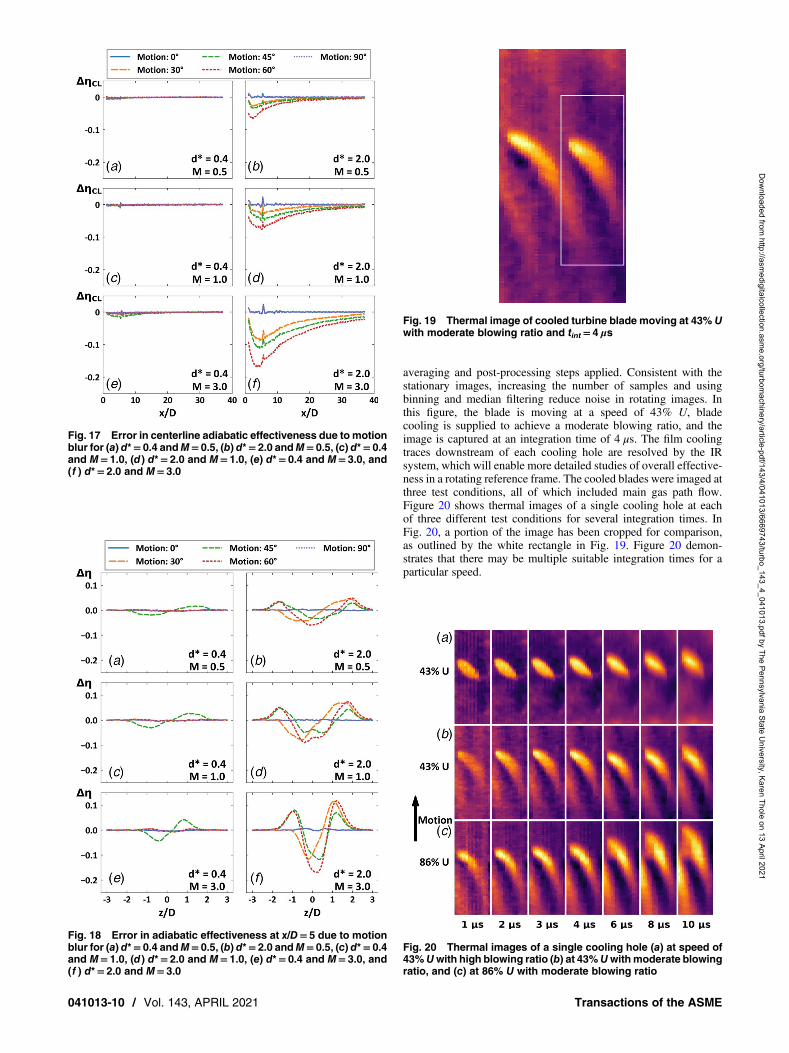
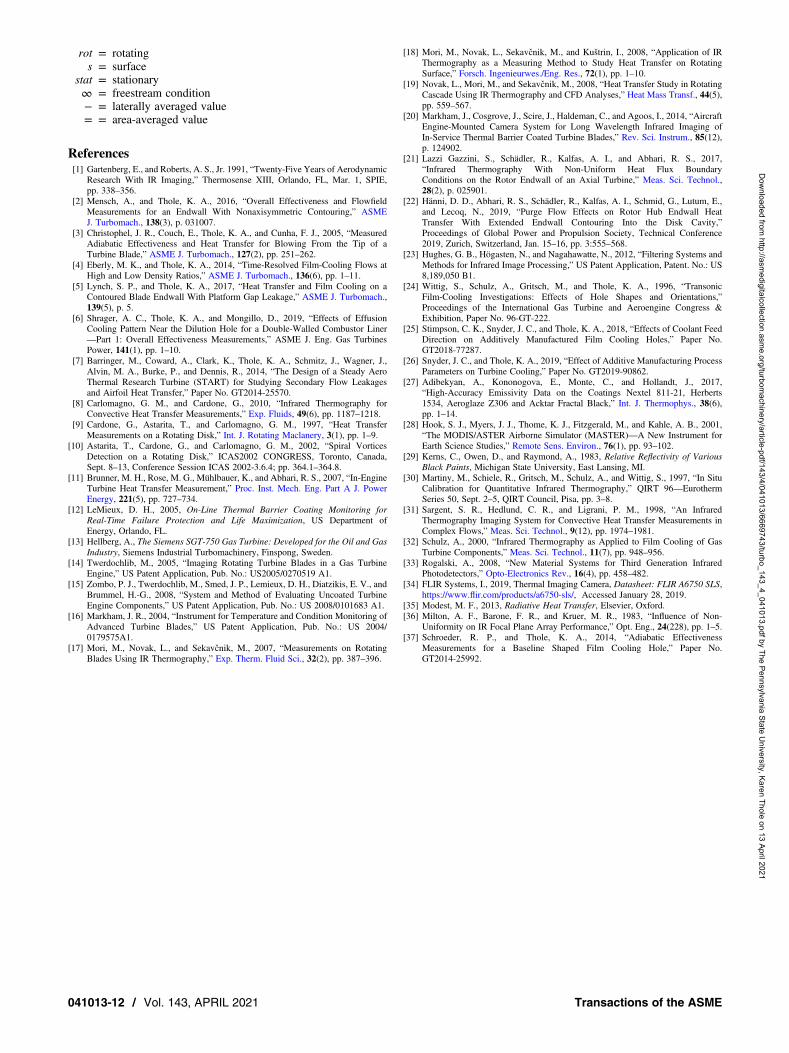
averaging and post-processing steps applied. Consistent with thestationary images, increasing the number of samples and usingbinning and median filtering reduce noise in rotating images. Inthis figure, the blade is moving at a speed of 43% U, bladecooling is supplied to achieve a moderate blowing ratio, and theimage is captured at an integration time of 4 μs. The film coolingtraces downstream of each cooling hole are resolved by the IRsystem, which will enable more detailed studies of overall effective-ness in a rotating reference frame. The cooled blades were imaged atthree test conditions, all of which included main gas path flow.Figure 20 shows thermal images of a single cooling hole at eachof three different test conditions for several integration times. InFig. 20, a portion of the image has been cropped for comparison,as outlined by the white rectangle in Fig. 19. Figure 20 demon-strates that there may be multiple suitable integration times for aparticular speed.
Fig. 18 Error in adiabatic effectiveness at x/D=5 due to motionblur for (a) d*=0.4 andM=0.5, (b) d*=2.0 andM=0.5, (c) d*=0.4and M=1.0, (d ) d*=2.0 and M=1.0, (e) d*=0.4 and M=3.0, and(f ) d*=2.0 and M=3.0
Fig. 19 Thermal image of cooled turbine blade moving at 43% Uwith moderate blowing ratio and tint= 4 μs
Fig. 20 Thermal images of a single cooling hole (a) at speed of43%Uwith high blowing ratio (b) at 43%Uwithmoderate blowingratio, and (c) at 86% U with moderate blowing ratio
Fig. 17 Error in centerline adiabatic effectiveness due to motionblur for (a) d*=0.4 andM=0.5, (b) d*=2.0 andM=0.5, (c) d*=0.4and M=1.0, (d ) d*=2.0 and M=1.0, (e) d*=0.4 and M=3.0, and(f ) d*=2.0 and M=3.0
041013-10 / Vol. 143, APRIL 2021 Transactions of the ASME
Dow
nloaded from http://asm
edigitalcollection.asme.org/turbom
achinery/article-pdf/143/4/041013/6669743/turbo_143_4_041013.pdf by The Pennsylvania State University, Karen Thole on 13 April 2021
In condition A shown in Fig. 20, the blade is moving at 43% Uand coolant is supplied at a high blowing ratio which causes the jetto detach from the surface. For this condition, the ability of theimaging system to resolve fine features is demonstrated, similar tothe paint dots shown in Fig. 10. At low integration times, theshape of the cooling hole is well-resolved with minimal blur. Qual-itatively, an integration time of 3 μs is ideal for balancing spatialnoise and motion blur at this speed, which agrees with the recom-mended range of optimal d* values outlined in Fig. 15. In conditionB, the blade is moving at 43% U and coolant is supplied at a mod-erate blowing ratio. Comparing condition B to A, the film trace isnow visible as the coolant jet remains attached to the blade surface.In condition C shown in Fig. 20, the blade speed is doubled to
86% U and coolant is supplied at a moderate blowing ratio. Com-paring condition C to B, the magnitude of motion blur increaseswith the blade speed, requiring a shorter integration time toresolve features clearly. At condition C, motion blur begins tobecome evident at the 4 μs integration time, which is outside therange of recommended d* values for the rotor speed. Qualitatively,the best balance of spatial noise and motion blur for condition C isachieved at integration times of 2 μs and 3 μs. Both of these integra-tion times are within the range of optimal d* values, which serves asfurther demonstration of the utility of the predictive approach out-lined by Eq. (7) and Fig. 15.
ConclusionsWith the development of new infrared detectors, it is possible to
achieve integration times on the order of 1 μs enabling spatial mea-surements of radiant energy from turbine components in a rotatingframework. Spatially resolved blade temperatures provide themeans for assessing cooling technologies in a rotating referenceframe at engine-relevant speeds. This study outlined key consider-ations for IR imaging in a rotating environment. In particular, con-siderations were provided for the integration and performance of anIR system for measuring surface temperatures of rotating blades.Challenges were addressed on topics of optical access, selectingan appropriate surface coating, performing detector calibrations,and determining optimal integration time.A modern infrared detector was benchmarked with stationary and
rotating experiments to assess its performance and optimize integra-tion time, sample size, and post-processing routines for given con-ditions. Tradeoffs exist between spatial noise and motion blur, andthe optimal integration time balances both factors. A nondimen-sional parameter was introduced to determine the optimal integra-tion time as a function of object speed and object size. It wasdemonstrated that when using the optimal integration time, localerrors in film cooling effectiveness can be reduced to 5% as aresult of motion blur.The work outlined here describes a procedure critical to high-
speed rotating tests where integration rates are driven mostly byimage blur and can no longer be set based on overall imagequality as typically done in non-rotating tests. However, these tech-niques can also be used in tests whether they are rotating or not,where surface temperature conditions are expected to changerapidly. The ability to quantify the optical performance of an infra-red detector, or a full optical IR system, before a test allows fordetailed experimental planning.In summary, infrared imaging for a test turbine was shown to be a
viable measurement method that allows high-resolution thermalimages of rotating true-scale turbine blades to be captured. Ulti-mately, these measurements will provide the turbine communitywith data that highlight important cooling features needed foradvancing turbine designs.
AcknowledgmentThe authors would like to thank Pratt & Whitney and the U.S.
Department of Energy National Energy Technology Laboratory
for sponsoring research presented in this paper. The authorswould also like to thank Caroline Lauro for her assistance applyingcoatings and gathering calibration data and Dr. Tawanda J. Zimudzifor his assistance with FTIR measurements. This paper is basedupon work supported by the Department of Energy under AwardNumber DE-FE0025011.This report was prepared as an account of work sponsored by an
agency of the United States Government. Neither the United StatesGovernment nor any agency thereof, nor any of their employees,makes any warranty, express or implied, or assumes any legal liabil-ity or responsibility for the accuracy, completeness, or usefulness ofany information, apparatus, product, or process disclosed, or repre-sents that its use would not infringe privately owned rights. Refer-ence herein to any specific commercial product, process, or serviceby trade name, trademark, manufacturer, or otherwise does not nec-essarily constitute or imply its endorsement, recommendation, orfavoring by the United States Government or any agency thereof.The views and opinions of authors expressed herein do not neces-sarily state or reflect those of the United States Government orany agency thereof.
Conflict of InterestThere are no conflicts of interest.
Data Availability StatementThe datasets generated and supporting the findings of this article
are obtainable from the corresponding author upon reasonablerequest. The authors attest that all data for this study are includedin the paper.
Nomenclatured = object sizek = thermal conductivitym = number of pixels in imagen = number of calibration pointsr = radiusv = object speedx = axial distance downstream of cooling holeD = diameter of film cooling holeI = total radiant energyN = number of images averagedT = temperatureU = blade speedd* = nondimensional speed-time parameter (vtint/d )q′′ = heat fluxsT = standard deviation of temperaturetint = integration time
Greek Symbols
Δ = differenceɛ = emissivityη = adiabatic effectiveness (T∞−Taw)/(T∞−Tc)θ = nondimensional temperature (Tmax−T )/(Tmax−Tmin)σ = Stefan–Boltzmann constant ≅ 5.67 × 10⁻⁸ W/(m2 K4)ω = rotation rate (rad/s)
Subscripts and Accents
aw = adiabatic wallb = backgroundc = coolant
CL = centerlinemax = maximummeas = measuredmin = minimumref = reference case with no motion blur
Journal of Turbomachinery APRIL 2021, Vol. 143 / 041013-11
Dow
nloaded from http://asm
edigitalcollection.asme.org/turbom
achinery/article-pdf/143/4/041013/6669743/turbo_143_4_041013.pdf by The Pennsylvania State University, Karen Thole on 13 April 2021
rot = rotatings = surface
stat = stationary∞ = freestream condition− = laterally averaged value= = area-averaged value
References[1] Gartenberg, E., and Roberts, A. S., Jr. 1991, “Twenty-Five Years of Aerodynamic
Research With IR Imaging,” Thermosense XIII, Orlando, FL, Mar. 1, SPIE,pp. 338–356.
[2] Mensch, A., and Thole, K. A., 2016, “Overall Effectiveness and FlowfieldMeasurements for an Endwall With Nonaxisymmetric Contouring,” ASMEJ. Turbomach., 138(3), p. 031007.
[3] Christophel, J. R., Couch, E., Thole, K. A., and Cunha, F. J., 2005, “MeasuredAdiabatic Effectiveness and Heat Transfer for Blowing From the Tip of aTurbine Blade,” ASME J. Turbomach., 127(2), pp. 251–262.
[4] Eberly, M. K., and Thole, K. A., 2014, “Time-Resolved Film-Cooling Flows atHigh and Low Density Ratios,” ASME J. Turbomach., 136(6), pp. 1–11.
[5] Lynch, S. P., and Thole, K. A., 2017, “Heat Transfer and Film Cooling on aContoured Blade Endwall With Platform Gap Leakage,” ASME J. Turbomach.,139(5), p. 5.
[6] Shrager, A. C., Thole, K. A., and Mongillo, D., 2019, “Effects of EffusionCooling Pattern Near the Dilution Hole for a Double-Walled Combustor Liner—Part 1: Overall Effectiveness Measurements,” ASME J. Eng. Gas TurbinesPower, 141(1), pp. 1–10.
[7] Barringer, M., Coward, A., Clark, K., Thole, K. A., Schmitz, J., Wagner, J.,Alvin, M. A., Burke, P., and Dennis, R., 2014, “The Design of a Steady AeroThermal Research Turbine (START) for Studying Secondary Flow Leakagesand Airfoil Heat Transfer,” Paper No. GT2014-25570.
[8] Carlomagno, G. M., and Cardone, G., 2010, “Infrared Thermography forConvective Heat Transfer Measurements,” Exp. Fluids, 49(6), pp. 1187–1218.
[9] Cardone, G., Astarita, T., and Carlomagno, G. M., 1997, “Heat TransferMeasurements on a Rotating Disk,” Int. J. Rotating Maclanery, 3(1), pp. 1–9.
[10] Astarita, T., Cardone, G., and Carlomagno, G. M., 2002, “Spiral VorticesDetection on a Rotating Disk,” ICAS2002 CONGRESS, Toronto, Canada,Sept. 8–13, Conference Session ICAS 2002-3.6.4; pp. 364.1–364.8.
[11] Brunner, M. H., Rose, M. G., Mühlbauer, K., and Abhari, R. S., 2007, “In-EngineTurbine Heat Transfer Measurement,” Proc. Inst. Mech. Eng. Part A J. PowerEnergy, 221(5), pp. 727–734.
[12] LeMieux, D. H., 2005, On-Line Thermal Barrier Coating Monitoring forReal-Time Failure Protection and Life Maximization, US Department ofEnergy, Orlando, FL.
[13] Hellberg, A., The Siemens SGT-750 Gas Turbine: Developed for the Oil and GasIndustry, Siemens Industrial Turbomachinery, Finspong, Sweden.
[14] Twerdochlib, M., 2005, “Imaging Rotating Turbine Blades in a Gas TurbineEngine,” US Patent Application, Pub. No.: US2005/0270519 A1.
[15] Zombo, P. J., Twerdochlib, M., Smed, J. P., Lemieux, D. H., Diatzikis, E. V., andBrummel, H.-G., 2008, “System and Method of Evaluating Uncoated TurbineEngine Components,” US Patent Application, Pub. No.: US 2008/0101683 A1.
[16] Markham, J. R., 2004, “Instrument for Temperature and Condition Monitoring ofAdvanced Turbine Blades,” US Patent Application, Pub. No.: US 2004/0179575A1.
[17] Mori, M., Novak, L., and Sekavcnik, M., 2007, “Measurements on RotatingBlades Using IR Thermography,” Exp. Therm. Fluid Sci., 32(2), pp. 387–396.
[18] Mori, M., Novak, L., Sekavcnik, M., and Kuštrin, I., 2008, “Application of IRThermography as a Measuring Method to Study Heat Transfer on RotatingSurface,” Forsch. Ingenieurwes./Eng. Res., 72(1), pp. 1–10.
[19] Novak, L., Mori, M., and Sekavcnik, M., 2008, “Heat Transfer Study in RotatingCascade Using IR Thermography and CFD Analyses,” Heat Mass Transf., 44(5),pp. 559–567.
[20] Markham, J., Cosgrove, J., Scire, J., Haldeman, C., and Agoos, I., 2014, “AircraftEngine-Mounted Camera System for Long Wavelength Infrared Imaging ofIn-Service Thermal Barrier Coated Turbine Blades,” Rev. Sci. Instrum., 85(12),p. 124902.
[21] Lazzi Gazzini, S., Schädler, R., Kalfas, A. I., and Abhari, R. S., 2017,“Infrared Thermography With Non-Uniform Heat Flux BoundaryConditions on the Rotor Endwall of an Axial Turbine,” Meas. Sci. Technol.,28(2), p. 025901.
[22] Hänni, D. D., Abhari, R. S., Schädler, R., Kalfas, A. I., Schmid, G., Lutum, E.,and Lecoq, N., 2019, “Purge Flow Effects on Rotor Hub Endwall HeatTransfer With Extended Endwall Contouring Into the Disk Cavity,”Proceedings of Global Power and Propulsion Society, Technical Conference2019, Zurich, Switzerland, Jan. 15–16, pp. 3:555–568.
[23] Hughes, G. B., Högasten, N., and Nagahawatte, N., 2012, “Filtering Systems andMethods for Infrared Image Processing,” US Patent Application, Patent. No.: US8,189,050 B1.
[24] Wittig, S., Schulz, A., Gritsch, M., and Thole, K. A., 1996, “TransonicFilm-Cooling Investigations: Effects of Hole Shapes and Orientations,”Proceedings of the International Gas Turbine and Aeroengine Congress &Exhibition, Paper No. 96-GT-222.
[25] Stimpson, C. K., Snyder, J. C., and Thole, K. A., 2018, “Effects of Coolant FeedDirection on Additively Manufactured Film Cooling Holes,” Paper No.GT2018-77287.
[26] Snyder, J. C., and Thole, K. A., 2019, “Effect of Additive Manufacturing ProcessParameters on Turbine Cooling,” Paper No. GT2019-90862.
[27] Adibekyan, A., Kononogova, E., Monte, C., and Hollandt, J., 2017,“High-Accuracy Emissivity Data on the Coatings Nextel 811-21, Herberts1534, Aeroglaze Z306 and Acktar Fractal Black,” Int. J. Thermophys., 38(6),pp. 1–14.
[28] Hook, S. J., Myers, J. J., Thome, K. J., Fitzgerald, M., and Kahle, A. B., 2001,“The MODIS/ASTER Airborne Simulator (MASTER)—A New Instrument forEarth Science Studies,” Remote Sens. Environ., 76(1), pp. 93–102.
[29] Kerns, C., Owen, D., and Raymond, A., 1983, Relative Reflectivity of VariousBlack Paints, Michigan State University, East Lansing, MI.
[30] Martiny, M., Schiele, R., Gritsch, M., Schulz, A., and Wittig, S., 1997, “In SituCalibration for Quantitative Infrared Thermography,” QIRT 96—EurothermSeries 50, Sept. 2–5, QIRT Council, Pisa, pp. 3–8.
[31] Sargent, S. R., Hedlund, C. R., and Ligrani, P. M., 1998, “An InfraredThermography Imaging System for Convective Heat Transfer Measurements inComplex Flows,” Meas. Sci. Technol., 9(12), pp. 1974–1981.
[32] Schulz, A., 2000, “Infrared Thermography as Applied to Film Cooling of GasTurbine Components,” Meas. Sci. Technol., 11(7), pp. 948–956.
[33] Rogalski, A., 2008, “New Material Systems for Third Generation InfraredPhotodetectors,” Opto-Electronics Rev., 16(4), pp. 458–482.
[34] FLIR Systems, I., 2019, Thermal Imaging Camera, Datasheet: FLIR A6750 SLS,https://www.flir.com/products/a6750-sls/, Accessed January 28, 2019.
[35] Modest, M. F., 2013, Radiative Heat Transfer, Elsevier, Oxford.[36] Milton, A. F., Barone, F. R., and Kruer, M. R., 1983, “Influence of Non-
Uniformity on IR Focal Plane Array Performance,” Opt. Eng., 24(228), pp. 1–5.[37] Schroeder, R. P., and Thole, K. A., 2014, “Adiabatic Effectiveness
Measurements for a Baseline Shaped Film Cooling Hole,” Paper No.GT2014-25992.
041013-12 / Vol. 143, APRIL 2021 Transactions of the ASME
Dow
nloaded from http://asm
edigitalcollection.asme.org/turbom
achinery/article-pdf/143/4/041013/6669743/turbo_143_4_041013.pdf by The Pennsylvania State University, Karen Thole on 13 April 2021