acquisition mode characterization for the ......to download a copy of this poster, visit ©2019...
TRANSCRIPT
TO DOWNLOAD A COPY OF THIS POSTER, VISIT WWW.WATERS.COM/POSTERS ©2019 Waters Corporation
INTRODUCTION
Cross-linking mass spectrometry (XLMS) is an emerging
structural biology technique. It can be used to gain
structural insights into proteins and complexes that
cannot easily be studied by high resolution structural
techniques. Most studies to date have focused on the
identification of the cross-linked peptides using DDA
based LC-MS techniques. The primary challenges are low
abundance and suppression by the more intense linear,
non-crosslinked peptide ion background during analysis.
Here, the quantitative aspects of XLMS are investigated
and contrasted for various LC-MS acquisition modes. In
addition, it will be demonstrated how structural
information in terms of collisional cross section and ETD
sequence annotation could be obtained and utilized to
aid identification.
ACQUISITION MODE CHARACTERIZATION FOR THE QUANTITATIVE AND QUALITATIVE ANALYSIS OF CROSS-LINKED PEPTIDES BY TARGETED AND UNTARGETED LC-IM-MS
Hannah Britt1,2, Suniya Khatun1,2, Abubakar Hatimy1,2, Jonathan P Williams3, Christopher Hughes3, Tristan Cragnolini1,2, Nathanael Page4, Konstantinos Thalassinos1,2 and Johannes PC Vissers3 1 Institute of Structural and Molecular Biology, Department of Structural and Molecular Biology and 2 Institute of Structural and Molecular Biology, Department of Biological Sciences, Birkbeck , University College London, United Kingdom, 3 Waters Corporation, Wilmslow, United Kingdom, 4 LGC Group, Teddington United Kingdom
Figure 3. Data driven peak detection and integration (MSE acquisition
tryptic digested XL-BSA standard).
Figure 1. Secondary 3D structure cross-linked bovine serum albumin.
Yellow-blue gradient = BSA; red = chemical cross-linker(s).
Figure 2. Acquisition methods principles. The shaded areas highlight
analyzer regions where additional separation (selectivity/sensitivity) or
isolation (selectivity) was achieved. CID can be conducted in both the
trap and transfer regions (acquisition mode dependent).
RESULTS
Acquisition
The results shown in Figure 4 summarize the spectral quality of the
obtained data. MSE, HDMSE and SONAR are DIA variants, whereas
TofMRM and HDMRM would classify as PRM techniques. Enhanced
Duty Cycle (EDC) promotes sensitivity for a given ion m/z by increasing
the MS duty cycle. Note that 2D/3D peak detection was not applied,
which would provide improved S/N and a reduced number of
contaminant product ions for the DIA centric methods.
One of the benefits of the addition of IMS to a schema is shown in
Figure 5, illustrating reduced noise at MS1 and MSn levels, as well as
more exclusive product ion assignment when fragmentation is applied
post IMS separation. In addition, inclusion of IMS and fragmentation pre
IMS can increase instrument duty cycle and hence sensitivity. For
example, when applied in HDDDA mode, the pusher is synchronized
with the velocity of all singly charged product ions and can increase
sensitivity up to a factor of 10 [3].
LC conditions
Metabolite separations were conducted with an AQUITY I-Class system
and a HSS T3 1.8 µm 2.1 x 100 mm column operated at 0.4 mL/min
using a 10 min reversed phase gradient. An M-Class system was used
for all peptide separations (ordinary protein digest and XL applications)
using a BEH C18 1.7 µm 0.3 x 100 mm column with a 30 min reversed
phase gradient at 5 µL/min.
Informatics workflows
All quantitative LC-MS data were peak-detected with Skyline-daily,
illustrated in Figure 3, and processed with custom python scripts.
Qualitative analyses and interpretation of the data were conducted with
MassLynx operating software
References
1. Optimization Workflow for the Analysis of Cross-Linked Peptides Using a Quadrupole Time-of-Flight
Mass Spectrometer. James et al. Anal Chem. 2019 Feb 5;91(3):1808-1814.
2. ETD allows for native surface mapping of a 150 kDa noncovalent complex on a commercial Q-TWIMS-
TOF instrument. Lermyte et al. J Am Soc Mass Spectrom. 2014 Mar;25(3):343-50.
3. Ion mobility tandem mass spectrometry enhances performance of bottom-up proteomics. Helm et al.
Mol Cell Proteomics. 2014 Dec;13(12):3709-15.
4. Qualitative and quantitative characterization of plasma proteins when incorporating traveling wave ion
mobility into a liquid chromatography-mass spectrometry workflow for biomarker discovery: use of
product ion quantitation as an alternative data analysis tool for label free quantitation. Daly et al. Anal
Chem. 2014 Feb 18;86(4):1972-9
5. Absolute quantification of proteins by LCMSE: a virtue of parallel MS acquisition. Silva et al. Mol Cell
Proteomics. 2006 Jan;5(1):144-56
6. In-Depth Characterization of Protein Disulfide Bonds by Online Liquid Chromatography-
Electrochemistry-Mass Spectrometry. Switzar et al. J Am Soc Mass Spectrom. 2016 Jan;27(1):50-8.
CONCLUSION
• The quantitative performance of the acquisition methods of an IM enabled quadruple oa-ToF instrument have been characterized for metabolite and peptide samples
• PRM and DIA (with and without IM) style methods demonstrated the best overall quantitative performance and were applied for the quantitative analysis of XL peptides to estimate abundance
• Additional confirmation of XL peptides was obtained through ETD fragmentation and sequence annotation
• A custom label-free Hi(n) quantitation method afforded XL stoichiometry analysis and amount estimation
Figure 8. LLOD vs. dynamic range results (average values for all
analytes and replicates) summary for metabolite (left) and peptide (right)
samples spiked in urine and E.coli matrix, respectively.
Figure 6. Uncorrected (grey) and blank/background subtracted and
isotopic corrected (grey + orange) MS1 based quantitation relative
dynamic range for metabolite standards spiked in urine.
Isotopic correction, LLOD and dynamic range
Dynamic range was extended by applying an isotopic correction method
for MS1 based acquisition techniques, as shown in Figures 6 and 7. In
short, unsaturated isotope detection was used to correct for skews in
isotopic distributions, increasing the dynamic range by 35% on average
for HDMS acquisitions. In general, the correction effect was most
noticeable for the IM enabled methods.
An MS2 based correction based variant [4] was used to correct MS1
signals for methods were both MS1 and MS2 data were available at
equal integration times (MSE, HDMSE and SONAR). In the example
shown in Figure 7, the correction was found to be peptide dependent
and ranged from ~ 5 - 10, with an average variation of 10.2% and
increasing dynamic range by at least one order.
A semi-quantitative summary in terms of averaged dynamic range and
LLOD using both correction methods for the metabolite and peptides
samples is provided in Figure 8.
Quantitative and qualitative XL-BSA analysis
The acquisition methods with the best dynamic range and LLOD were
selected for quantitative analysis of tryptic digested XL-BSA and their
MSn performance characteristics summarized in Figure 9.
Additional qualitative XL sequence information was obtained by
operating the MS instrument in ETD mode of acquisition and one of the
obtained spectra shown in Figure 10, illustrating near complete
coverage or both arms by predominant detection of y and z ions .
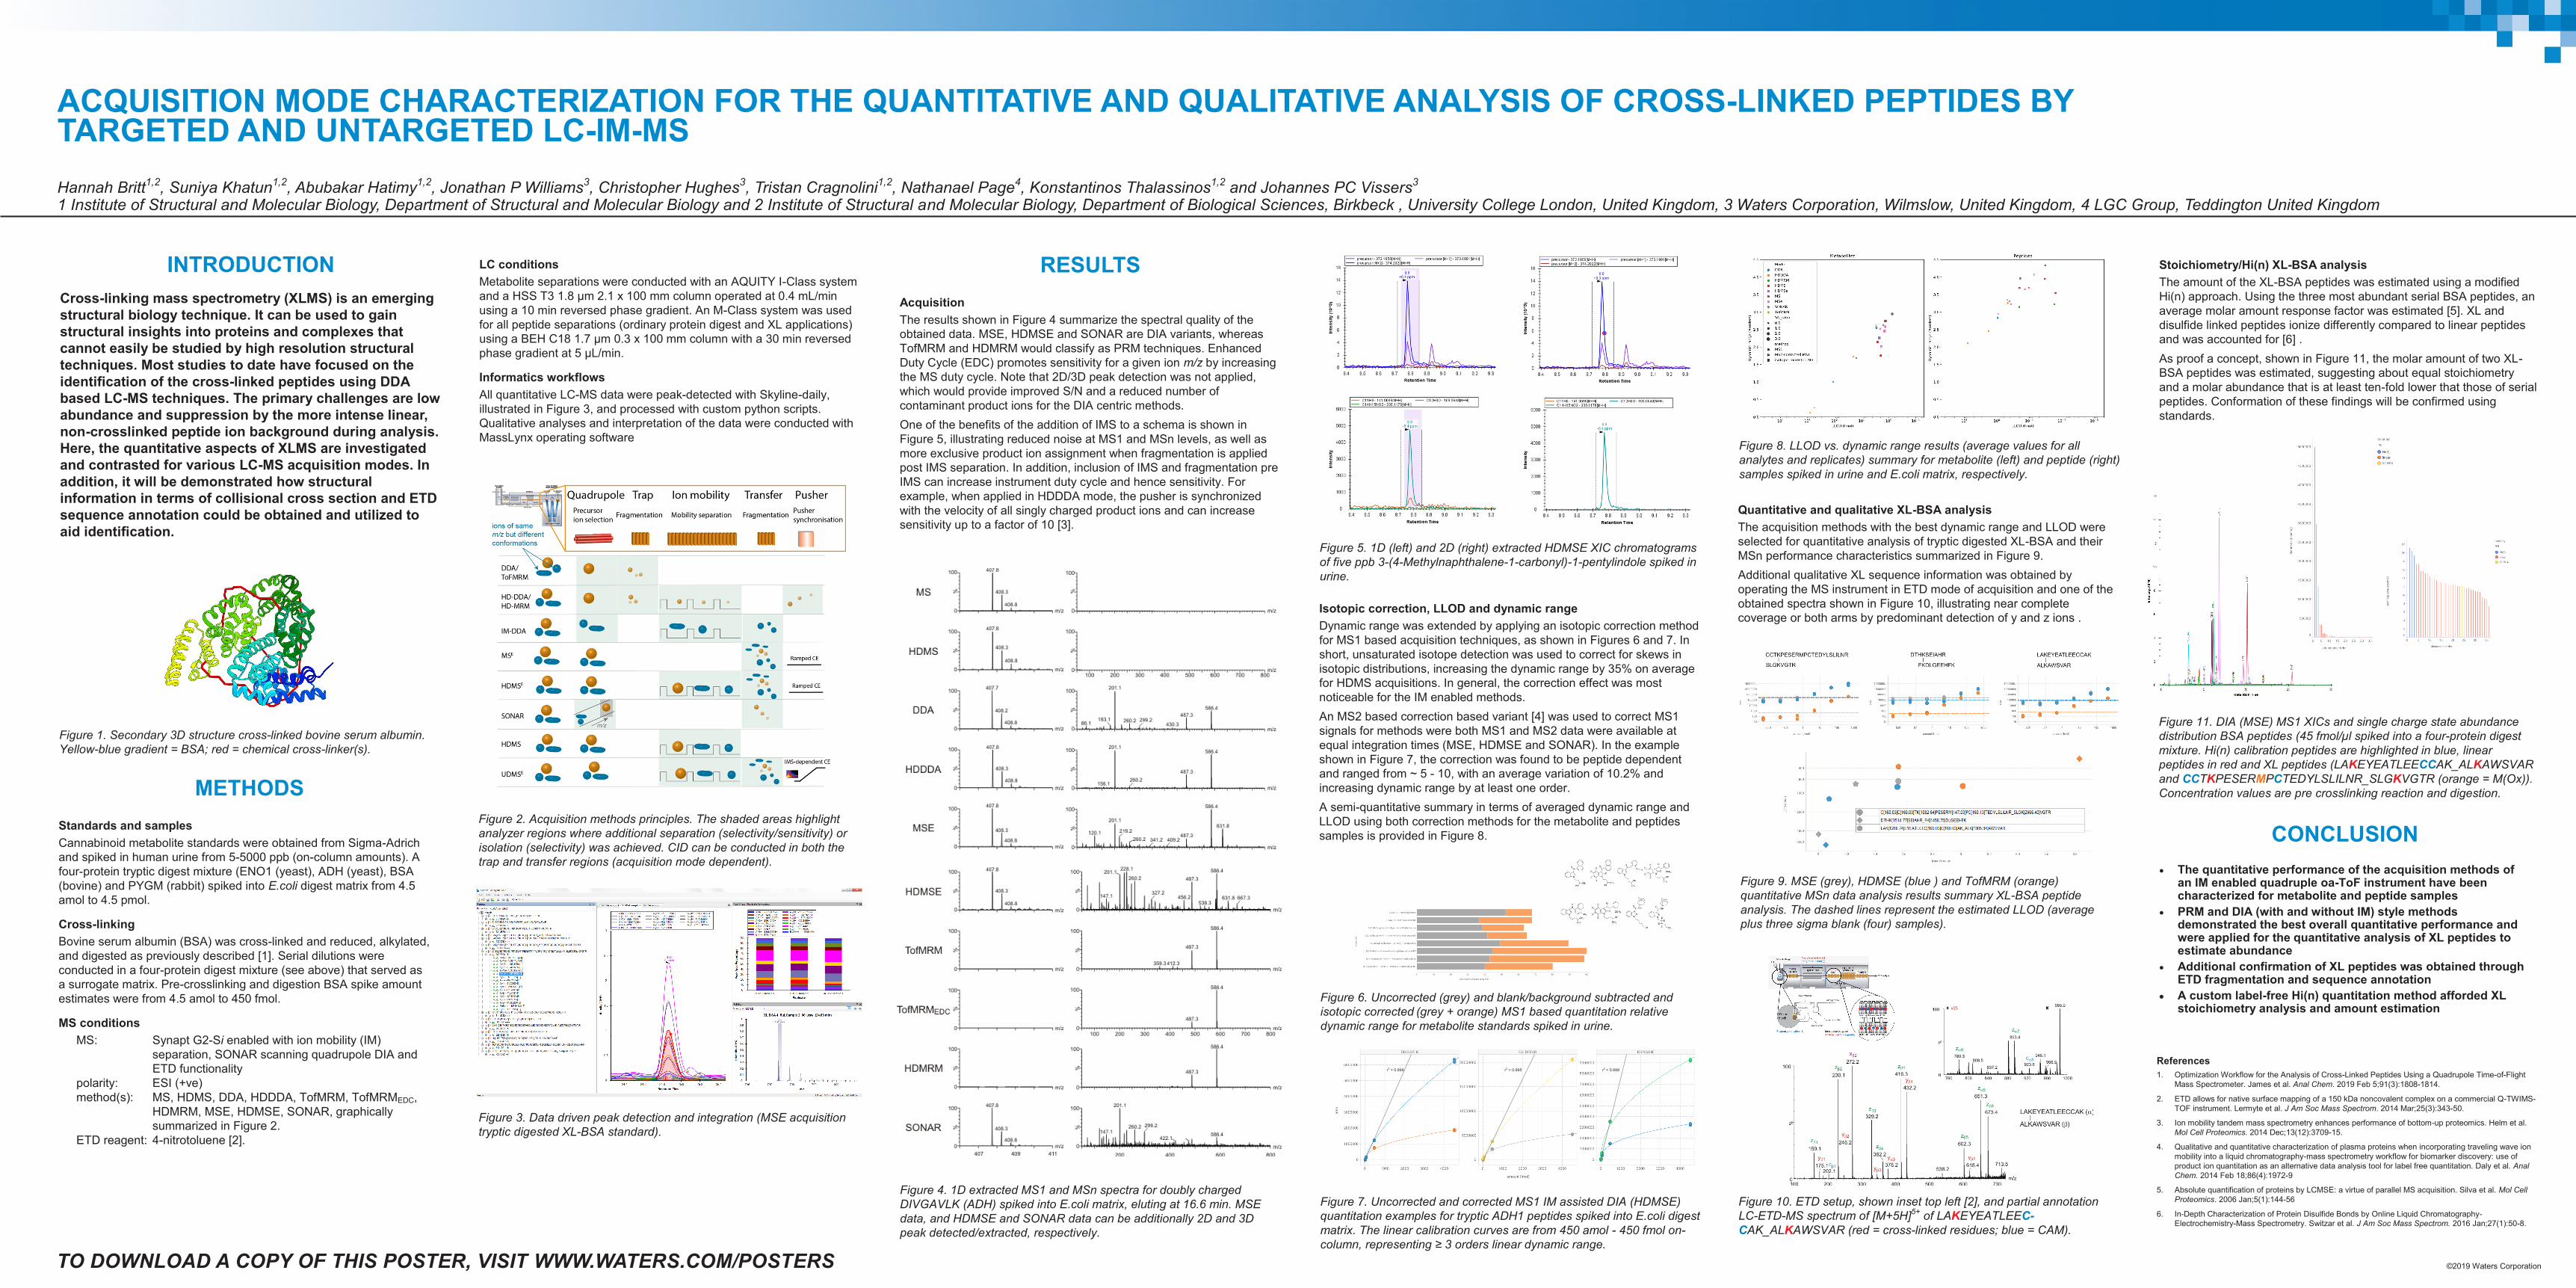
Figure 7. Uncorrected and corrected MS1 IM assisted DIA (HDMSE)
quantitation examples for tryptic ADH1 peptides spiked into E.coli digest
matrix. The linear calibration curves are from 450 amol - 450 fmol on-
column, representing ≥ 3 orders linear dynamic range.
Figure 4. 1D extracted MS1 and MSn spectra for doubly charged
DIVGAVLK (ADH) spiked into E.coli matrix, eluting at 16.6 min. MSE
data, and HDMSE and SONAR data can be additionally 2D and 3D
peak detected/extracted, respectively.
Figure 9. MSE (grey), HDMSE (blue ) and TofMRM (orange)
quantitative MSn data analysis results summary XL-BSA peptide
analysis. The dashed lines represent the estimated LLOD (average
plus three sigma blank (four) samples).
Stoichiometry/Hi(n) XL-BSA analysis
The amount of the XL-BSA peptides was estimated using a modified
Hi(n) approach. Using the three most abundant serial BSA peptides, an
average molar amount response factor was estimated [5]. XL and
disulfide linked peptides ionize differently compared to linear peptides
and was accounted for [6] .
As proof a concept, shown in Figure 11, the molar amount of two XL-
BSA peptides was estimated, suggesting about equal stoichiometry
and a molar abundance that is at least ten-fold lower that those of serial
peptides. Conformation of these findings will be confirmed using
standards.
Figure 10. ETD setup, shown inset top left [2], and partial annotation
LC-ETD-MS spectrum of [M+5H]5+
of LAKEYEATLEEC-
CAK_ALKAWSVAR (red = cross-linked residues; blue = CAM).
Figure 5. 1D (left) and 2D (right) extracted HDMSE XIC chromatograms
of five ppb 3-(4-Methylnaphthalene-1-carbonyl)-1-pentylindole spiked in
urine.
Figure 11. DIA (MSE) MS1 XICs and single charge state abundance
distribution BSA peptides (45 fmol/µl spiked into a four-protein digest
mixture. Hi(n) calibration peptides are highlighted in blue, linear
peptides in red and XL peptides (LAKEYEATLEECCAK_ALKAWSVAR
and CCTKPESERMPCTEDYLSLILNR_SLGKVGTR (orange = M(Ox)).
Concentration values are pre crosslinking reaction and digestion. METHODS
Standards and samples
Cannabinoid metabolite standards were obtained from Sigma-Adrich
and spiked in human urine from 5-5000 ppb (on-column amounts). A
four-protein tryptic digest mixture (ENO1 (yeast), ADH (yeast), BSA
(bovine) and PYGM (rabbit) spiked into E.coli digest matrix from 4.5
amol to 4.5 pmol.
Cross-linking
Bovine serum albumin (BSA) was cross-linked and reduced, alkylated,
and digested as previously described [1]. Serial dilutions were
conducted in a four-protein digest mixture (see above) that served as
a surrogate matrix. Pre-crosslinking and digestion BSA spike amount
estimates were from 4.5 amol to 450 fmol.
MS conditions
MS: Synapt G2-Si enabled with ion mobility (IM)
separation, SONAR scanning quadrupole DIA and
ETD functionality
polarity: ESI (+ve)
method(s): MS, HDMS, DDA, HDDDA, TofMRM, TofMRMEDC,
HDMRM, MSE, HDMSE, SONAR, graphically
summarized in Figure 2.
ETD reagent: 4-nitrotoluene [2].
r2 = 0.999 r2 = 0.995 r2 = 0.998