acrp report 17 – airports and the newest generation of general
TRANSCRIPT
AIRPORTCOOPERATIVE RESEARCH PROGRAMACRP
REPORT 17
Sponsored by the Federal Aviation Administration
Airports and the Newest Generation of
General Aviation Aircraft
Volume 1: Forecast

TRANSPORTATION RESEARCH BOARD 2009 EXECUTIVE COMMITTEE*
OFFICERS
CHAIR: Adib K. Kanafani, Cahill Professor of Civil Engineering, University of California, Berkeley VICE CHAIR: Michael R. Morris, Director of Transportation, North Central Texas Council of
Governments, ArlingtonEXECUTIVE DIRECTOR: Robert E. Skinner, Jr., Transportation Research Board
MEMBERS
J. Barry Barker, Executive Director, Transit Authority of River City, Louisville, KYAllen D. Biehler, Secretary, Pennsylvania DOT, HarrisburgLarry L. Brown, Sr., Executive Director, Mississippi DOT, JacksonDeborah H. Butler, Executive Vice President, Planning, and CIO, Norfolk Southern Corporation,
Norfolk, VAWilliam A.V. Clark, Professor, Department of Geography, University of California, Los AngelesDavid S. Ekern, Commissioner, Virginia DOT, RichmondNicholas J. Garber, Henry L. Kinnier Professor, Department of Civil Engineering, University of
Virginia, CharlottesvilleJeffrey W. Hamiel, Executive Director, Metropolitan Airports Commission, Minneapolis, MNEdward A. (Ned) Helme, President, Center for Clean Air Policy, Washington, DCWill Kempton, Director, California DOT, SacramentoSusan Martinovich, Director, Nevada DOT, Carson CityDebra L. Miller, Secretary, Kansas DOT, TopekaNeil J. Pedersen, Administrator, Maryland State Highway Administration, BaltimorePete K. Rahn, Director, Missouri DOT, Jefferson CitySandra Rosenbloom, Professor of Planning, University of Arizona, TucsonTracy L. Rosser, Vice President, Regional General Manager, Wal-Mart Stores, Inc., Mandeville, LARosa Clausell Rountree, CEO–General Manager, Transroute International Canada Services, Inc.,
Pitt Meadows, BCSteven T. Scalzo, Chief Operating Officer, Marine Resources Group, Seattle, WAHenry G. (Gerry) Schwartz, Jr., Chairman (retired), Jacobs/Sverdrup Civil, Inc., St. Louis, MOC. Michael Walton, Ernest H. Cockrell Centennial Chair in Engineering, University of Texas, AustinLinda S. Watson, CEO, LYNX–Central Florida Regional Transportation Authority, OrlandoSteve Williams, Chairman and CEO, Maverick Transportation, Inc., Little Rock, AR
EX OFFICIO MEMBERS
Thad Allen (Adm., U.S. Coast Guard), Commandant, U.S. Coast Guard, Washington, DCPeter H. Appel, Administrator, Research and Innovative Technology Administration, U.S.DOTJ. Randolph Babbitt, Administrator, Federal Aviation Administration, U.S.DOTRebecca M. Brewster, President and COO, American Transportation Research Institute, Smyrna, GAGeorge Bugliarello, President Emeritus and University Professor, Polytechnic Institute of New York
University, Brooklyn; Foreign Secretary, National Academy of Engineering, Washington, DCJames E. Caponiti, Acting Deputy Administrator, Maritime Administration, U.S.DOTCynthia Douglass, Acting Deputy Administrator, Pipeline and Hazardous Materials Safety
Administration, U.S.DOTLeRoy Gishi, Chief, Division of Transportation, Bureau of Indian Affairs, U.S. Department of the
Interior, Washington, DCEdward R. Hamberger, President and CEO, Association of American Railroads, Washington, DCJohn C. Horsley, Executive Director, American Association of State Highway and Transportation
Officials, Washington, DCRose A. McMurry, Acting Deputy Administrator, Federal Motor Carrier Safety Administration, U.S.DOTRonald Medford, Acting Deputy Administrator, National Highway Traffic Safety Administration,
U.S.DOTWilliam W. Millar, President, American Public Transportation Association, Washington, DCJeffrey F. Paniati, Acting Deputy Administrator and Executive Director, Federal Highway Administration,
U.S.DOTPeter Rogoff, Administrator, Federal Transit Administration, U.S.DOTJoseph C. Szabo, Administrator, Federal Railroad Administration, U.S.DOTRobert L. Van Antwerp (Lt. Gen., U.S. Army), Chief of Engineers and Commanding General,
U.S. Army Corps of Engineers, Washington, DC
ACRP OVERSIGHT COMMITTEE*
CHAIR
James WildingIndependent Consultant
VICE CHAIR
Jeff HamielMinneapolis–St. Paul
Metropolitan Airports Commission
MEMBERS
James CritesDallas–Fort Worth International AirportRichard de NeufvilleMassachusetts Institute of TechnologyKevin C. DollioleUnison ConsultingJohn K. DuvalBeverly Municipal AirportKitty FreidheimFreidheim ConsultingSteve GrossmanOakland International AirportTom JensenNational Safe Skies AllianceCatherine M. LangFederal Aviation AdministrationGina Marie LindseyLos Angeles World AirportsCarolyn MotzHagerstown Regional AirportRichard TuckerHuntsville International Airport
EX OFFICIO MEMBERS
Sabrina JohnsonU.S. Environmental Protection AgencyRichard MarchiAirports Council International—North AmericaLaura McKee Air Transport Association of AmericaHenry OgrodzinskiNational Association of State Aviation OfficialsMelissa SabatineAmerican Association of Airport ExecutivesRobert E. Skinner, Jr.Transportation Research Board
SECRETARY
Christopher W. JenksTransportation Research Board
*Membership as of June 2009.*Membership as of June 2009.
TRANSPORTAT ION RESEARCH BOARDWASHINGTON, D.C.
2009www.TRB.org
A I R P O R T C O O P E R A T I V E R E S E A R C H P R O G R A M
ACRP REPORT 17
Research sponsored by the Federal Aviation Administration
Subject Areas
Aviation
Airports and the Newest Generation of
General Aviation Aircraft
Volume 1: Forecast
William Spitz
A N D
Richard GolaszewskiGRA, INC.
Jenkintown, PA
AIRPORT COOPERATIVE RESEARCH PROGRAM
Airports are vital national resources. They serve a key role in trans-portation of people and goods and in regional, national, and inter-national commerce. They are where the nation’s aviation systemconnects with other modes of transportation and where federal respon-sibility for managing and regulating air traffic operations intersectswith the role of state and local governments that own and operate mostairports. Research is necessary to solve common operating problems,to adapt appropriate new technologies from other industries, and tointroduce innovations into the airport industry. The Airport Coopera-tive Research Program (ACRP) serves as one of the principal means bywhich the airport industry can develop innovative near-term solutionsto meet demands placed on it.
The need for ACRP was identified in TRB Special Report 272: AirportResearch Needs: Cooperative Solutions in 2003, based on a study spon-sored by the Federal Aviation Administration (FAA). The ACRP carriesout applied research on problems that are shared by airport operatingagencies and are not being adequately addressed by existing federalresearch programs. It is modeled after the successful National Coopera-tive Highway Research Program and Transit Cooperative Research Pro-gram. The ACRP undertakes research and other technical activities in avariety of airport subject areas, including design, construction, mainte-nance, operations, safety, security, policy, planning, human resources,and administration. The ACRP provides a forum where airport opera-tors can cooperatively address common operational problems.
The ACRP was authorized in December 2003 as part of the Vision100-Century of Aviation Reauthorization Act. The primary partici-pants in the ACRP are (1) an independent governing board, the ACRPOversight Committee (AOC), appointed by the Secretary of the U.S.Department of Transportation with representation from airport oper-ating agencies, other stakeholders, and relevant industry organizationssuch as the Airports Council International-North America (ACI-NA),the American Association of Airport Executives (AAAE), the NationalAssociation of State Aviation Officials (NASAO), and the Air TransportAssociation (ATA) as vital links to the airport community; (2) the TRBas program manager and secretariat for the governing board; and (3) the FAA as program sponsor. In October 2005, the FAA executed acontract with the National Academies formally initiating the program.
The ACRP benefits from the cooperation and participation of airportprofessionals, air carriers, shippers, state and local government officials,equipment and service suppliers, other airport users, and research orga-nizations. Each of these participants has different interests and respon-sibilities, and each is an integral part of this cooperative research effort.
Research problem statements for the ACRP are solicited periodicallybut may be submitted to the TRB by anyone at any time. It is theresponsibility of the AOC to formulate the research program by iden-tifying the highest priority projects and defining funding levels andexpected products.
Once selected, each ACRP project is assigned to an expert panel,appointed by the TRB. Panels include experienced practitioners andresearch specialists; heavy emphasis is placed on including airport pro-fessionals, the intended users of the research products. The panels pre-pare project statements (requests for proposals), select contractors, andprovide technical guidance and counsel throughout the life of theproject. The process for developing research problem statements andselecting research agencies has been used by TRB in managing cooper-ative research programs since 1962. As in other TRB activities, ACRPproject panels serve voluntarily without compensation.
Primary emphasis is placed on disseminating ACRP results to theintended end-users of the research: airport operating agencies, serviceproviders, and suppliers. The ACRP produces a series of researchreports for use by airport operators, local agencies, the FAA, and otherinterested parties, and industry associations may arrange for work-shops, training aids, field visits, and other activities to ensure thatresults are implemented by airport-industry practitioners.
ACRP REPORT 17, VOLUME 1
Project 10-04ISSN 1935-9802ISBN 978-0-309-11794-4Library of Congress Control Number 2009933918
© 2009 Transportation Research Board
COPYRIGHT PERMISSION
Authors herein are responsible for the authenticity of their materials and for obtainingwritten permissions from publishers or persons who own the copyright to any previouslypublished or copyrighted material used herein.
Cooperative Research Programs (CRP) grants permission to reproduce material in thispublication for classroom and not-for-profit purposes. Permission is given with theunderstanding that none of the material will be used to imply TRB or FAA endorsementof a particular product, method, or practice. It is expected that those reproducing thematerial in this document for educational and not-for-profit uses will give appropriateacknowledgment of the source of any reprinted or reproduced material. For other uses ofthe material, request permission from CRP.
NOTICE
The project that is the subject of this report was a part of the Airport Cooperative ResearchProgram conducted by the Transportation Research Board with the approval of theGoverning Board of the National Research Council. Such approval reflects the GoverningBoard’s judgment that the project concerned is appropriate with respect to both thepurposes and resources of the National Research Council.
The members of the technical advisory panel selected to monitor this project and to reviewthis report were chosen for recognized scholarly competence and with due considerationfor the balance of disciplines appropriate to the project. The opinions and conclusionsexpressed or implied are those of the research agency that performed the research, andwhile they have been accepted as appropriate by the technical panel, they are notnecessarily those of the Transportation Research Board, the National Research Council, orthe Federal Aviation Administration of the U.S. Department of Transportation.
Each report is reviewed and accepted for publication by the technical panel according toprocedures established and monitored by the Transportation Research Board ExecutiveCommittee and the Governing Board of the National Research Council.
The Transportation Research Board of the National Academies, the National ResearchCouncil, and the Federal Aviation Administration (sponsor of the Airport CooperativeResearch Program) do not endorse products or manufacturers. Trade or manufacturers’names appear herein solely because they are considered essential to the clarity andcompleteness of the project reporting.
Cover Photo courtesy of the City of Naples Airport Authority.
Published reports of the
AIRPORT COOPERATIVE RESEARCH PROGRAM
are available from:
Transportation Research BoardBusiness Office500 Fifth Street, NWWashington, DC 20001
and can be ordered through the Internet at
http://www.national-academies.org/trb/bookstore
Printed in the United States of America


CRP STAFF FOR ACRP REPORT 17, VOLUME 1
Christopher W. Jenks, Director, Cooperative Research ProgramsCrawford F. Jencks, Deputy Director, Cooperative Research ProgramsMichael R. Salamone, ACRP ManagerTheresia H. Schatz, Senior Program OfficerEileen P. Delaney, Director of PublicationsHilary Freer, Senior EditorAndréa Briere, Editor
ACRP PROJECT 10-04 PANELField of Operations
Theodore D. Soliday, City of Naples Airport Authority, Naples, FL (Chair)H. Norman Abramson, Southwest Research Institute, San Antonio, TX Tara Harl, St. Cloud State University, St. Cloud, MN Paul Meyers, Aviation Management Consulting Group, Inc., Centennial, CO Gary Shafer, Southern Illinois Airport, Carbondale, IL Christy Yaffa, Wyoming DOT, Cheyenne, WY Paul Devoti, FAA Liaison Kenneth Feith, US Environmental Protection Agency Liaison Alex Gertsen, American Association of Airport Executives Liaison (formerly) Jens C. Hennig, General Aviation Manufacturers Association Liaison Christine Gerencher, TRB Liaison
C O O P E R A T I V E R E S E A R C H P R O G R A M S
ACRP Report 17: Airports and The Newest Generation of General Aviation Aircraft is pub-lished as a 2-volume set. Volume 1 provides a Forecast of anticipated fleet activity associ-ated with the newest generation of General Aviation (GA) aircraft over a 5- and 10-year out-look. Volume 2 offers a Guidebook in a user-friendly format that helps airport operatorsassess the practical requirements and innovative approaches that may be needed to accom-modate these new aircraft.
This Volume 1 Forecast will be of interest to airport operators currently serving GA air-craft, as well as those that are considering the potential impact of incorporating commer-cial service that may be provided by Very Light Jets (VLJs) and other advanced small GAaircraft at their airports. Using 2007 as the baseline, this Forecast provides 5- and 10-yearfleet size projections for the newest generation of GA aircraft and highlights a variety of fleetsand their manufacturers. Both traditional GA uses as well as commercial air taxi uses areconsidered.
In addition to fleet estimates, operational activity projections by VLJs used in commer-cial air taxi services are provided for over 1,800 US airports. In conjunction with the Vol-ume 2 Guidebook, these fleet and activity forecasts can be used by airport operators to assessboth the practical requirements and the innovative options for accommodating these newtypes of GA aircraft. Airport planners can use this Forecast as the basis for upgrading exist-ing, and creating new airport facilities (along with the services needed). Service providersand industry stakeholders focused on GA activity will find this Forecast helpful in seekingnew business opportunities in the foreseeable future.
Some forecasts predict that an increasing number of new, smaller GA aircraft will take tothe skies in the near future. These forecasts suggest that some airports will see an increasein traffic and greater demand for GA infrastructure, facilities, and services.
However, according to some aviation industry experts, many of these forecasts appearover-optimistic. Airport operators are concerned that the forecasts do not adequatelyaddress airport considerations. The fundamental questions for airports are, how much willtraffic increase from these aircraft; which airports will experience the traffic increase; andwhat infrastructure, facilities, and services will be needed.
If there is a large increase in aircraft activity as a result of these new aircraft, already busyGA airports will be further congested, and the smallest GA airports may not be prepared tohandle this potential increase in activity. Consequently, airports need to know what level ofaircraft activity they can expect and what infrastructure, facilities, and services are neededto accommodate the newest generation of GA aircraft adequately. They need informationon the likelihood of GA aircraft activity increases at airports by category of airport and
F O R E W O R D
By Theresia H. SchatzStaff OfficerTransportation Research Board

geographical location. Moreover, no single resource document summarizes what can andshould be done to prepare airport infrastructure, facilities, and services to accommodate theincreased activity while maintaining productivity.
Under ACRP Project 10-04, a research team led by GRA, Inc. conducted the research withthe objectives to (1) forecast GA aircraft activity by category of airport and geographicallocation due to the introduction of the newest generation of GA aircraft and (2) develop auser-friendly guidebook that will help airport operators to (a) estimate the level of activityfrom these aircraft at their particular airport; (b) assess the impact of these aircraft ontheir particular airport’s infrastructure, facilities, and services; (c) accommodate existingand anticipated demand for facilities and services from these aircraft; and (d) attract newbusiness from the newest generation of GA aircraft. For the purposes of this project, thenewest generation of GA aircraft refers to small-sized (12,500 lbs or less) aircraft withhigh-technology “all glass” digital cockpits, including light jets, VLJs, and new advanced-technology piston and turbo-prop aircraft.
The need for this research began in 2006–07, when the hype surrounding VLJs reached acrescendo. With a significant downshift in the global economy in 2008–2009, the reduceddemand has affected the aviation industry as a whole, particularly the GA market. Nonethe-less, this Forecast and the Guidebook will help airport operators and planners prepare forthe next wave of change. An increase in demand for this newest generation of GA aircraftand its impact on airports; the associated facilities; and information related to best plan forfuture growth, expansion, and potential new opportunities are likely to be needed.
C O N T E N T S
1 Summary
3 Chapter 1 Overview 3 Aircraft Coverage4 Geographic Coverage4 Review of Existing GA and Air Taxi Markets
5 Chapter 2 GA Forecast5 Introduction5 Projections for the Overall Market7 Market Segmentation Analysis9 Outlook for VLJ Manufacturers9 Eclipse 500
10 Cessna Citation Mustang10 Embraer Phenom 10010 The Fractional Ownership Market10 Baseline GA Fleet Forecast11 Operational Impacts on Airports
12 Chapter 3 Air Taxi Forecast12 Introduction13 Data Details13 Airport Data14 Census Data14 Current Air Taxi Population15 Current Commercial Air Population15 Current Automobile Population16 Model Assumptions17 Explanatory Variables and Model Estimation18 Statistical Results19 Baseline Forecast Assumptions19 Outlook for Air Taxi Services Utilizing Small Next-Generation Aircraft20 VLJ Mode Attributes20 Spread and Distribution of VLJ Per-Seat versus Traditional Charter Services20 Spread and Distribution of Low-Cost Piston Services20 Other Modes21 Impact of Increasing Fuel Prices21 Overall Travel Growth21 Projected Mode Shares and Trip Totals22 Baseline Air Taxi Fleet Forecast22 Operational Impacts on Airports
25 Chapter 4 Conclusions25 Estimation of Projected Fleet Changes25 Comparison with Other Fleet Forecasts
S U M M A R Y
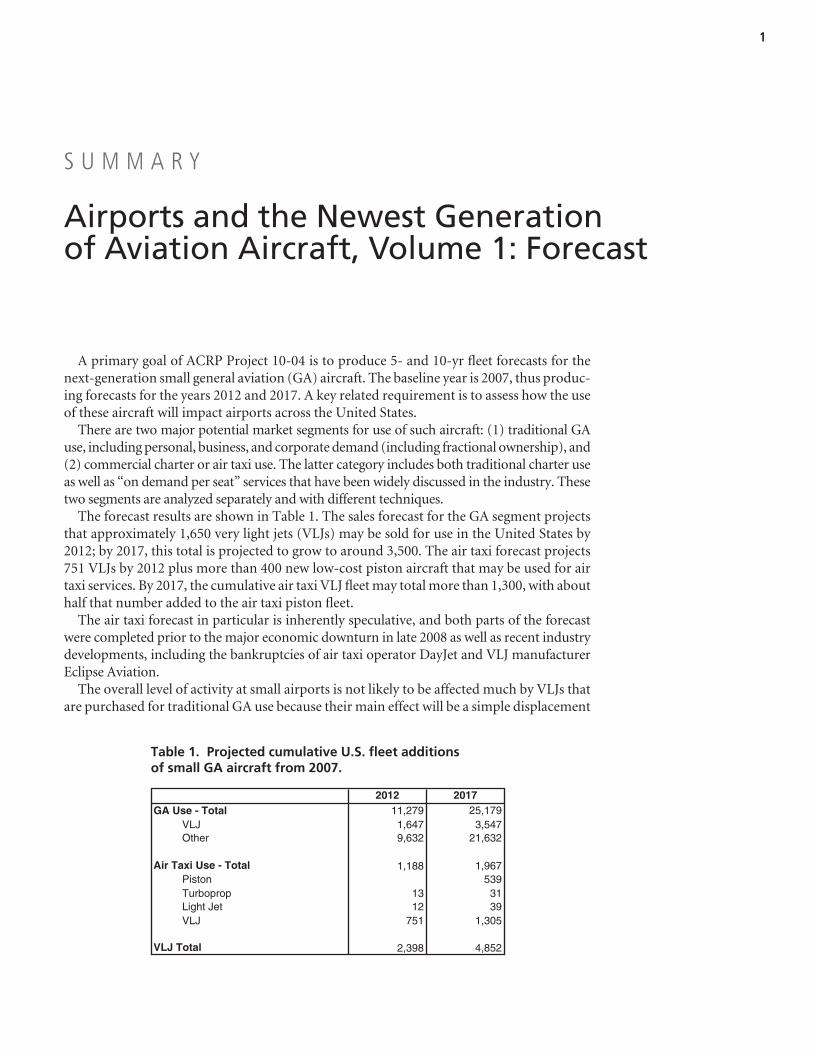
A primary goal of ACRP Project 10-04 is to produce 5- and 10-yr fleet forecasts for thenext-generation small general aviation (GA) aircraft. The baseline year is 2007, thus produc-ing forecasts for the years 2012 and 2017. A key related requirement is to assess how the useof these aircraft will impact airports across the United States.
There are two major potential market segments for use of such aircraft: (1) traditional GAuse, including personal, business, and corporate demand (including fractional ownership), and(2) commercial charter or air taxi use. The latter category includes both traditional charter useas well as “on demand per seat” services that have been widely discussed in the industry. Thesetwo segments are analyzed separately and with different techniques.
The forecast results are shown in Table 1. The sales forecast for the GA segment projectsthat approximately 1,650 very light jets (VLJs) may be sold for use in the United States by2012; by 2017, this total is projected to grow to around 3,500. The air taxi forecast projects751 VLJs by 2012 plus more than 400 new low-cost piston aircraft that may be used for airtaxi services. By 2017, the cumulative air taxi VLJ fleet may total more than 1,300, with abouthalf that number added to the air taxi piston fleet.
The air taxi forecast in particular is inherently speculative, and both parts of the forecastwere completed prior to the major economic downturn in late 2008 as well as recent industrydevelopments, including the bankruptcies of air taxi operator DayJet and VLJ manufacturerEclipse Aviation.
The overall level of activity at small airports is not likely to be affected much by VLJs thatare purchased for traditional GA use because their main effect will be a simple displacement
Airports and the Newest Generation of Aviation Aircraft, Volume 1: Forecast
1
2012 2017GA Use - Total 11,279
3,5471,647VLJ21,6329,632Other
Air Taxi Use - Total 1,188539Piston
3113Turboprop3912Light Jet
1,305751VLJ
VLJ Total 2,398
25,179
1,967
4,852
Table 1. Projected cumulative U.S. fleet additions of small GA aircraft from 2007.

2
of sales that would have gone to other small GA aircraft instead. On the other hand, theanalysis indicates that sales of VLJs (and low-cost piston aircraft) for air taxi use are likely todisplace automobile and commercial air traffic, leading to substantial increases in activity atcertain airports that handle large numbers of the new air taxi services. But overall, the pro-jected increase in operations by 2017 at “VLJ-ready” airports relative to 2007 is relativelymodest, on the order of 6%.
3
A primary goal of ACRP Project 10-04 is to produce 5- and10-yr fleet forecasts for next-generation small general aviation(GA) aircraft. The baseline year is 2007, thus producing fore-casts for the years 2012 and 2017. A key related requirement is to assess how the use of these aircraft will impact airportsacross the United States.
There are two major potential market segments for use ofsuch aircraft that have been widely discussed in the industry: (1)traditionalGAuse,includingprivate,personal,andcorporatedemand (including fractional ownership) that is governed byFAA Part 91 regulations, and (2) commercial charter or air taxiuse under FAA Part 135, as exhibited both by traditional char-ter services where one essentially rents an entire aircraft for aspecific trip or for a specific amount of time, and new “per-seat”services. The per-seat model in particular has garnered muchinterest, with some analysts predicting that such services havethe potential to dramatically expand the demand for and use ofvery light jets (VLJs) and other next-generation small aircraft.
It is very important to assess the potential for these seg-ments separately. In the traditional GA market, it is believedthat sales of VLJ aircraft will, for the most part, displace salesof other aircraft including high-end pistons, turboprops, andlight jets. So even though ultimately there may be a significantVLJ fleet that is used for traditional GA purposes, growth inoverall airport operations will not vary much from historicalaverages observed over the past several years. On the otherhand, if the air taxi market develops into a significant seg-ment, it may have a much larger impact on GA airport oper-ations since much of the activity represent new small aircraftactivity (displacing commercial air service and automobiletrips). These issues are discussed in more detail below.
Aircraft Coverage
An initial determination was made to limit the aircraftcovered to those weighing less than 12,500 lbs and to focuson those with advanced, modern avionics systems. While
most of the attention in public discussions of such aircrafthas focused on new VLJ designs, the present analysis brack-ets the VLJ segment on both ends and includes existing designs both at the low end (i.e., smaller piston aircraft suchas the Cirrus SR-22, the Cessna/Columbia 350 and 400, theDiamond DA42 Twin Star, and the Mooney M20 series) andat the upper end (i.e., the “light jet” category up to 12,500 lbsthat includes the Cessna CJ1 and CJ2 and the HawkerBeechcraft Premier 1A). This report often refers to the “VLJmarket,” which is meant to include the larger market atboth ends. Within the VLJ segment, the primary focus is onthe following twin-engine models that began actual pro-duction by the end of 2008:
• Eclipse 500,• Cessna Citation Mustang, and• Embraer Phenom1 100.
HondaJet is another twin-engine program whose prospectsappear viable within the next few years; current plans call forfirst deliveries in 2010. In addition, there are a number of single-engine VLJ models currently under development, themost prominent of which are the Diamond D-Jet, Eclipse400, Piper Jet, and Cirrus SJ50. Prospects for these programsare less certain although the D-Jet is further along than theother programs. After modifying the engine design in 2008,Diamond’s current plans call for first deliveries in mid-2009.It should also be noted that two companies with VLJ pro-grams were liquidated in 2008—Adam Aircraft (which wasdeveloping the A700 twin-engine VLJ) and ATG (which wasdeveloping a two-seat military trainer-style jet called theJavelin).
C H A P T E R 1
Overview
1The Embraer “executive jet” program also includes the Phenom 300,which is a larger version of the 100 series. Its projected size and weightare well above the 12,500 lb limit that prescribes the bounds of thecurrent analysis.
Geographic Coverage
The forecast is limited to fleets covering aircraft activity inthe lower 48 states. In addition, only public-use airports areconsidered. To further limit the number of airports that mustbe analyzed, only those airports with jet fuel availability andat least one 3,000-ft lighted runway are included. While thispotentially excludes some small airports that could accom-modate modern piston aircraft such as the Cirrus SR-22, itincludes the most heavily used airports that make up about85% of total GA operations across the United States.
Review of Existing GA and Air Taxi Markets
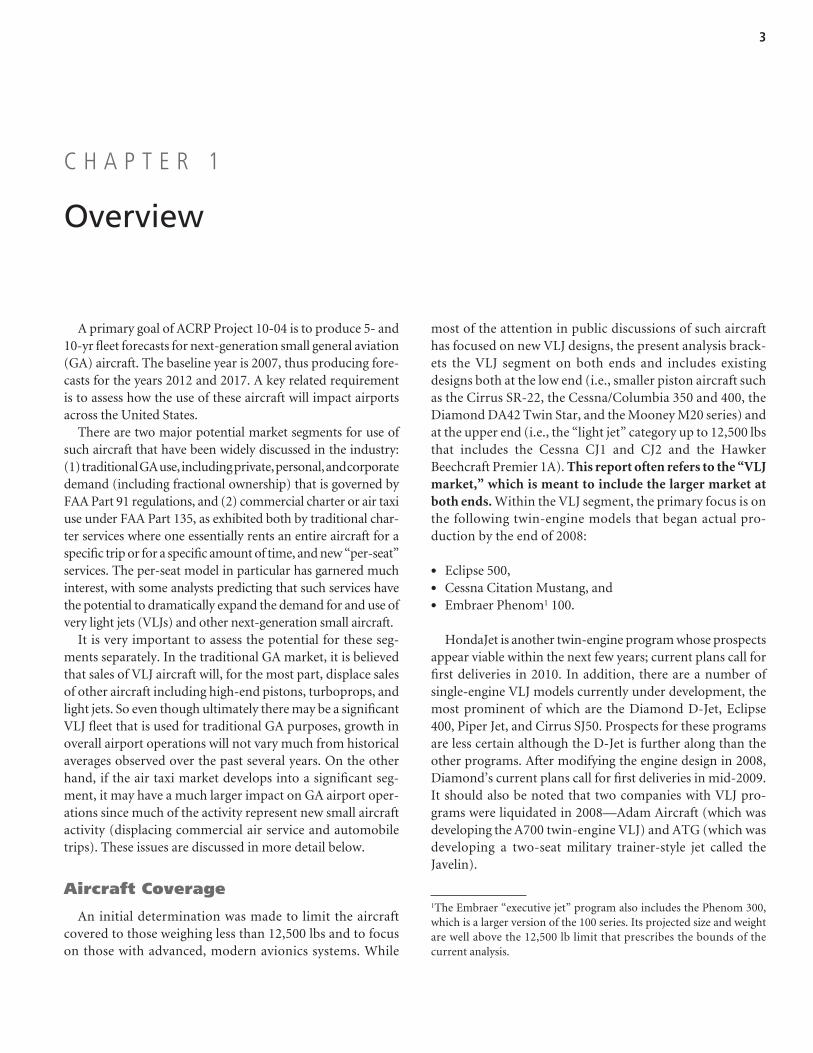
According to FAA data for 2006, the current active U.S.fleet certified for GA use under Part 91 or On-Demand useunder Part 135 totals about 222,000 aircraft. A breakout byprimary use and aircraft type is shown in Table 2. This analy-
sis of small next-generation aircraft focuses on potential addi-tions to the shaded areas in Table 2 from small next-generationaircraft.
It is difficult to assess activity in terms of hours flown byuse category because many aircraft are used in different cate-gories at different times. The FAA has published average activity estimates by aircraft type, as shown in Table 3. In gen-eral, it is expected that financial considerations would causethe air taxi category to exhibit higher than average utilizationrates across all aircraft types.
The forecasting effort undertaken here treats the private/corporate/fractional market and the charter/air taxi marketseparately, and two separate forecasts have been produced.
4
Piston Turboprop Jet Other TotalGA (Part 91)
Personal / Business / Corporate28,3677,3503091,45719,251Other
On-Demand (Part 135)7,6391,2822,4261,2722,659Air Taxi1,7141,14363152356Other
222,21340,02810,3798,064163,742Total
Aircraft TypePrimary Use
184,49330,2537,5815,183141,476
Table 2. Active U.S. fleet in 2006.
Piston Turboprop Jet101
Aircraft Type
393268
Table 3. Estimated average hours flown in 2006.
5
Introduction
The use of next-generation aircraft for personal, private, andcorporate purposes is more in line with the traditional reasonsfor purchasing small GA aircraft compared with the new mar-ket potential for air taxi services. However, projections of suchsales can still be very uncertain because the reasons for purchaseare quite varied and will depend on individual or company cir-cumstances that are typically unobservable, on intended use, onequipment characteristics that will have differing importance todiffering buyers, and so forth.
These difficulties argue against a detailed bottoms-up“micro” approach. A better alternative is a macro-type analy-sis that relates aircraft sales to larger economic factors such asoverall growth in the economy and interest rates. For the cur-rent analysis, such relationships are likely to track better atmore aggregate levels. Consequently, the relevant market intowhich VLJs will fit into is defined to include shipments of GApiston, turboprop, and light jet aircraft (plus the initial ship-ments of VLJs themselves in 2007—the Eclipse 500 and CessnaCitation Mustang). The light jet models included in this defi-nition are the Cessna CJ1 and CJ2 series, plus the HawkerBeechcraft Premier 1A.2
Projections for the Overall Market
Because the primary interest is in aircraft fleets that will beactive at U.S. airports, the U.S. fleet is defined as total U.S.shipments minus exports plus imports.3 Shipment counts by
U.S. manufacturers were obtained from the General AviationManufacturers Association (GAMA) Annual Shipment Re-ports, which also include reports of GA exports and imports.To assess how U.S. net shipments are tied to movements in theoverall economy, data were assembled on annual shipments,4
on U.S. real gross domestic product (GDP), and on long-terminterest rates (using the rate on 10-yr U.S. treasury notes)from 1999 through 2007. These data are shown in Table 4.
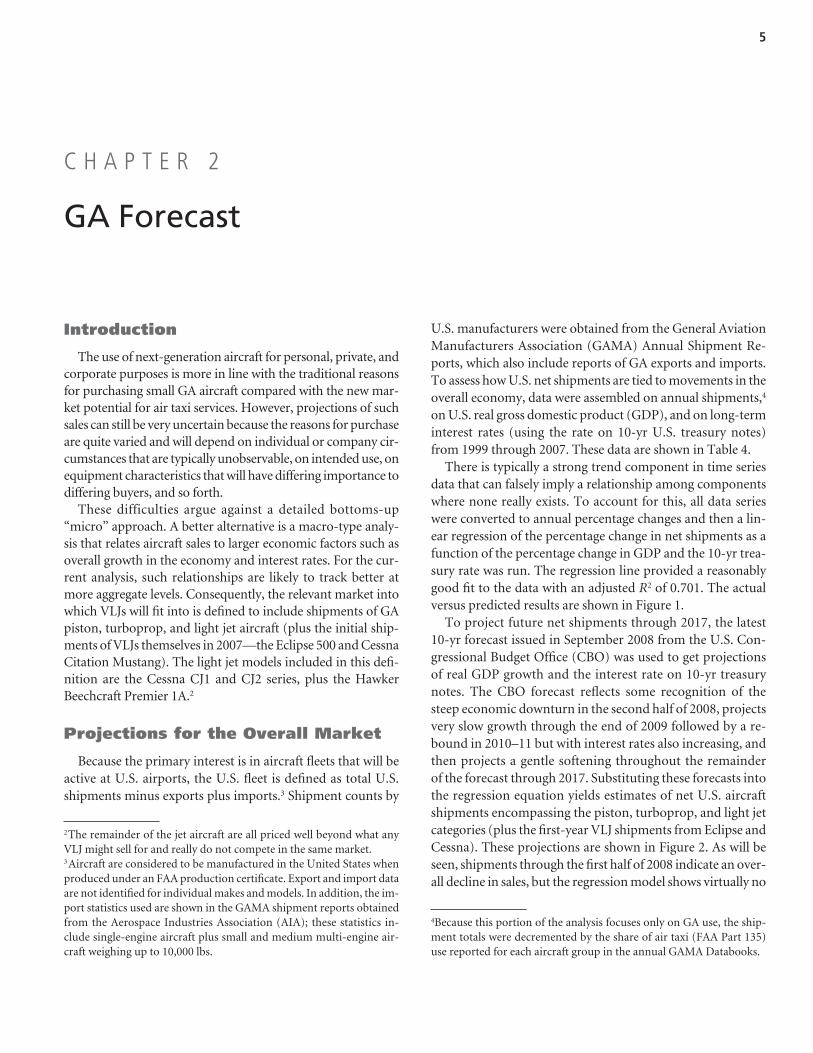
There is typically a strong trend component in time seriesdata that can falsely imply a relationship among componentswhere none really exists. To account for this, all data serieswere converted to annual percentage changes and then a lin-ear regression of the percentage change in net shipments as afunction of the percentage change in GDP and the 10-yr trea-sury rate was run. The regression line provided a reasonablygood fit to the data with an adjusted R2 of 0.701. The actualversus predicted results are shown in Figure 1.
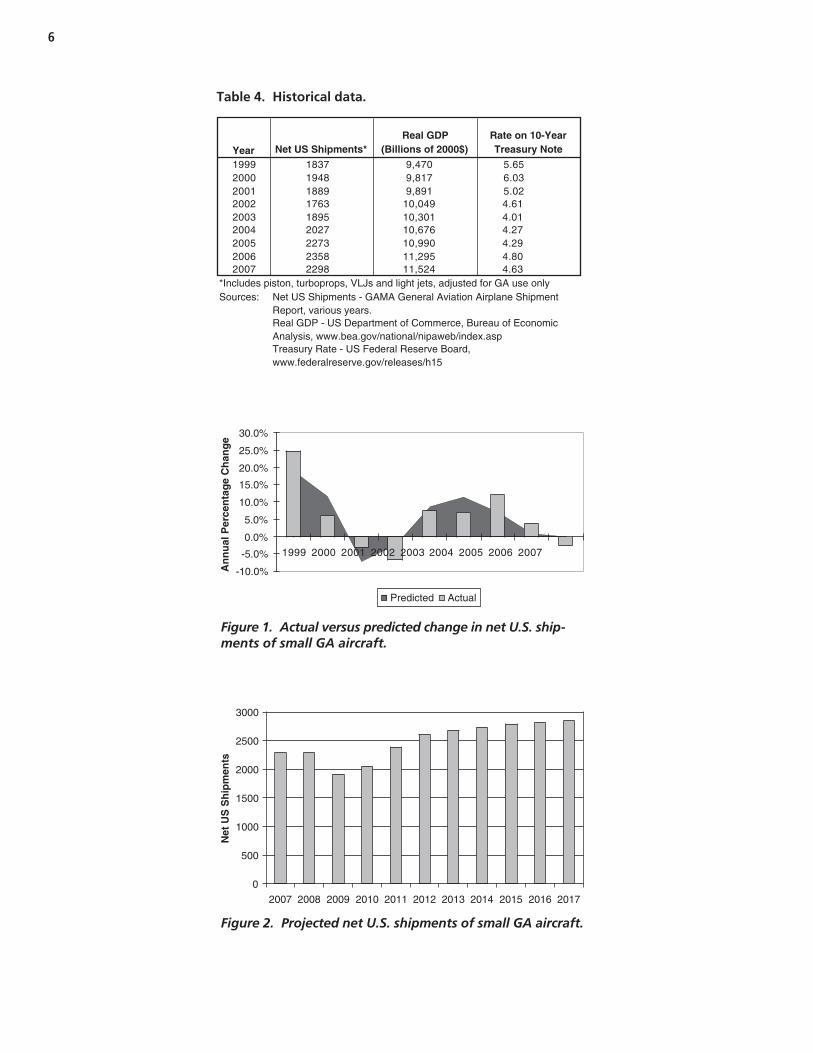
To project future net shipments through 2017, the latest10-yr forecast issued in September 2008 from the U.S. Con-gressional Budget Office (CBO) was used to get projectionsof real GDP growth and the interest rate on 10-yr treasurynotes. The CBO forecast reflects some recognition of thesteep economic downturn in the second half of 2008, projectsvery slow growth through the end of 2009 followed by a re-bound in 2010–11 but with interest rates also increasing, andthen projects a gentle softening throughout the remainder of the forecast through 2017. Substituting these forecasts intothe regression equation yields estimates of net U.S. aircraftshipments encompassing the piston, turboprop, and light jetcategories (plus the first-year VLJ shipments from Eclipse andCessna). These projections are shown in Figure 2. As will beseen, shipments through the first half of 2008 indicate an over-all decline in sales, but the regression model shows virtually no
C H A P T E R 2
GA Forecast
2The remainder of the jet aircraft are all priced well beyond what anyVLJ might sell for and really do not compete in the same market.3Aircraft are considered to be manufactured in the United States whenproduced under an FAA production certificate. Export and import dataare not identified for individual makes and models. In addition, the im-port statistics used are shown in the GAMA shipment reports obtainedfrom the Aerospace Industries Association (AIA); these statistics in-clude single-engine aircraft plus small and medium multi-engine air-craft weighing up to 10,000 lbs.
4Because this portion of the analysis focuses only on GA use, the ship-ment totals were decremented by the share of air taxi (FAA Part 135)use reported for each aircraft group in the annual GAMA Databooks.
6
Year Net US Shipments*Real GDP
(Billions of 2000$)Rate on 10-YearTreasury Note
1999 1837 9,470 5.652000 1948 9,817 6.032001 1889 9,891 5.022002 1763 10,049 4.612003 1895 10,301 4.012004 2027 10,676 4.272005 2273 10,990 4.292006 2358 11,295 4.802007 2298 11,524 4.63
*Includes piston, turboprops, VLJs and light jets, adjusted for GA use onlySources:
Real GDP - US Department of Commerce, Bureau of Economic Analysis, www.bea.gov/national/nipaweb/index.aspTreasury Rate - US Federal Reserve Board, www.federalreserve.gov/releases/h15
Net US Shipments - GAMA General Aviation Airplane Shipment Report, various years.
Table 4. Historical data.
-10.0%
-5.0%
0.0%
5.0%
10.0%
15.0%
20.0%
25.0%
30.0%
1999 2000 2001 2002 2003 2004 2005 2006 2007
An
nu
al P
erce
nta
ge
Ch
ang
e
Predicted Actual
Figure 1. Actual versus predicted change in net U.S. ship-ments of small GA aircraft.
0
500
1000
1500
2000
2500
3000
2007
Net
US
Sh
ipm
ents
2017201620152014201320122011201020092008
Figure 2. Projected net U.S. shipments of small GA aircraft.
change from 2007 (largely due to low interest rates). Lookingfurther ahead, the model projects a significant decline in ship-ments in 2009, substantial growth by 2011–12, and then mod-est increases through the end of the forecast period in 2017.
Market Segmentation Analysis
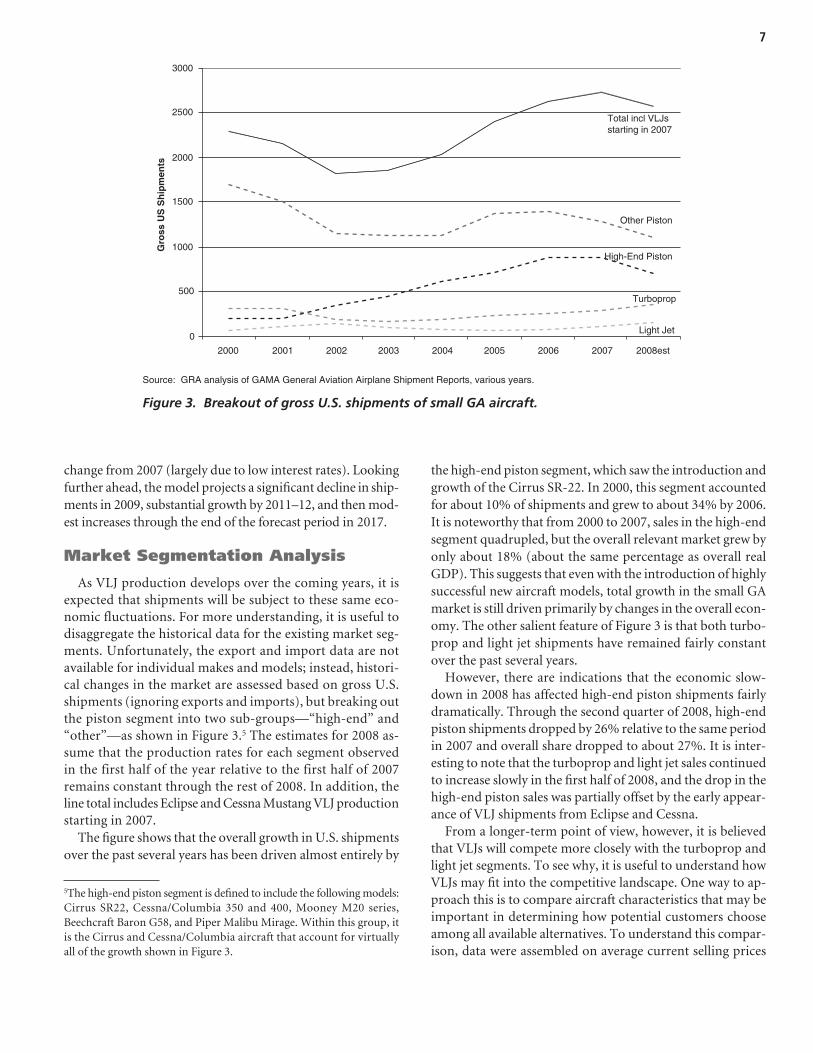
As VLJ production develops over the coming years, it isexpected that shipments will be subject to these same eco-nomic fluctuations. For more understanding, it is useful todisaggregate the historical data for the existing market seg-ments. Unfortunately, the export and import data are notavailable for individual makes and models; instead, histori-cal changes in the market are assessed based on gross U.S.shipments (ignoring exports and imports), but breaking outthe piston segment into two sub-groups—“high-end” and“other”—as shown in Figure 3.5 The estimates for 2008 as-sume that the production rates for each segment observedin the first half of the year relative to the first half of 2007 remains constant through the rest of 2008. In addition, theline total includes Eclipse and Cessna Mustang VLJ productionstarting in 2007.
The figure shows that the overall growth in U.S. shipmentsover the past several years has been driven almost entirely by
the high-end piston segment, which saw the introduction andgrowth of the Cirrus SR-22. In 2000, this segment accountedfor about 10% of shipments and grew to about 34% by 2006.It is noteworthy that from 2000 to 2007, sales in the high-endsegment quadrupled, but the overall relevant market grew byonly about 18% (about the same percentage as overall realGDP). This suggests that even with the introduction of highlysuccessful new aircraft models, total growth in the small GAmarket is still driven primarily by changes in the overall econ-omy. The other salient feature of Figure 3 is that both turbo-prop and light jet shipments have remained fairly constantover the past several years.
However, there are indications that the economic slow-down in 2008 has affected high-end piston shipments fairlydramatically. Through the second quarter of 2008, high-endpiston shipments dropped by 26% relative to the same periodin 2007 and overall share dropped to about 27%. It is inter-esting to note that the turboprop and light jet sales continuedto increase slowly in the first half of 2008, and the drop in thehigh-end piston sales was partially offset by the early appear-ance of VLJ shipments from Eclipse and Cessna.
From a longer-term point of view, however, it is believedthat VLJs will compete more closely with the turboprop andlight jet segments. To see why, it is useful to understand howVLJs may fit into the competitive landscape. One way to ap-proach this is to compare aircraft characteristics that may beimportant in determining how potential customers chooseamong all available alternatives. To understand this compar-ison, data were assembled on average current selling prices
7
5The high-end piston segment is defined to include the following models:Cirrus SR22, Cessna/Columbia 350 and 400, Mooney M20 series,Beechcraft Baron G58, and Piper Malibu Mirage. Within this group, itis the Cirrus and Cessna/Columbia aircraft that account for virtuallyall of the growth shown in Figure 3.
High-End Piston
Turboprop
Light Jet
Other Piston
Total incl VLJsstarting in 2007
0
500
1000
1500
2000
2500
3000
2000 2001 2002 2003 2004 2005 2006 2007 2008est
Gro
ss U
S S
hip
men
ts
Source: GRA analysis of GAMA General Aviation Airplane Shipment Reports, various years.
Figure 3. Breakout of gross U.S. shipments of small GA aircraft.
8
Type Make/Model Price ($000)
Cabin Volume inclExternal Baggage
(cu. ft.)Speed(mph)
Range(NM)
Cirrus SR22 G2 460 169 180 930Cessna 400 620 169 187 1143Beechcraft Baron G58 1,078 196 197 888King Air 90 2,952 227 260 840King Air 200 5,089 303 283 920King Air 350 6,115 351 310 1440Piper Meridian 1,897 120 262 550Cessna 208B Caravan 1,844 340 182 780Cessna CJ1+ 4,528 243 381 857Cessna CJ2+ 6,068 311 413 1074Beechcraft Premier I/IA 6,205 370 426 850
Note: Average prices for Cirrus SR22 and Cessna 400 prices obtained from www.controller.com; range for BaronG58 obtained from www.cessna.com
Piston
Turboprop
Light Jet
Table 5. Comparative price and performance characteristics of existing models.
Beechcraft Premier IA(J)
Cessna CJ2+ (J)
Cessna CJ1+ (J)
208B Grand Caravan(T)
Piper Malibu Meridian(T)
King Air 350 (T)
King Air 200 (T)
King Air 90 (T)
Baron G58 (P)
Cessna 400 (P)
Cirrus SR22 (P)0
1000
2000
3000
4000
5000
6000
7000
8000
0 1000 2000 3000 4000 5000 6000 7000 8000
Expected Price ($000)
Act
ual
Pri
ce (
$000
)
Figure 4. Expected versus actual price of small GA aircraft.
and certain key performance characteristics for a representa-tive sample of existing high-end piston, turboprop, and lightjet models, shown in Table 5.
To ensure consistency in the measurements, all of the data(with a few noted exceptions) were obtained from the samesource (Conklin and de Decker Aircraft Cost Evaluator).
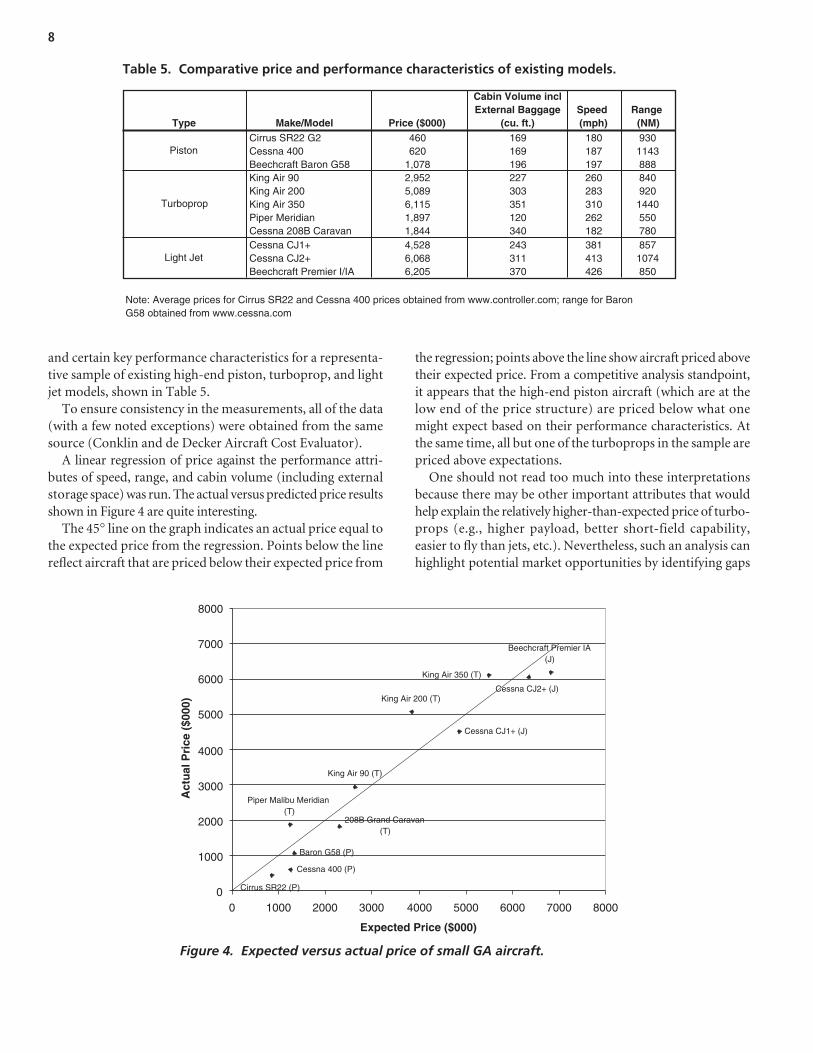
A linear regression of price against the performance attri-butes of speed, range, and cabin volume (including externalstorage space) was run. The actual versus predicted price resultsshown in Figure 4 are quite interesting.
The 45° line on the graph indicates an actual price equal tothe expected price from the regression. Points below the linereflect aircraft that are priced below their expected price from
the regression; points above the line show aircraft priced abovetheir expected price. From a competitive analysis standpoint,it appears that the high-end piston aircraft (which are at thelow end of the price structure) are priced below what onemight expect based on their performance characteristics. Atthe same time, all but one of the turboprops in the sample arepriced above expectations.
One should not read too much into these interpretationsbecause there may be other important attributes that wouldhelp explain the relatively higher-than-expected price of turbo-props (e.g., higher payload, better short-field capability, easier to fly than jets, etc.). Nevertheless, such an analysis canhighlight potential market opportunities by identifying gaps
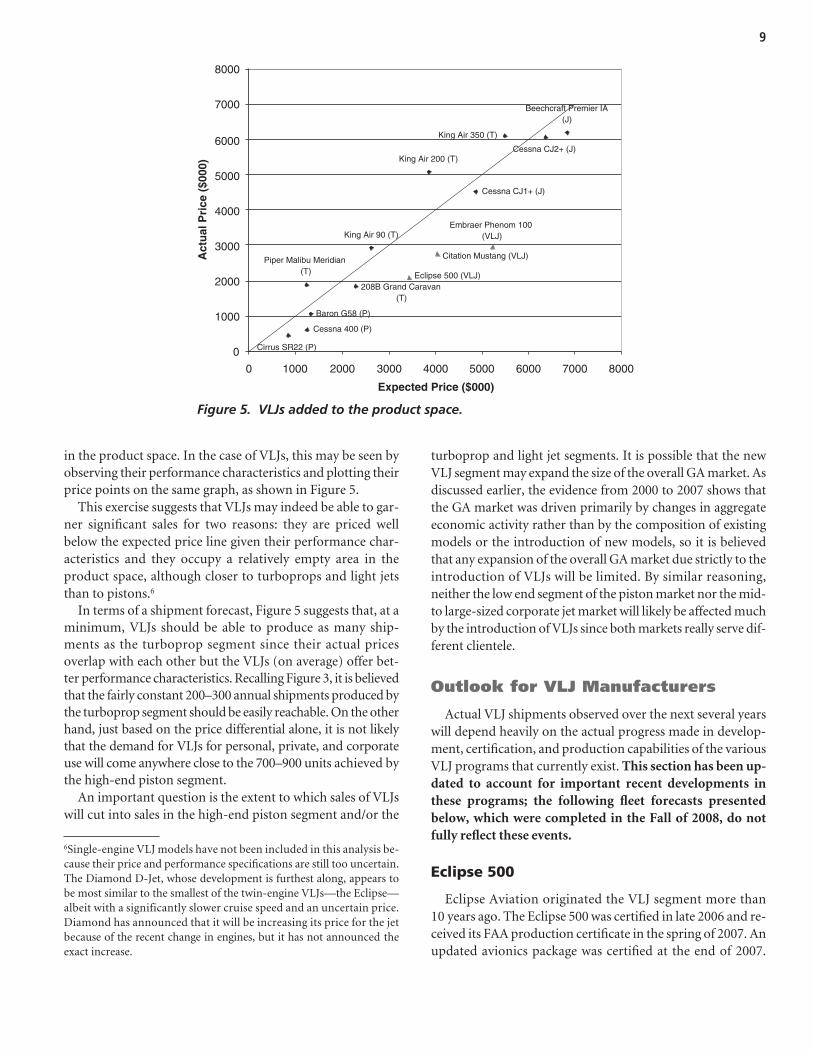
in the product space. In the case of VLJs, this may be seen byobserving their performance characteristics and plotting theirprice points on the same graph, as shown in Figure 5.
This exercise suggests that VLJs may indeed be able to gar-ner significant sales for two reasons: they are priced wellbelow the expected price line given their performance char-acteristics and they occupy a relatively empty area in theproduct space, although closer to turboprops and light jetsthan to pistons.6
In terms of a shipment forecast, Figure 5 suggests that, at aminimum, VLJs should be able to produce as many ship-ments as the turboprop segment since their actual pricesoverlap with each other but the VLJs (on average) offer bet-ter performance characteristics. Recalling Figure 3, it is believedthat the fairly constant 200–300 annual shipments produced bythe turboprop segment should be easily reachable. On the otherhand, just based on the price differential alone, it is not likelythat the demand for VLJs for personal, private, and corporateuse will come anywhere close to the 700–900 units achieved bythe high-end piston segment.
An important question is the extent to which sales of VLJswill cut into sales in the high-end piston segment and/or the
turboprop and light jet segments. It is possible that the newVLJ segment may expand the size of the overall GA market. Asdiscussed earlier, the evidence from 2000 to 2007 shows thatthe GA market was driven primarily by changes in aggregateeconomic activity rather than by the composition of existingmodels or the introduction of new models, so it is believedthat any expansion of the overall GA market due strictly to theintroduction of VLJs will be limited. By similar reasoning, neither the low end segment of the piston market nor the mid-to large-sized corporate jet market will likely be affected muchby the introduction of VLJs since both markets really serve dif-ferent clientele.
Outlook for VLJ Manufacturers
Actual VLJ shipments observed over the next several yearswill depend heavily on the actual progress made in develop-ment, certification, and production capabilities of the variousVLJ programs that currently exist. This section has been up-dated to account for important recent developments inthese programs; the following fleet forecasts presentedbelow, which were completed in the Fall of 2008, do notfully reflect these events.
Eclipse 500
Eclipse Aviation originated the VLJ segment more than10 years ago. The Eclipse 500 was certified in late 2006 and re-ceived its FAA production certificate in the spring of 2007. Anupdated avionics package was certified at the end of 2007.
9
Cirrus SR22 (P)
Cessna 400 (P)
Baron G58 (P)
King Air 90 (T)
King Air 200 (T)
King Air 350 (T)
Piper Malibu Meridian(T)
208B Grand Caravan(T)
Cessna CJ1+ (J)
Cessna CJ2+ (J)
Beechcraft Premier IA(J)
Embraer Phenom 100(VLJ)
Citation Mustang (VLJ)
Eclipse 500 (VLJ)
0
1000
2000
3000
4000
5000
6000
7000
8000
0 1000 2000 3000 4000 5000 6000 7000 8000
Expected Price ($000)
Act
ual
Pri
ce (
$000
)
Figure 5. VLJs added to the product space.
6Single-engine VLJ models have not been included in this analysis be-cause their price and performance specifications are still too uncertain.The Diamond D-Jet, whose development is furthest along, appears tobe most similar to the smallest of the twin-engine VLJs—the Eclipse—albeit with a significantly slower cruise speed and an uncertain price.Diamond has announced that it will be increasing its price for the jetbecause of the recent change in engines, but it has not announced theexact increase.
Eclipse announced a price increase from $1.6 million to$2.15 million in mid-2008. A total of 260 units were deliveredthrough the end of 2008.
Although press reports indicated that the company had anorder backlog of 2,600 units in June 2008, approximately1,400 of those were from the air taxi startup DayJet, whichceased operations in September 2008 after purchasing 28Eclipse aircraft. DayJet announced that it is unlikely that thecompany will operate in the future. This left approximately1,200 orders on the Eclipse books.
At various times, press reports had indicated Eclipse’s pro-duction goal to be anywhere between 2 and 4 units per day,with a break-even point of 500 units per year (although this wasbefore the 2008 price increase). But in August 2008, Eclipse an-nounced it was laying off 38% of its workforce. By October2008, at least two industry analysts projected that Eclipse wouldcease U.S. production of the Eclipse 500 entirely in 2009.7 Pro-duction actually stopped in October 2008, and the companyfiled for Chapter 11 bankruptcy protection in November. ByMarch 2009, company management and a number of creditorswere seeking a Chapter 7 liquidation.
Cessna Citation Mustang
The Cessna Citation Mustang twin-engine VLJ was certi-fied in late 2006. The current base price of the aircraft is ap-proximately $2.8 million, and its primary target market doesnot include air taxi services. The company delivered a total of45 Mustangs in 2007 and 101 aircraft in 2008. The companyannounced in October 2008 that it had achieved its plannedfull-rate annual production level and expected to produce150 units per year starting in 2009.
Embraer Phenom 100
The Embraer Phenom 100 is larger than other VLJs; it isalso somewhat faster in terms of cruising speed and has a fairlysophisticated wing design. It is clearly aimed at the upper endof the VLJ market, with a unit price of about $3.2 million. FAAcertification was achieved in December 2008 and two aircraftwere delivered by the end of the year. Embraer has consis-tently announced order statistics for the aircraft only in combi-nation with the larger Phenom 300. In June 2008, the companyclaimed close to 800 firm orders for the two jets.
The company announced that combined production for thetwo Phenom aircraft could ramp up to the 120–150 range in2009. As with Cessna, Embraer believes there is a viable marketfor their aircraft independent of the success or failure of the air
taxi market. Separately, press reports indicate that the companyhas revised its latest 10-yr market forecast for worldwide busi-ness jet sales, indicating faster growth in emerging markets andslower growth in North America. Based partly on Embraer’shistorical pattern of sales and press reports of interest fromother areas, it is expected that perhaps half of the Phenom pro-duction will be destined for the U.S. market. This compareswith an aggregate historical average of about 25% non-U.S.sales in the GA market overall.
The Fractional Ownership Market
In addition to traditional GA sales for private, business,and corporate use, there are some indications that VLJs maybe a viable option in the fractional ownership market. Butthere is little evidence that any of the major participants—NetJets, Flexjet (Bombardier), Sentient (fleet shares), or FlightOptions (used aircraft)—has indicated direct interest in purchasing VLJs for their fleets.8 On the other hand, somesmaller companies do have plans to include VLJs as an optionin their fractional ownership programs. In addition, there area number of other fractional providers of high-end pistonand/or turboprop aircraft that compete near the same mar-ket space as VLJs.
Based on these and other reports of small GA fractionalownership plans, the GA fleet forecast below accounts for asmall but increasing number of VLJ sales for fractional useabove and beyond the forecasts for specific manufacturers.
Baseline GA Fleet Forecast
Based on the competitive analysis and the projected over-all size of the net U.S. market as shown in Figure 2, the base-line forecast for net U.S. VLJ shipments for GA use are basedon the following assumptions:
• Overall market size will rise according to the estimatesshown earlier in Figure 2.
• By 2011, the approximately 120 annual Eclipse deliveriesoriginally envisioned for the U.S. market will be replacedby other manufacturers with ongoing VLJ developmentprograms such as Honda and Piper.
• Shipments of the Cessna Mustang for GA use will reach thecompany’s stated goal of 150 annually in 2009, with 40%eventually going to foreign customers.9
10
7Teal Group Corporation, “World Military & Civil Aviation Briefing,”October 2008; Forecast International, “Forecast International ProjectsEnd of Eclipse 500 Production” press release, October 28, 2008.
8CitationShares, which is a joint venture of Cessna and TAG Aviation, focuses on fractional ownership of smaller aircraft including the CessnaCJ1, which is considered part of the “light jet” category in this analysis.9According to Cessna, 60% of current Mustang orders are designatedfor non-U.S. customers (http://www.very-light-jet.com/vlj-news/vlj-manufacturer-news/cessna-citation-mustang-fleet-reaches-100.html).
• Shipments of the Embraer Phenom 100 for GA use willreach an annual rate of 90 by 2011, with 50% going to for-eign customers.
• There will be some additional VLJ shipments from othermanufacturers beginning in 2010, which will be furthersupplemented by a small number of shipments explicitlyfor fractional use.
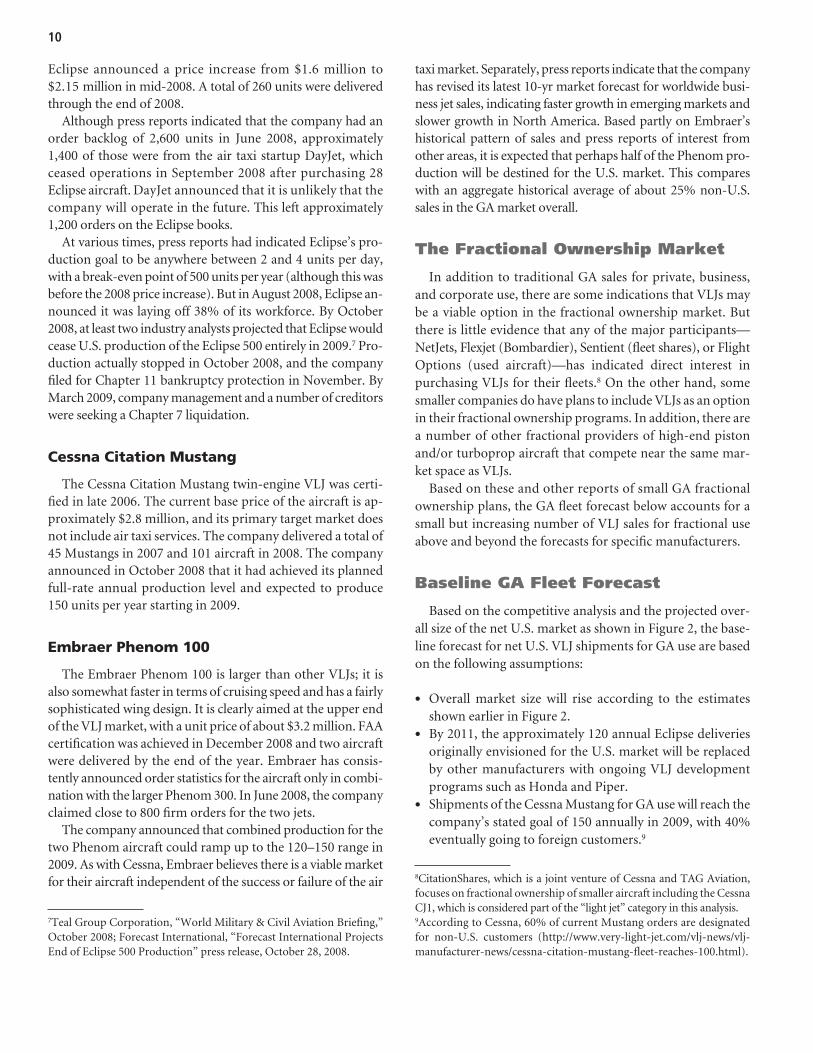
The baseline forecast for the United States based on thesefactors is shown in Table 6.
Again, it is important to remember that these projectionsare for the U.S. market only and reflect the likelihood thata significant share of VLJ shipments will be overseas in thecoming years. The projections suggest that VLJs will repre-sent around 14% of the total small GA market over thecoming decade. As noted earlier, no specific account hasbeen taken of the potential for sales of single-engine VLJs,which may somewhat offset the uncertainty with other projections.
Operational Impacts on Airports
How will the GA fleet forecast affect operations activity at GAairports? As noted earlier, it is believed that most non-air taxiVLJ sales will be substitutes for purchases of high-end piston,turboprop, and/or light jets; their effect on the size of the over-all market will be quite limited. In addition, the activity countsat many small airports typically do not grow even in proportionto overall fleet growth (presumably because the new additionsto the fleet are most often used at larger airports).
Consequently, it is believed that the overall level of futureactivity at most small GA airports will not be significantly af-fected by specific fleet projections of VLJ aircraft that are soldfor traditional GA use. However, the composition of activitymay change as VLJ operations come to displace piston or turbo-prop activity. Current FAA projections of operations such asthose contained in the Terminal Area Forecasts (TAFs) arestill probably the best indicators of future overall activity (butthis is before accounting for potential growth from the air taximarket, which is discussed in the next chapter).
11
YearMajor Manufacturers
(Eclipse - Cessna - Embraer) Others Annual Total Cumulative Total
143143014320073992560256200864925002502009962313502632010
1,2923307525520111,64735510025520122,02738012525520132,40738012525520142,7873801252552015
3,16738012525520163,5473801252552017
Note: Projections exclude shipments to non-US customers.
Table 6. Annual VLJ sales forecast for U.S. market: GA only, excluding air taxi.
12
Introduction
To develop a fleet forecast for air taxi services involvingnext-generation small aircraft, the primary focus relies on theview that the demand for aircraft will ultimately be derivedfrom the consumer demand for such services. This approachis quite different from the GA analysis of the previous chapterwhere the forecast depended importantly on supply factors re-lated to the financial outlook and production capabilities ofthe major VLJ manufacturers. The analysis that follows is bestthought of as a market “potential” forecast and, because theair taxi market is just now emerging, it is inherently somewhatspeculative. Because the focus is on potential market demand,it is implicitly assumed that manufacturers will be able toexpand production as needed to meet the demand.
The consumer demand for air taxi services can be viewedas a part of overall travel demand by consumers. The primarycomponents of travel demand that are relevant for the currentanalysis include trip generation, mode choice, and trip distribu-tion. Trip generation refers to the overall number of travel tripsand reflects the initial decision about whether to travel. Modechoice refers to which mode will be used for the trips. Trip dis-tribution refers to where the trips will occur; for present pur-poses, the primary interest is only in the origin and destinationof each trip as opposed to the actual routing.
Standard analysis of travel demand recognizes that it is aderived demand—people travel not because they enjoy travel-ling, but because it is a necessary component of some otherend-use desire (e.g., meeting with clients or other businessassociates, going on a vacation, visiting relatives, etc.). Becauseof this, one cannot conclude that a newly available mode oftravel (e.g., VLJs) will necessarily increase the overall demandfor travel. Rather, it is more likely that VLJs may “steal” traf-fic from other existing modes of travel. Overall growth intravel demand and trip generation is likely to depend mostlyon demographic trends in population and income. For thepresent study, a constant per-capita trip rate is assumed for
the domestic United States, and overall growth in travel trips isassumed to be proportional to population growth. As discussedin more detail below, income effects are treated as determinantsof travel mode choice rather than overall trip generation.
Normally, one might expect that air taxi services offered onnext-generation small aircraft would compete primarily withexisting air taxi services—those offered by small piston, turbo-prop, and/or light jet aircraft. However, many analysts believethat air taxi services provided by next-generation small aircraftalso have the potential to compete for trips that are currentlytaken via commercial air service and/or automobile. These lat-ter categories provide many times more trips than current air taxi services, so it is important to include these travel modesin the analysis.10 However, it also is important to recognize thatnot all commercial air and automobile trips will be relevant. Infact, it is likely that only a relatively small portion of such trips—in particular, business trips by high income travelers over rela-tively short distances—will be realistic candidates for switchingto VLJ services. The specific filters used to restrict the “universe”of potential VLJ travelers on each mode are discussed below.
The primary analysis approach used is a mode choice analy-sis. The basic approach involves defining the “universe” ofpotential existing trips for each mode in which next-generationair taxi services may be able to compete. Each mode is definedby a set of attributes relevant for travelers deciding among theavailable choices. Typically the primary attributes thought to affect mode choice in transportation studies are price (i.e., cost)and travel time. In addition, characteristics of the individualsmaking the mode choices (typically income) may be important.
For the present analysis, it was also important to consider theimpact of party size on the mode choice decision. For example,
C H A P T E R 3
Air Taxi Forecast
10White papers appearing on air taxi startup DayJet’s website specificallymention the potential demand for their services from business travelerswho currently travel via automobile because of the relative lack ofcommercial air service between many smaller destinations in DayJet’sprimary service area.
suppose a group of four travelers has chosen to travel on a six-passenger light jet; statistical estimates of the likelihood ofchoosing a three-passenger VLJ if it were available may thendepend critically on whether the group of four is travellingtogether and whether the light jet or VLJ services are sold on aper-seat basis or a traditional charter basis. This is discussed inmore detail below.
An important requirement in estimating a mode choicemodel is that the attributes of all modes that are available (andnot just the one that was actually chosen) must be measured.The essential output from the mode choice model gives statis-tical coefficients for the mode attributes and individual char-acteristics that can then be used to estimate the probability thatthe individual will choose each available mode. These prob-abilities then can be translated into “shares.” For example,suppose there are 1,000 observed trips involving commer-cial air as the mode of travel; this means that 1,000 individ-uals actually chose commercial air as their preferred mode.The statistical model will generate predictions about theprobability that these trips are taken by each of the availablemodes. It may indicate, say, an 80% probability that thesetrips will be taken by commercial air; an 8% probability forthe automobile mode; and a 4% probability for each of thethree currently available air taxi modes (piston, prop, lightjet). Multiplying the probabilities (shares) by the number oftrips yields projected trip totals for each mode (i.e., 800 com-mercial air trips, etc.).
Then, to simulate the impact of the entry of VLJs into themarket for the forecast years 2012 and 2017, a new “mode”is added with particular attributes representing VLJs, and theshares are recalculated based on the estimated coefficients. Toaccount for generic growth in travel over time, the overall num-ber of trips is grown for the forecast years 2012 and 2017 basedon population growth projections assuming the overall per-capita trip rate remains constant. Finally, estimates of passen-gers per flight and annual aircraft utilization rates are applied totransform these projected VLJ trips into fleet forecasts.
For present purposes, it was much more efficient to use ex-isting survey data rather than to design and undertake a sur-vey from scratch. For the existing air taxi and commercial airmodes, the best available data are those from mode-specificdatasets: daily Enhanced Traffic Management System (ETMS)traffic in FY2007 collected by the FAA in the case of air taxiand quarterly Origin-Destination Survey (DB1B) for FY2007collected by the U.S. DOT in the case of commercial air. Forautomobile traffic, the potential universe of trips is drawnfrom the 1995 American Travel Survey (ATS) conducted bythe U.S.DOT. Although this survey covers all modes of per-sonal transportation (including commercial air and chartertravel), it does not provide nearly the same level of geographicdetail that the ETMS and DB1B datasets provide. However, itdoes provide a much larger sample of long-distance trips and
more useful information on trip origins and destinations thanits successor survey that was conducted in 2001.11
Data Details
Airport Data
The universe of potential airports for handling VLJ activ-ity was restricted to public-use facilities in the lower 48 stateswith at least one 3,000-ft lighted runway and jet fuel availabil-ity. For air taxi use, FAA medium- and large-hub commer-cial service airports were excluded from the database basedon observed usage patterns from various air taxi operatorsshowing that such airports are avoided (presumably to avoidairside and/or landside congestion at these facilities). Theserestrictions resulted in a “VLJ airport” universe totaling 1,842facilities. This list in fact includes a combination of commer-cial service, reliever, and GA airports; it is meant to representthe airports that are most likely to be impacted by growth inthe activity of VLJs and similar aircraft.
It is likely that owners and operators of next-generationequipment will want to take advantage of the advanced avion-ics packages in their aircraft; this suggests that airports withprecision approach capabilities will be most attractive to theseusers. In addition, airports with other amenities such as hangarfacilities, ground transportation services, de-icing and snow removal capabilities, mobile auxiliary power units, and so forthwill be attractive to VLJ air taxi operators. While sufficient dataon these latter attributes for the 1,842 identified facilities arenot available, it is possible to assess airport “readiness” for VLJsbased on observed characteristics and some proxy measures.Table 7 breaks out the airports regionally based on the avail-ability of at least one precision runway, plus the number ofbased GA jet aircraft. It is reasonable to presume that airportsthat have precision approach runways and higher numbers ofbased GA jet aircraft are more likely to be “VLJ-ready” thanthose that do not.
As seen in the table, the highest number of airports withprecision approaches and higher numbers of based jet aircraftare in the Southern, Southwestern, Eastern, and Great Lakesregions. It is not surprising that many industry observers expect these areas to attract the highest number of VLJ oper-ations, and compatible assumptions are made below in thestatistical analysis where projections of future operations areestimated.
For each VLJ airport, the two closest commercial airports(those with at least three daily scheduled departures) were
13
11Clearly there is a need for more recent survey data—not only for thisstudy, but also for work in other areas. In 2008, U.S.DOT launchedthe most recent National Household Travel Survey; data will continueto be collected through the Spring of 2009, and the first set of resultsis expected to be available late in 2009.
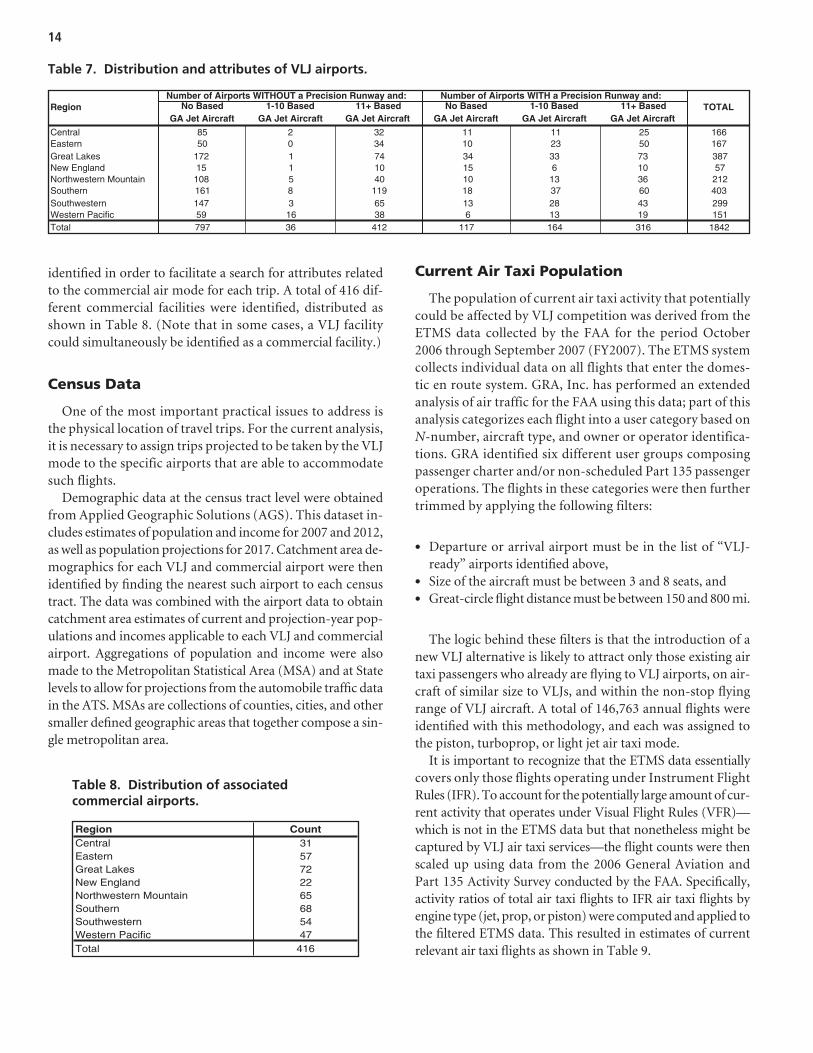
identified in order to facilitate a search for attributes relatedto the commercial air mode for each trip. A total of 416 dif-ferent commercial facilities were identified, distributed asshown in Table 8. (Note that in some cases, a VLJ facilitycould simultaneously be identified as a commercial facility.)
Census Data
One of the most important practical issues to address isthe physical location of travel trips. For the current analysis,it is necessary to assign trips projected to be taken by the VLJmode to the specific airports that are able to accommodatesuch flights.
Demographic data at the census tract level were obtainedfrom Applied Geographic Solutions (AGS). This dataset in-cludes estimates of population and income for 2007 and 2012,as well as population projections for 2017. Catchment area de-mographics for each VLJ and commercial airport were thenidentified by finding the nearest such airport to each censustract. The data was combined with the airport data to obtaincatchment area estimates of current and projection-year pop-ulations and incomes applicable to each VLJ and commercialairport. Aggregations of population and income were alsomade to the Metropolitan Statistical Area (MSA) and at Statelevels to allow for projections from the automobile traffic datain the ATS. MSAs are collections of counties, cities, and othersmaller defined geographic areas that together compose a sin-gle metropolitan area.
Current Air Taxi Population
The population of current air taxi activity that potentiallycould be affected by VLJ competition was derived from theETMS data collected by the FAA for the period October2006 through September 2007 (FY2007). The ETMS systemcollects individual data on all flights that enter the domes-tic en route system. GRA, Inc. has performed an extendedanalysis of air traffic for the FAA using this data; part of thisanalysis categorizes each flight into a user category based onN-number, aircraft type, and owner or operator identifica-tions. GRA identified six different user groups composingpassenger charter and/or non-scheduled Part 135 passengeroperations. The flights in these categories were then furthertrimmed by applying the following filters:
• Departure or arrival airport must be in the list of “VLJ-ready” airports identified above,
• Size of the aircraft must be between 3 and 8 seats, and• Great-circle flight distance must be between 150 and 800 mi.
The logic behind these filters is that the introduction of anew VLJ alternative is likely to attract only those existing airtaxi passengers who already are flying to VLJ airports, on air-craft of similar size to VLJs, and within the non-stop flyingrange of VLJ aircraft. A total of 146,763 annual flights wereidentified with this methodology, and each was assigned tothe piston, turboprop, or light jet air taxi mode.
It is important to recognize that the ETMS data essentiallycovers only those flights operating under Instrument FlightRules (IFR). To account for the potentially large amount of cur-rent activity that operates under Visual Flight Rules (VFR)—which is not in the ETMS data but that nonetheless might becaptured by VLJ air taxi services—the flight counts were thenscaled up using data from the 2006 General Aviation andPart 135 Activity Survey conducted by the FAA. Specifically, activity ratios of total air taxi flights to IFR air taxi flights by engine type (jet, prop, or piston) were computed and applied tothe filtered ETMS data. This resulted in estimates of currentrelevant air taxi flights as shown in Table 9.
14
No BasedGA Jet Aircraft
1-10 BasedGA Jet Aircraft
11+ BasedGA Jet Aircraft
No BasedGA Jet Aircraft
1-10 BasedGA Jet Aircraft
11+ BasedGA Jet Aircraft
16625111132285Central16750231034050Eastern
Great Lakes 172 1 74 34 33 73 387New England 15 1 10 15 6 10 57Northwestern Mountain 108 5 40 10 13 36 212
4036037181198161SouthernSouthwestern 147 3 65 13 28 43 299Western Pacific 59 16 38 6 13 19 151
184231616411741236797Total
Number of Airports WITHOUT a Precision Runway and:Region
Number of Airports WITH a Precision Runway and:TOTAL
Table 7. Distribution and attributes of VLJ airports.
Region Count31Central57Eastern72Great Lakes22New England
Northwestern Mountain68Southern54Southwestern47Western Pacific
416Total
65
Table 8. Distribution of associated commercial airports.
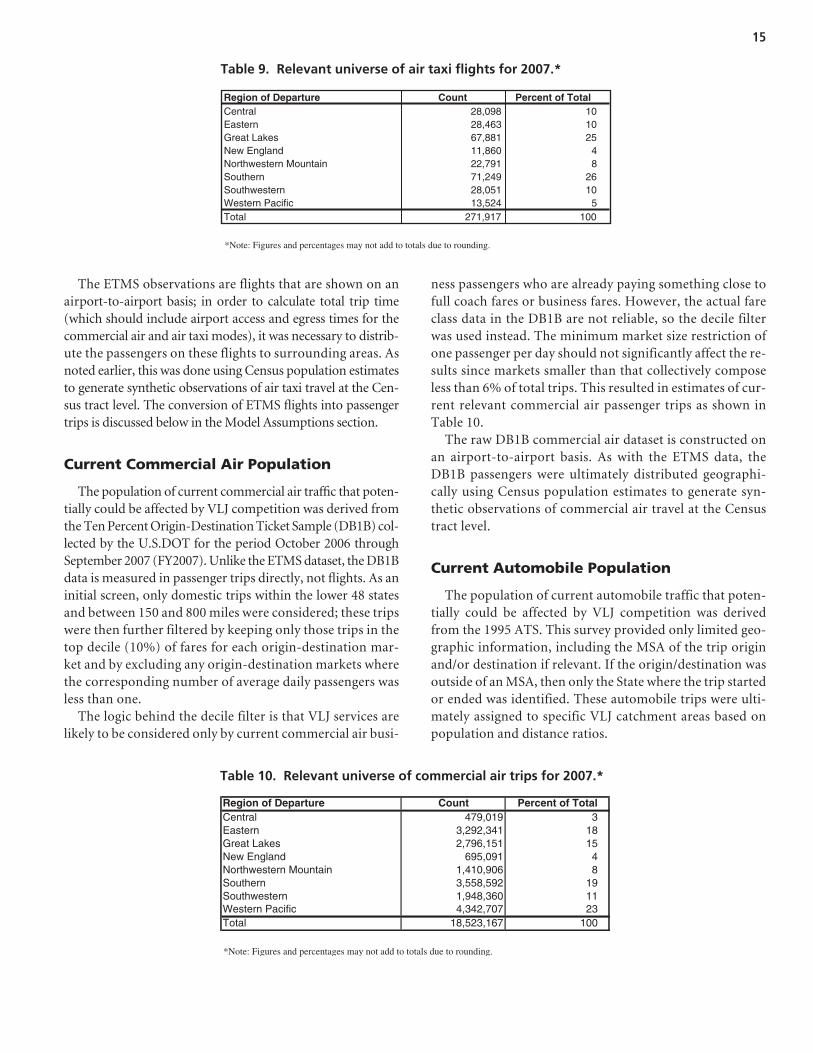
The ETMS observations are flights that are shown on anairport-to-airport basis; in order to calculate total trip time(which should include airport access and egress times for thecommercial air and air taxi modes), it was necessary to distrib-ute the passengers on these flights to surrounding areas. Asnoted earlier, this was done using Census population estimatesto generate synthetic observations of air taxi travel at the Cen-sus tract level. The conversion of ETMS flights into passengertrips is discussed below in the Model Assumptions section.
Current Commercial Air Population
The population of current commercial air traffic that poten-tially could be affected by VLJ competition was derived fromthe Ten Percent Origin-Destination Ticket Sample (DB1B) col-lected by the U.S.DOT for the period October 2006 throughSeptember 2007 (FY2007). Unlike the ETMS dataset, the DB1Bdata is measured in passenger trips directly, not flights. As aninitial screen, only domestic trips within the lower 48 statesand between 150 and 800 miles were considered; these tripswere then further filtered by keeping only those trips in thetop decile (10%) of fares for each origin-destination mar-ket and by excluding any origin-destination markets wherethe corresponding number of average daily passengers wasless than one.
The logic behind the decile filter is that VLJ services arelikely to be considered only by current commercial air busi-
ness passengers who are already paying something close tofull coach fares or business fares. However, the actual fareclass data in the DB1B are not reliable, so the decile filterwas used instead. The minimum market size restriction ofone passenger per day should not significantly affect the re-sults since markets smaller than that collectively composeless than 6% of total trips. This resulted in estimates of cur-rent relevant commercial air passenger trips as shown inTable 10.
The raw DB1B commercial air dataset is constructed onan airport-to-airport basis. As with the ETMS data, theDB1B passengers were ultimately distributed geographi-cally using Census population estimates to generate syn-thetic observations of commercial air travel at the Censustract level.
Current Automobile Population
The population of current automobile traffic that poten-tially could be affected by VLJ competition was derivedfrom the 1995 ATS. This survey provided only limited geo-graphic information, including the MSA of the trip originand/or destination if relevant. If the origin/destination wasoutside of an MSA, then only the State where the trip startedor ended was identified. These automobile trips were ulti-mately assigned to specific VLJ catchment areas based onpopulation and distance ratios.
15
Region of Departure Count Percent of Total1028,098Central1028,463Eastern2567,881Great Lakes
411,860New England822,791Northwestern Mountain
2671,249Southern1028,051Southwestern
513,524Western Pacific100271,917Total
*Note: Figures and percentages may not add to totals due to rounding.
Table 9. Relevant universe of air taxi flights for 2007.*
Percent of TotalCountRegion of Departure3479,019Central
183,292,341Eastern152,796,151Great Lakes4695,091New England81,410,906Northwestern Mountain
193,558,592Southern111,948,360Southwestern234,342,707Western Pacific
10018,523,167Total
*Note: Figures and percentages may not add to totals due to rounding.
Table 10. Relevant universe of commercial air trips for 2007.*
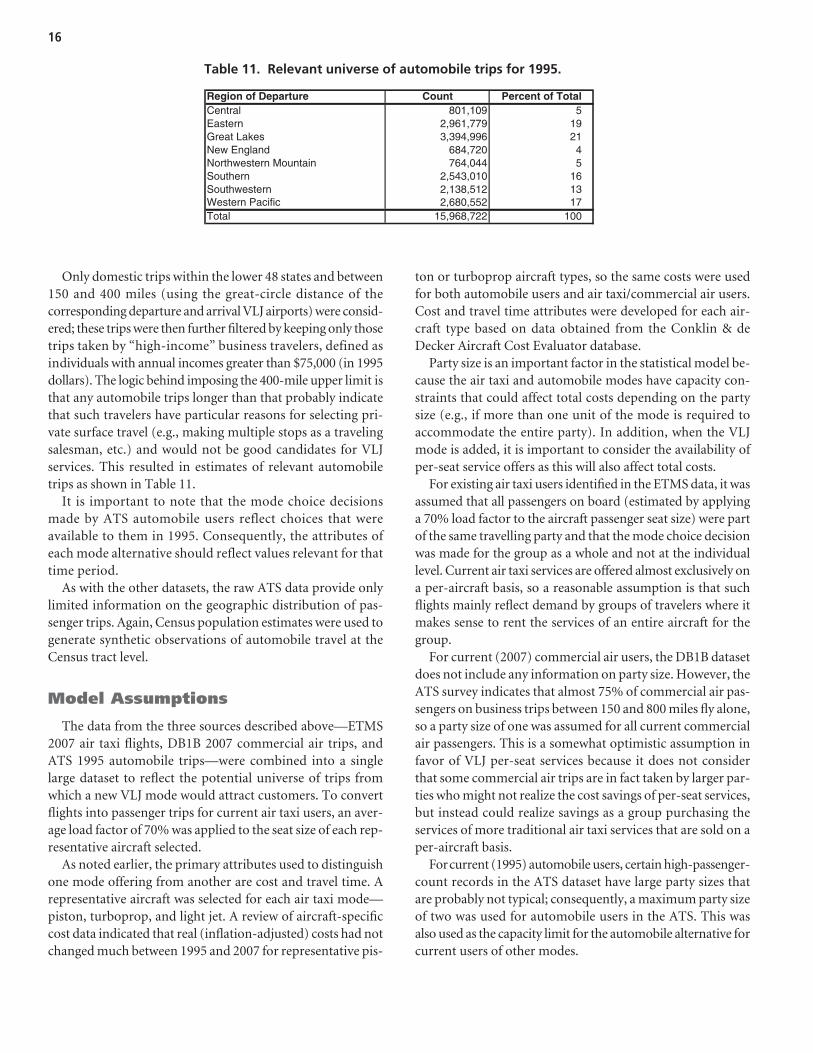
Only domestic trips within the lower 48 states and between150 and 400 miles (using the great-circle distance of thecorresponding departure and arrival VLJ airports) were consid-ered; these trips were then further filtered by keeping only thosetrips taken by “high-income” business travelers, defined asindividuals with annual incomes greater than $75,000 (in 1995dollars). The logic behind imposing the 400-mile upper limit isthat any automobile trips longer than that probably indicatethat such travelers have particular reasons for selecting pri-vate surface travel (e.g., making multiple stops as a travelingsalesman, etc.) and would not be good candidates for VLJservices. This resulted in estimates of relevant automobiletrips as shown in Table 11.
It is important to note that the mode choice decisionsmade by ATS automobile users reflect choices that wereavailable to them in 1995. Consequently, the attributes ofeach mode alternative should reflect values relevant for thattime period.
As with the other datasets, the raw ATS data provide onlylimited information on the geographic distribution of pas-senger trips. Again, Census population estimates were used togenerate synthetic observations of automobile travel at theCensus tract level.
Model Assumptions
The data from the three sources described above—ETMS2007 air taxi flights, DB1B 2007 commercial air trips, andATS 1995 automobile trips—were combined into a singlelarge dataset to reflect the potential universe of trips fromwhich a new VLJ mode would attract customers. To convertflights into passenger trips for current air taxi users, an aver-age load factor of 70% was applied to the seat size of each rep-resentative aircraft selected.
As noted earlier, the primary attributes used to distinguishone mode offering from another are cost and travel time. Arepresentative aircraft was selected for each air taxi mode—piston, turboprop, and light jet. A review of aircraft-specificcost data indicated that real (inflation-adjusted) costs had notchanged much between 1995 and 2007 for representative pis-
ton or turboprop aircraft types, so the same costs were usedfor both automobile users and air taxi/commercial air users.Cost and travel time attributes were developed for each air-craft type based on data obtained from the Conklin & deDecker Aircraft Cost Evaluator database.
Party size is an important factor in the statistical model be-cause the air taxi and automobile modes have capacity con-straints that could affect total costs depending on the partysize (e.g., if more than one unit of the mode is required to accommodate the entire party). In addition, when the VLJmode is added, it is important to consider the availability ofper-seat service offers as this will also affect total costs.
For existing air taxi users identified in the ETMS data, it wasassumed that all passengers on board (estimated by applyinga 70% load factor to the aircraft passenger seat size) were partof the same travelling party and that the mode choice decisionwas made for the group as a whole and not at the individuallevel. Current air taxi services are offered almost exclusively ona per-aircraft basis, so a reasonable assumption is that suchflights mainly reflect demand by groups of travelers where itmakes sense to rent the services of an entire aircraft for thegroup.
For current (2007) commercial air users, the DB1B datasetdoes not include any information on party size. However, theATS survey indicates that almost 75% of commercial air pas-sengers on business trips between 150 and 800 miles fly alone,so a party size of one was assumed for all current commercialair passengers. This is a somewhat optimistic assumption infavor of VLJ per-seat services because it does not considerthat some commercial air trips are in fact taken by larger par-ties who might not realize the cost savings of per-seat services,but instead could realize savings as a group purchasing theservices of more traditional air taxi services that are sold on aper-aircraft basis.
Forcurrent (1995) automobile users, certain high-passenger-count records in the ATS dataset have large party sizes thatare probably not typical; consequently, a maximum party sizeof two was used for automobile users in the ATS. This wasalso used as the capacity limit for the automobile alternative forcurrent users of other modes.
16
Percent of TotalCountRegion of DepartureCentralEasternGreat LakesNew EnglandNorthwestern MountainSouthernSouthwesternWestern PacificTotal
5801,109192,961,779213,394,9964684,7205764,044
162,543,010132,138,512172,680,552
10015,968,722
Table 11. Relevant universe of automobile trips for 1995.
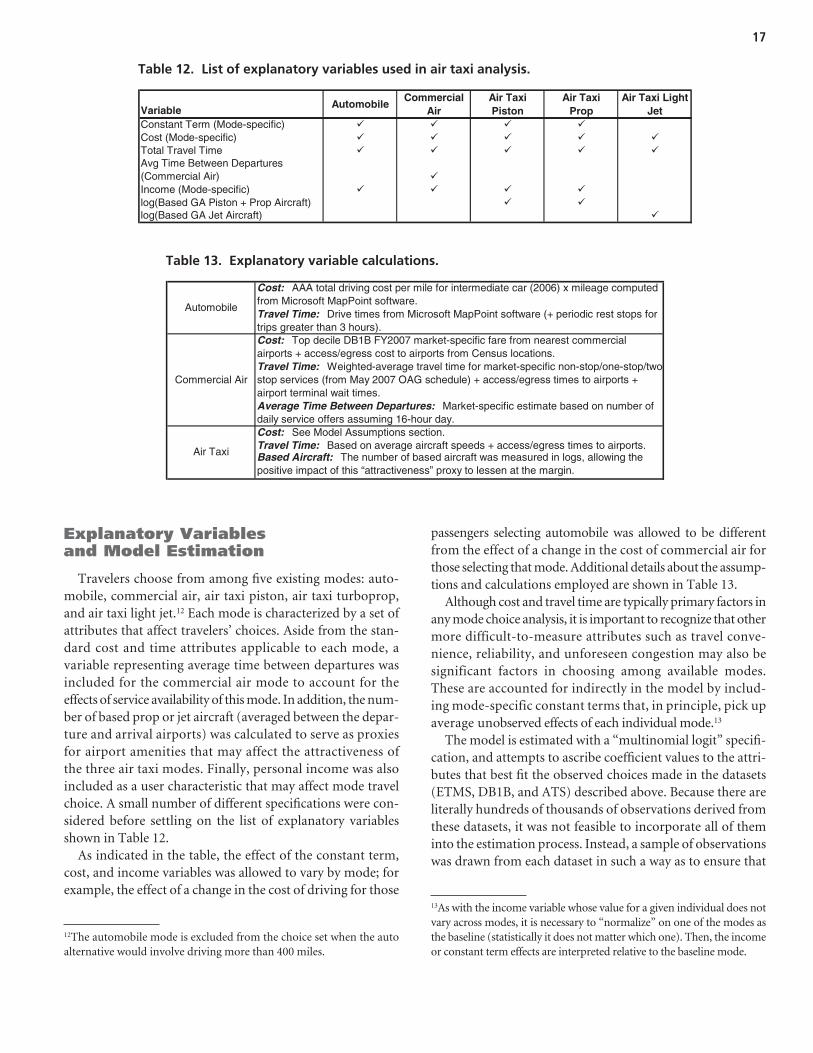
Explanatory Variables and Model Estimation
Travelers choose from among five existing modes: auto-mobile, commercial air, air taxi piston, air taxi turboprop,and air taxi light jet.12 Each mode is characterized by a set ofattributes that affect travelers’ choices. Aside from the stan-dard cost and time attributes applicable to each mode, avariable representing average time between departures was included for the commercial air mode to account for the effects of service availability of this mode. In addition, the num-ber of based prop or jet aircraft (averaged between the depar-ture and arrival airports) was calculated to serve as proxiesfor airport amenities that may affect the attractiveness ofthe three air taxi modes. Finally, personal income was alsoincluded as a user characteristic that may affect mode travelchoice. A small number of different specifications were con-sidered before settling on the list of explanatory variablesshown in Table 12.
As indicated in the table, the effect of the constant term,cost, and income variables was allowed to vary by mode; forexample, the effect of a change in the cost of driving for those
passengers selecting automobile was allowed to be differentfrom the effect of a change in the cost of commercial air forthose selecting that mode. Additional details about the assump-tions and calculations employed are shown in Table 13.
Although cost and travel time are typically primary factors inany mode choice analysis, it is important to recognize that othermore difficult-to-measure attributes such as travel conve-nience, reliability, and unforeseen congestion may also besignificant factors in choosing among available modes.These are accounted for indirectly in the model by includ-ing mode-specific constant terms that, in principle, pick upaverage unobserved effects of each individual mode.13
The model is estimated with a “multinomial logit” specifi-cation, and attempts to ascribe coefficient values to the attri-butes that best fit the observed choices made in the datasets(ETMS, DB1B, and ATS) described above. Because there areliterally hundreds of thousands of observations derived fromthese datasets, it was not feasible to incorporate all of theminto the estimation process. Instead, a sample of observationswas drawn from each dataset in such a way as to ensure that
17
Variable AutomobileCommercial
AirAir Taxi Piston
Air TaxiProp
Air Taxi Light Jet
Constant Term (Mode-specific)Cost (Mode-specific)Total Travel TimeAvg Time Between Departures (Commercial Air)Income (Mode-specific)log(Based GA Piston + Prop Aircraft)log(Based GA Jet Aircraft)
Table 12. List of explanatory variables used in air taxi analysis.
12The automobile mode is excluded from the choice set when the autoalternative would involve driving more than 400 miles.
Cost: AAA total driving cost per mile for intermediate car (2006) x mileage computed from Microsoft MapPoint software.Travel Time: Drive times from Microsoft MapPoint software (+ periodic rest stops for trips greater than 3 hours).Cost: Top decile DB1B FY2007 market-specific fare from nearest commercial airports + access/egress cost to airports from Census locations.Travel Time: Weighted-average travel time for market-specific non-stop/one-stop/two-stop services (from May 2007 OAG schedule) + access/egress times to airports + airport terminal wait times.Average Time Between Departures: Market-specific estimate based on number of daily service offers assuming 16-hour day.Cost: See Model Assumptions section.Travel Time: Based on average aircraft speeds + access/egress times to airports.Based Aircraft: The number of based aircraft was measured in logs, allowing the positive impact of this “attractiveness” proxy to lessen at the margin.
Automobile
Commercial Air
Air Taxi
Table 13. Explanatory variable calculations.
13As with the income variable whose value for a given individual does notvary across modes, it is necessary to “normalize” on one of the modes asthe baseline (statistically it does not matter which one). Then, the incomeor constant term effects are interpreted relative to the baseline mode.
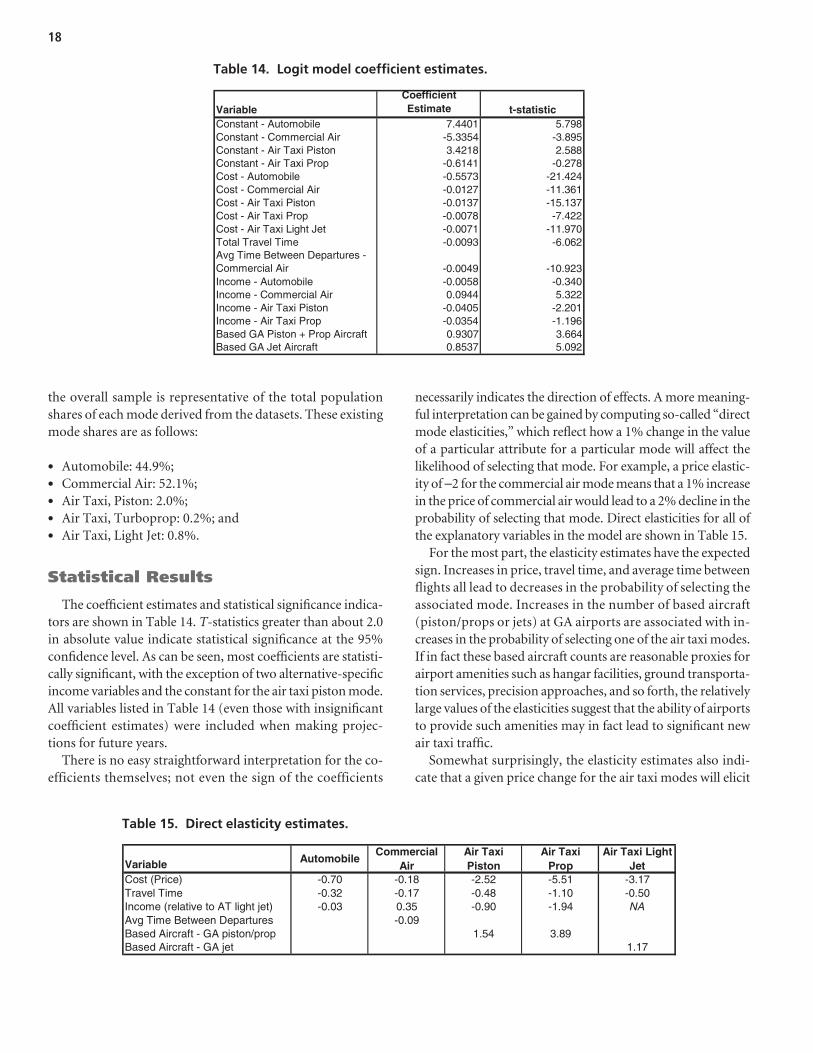
18
VariableCoefficient Estimate t-statistic
897.51044.7elibomotuA-tnatsnoCConstant - Commercial Air -5.3354 -3.895
885.28124.3notsiPixaTriA-tnatsnoC872.0-1416.0-porPixaTriA-tnatsnoC424.12-3755.0-elibomotuA-tsoC163.11-7210.0-riAlaicremmoC-tsoC731.51-7310.0-notsiPixaTriA-tsoC224.7-8700.0-porPixaTriA-tsoC079.11-1700.0-teJthgiLixaTriA-tsoC260.6-3900.0-emiTlevarTlatoT
Avg Time Between Departures - Commercial Air -0.0049 -10.923
043.0-8500.0-elibomotuA-emocnI223.54490.0riAlaicremmoC-emocnI102.2-5040.0-notsiPixaTriA-emocnI691.1-4530.0-porPixaTriA-emocnI
Based GA Piston + Prop Aircraft 0.9307 3.664290.57358.0tfarcriAteJAGdesaB
Table 14. Logit model coefficient estimates.
Variable AutomobileCommercial
AirAir Taxi Piston
Air TaxiProp
Air Taxi Light Jet
71.3-15.5-25.2-81.0-07.0-)ecirP(tsoC05.0-01.1-84.0-71.0-23.0-emiTlevarT
Income (relative to AT light jet) -0.03 0.35 -0.90 -1.94 NA90.0-serutrapeDneewteBemiTgvA
98.345.1porp/notsipAG-tfarcriAdesaBBased Aircraft - GA jet 1.17
Table 15. Direct elasticity estimates.
the overall sample is representative of the total populationshares of each mode derived from the datasets. These existingmode shares are as follows:
• Automobile: 44.9%;• Commercial Air: 52.1%;• Air Taxi, Piston: 2.0%;• Air Taxi, Turboprop: 0.2%; and• Air Taxi, Light Jet: 0.8%.
Statistical Results
The coefficient estimates and statistical significance indica-tors are shown in Table 14. T-statistics greater than about 2.0in absolute value indicate statistical significance at the 95%confidence level. As can be seen, most coefficients are statisti-cally significant, with the exception of two alternative-specificincome variables and the constant for the air taxi piston mode.All variables listed in Table 14 (even those with insignificantcoefficient estimates) were included when making projec-tions for future years.
There is no easy straightforward interpretation for the co-efficients themselves; not even the sign of the coefficients
necessarily indicates the direction of effects. A more meaning-ful interpretation can be gained by computing so-called “directmode elasticities,” which reflect how a 1% change in the valueof a particular attribute for a particular mode will affect thelikelihood of selecting that mode. For example, a price elastic-ity of −2 for the commercial air mode means that a 1% increasein the price of commercial air would lead to a 2% decline in theprobability of selecting that mode. Direct elasticities for all ofthe explanatory variables in the model are shown in Table 15.
For the most part, the elasticity estimates have the expectedsign. Increases in price, travel time, and average time betweenflights all lead to decreases in the probability of selecting theassociated mode. Increases in the number of based aircraft(piston/props or jets) at GA airports are associated with in-creases in the probability of selecting one of the air taxi modes.If in fact these based aircraft counts are reasonable proxies forairport amenities such as hangar facilities, ground transporta-tion services, precision approaches, and so forth, the relativelylarge values of the elasticities suggest that the ability of airportsto provide such amenities may in fact lead to significant newair taxi traffic.
Somewhat surprisingly, the elasticity estimates also indi-cate that a given price change for the air taxi modes will elicit
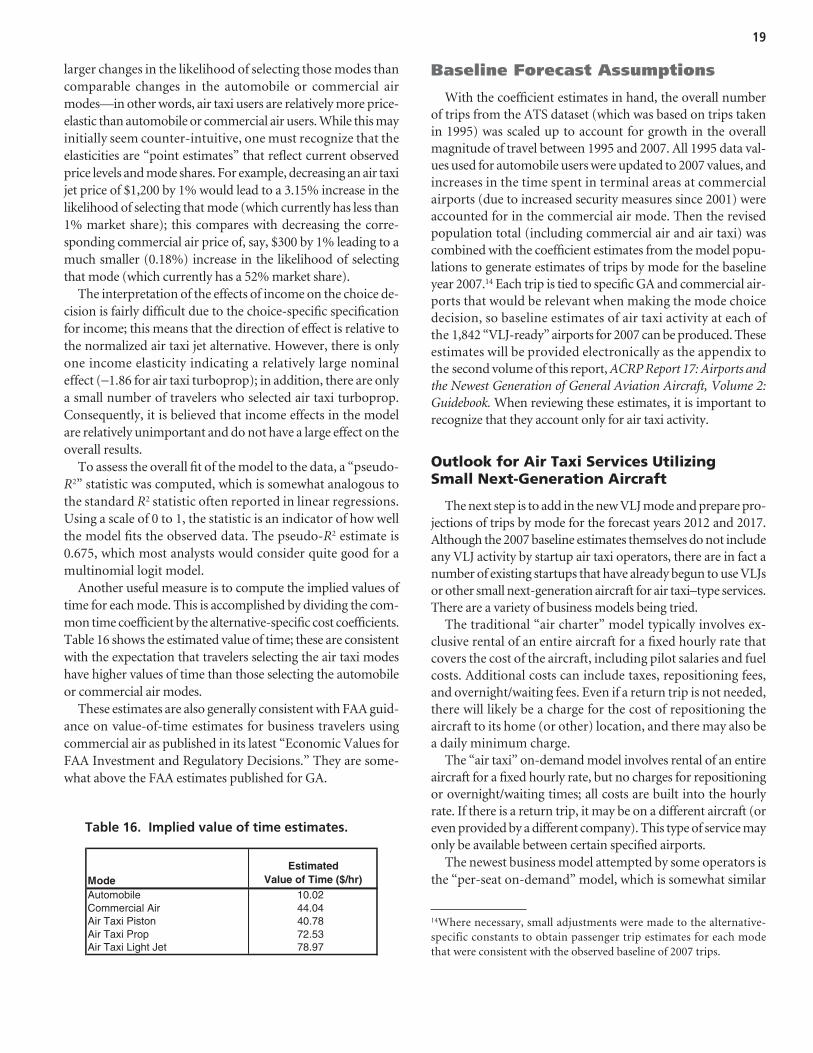
larger changes in the likelihood of selecting those modes thancomparable changes in the automobile or commercial airmodes—in other words, air taxi users are relatively more price-elastic than automobile or commercial air users. While this mayinitially seem counter-intuitive, one must recognize that theelasticities are “point estimates” that reflect current observedprice levels and mode shares. For example, decreasing an air taxijet price of $1,200 by 1% would lead to a 3.15% increase in thelikelihood of selecting that mode (which currently has less than1% market share); this compares with decreasing the corre-sponding commercial air price of, say, $300 by 1% leading to amuch smaller (0.18%) increase in the likelihood of selectingthat mode (which currently has a 52% market share).
The interpretation of the effects of income on the choice de-cision is fairly difficult due to the choice-specific specificationfor income; this means that the direction of effect is relative tothe normalized air taxi jet alternative. However, there is onlyone income elasticity indicating a relatively large nominaleffect (−1.86 for air taxi turboprop); in addition, there are onlya small number of travelers who selected air taxi turboprop.Consequently, it is believed that income effects in the modelare relatively unimportant and do not have a large effect on theoverall results.
To assess the overall fit of the model to the data, a “pseudo-R2” statistic was computed, which is somewhat analogous tothe standard R2 statistic often reported in linear regressions.Using a scale of 0 to 1, the statistic is an indicator of how wellthe model fits the observed data. The pseudo-R2 estimate is0.675, which most analysts would consider quite good for amultinomial logit model.
Another useful measure is to compute the implied values oftime for each mode. This is accomplished by dividing the com-mon time coefficient by the alternative-specific cost coefficients.Table 16 shows the estimated value of time; these are consistentwith the expectation that travelers selecting the air taxi modeshave higher values of time than those selecting the automobileor commercial air modes.
These estimates are also generally consistent with FAA guid-ance on value-of-time estimates for business travelers usingcommercial air as published in its latest “Economic Values forFAA Investment and Regulatory Decisions.” They are some-what above the FAA estimates published for GA.
Baseline Forecast Assumptions
With the coefficient estimates in hand, the overall numberof trips from the ATS dataset (which was based on trips takenin 1995) was scaled up to account for growth in the overallmagnitude of travel between 1995 and 2007. All 1995 data val-ues used for automobile users were updated to 2007 values, andincreases in the time spent in terminal areas at commercialairports (due to increased security measures since 2001) wereaccounted for in the commercial air mode. Then the revisedpopulation total (including commercial air and air taxi) wascombined with the coefficient estimates from the model popu-lations to generate estimates of trips by mode for the baselineyear 2007.14 Each trip is tied to specific GA and commercial air-ports that would be relevant when making the mode choicedecision, so baseline estimates of air taxi activity at each ofthe 1,842 “VLJ-ready” airports for 2007 can be produced. Theseestimates will be provided electronically as the appendix tothe second volume of this report, ACRP Report 17: Airports andthe Newest Generation of General Aviation Aircraft, Volume 2:Guidebook. When reviewing these estimates, it is important torecognize that they account only for air taxi activity.
Outlook for Air Taxi Services Utilizing Small Next-Generation Aircraft
The next step is to add in the new VLJ mode and prepare pro-jections of trips by mode for the forecast years 2012 and 2017.Although the 2007 baseline estimates themselves do not includeany VLJ activity by startup air taxi operators, there are in fact anumber of existing startups that have already begun to use VLJsor other small next-generation aircraft for air taxi–type services.There are a variety of business models being tried.
The traditional “air charter” model typically involves ex-clusive rental of an entire aircraft for a fixed hourly rate thatcovers the cost of the aircraft, including pilot salaries and fuelcosts. Additional costs can include taxes, repositioning fees,and overnight/waiting fees. Even if a return trip is not needed,there will likely be a charge for the cost of repositioning theaircraft to its home (or other) location, and there may also bea daily minimum charge.
The “air taxi” on-demand model involves rental of an entireaircraft for a fixed hourly rate, but no charges for repositioningor overnight/waiting times; all costs are built into the hourlyrate. If there is a return trip, it may be on a different aircraft (oreven provided by a different company). This type of service mayonly be available between certain specified airports.
The newest business model attempted by some operators isthe “per-seat on-demand” model, which is somewhat similar
19
ModeEstimated
Value of Time ($/hr)10.02Automobile44.04Commercial Air40.78Air Taxi Piston72.53Air Taxi Prop78.97Air Taxi Light Jet
Table 16. Implied value of time estimates.
14Where necessary, small adjustments were made to the alternative-specific constants to obtain passenger trip estimates for each modethat were consistent with the observed baseline of 2007 trips.
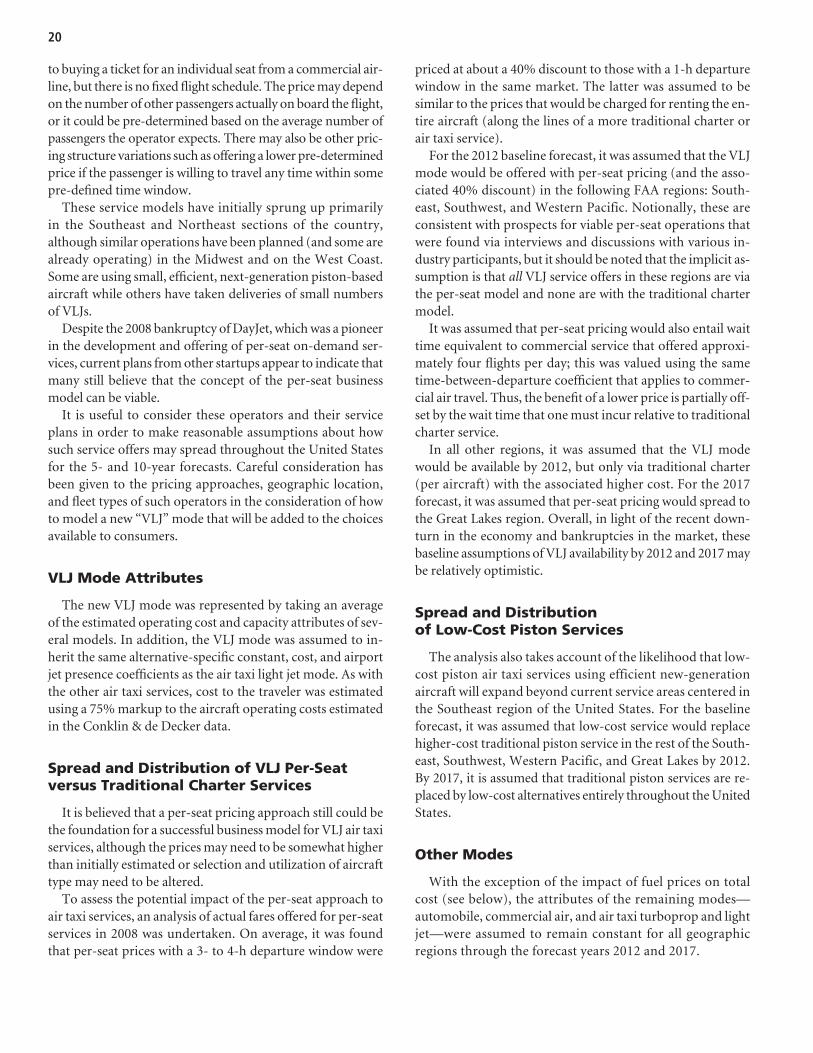
to buying a ticket for an individual seat from a commercial air-line, but there is no fixed flight schedule. The price may dependon the number of other passengers actually on board the flight,or it could be pre-determined based on the average number ofpassengers the operator expects. There may also be other pric-ing structure variations such as offering a lower pre-determinedprice if the passenger is willing to travel any time within somepre-defined time window.
These service models have initially sprung up primarilyin the Southeast and Northeast sections of the country, although similar operations have been planned (and some arealready operating) in the Midwest and on the West Coast.Some are using small, efficient, next-generation piston-basedaircraft while others have taken deliveries of small numbersof VLJs.
Despite the 2008 bankruptcy of DayJet, which was a pioneerin the development and offering of per-seat on-demand ser-vices, current plans from other startups appear to indicate thatmany still believe that the concept of the per-seat businessmodel can be viable.
It is useful to consider these operators and their serviceplans in order to make reasonable assumptions about howsuch service offers may spread throughout the United Statesfor the 5- and 10-year forecasts. Careful consideration hasbeen given to the pricing approaches, geographic location,and fleet types of such operators in the consideration of howto model a new “VLJ” mode that will be added to the choicesavailable to consumers.
VLJ Mode Attributes
The new VLJ mode was represented by taking an averageof the estimated operating cost and capacity attributes of sev-eral models. In addition, the VLJ mode was assumed to in-herit the same alternative-specific constant, cost, and airportjet presence coefficients as the air taxi light jet mode. As withthe other air taxi services, cost to the traveler was estimatedusing a 75% markup to the aircraft operating costs estimatedin the Conklin & de Decker data.
Spread and Distribution of VLJ Per-Seatversus Traditional Charter Services
It is believed that a per-seat pricing approach still could bethe foundation for a successful business model for VLJ air taxiservices, although the prices may need to be somewhat higherthan initially estimated or selection and utilization of aircrafttype may need to be altered.
To assess the potential impact of the per-seat approach toair taxi services, an analysis of actual fares offered for per-seatservices in 2008 was undertaken. On average, it was foundthat per-seat prices with a 3- to 4-h departure window were
priced at about a 40% discount to those with a 1-h departurewindow in the same market. The latter was assumed to besimilar to the prices that would be charged for renting the en-tire aircraft (along the lines of a more traditional charter orair taxi service).
For the 2012 baseline forecast, it was assumed that the VLJmode would be offered with per-seat pricing (and the asso-ciated 40% discount) in the following FAA regions: South-east, Southwest, and Western Pacific. Notionally, these areconsistent with prospects for viable per-seat operations thatwere found via interviews and discussions with various in-dustry participants, but it should be noted that the implicit as-sumption is that all VLJ service offers in these regions are viathe per-seat model and none are with the traditional chartermodel.
It was assumed that per-seat pricing would also entail waittime equivalent to commercial service that offered approxi-mately four flights per day; this was valued using the sametime-between-departure coefficient that applies to commer-cial air travel. Thus, the benefit of a lower price is partially off-set by the wait time that one must incur relative to traditionalcharter service.
In all other regions, it was assumed that the VLJ modewould be available by 2012, but only via traditional charter(per aircraft) with the associated higher cost. For the 2017forecast, it was assumed that per-seat pricing would spread tothe Great Lakes region. Overall, in light of the recent down-turn in the economy and bankruptcies in the market, thesebaseline assumptions of VLJ availability by 2012 and 2017 maybe relatively optimistic.
Spread and Distribution of Low-Cost Piston Services
The analysis also takes account of the likelihood that low-cost piston air taxi services using efficient new-generationaircraft will expand beyond current service areas centered inthe Southeast region of the United States. For the baselineforecast, it was assumed that low-cost service would replacehigher-cost traditional piston service in the rest of the South-east, Southwest, Western Pacific, and Great Lakes by 2012.By 2017, it is assumed that traditional piston services are re-placed by low-cost alternatives entirely throughout the UnitedStates.
Other Modes
With the exception of the impact of fuel prices on totalcost (see below), the attributes of the remaining modes—automobile, commercial air, and air taxi turboprop and lightjet—were assumed to remain constant for all geographic regions through the forecast years 2012 and 2017.
20
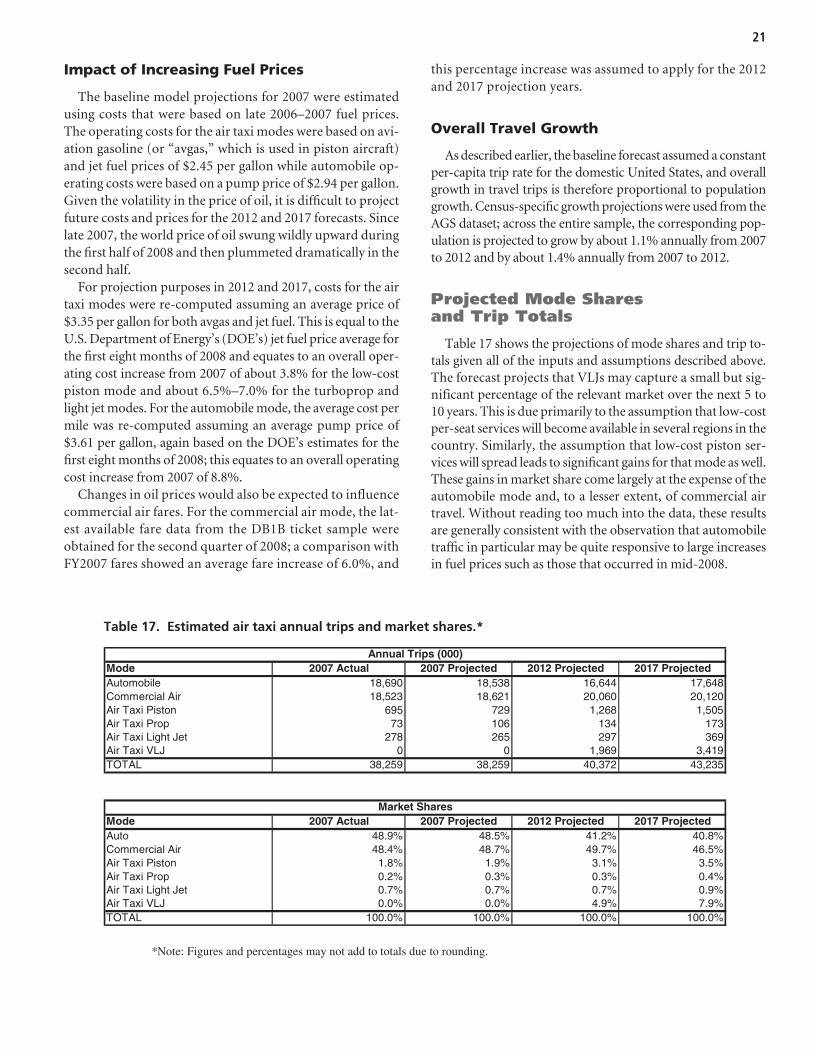
Impact of Increasing Fuel Prices
The baseline model projections for 2007 were estimatedusing costs that were based on late 2006–2007 fuel prices.The operating costs for the air taxi modes were based on avi-ation gasoline (or “avgas,” which is used in piston aircraft)and jet fuel prices of $2.45 per gallon while automobile op-erating costs were based on a pump price of $2.94 per gallon.Given the volatility in the price of oil, it is difficult to projectfuture costs and prices for the 2012 and 2017 forecasts. Sincelate 2007, the world price of oil swung wildly upward duringthe first half of 2008 and then plummeted dramatically in thesecond half.
For projection purposes in 2012 and 2017, costs for the airtaxi modes were re-computed assuming an average price of$3.35 per gallon for both avgas and jet fuel. This is equal to theU.S. Department of Energy’s (DOE’s) jet fuel price average forthe first eight months of 2008 and equates to an overall oper-ating cost increase from 2007 of about 3.8% for the low-costpiston mode and about 6.5%–7.0% for the turboprop andlight jet modes. For the automobile mode, the average cost permile was re-computed assuming an average pump price of$3.61 per gallon, again based on the DOE’s estimates for thefirst eight months of 2008; this equates to an overall operatingcost increase from 2007 of 8.8%.
Changes in oil prices would also be expected to influencecommercial air fares. For the commercial air mode, the lat-est available fare data from the DB1B ticket sample wereobtained for the second quarter of 2008; a comparison withFY2007 fares showed an average fare increase of 6.0%, and
this percentage increase was assumed to apply for the 2012and 2017 projection years.
Overall Travel Growth
As described earlier, the baseline forecast assumed a constantper-capita trip rate for the domestic United States, and overallgrowth in travel trips is therefore proportional to populationgrowth. Census-specific growth projections were used from theAGS dataset; across the entire sample, the corresponding pop-ulation is projected to grow by about 1.1% annually from 2007to 2012 and by about 1.4% annually from 2007 to 2012.
Projected Mode Shares and Trip Totals
Table 17 shows the projections of mode shares and trip to-tals given all of the inputs and assumptions described above.The forecast projects that VLJs may capture a small but sig-nificant percentage of the relevant market over the next 5 to10 years. This is due primarily to the assumption that low-costper-seat services will become available in several regions in thecountry. Similarly, the assumption that low-cost piston ser-vices will spread leads to significant gains for that mode as well.These gains in market share come largely at the expense of theautomobile mode and, to a lesser extent, of commercial airtravel. Without reading too much into the data, these resultsare generally consistent with the observation that automobiletraffic in particular may be quite responsive to large increasesin fuel prices such as those that occurred in mid-2008.
21
detcejorP7102detcejorP2102detcejorP7002lautcA7002edoM846,71446,61835,81096,81elibomotuA021,02060,02126,81325,81riAlaicremmoC505,1862,1927596notsiPixaTriA37143160137porPixaTriA963792562872teJthgiLixaTriA914,3969,100JLVixaTriA532,34273,04952,83952,83LATOT
detcejorP7102detcejorP2102detcejorP7002lautcA7002edoM%8.04%2.14%5.84%9.84otuA%5.64%7.94%7.84%4.84riAlaicremmoC%5.3%1.3%9.1%8.1notsiPixaTriA%4.0%3.0%3.0%2.0porPixaTriA%9.0%7.0%7.0%7.0teJthgiLixaTriA%9.7%9.4%0.0%0.0JLVixaTriA%0.001%0.001%0.001%0.001LATOT
Annual Trips (000)
Market Shares
*Note: Figures and percentages may not add to totals due to rounding.
Table 17. Estimated air taxi annual trips and market shares.*
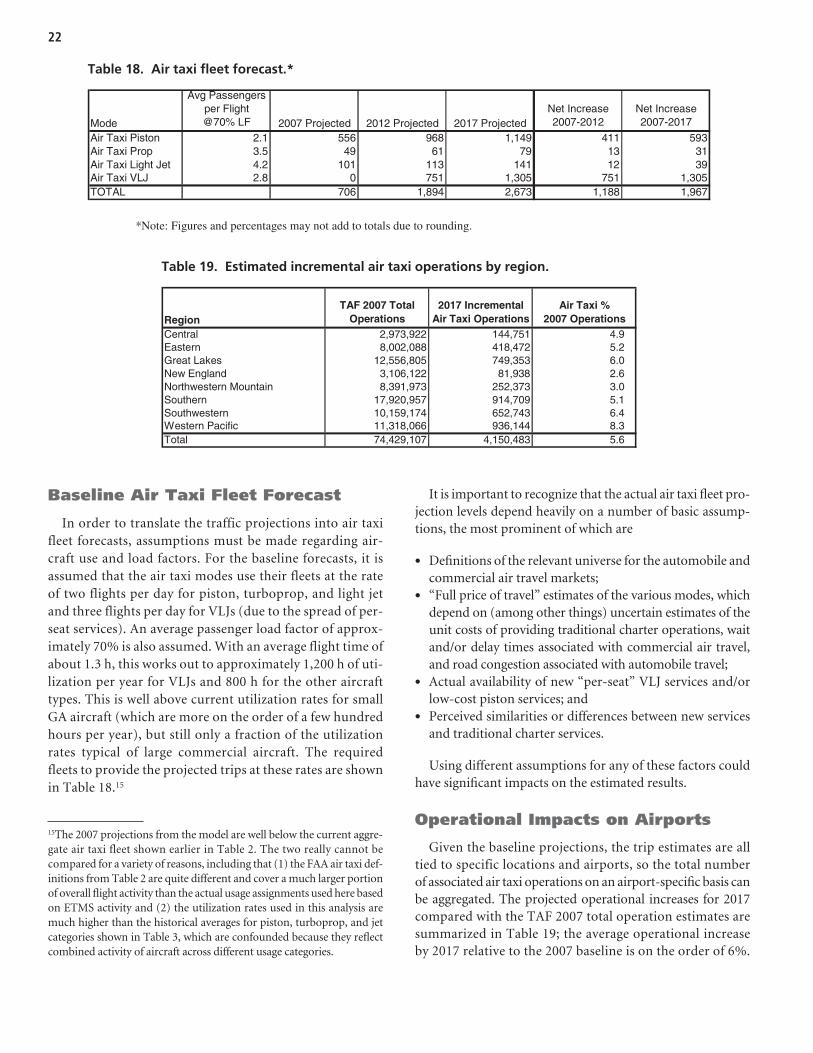
Baseline Air Taxi Fleet Forecast
In order to translate the traffic projections into air taxifleet forecasts, assumptions must be made regarding air-craft use and load factors. For the baseline forecasts, it is assumed that the air taxi modes use their fleets at the rateof two flights per day for piston, turboprop, and light jetand three flights per day for VLJs (due to the spread of per-seat services). An average passenger load factor of approx-imately 70% is also assumed. With an average flight time ofabout 1.3 h, this works out to approximately 1,200 h of uti-lization per year for VLJs and 800 h for the other aircrafttypes. This is well above current utilization rates for smallGA aircraft (which are more on the order of a few hundredhours per year), but still only a fraction of the utilizationrates typical of large commercial aircraft. The requiredfleets to provide the projected trips at these rates are shownin Table 18.15
It is important to recognize that the actual air taxi fleet pro-jection levels depend heavily on a number of basic assump-tions, the most prominent of which are
• Definitions of the relevant universe for the automobile andcommercial air travel markets;
• “Full price of travel” estimates of the various modes, whichdepend on (among other things) uncertain estimates of theunit costs of providing traditional charter operations, waitand/or delay times associated with commercial air travel,and road congestion associated with automobile travel;
• Actual availability of new “per-seat” VLJ services and/orlow-cost piston services; and
• Perceived similarities or differences between new servicesand traditional charter services.
Using different assumptions for any of these factors couldhave significant impacts on the estimated results.
Operational Impacts on Airports
Given the baseline projections, the trip estimates are alltied to specific locations and airports, so the total numberof associated air taxi operations on an airport-specific basis canbe aggregated. The projected operational increases for 2017compared with the TAF 2007 total operation estimates aresummarized in Table 19; the average operational increaseby 2017 relative to the 2007 baseline is on the order of 6%.
22
Mode
Avg Passengers per Flight@70% LF 2007 Projected 2012 Projected 2017 Projected
Net Increase2007-2012
Net Increase2007-2017
Air Taxi Piston 2.1 556 968 1,149 411 593Air Taxi Prop 3.5 49 61 79 13 31Air Taxi Light Jet 4.2 101 113 141 12 39Air Taxi VLJ 2.8 0 751 1,305 751 1,305
769,1881,1376,2498,1607LATOT
*Note: Figures and percentages may not add to totals due to rounding.
Table 18. Air taxi fleet forecast.*
RegionTAF 2007 Total
Operations2017 Incremental
Air Taxi OperationsAir Taxi %
2007 Operations9.4157,441229,379,2lartneC2.5274,814880,200,8nretsaE0.6353,947508,655,21sekaLtaerG6.2839,18221,601,3dnalgnEweN0.3373,252379,193,8niatnuoMnretsewhtroN1.5907,419759,029,71nrehtuoS4.6347,256471,951,01nretsewhtuoS3.8441,639660,813,11cificaPnretseW6.5384,051,4701,924,47latoT
Table 19. Estimated incremental air taxi operations by region.
15The 2007 projections from the model are well below the current aggre-gate air taxi fleet shown earlier in Table 2. The two really cannot becompared for a variety of reasons, including that (1) the FAA air taxi def-initions from Table 2 are quite different and cover a much larger portionof overall flight activity than the actual usage assignments used here basedon ETMS activity and (2) the utilization rates used in this analysis aremuch higher than the historical averages for piston, turboprop, and jetcategories shown in Table 3, which are confounded because they reflectcombined activity of aircraft across different usage categories.
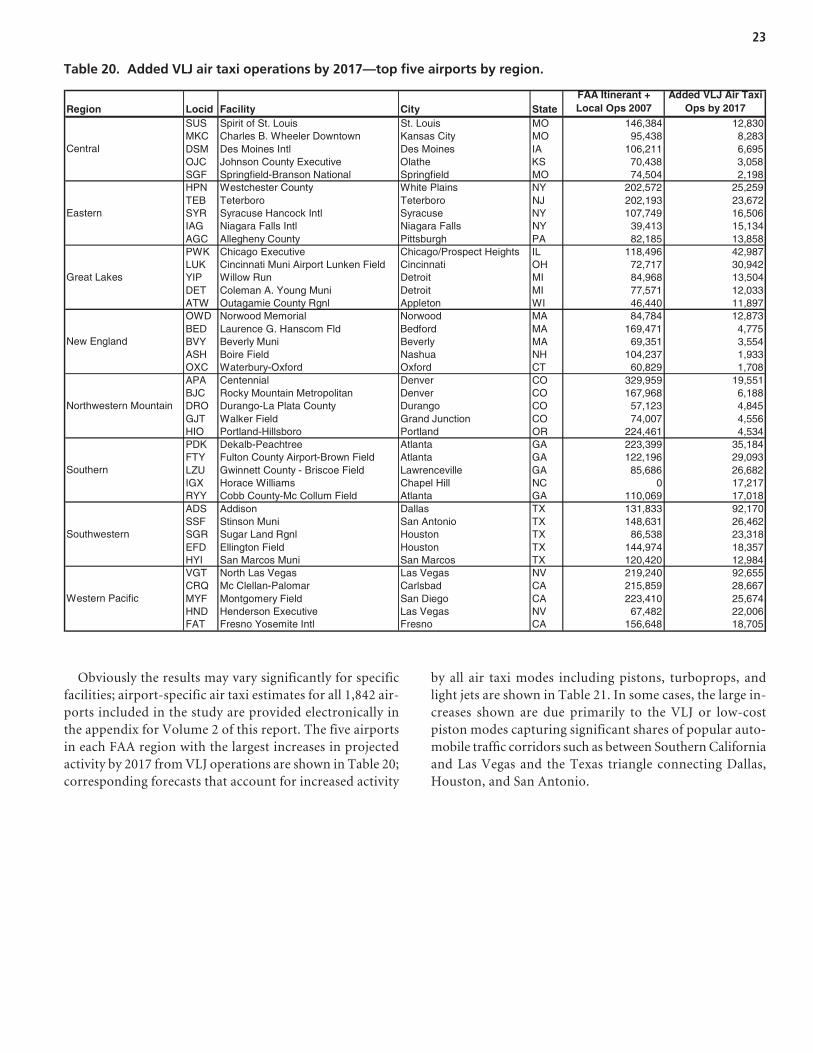
Obviously the results may vary significantly for specificfacilities; airport-specific air taxi estimates for all 1,842 air-ports included in the study are provided electronically inthe appendix for Volume 2 of this report. The five airportsin each FAA region with the largest increases in projectedactivity by 2017 from VLJ operations are shown in Table 20;corresponding forecasts that account for increased activity
by all air taxi modes including pistons, turboprops, andlight jets are shown in Table 21. In some cases, the large in-creases shown are due primarily to the VLJ or low-cost piston modes capturing significant shares of popular auto-mobile traffic corridors such as between Southern Californiaand Las Vegas and the Texas triangle connecting Dallas,Houston, and San Antonio.
23
etatSytiCytilicaFdicoLnoigeRFAA Itinerant + Local Ops 2007
Added VLJ Air Taxi Ops by 2017
038,21483,641OMSt. LouisSpirit of St. LouisSUSMKC Charles B. Wheeler Downtown Kansas City MO 95,438 8,283
596,6112,601AIsenioMseDltnIsenioMseDMSDOJC Johnson County Executive Olathe KS 70,438 3,058SGF Springfield-Branson National Springfield MO 74,504 2,198HPN Westchester County White Plains NY 202,572 25,259
276,32391,202JNorobreteTorobreteTBETSYR Syracuse Hancock Intl Syracuse NY 107,749 16,506
431,51314,93YNsllaFaragaiNltnIsllaFaragaiNGAIAGC Allegheny County Pittsburgh PA 82,185 13,858PWK Chicago Executive Chicago/Prospect Heights IL 118,496 42,987LUK Cincinnati Muni Airport Lunken Field Cincinnati OH 72,717 30,942
405,31869,48IMtiorteDnuRwolliWPIYDET Coleman A. Young Muni Detroit MI 77,571 12,033ATW Outagamie County Rgnl Appleton WI 46,440 11,897OWD Norwood Memorial Norwood MA 84,784 12,873BED Laurence G. Hanscom Fld Bedford MA 169,471 4,775
455,3153,96AMylreveBinuMylreveBYVB339,1732,401HNauhsaNdleiFerioBHSA
OXC Waterbury-Oxford Oxford CT 60,829 1,708155,91959,923OCrevneDlainnetneCAPA
BJC Rocky Mountain Metropolitan Denver CO 167,968 6,188DRO Durango-La Plata County Durango CO 57,123 4,845
655,4700,47OCnoitcnuJdnarGdleiFreklaWTJGHIO Portland-Hillsboro Portland OR 224,461 4,534PDK Dekalb-Peachtree Atlanta GA 223,399 35,184FTY Fulton County Airport-Brown Field Atlanta GA 122,196 29,093LZU Gwinnett County - Briscoe Field Lawrenceville GA 85,686 26,682
712,710CNlliHlepahCsmailliWecaroHXGIRYY Cobb County-Mc Collum Field Atlanta GA 110,069 17,018
071,29338,131XTsallaDnosiddASDA264,62136,841XToinotnAnaSinuMnosnitSFSS813,32835,68XTnotsuoHlngRdnaLraguSRGS753,81479,441XTnotsuoHdleiFnotgnillEDFE
HYI San Marcos Muni San Marcos TX 120,420 12,984556,29042,912VNsageVsaLsageVsaLhtroNTGV
CRQ Mc Clellan-Palomar Carlsbad CA 215,859 28,667MYF Montgomery Field San Diego CA 223,410 25,674HND Henderson Executive Las Vegas NV 67,482 22,006FAT Fresno Yosemite Intl Fresno CA 156,648 18,705
Northwestern Mountain
Southern
Southwestern
Western Pacific
Central
Eastern
Great Lakes
New England
Table 20. Added VLJ air taxi operations by 2017—top five airports by region.
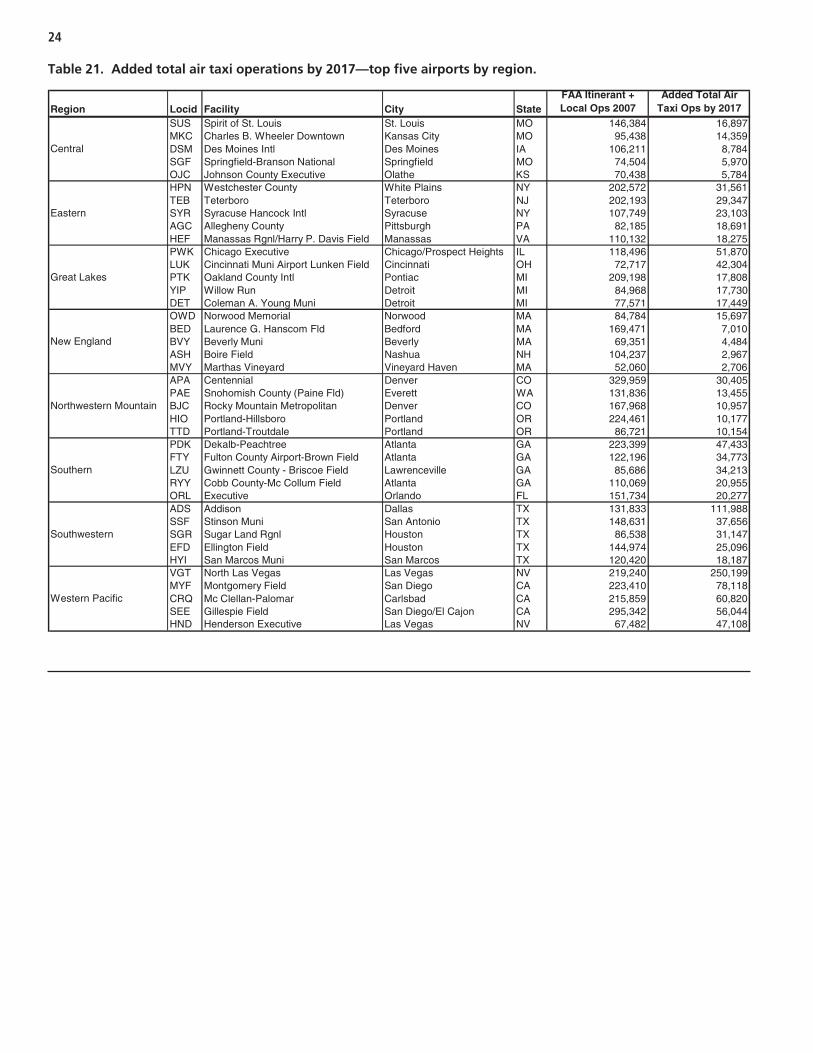
24
etatSytiCytilicaFdicoLnoigeRFAA Itinerant + Local Ops 2007
Added Total Air Taxi Ops by 2017
798,61483,641OMSt. LouisSpirit of St. LouisSUSMKC Charles B. Wheeler Downtown Kansas City MO 95,438 14,359
487,8112,601AIsenioMseDltnIsenioMseDMSDSGF Springfield-Branson National Springfield MO 74,504 5,970OJC Johnson County Executive Olathe KS 70,438 5,784HPN Westchester County White Plains NY 202,572 31,561
743,92391,202JNorobreteTorobreteTBETSYR Syracuse Hancock Intl Syracuse NY 107,749 23,103AGC Allegheny County Pittsburgh PA 82,185 18,691HEF Manassas Rgnl/Harry P. Davis Field Manassas VA 110,132 18,275PWK Chicago Executive Chicago/Prospect Heights IL 118,496 51,870LUK Cincinnati Muni Airport Lunken Field Cincinnati OH 72,717 42,304PTK Oakland County Intl Pontiac MI 209,198 17,808
037,71869,48IMtiorteDnuRwolliWPIYDET Coleman A. Young Muni Detroit MI 77,571 17,449OWD Norwood Memorial Norwood MA 84,784 15,697BED Laurence G. Hanscom Fld Bedford MA 169,471 7,010
484,4153,96AMylreveBinuMylreveBYVB769,2732,401HNauhsaNdleiFerioBHSA
MVY Marthas Vineyard Vineyard Haven MA 52,060 2,706504,03959,923OCrevneDlainnetneCAPA
PAE Snohomish County (Paine Fld) Everett WA 131,836 13,455BJC Rocky Mountain Metropolitan Denver CO 167,968 10,957HIO Portland-Hillsboro Portland OR 224,461 10,177TTD Portland-Troutdale Portland OR 86,721 10,154PDK Dekalb-Peachtree Atlanta GA 223,399 47,433FTY Fulton County Airport-Brown Field Atlanta GA 122,196 34,773LZU Gwinnett County - Briscoe Field Lawrenceville GA 85,686 34,213RYY Cobb County-Mc Collum Field Atlanta GA 110,069 20,955
772,02437,151LFodnalrOevitucexELRO889,111338,131XTsallaDnosiddASDA656,73136,841XToinotnAnaSinuMnosnitSFSS741,13835,68XTnotsuoHlngRdnaLraguSRGS690,52479,441XTnotsuoHdleiFnotgnillEDFE
HYI San Marcos Muni San Marcos TX 120,420 18,187991,052042,912VNsageVsaLsageVsaLhtroNTGV
MYF Montgomery Field San Diego CA 223,410 78,118CRQ Mc Clellan-Palomar Carlsbad CA 215,859 60,820
440,65243,592ACnojaClE/ogeiDnaSdleiFeipselliGEESHND Henderson Executive Las Vegas NV 67,482 47,108
Northwestern Mountain
Southern
Southwestern
Western Pacific
Central
Eastern
Great Lakes
New England
Table 21. Added total air taxi operations by 2017—top five airports by region.
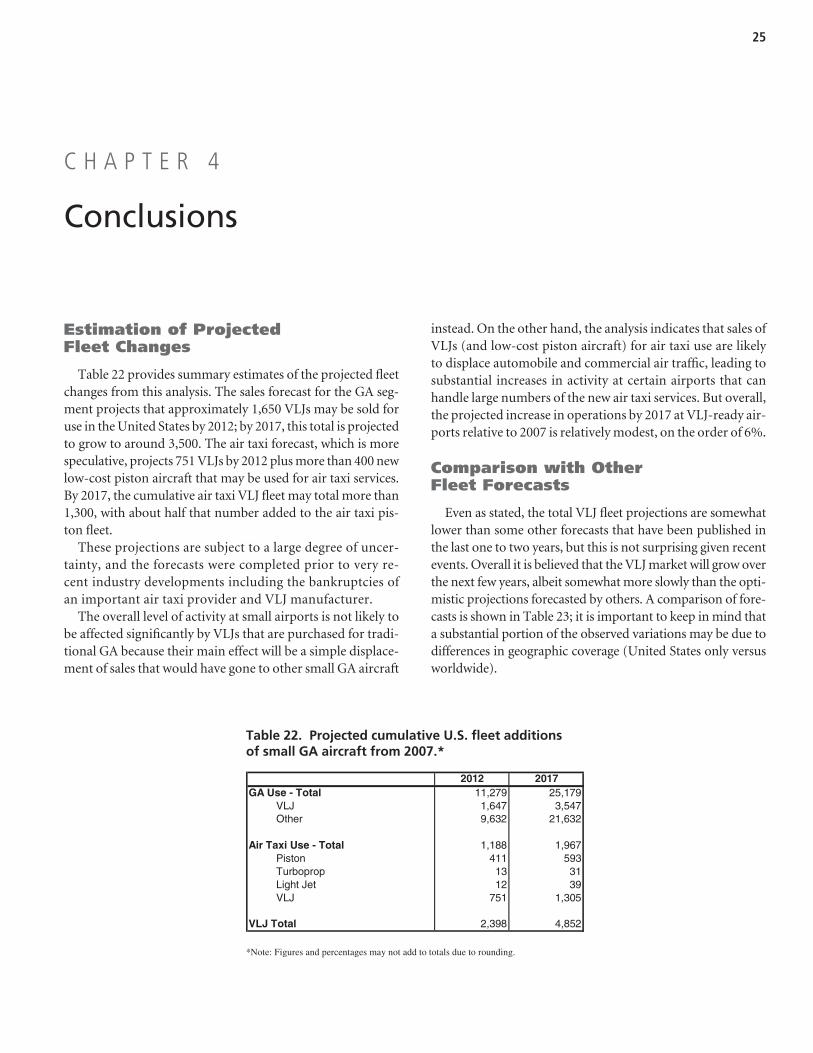
25
Estimation of Projected Fleet Changes
Table 22 provides summary estimates of the projected fleetchanges from this analysis. The sales forecast for the GA seg-ment projects that approximately 1,650 VLJs may be sold foruse in the United States by 2012; by 2017, this total is projectedto grow to around 3,500. The air taxi forecast, which is morespeculative, projects 751 VLJs by 2012 plus more than 400 newlow-cost piston aircraft that may be used for air taxi services.By 2017, the cumulative air taxi VLJ fleet may total more than1,300, with about half that number added to the air taxi pis-ton fleet.
These projections are subject to a large degree of uncer-tainty, and the forecasts were completed prior to very re-cent industry developments including the bankruptcies ofan important air taxi provider and VLJ manufacturer.
The overall level of activity at small airports is not likely tobe affected significantly by VLJs that are purchased for tradi-tional GA because their main effect will be a simple displace-ment of sales that would have gone to other small GA aircraft
instead. On the other hand, the analysis indicates that sales ofVLJs (and low-cost piston aircraft) for air taxi use are likelyto displace automobile and commercial air traffic, leading tosubstantial increases in activity at certain airports that canhandle large numbers of the new air taxi services. But overall,the projected increase in operations by 2017 at VLJ-ready air-ports relative to 2007 is relatively modest, on the order of 6%.
Comparison with Other Fleet Forecasts
Even as stated, the total VLJ fleet projections are somewhatlower than some other forecasts that have been published inthe last one to two years, but this is not surprising given recentevents. Overall it is believed that the VLJ market will grow overthe next few years, albeit somewhat more slowly than the opti-mistic projections forecasted by others. A comparison of fore-casts is shown in Table 23; it is important to keep in mind thata substantial portion of the observed variations may be due todifferences in geographic coverage (United States only versusworldwide).
C H A P T E R 4
Conclusions
2012 2017GA Use - Total 11,279 25,179
745,3746,1JLV236,12236,9rehtO
Air Taxi Use - Total 1,188 1,967395114notsiP1331porpobruT9321teJthgiL503,1157JLV
VLJ Total 2,398 4,852
*Note: Figures and percentages may not add to totals due to rounding.
Table 22. Projected cumulative U.S. fleet additions of small GA aircraft from 2007.*
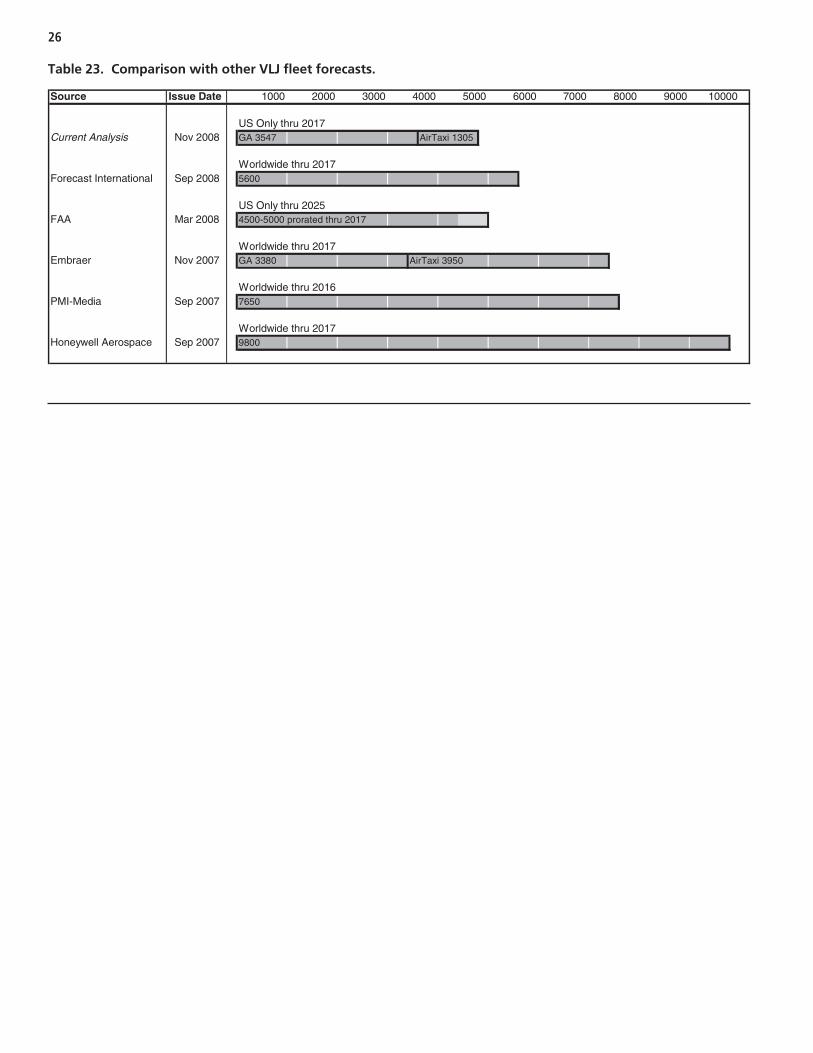
26
Source Issue Date
US Only thru 2017Current Analysis Nov 2008 5031ixaTriA7453AG
Worldwide thru 2017Forecast International Sep 2008 5600
US Only thru 2025FAA Mar 2008 4500-5000 prorated thru 2017
Worldwide thru 2017Embraer Nov 2007 0593ixaTriA0833AG
Worldwide thru 2016PMI-Media Sep 2007 7650
Worldwide thru 2017Honeywell Aerospace Sep 2007 9800
9000 100005000 6000 7000 80001000 2000 3000 4000
Table 23. Comparison with other VLJ fleet forecasts.

Abbreviations and acronyms used without definitions in TRB publications:
AAAE American Association of Airport ExecutivesAASHO American Association of State Highway OfficialsAASHTO American Association of State Highway and Transportation OfficialsACI–NA Airports Council International–North AmericaACRP Airport Cooperative Research ProgramADA Americans with Disabilities ActAPTA American Public Transportation AssociationASCE American Society of Civil EngineersASME American Society of Mechanical EngineersASTM American Society for Testing and MaterialsATA Air Transport AssociationATA American Trucking AssociationsCTAA Community Transportation Association of AmericaCTBSSP Commercial Truck and Bus Safety Synthesis ProgramDHS Department of Homeland SecurityDOE Department of EnergyEPA Environmental Protection AgencyFAA Federal Aviation AdministrationFHWA Federal Highway AdministrationFMCSA Federal Motor Carrier Safety AdministrationFRA Federal Railroad AdministrationFTA Federal Transit AdministrationIEEE Institute of Electrical and Electronics EngineersISTEA Intermodal Surface Transportation Efficiency Act of 1991ITE Institute of Transportation EngineersNASA National Aeronautics and Space AdministrationNASAO National Association of State Aviation OfficialsNCFRP National Cooperative Freight Research ProgramNCHRP National Cooperative Highway Research ProgramNHTSA National Highway Traffic Safety AdministrationNTSB National Transportation Safety BoardSAE Society of Automotive EngineersSAFETEA-LU Safe, Accountable, Flexible, Efficient Transportation Equity Act: A Legacy for Users (2005)TCRP Transit Cooperative Research ProgramTEA-21 Transportation Equity Act for the 21st Century (1998)TRB Transportation Research BoardTSA Transportation Security AdministrationU.S.DOT United States Department of Transportation